Embed Size (px)
Citation preview
Contents
1
Page
Foreword 3
Executive Summary 5
Chapter 1 Background and Study Terms of Reference 10
1.1 Background 10
1.2 Objectives of this Report 10
1.3 Approach and Method 11
1.4 Report Structure 12
Chapter 2 CDB Strategies: Background and Guidelines 14
2.1 Introduction 14
2.2 “Report of the Task Force on the Integration of
Local Government and Local Development”,
August 1998 14
2.3 ”Preparing the Ground” Report, April 1999 18
2.4 “A Shared Vision” Report, May 2000 20
2.5 Key Messages 26
Chapter 3 CDB Strategies: Overview 27
3.1 Introduction 27
3.2 The Strategy Publications 27
3.3 Structure, Scope and Coverage of Strategies 29
3.4 Strategy Preparation Process 30
3.5 Key Messages 30
Chapter 4 CDB Strategies: Services Audits, Socio-Economic
Profiles and SWOT Analyses 31
4.1 Introduction 31
4.2 Audits of Service Provision 31
4.3 Analysis Socio-Economic Situation 32
4.4 Summary of SWOT 34
4.5 Regional or Other Patterns 35
4.6 Key Messages 35
2
Chapter 5 CDB Strategies: Vision Statements, Goals and
Objectives 37
5.1 Introduction 37
5.2 Vision Statements 38
5.3 Goals and Objectives 39
5.4 Development Options 42
5.5 Key Messages 43
Chapter 6 CDB Strategies: Proposed Actions 44
6.1 Introduction 44
6.2 Number and Nature of Actions 44
6.3 Actions by Sector 46
6.4 Actions Targeted at Social Inclusion 48
6.5 Type of Actions 50
6.6 Actions by Agency 53
6.7 Actions by Lead Department 55
6.8 Timing of the Actions 66
6.9 Issues Identified in Regional Sections 66
6.10 Key Messages 69
Chapter 7 CDB Strategies: Delivery Mechanisms 70
7.1 Introduction 70
7.2 Monitoring 70
7.3 Targets and Indicators 71
7.4 Evaluation 73
7.5 Proposals for Service Integration 74
7.6 Costs of Implementation 75
7.7 Key Messages 75
Chapter 8 Conclusions and Implications 76
8.1 Introduction 76
8.2 Overview 76
8.3 Challenges Ahead for CDBs 77
8.4 Implications for the Task Force 80
8.5 Overall Conclusions 81
Annexes 83
As chairman of the Interdepartmental Task Force, which oversees the County/City
Development Boards (CDBs) I am pleased to pen this foreword to the review of the Boards’
Strategies by Fitzpatrick Associates and ERM Ireland Ltd. The Task Force, which continues in
existence, has endorsed this review..
The County/City Development Boards were established in 2000 to bring about the more co-
ordinated delivery of public and local development services at local level. A core function for
the Boards was to draw up and oversee the implementation of an agreed Strategy for the
Economic, Social and Cultural Development of their counties and cities. The Strategies, which
were published in 2002, are a key mechanism by which the integration of services at local level
is to be achieved. Critically, all the actors involved are now expected to play their part in
implementing the actions flowing from the Strategies. This is especially so as regards those
actions aimed at better co-ordination of services.
The review gives an easy to read overview of the 34 CDB Strategies, as well as distilling the
key messages in the Strategies for Government Departments, State and local development
agencies. It also makes a number of recommendations for the Task Force and the CDBs in
relation in particular to better integration of public and local development services at local
level. These have been accepted by the Task Force. It is now up to all the agencies at national
and local level to deliver on these proposals.
Minister for the Environment and Local Government
Foreword
3

Acronyms
• ADM – Area Development Management• BE – Bus Eireann• BIM – Bord Iascaigh Mhara• CCC – County/City Childcare Committee• CDB – County/City Development Board• CEB – County Enterprise Board• COFARD – Council for Forest Research & Development• CPA – Combat Poverty Agency• DCE – Directors of Community and Enterprise• DSFA – Department of Social and Family Affairs• EA – Equality Authority• EI – Enterprise Ireland• FÁS – Foras Áiseanna Saothair• FB – Fisheries Board• GIS – Geographical Information Service• HB – Health Boards• IBEC – Irish Business and Employers Confederation• ICT - Information Communication Technology• IDA –Industrial Development Authority• IE – Iarnrod Eireann• IT – Information Technology• LA – Local Authority• NDP – National Development Plan • NRA – National Roads Authority• NUTS – Nomenclature for Territorial Strategic Units• PWS – Probation and Welfare service• RTA – Regional Tourism Authorities • SD – Shannon Development• SFADCo – Shannon Free Airport Development Company• SIM – Social Inclusion Measures• SPC – Strategic Policy Committee• SPGGDA – Strategic Planning Guidelines for the Greater Dublin Area• SRUNA – Sustainable Recreational Use of Natural Assets• SWOT – Strengths Weaknesses Opportunities Threats• TLC – Third Level Colleges• VEC – Vocational and Educational Committee• WDC – Western Development Commission
4
5
Integrating Public Services
1. The standard of public service delivery has a major effect on
people’s quality of life. As Government becomes increasingly
complex, achieving co-ordination and integration across different
public and publicly funded services is a key challenge.
Governments everywhere face the issue of providing to their
citizens what has become known as “joined-up” government.
There is no single or simple solution to this problem. However
public service organisations are configured, and whatever the
extent to which organisations are centralised or devolved, issues
about institutional boundaries and relationships remain.
2. In Ireland, more co-ordinated public and local development
service delivery faces particular challenges. The Interdepartmental
Task Force on the Integration of Local Government and Local
Development Systems, which originally reported in 1998, stated
that “whatever about problems of policy co-ordination at the national
level, the delivery of services and the shaping of objectives and strategies
at ground level is where the absence of co-ordination is most felt. In
I reland these problems are probably more acute than in other
jurisdictions, due to the relatively narrow range of functions entrusted to
the local government system” .
3. Coupled with the relatively narrow range of Irish local
government is the overall nature of the Irish public administration
system. This system involves a series of separate national
Government Departments and their implementing agencies
structured on a relatively “vertical” basis, often without formal
mechanisms for integration of their services as these affect the
citizen.
What are the County/City Development Boards?
4. To address the issue of more co-ordinated public and local
development services, the Interdepartmental Task Forc e
recommended establishment of County/City Development
B o a rds (CDBs). The Task Force initially focused on local
government and local development services (Area Partnerships,
LEADER Groups and County/City Enterprise Boards), but
subsequently broadened the model to include all public (and
publicly funded) services delivered locally.
Executive Summary
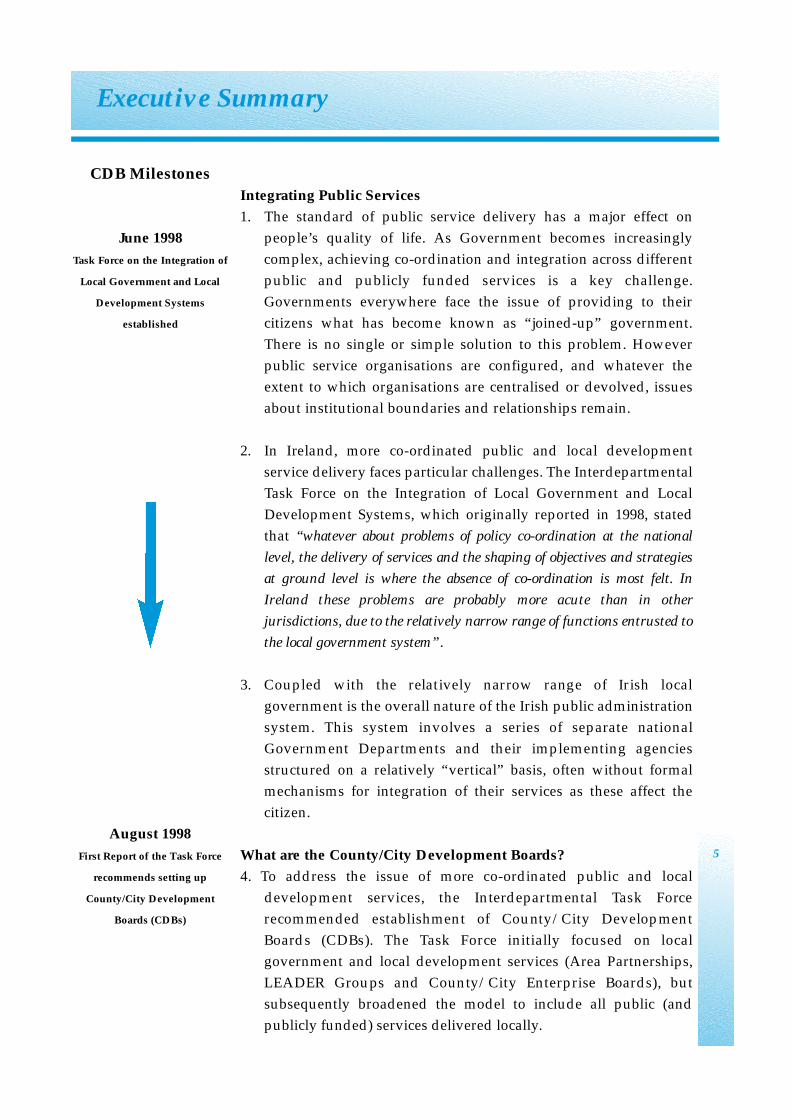
CDB Milestones
June 1998
Task Force on the Integration of
Local Government and Local
Development Systems
established
August 1998
First Report of the Task Force
recommends setting up
County/City Development
Boards (CDBs)
6
5. The CDBs are Boards set up in each county and city are a .
Established in 2000, there are 34 Boards in all. They involve
representatives from the four key sectors of local government,
local development, the social partners, and State agencies. The
Boards are chaired by local authority elected members, and are
serviced by Directors of Community and Enterprise and their staff.
The Director of Community and Enterprise is a new senior
position within county and city councils.
6. The core function of the Boards is to draw up and oversee the
implementation of an agreed “Shared Vision” or Strategy for their
respective counties and cities. “Vision” refers to a view of how the
area involved is to develop economically, socially and culturally
over a ten-year horizon, and what actions are needed to achieve
this. “Shared” reflects the fact that this vision is to be agreed
between all the individual organisations on the local CDB.
7. The CDB Strategies are the key vehicles through which improved
local service co-ordination is to be achieved. The Strategies are not
seen as a panacea for the complex issue of “joined-up”
government in Ireland at local level. However, they are a major
new government initiative to address the issue at local level.
Preparing County/City Development Board Strategies
8. The CDB model involves the various agencies represented on the
Board coming together, agreeing a view on how the county/city
should develop, and identifying a series of practical actions to
bring this about. Once this is agreed, the Boards will then oversee
implementation. While the Boards are not themselves
implementing agencies, the Strategies are to be implemented by
the partner organisations around the CDB table.
9. Over the past two years, all Boards have been working on the
preparation of the new Strategies for their areas. This involved
very extensive input by hundreds of Board members, and by
thousands of people on various sub-groups and other committees
a round the country. It has also involved very significant
nationwide consultation and research at local level.
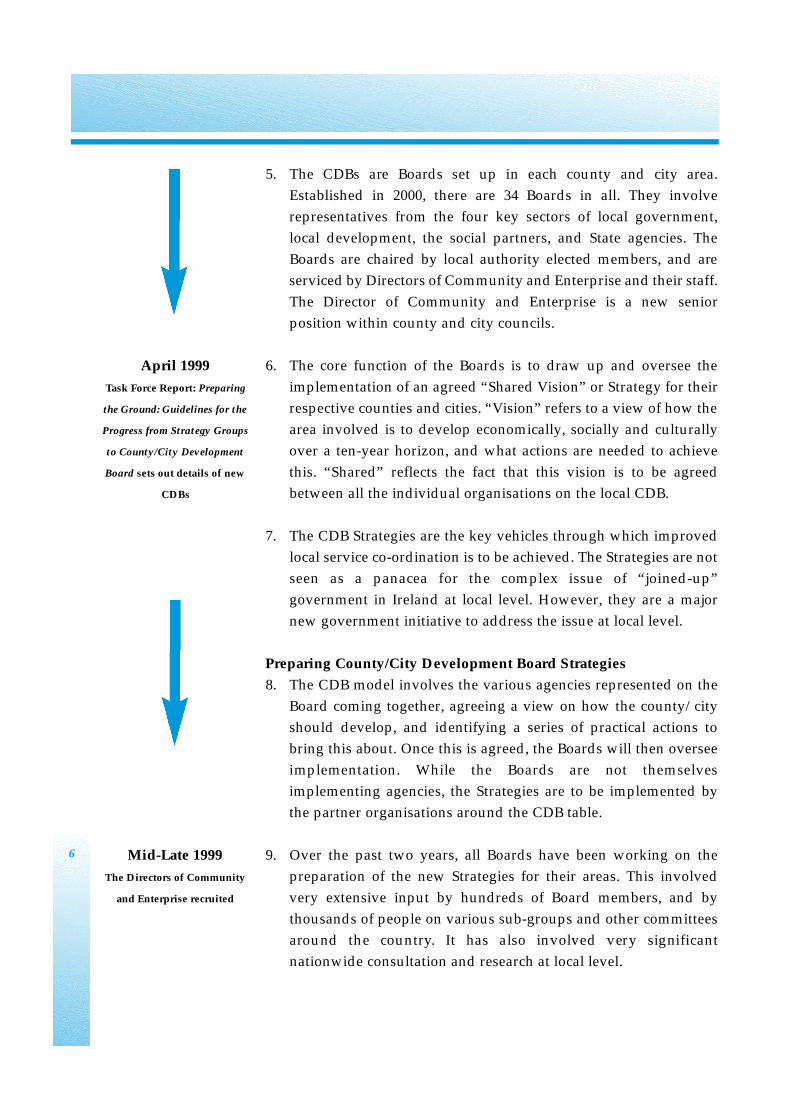
April 1999
Task Force Report: Preparing
the Ground: Guidelines for the
Progress from Strategy Groups
to County/City Development
Board sets out details of new
CDBs
Mid-Late 1999
The Directors of Community
and Enterprise recruited
7
10. The result of this work is that 34 new Strategies were published
during early/mid 2002, one for each county and city. These now
p rovide a corpus of nationwide locally driven information,
analyses and priorities, and they form the basis for the agreed
activities that Boards will oversee during the coming years. The
individual Strategies are generally similar in structure, having
followed a broad national template for local strategic planning.
Synthesising the CDB Strategies
11. The purpose of this report has been to synthesise the key messages
from the 34 published Strategies taken as a whole. An attempt to
synthesise 34 differing and substantive Strategies inevitably
involves over-simplification. Nevertheless, many important
common points emerge:
• in terms of the Boards’ overall goals and objectives for their areas,
there is a clear emphasis on quality of life issues, i.e. on the
provision of the mix of economic, social, cultural and other
background factors that citizens need to achieve a high quality of
life in terms of work, re c reation and leisure, education and
training, and housing;
• the Boards have identified a large number of actions that will
contribute to achieving their Strategies generally, and to
improving local public service integration in particular. Major
target areas for these actions are social inclusion (the single largest
sector addressed), education, culture, enterprise development,
health, the environment, transport, tourism, childcare and
housing;
• in terms of Government Departmental and agency responsibilities,
proposed actions relate mainly to local government (the single
largest group), Area Partnership Companies, LEADER Groups,
health boards, VECs, FÁS, County Enterprise Boards, Teagasc,
County Childcare Committees, the Gardaí, Enterprise Ireland,
third-level institutions, Regional Tourism Authorities and the
Department of Social and Family Affairs;
• the Strategies contain specific proposals for improved local level
service integration. This is generally seen by the Boards as
necessitating joint activities by agencies in partnership with each
other, and of the establishment of new working groups/task forces
etc. at local level. Of their nature, the Boards have worked within
existing agency structures and remits, and have not addressed the
wider national issues of these stru c t u res and institutional
boundaries.
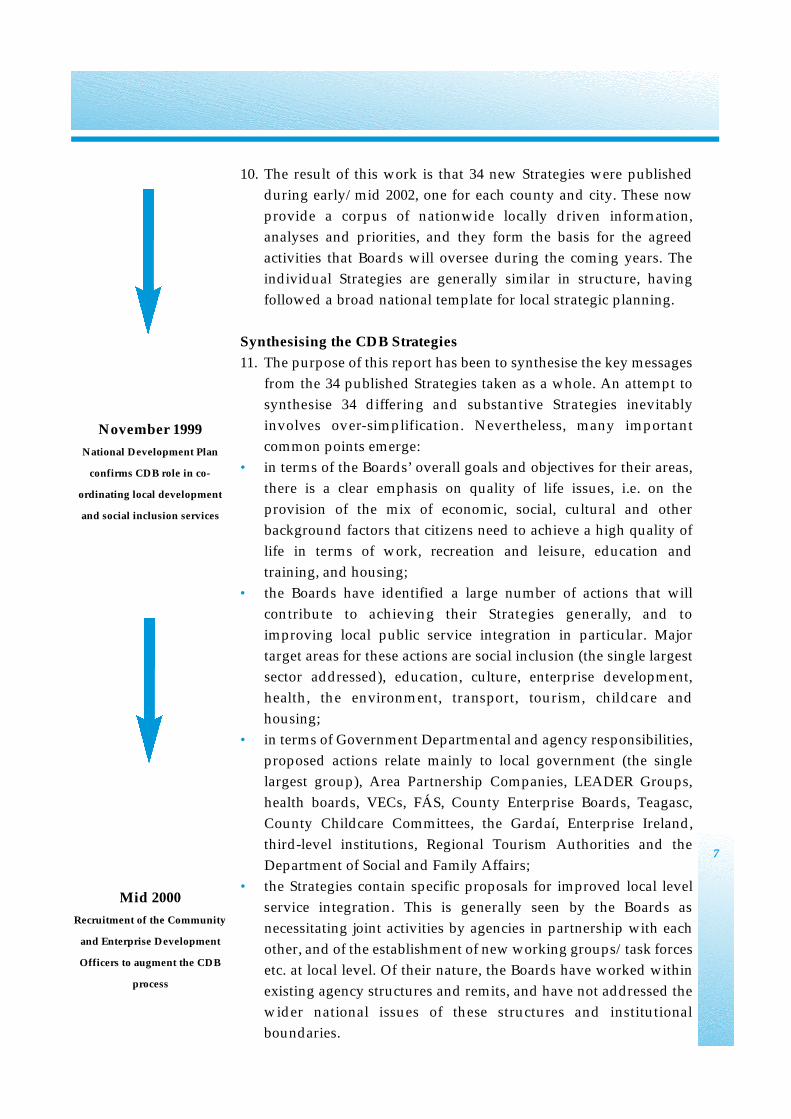
November 1999
National Development Plan
confirms CDB role in co-
ordinating local development
and social inclusion services
Mid 2000
Recruitment of the Community
and Enterprise Development
Officers to augment the CDB
process
8
Challenges Ahead
12. As outlined, the CDB process is a new attempt to achieve greater
service co-ordination and integration at local level by involving
the organisational players in preparing and overseeing a set of
integrated strategic actions at local level, within an overall shared
vision for the area. It is clear from the published Strategies that to
date the CDBs have risen to this opportunity. Notwithstanding the
many practical, institutional and other challenges involved,
Boards have published competent, well-presented and timely
Strategies, and have achieved a degree of hard-won consensus
around the needs of their counties and cities.
13. It is, nevertheless, "early days" in the process and there are
considerable challenges ahead for the CDBs, including:
• achieving a greater degree of prioritisation among the many
actions proposed, and of not sacrificing prioritisation entirely for
the achievement of consensus;
• drawing up and putting into practice annual action or
implementation plans which will give some time-based priority to
proposed actions;
• giving more consideration to the cost and resource implications of
proposed actions, especially actions which do not fall within the
regular responsibilities and budgets of member organisations;
• identifying more explicitly, local level service overlap and
duplication on the one hand, and service gaps on the other;
• developing clearer monitoring and evaluation procedures and
practices, including more quantified goals and targets, without
which subsequent monitoring and evaluation will be difficult.
14. For Government and for the Interdepartmental Task Force on the
Integration of Local Government and Local Development Systems,
challenges include:
• continuing to motivate individual Government Departments and
their implementing agencies to pro-actively promote greater local
service integration with their counterparts in other organisations;
• ensuring that within individual Departments and agencies there
are no inadvertent obstacles to greater service integration at local
level – difficulties such as sharing resources (financial, physical
and other);
• ensuring the follow-up of earlier Task Force proposals, endorsed
by Government, for “proofing” (i.e. checking for consistency) of
local and community development proposals by the CDBs and for
proofing by agencies of their Strategies against CDB Strategies;
May 2000
Task Force Report: A Shared
Vision: Guidelines on the CDB
Strategies for Economic, Social
and Cultural Development sets
out template for CDB Strategy
preparation
2000/2001
Boards given statutory
recognition in the Planning and
Development Act, 2000 and the
Local Government Act 2001
November 2001
Supplementary Guidelines on
the Implementation of CDB
Strategies issued
9
• ensuring that resourcing of the CDB process at local level is shared
and not seen as exclusively a matter for the local government
system;
• initiating arrangements whereby Government Departments and
agencies directly involved in local service delivery indicate clearly
within their operational/work plans the extent to which their
commitments to CDB Strategies will be delivered;
• ensuring that the central level treats the CDBs, under local
authority leadership and respecting local government
geographical boundaries, as the agreed broadly based structure
available to provide a local-level consultative and co-ordination
dimension of national services where required, and ensuring a
c o r responding cessation of the proliferation of similar new
separate local entities.
15. For both central and local level, a key challenge now is to move up
the steps on the “integration staircase” towards full service co-
ordination and collaboration. This will necessitate moving beyond
such welcome but modest activities as information exchange and
adjustments to programmes, towards sharing re s o u rces and
carrying out joint activities, and if necessary rationalising areas of
overlap. It is when this higher level is reached that potentially
costly and confusing duplication will be reduced, major service
gaps filled, and service improvements and greater value-for-
money achieved.
Overall Conclusions
16. The County/City Development Boards generally, and the CDB
Strategies in particular, are a new approach to the challenging
topic of providing more “joined-up” government at local level in
Ireland. Publication of the CDB Strategies, and their nature and
content, are a positive omen that the model can make progress
with re g a rd to improved public service co-ordination. The
county/city level cannot, however, make this progress alone.
17. A key determinant of the ultimate success of the CDB model is
commitment, support, and flexibility at central Government
Department and agency level. The county/city level cannot go
very far past where the central level wishes or allows it to go. So,
for the central level, the key message of the Strategies is that the
local service integration mission will ultimately be as successful or
unsuccessful as central Government organisations wish it to be.
Early/Mid 2002
29 Counties and 5 Cities
publish their Strategies for
Economic, Social and Cultural
Development.
June 2002
The Programme for
Government reinforces the role
of CDBs in agency co-
ordination.
1.1 Background
In early 2000 the Government, on the advice of the Interdepartmental Task Force on the
Integration of Local Government and Local Development Systems, and through the Minister
for the Environment and Local Government, established 34 County/City Development
Boards (CDBs). With one covering each county and city area, the Boards involve area
representatives from the local development sector, the social partners, State agencies and
local government, with the latter acting as lead agency. The Boards are a vehicle for
improving co-ordination of service delivery through the preparation and implementation of
agreed Strategies for Economic, Social and Cultural Development in their county/city areas.
These Strategies were all published during 2002. This is a synthesis report for those who will
not have an opportunity to examine each individual Strategy.
1.2 Objectives of this Report
This is the synthesis report of a review of all 34 individual CDB Strategies for Economic,
Social and Cultural Development, published in early to mid 2002.
The overall objectives of the report as set out in the Terms of Reference are:
“• to carry out a comprehensive/objective review and analysis of the Strategies for Economic, Social
and Cultural Development produced by each of the County/City Development Boards;
• to prepare a report synthesising the output of the review/analysis of the Strategies.”
More specifically, the Terms of Reference (which were written prior to publication of the
Strategies) ask that the review:
“• provide an informed and objective overview of all the Strategies and ensure that the central
messages in these Strategies are identified for the Task Force, relevant individual Government
Departments, public sector agencies (at national, regional and local levels) and local development
bodies;
• identify and draw together the key issues and recommendations emanating from the Strategies on
a thematic, Departmental, agency and regional basis;
• outline CDB-wide recommendations as detailed in the Strategies in relation to the achievement of
a more integrated/co-ordinated delivery of services at local level and identify any gaps in local
service provision, as set out in the Strategies;
• provide an overview of the means, as detailed in the Strategies, by which implementation of the
Strategies is to be achieved by Departments, agencies or other bodies;
• identify and consolidate the key issues in the Strategies together with associated costings, (where
these are identified in the Strategies), which would be of relevance to the mid-term review of the
National Development Plan.”
10
1. Background and Study Terms of Reference
The report was commissioned on behalf of the Interdepartmental Task Force on the
Integration of Local Government and Local Development Systems by the Department of the
Environment and Local Government, and was prepared by Fitzpatrick Associates and ERM
I reland. It was guided by a Steering Group re p resentative of the Departments of
Environment and Local Government, The Taoiseach, and Community, Rural and Gaeltacht
Affairs, together with the NDP/CSF Evaluation Unit in the Department of Finance, and a
Director of Community and Enterprise.
1.3 Approach and Method
Synthesising, drawing lessons from, and doing justice to 34 individual CDB Strategies is
clearly challenging. To this end, the study approach was designed to provide an objective
and systematic analysis. Its core aim is to allow the reader to understand the purpose and
nature of the published Strategies, to see the principal or recurring points emerging, and to
assess their implications especially at central Government level. To assist in this aim, a
standard template was drawn up within which each individual Strategy was synopsised,
and a series of key issues were identified against which each Strategy was reviewed. This
approach was facilitated by the fact that the published Strategies broadly followed agreed
Guidelines for their preparation and structure1. These were issued by the Interdepartmental
Task Force on the Integration of Local Government and Local Development Systems which
has continued in existence to guide and support the CDBs. The Task Force and Guidelines
are described more fully in Chapter 2.
Arising from this approach, a standard summary sheet of each Strategy was prepared which
constituted a qualitative summary of each Strategy, while a spreadsheet recorded and
analysed quantifiable common information and issues across the Strategies.
The method was piloted on a sample of Strategies and agreed with the Steering Group. In
addition, a workshop was held to discuss the findings emerging and the possible
implications of these for the future. This was attended by a Director of Community and
Enterprise from each region, as well as by members of the Steering Group.
A key dimension of the Terms of Reference, and of the approach and report, is that the aim
was not to “evaluate” the CDB Strategies, individually or collectively. For example, while the
report will refer to the originally agreed Guidelines for the Strategies, this is as a basis for the
structure of the analysis and report; it is not the intention to assess the extent of “compliance”
with the Guidelines. As already stated, the primary aim is to synthesise for the reader the
nature and content of the Strategies as published.
11
1 A Shared Vision for County/City Development Boards: Guidelines on the CDB Strategies for Economic, Social andCultural Development, Interdepartmental Task Force on the Integration of Local Government and LocalDevelopment Systems, May 2000.
The main departure from this synoptic approach is in the final chapter. This presents the
consultants’ interpretation of the central messages of the Strategies as a whole and presents
our assessment of the principal implications arising at national and local level.
1.4 Report Structure
Following this introduction, Chapter 2 outlines the underlying CDB process. It also sets out
the common approach used by the CDBs when preparing their Strategies (and which
provides a structure for this report).
As a prelude to the more detailed analysis in later Chapters, Chapter 3 provides an initial
overview of the Strategy documents designed to give a “feel” for their nature and content. It
sets out preliminary information on the structure, scope, coverage and preparation process.
Chapters 4 – 7 are then structured around the common strategic planning steps used by the
CDBs in preparing and presenting their Strategies. Each chapter synthesises the content of
the Strategies relating to one of the agreed planning steps as follows:
• Chapter 4 synthesises the audits of existing services, socio-economic profile and the
strengths, weaknesses, opportunities and threats (SWOT) analysis prepared for each
county/city;
• Chapter 5 examines the vision, goals, objectives and targets set by the CDBs for their
county/city;
• Chapter 6 deals with the actions CDBs propose to take to achieve their overall vision,
goals and objectives. The actions are analysed by sector, type, implementing agency and
timing;
• Chapter 7 synthesises how CDBs propose to monitor and evaluate their Strategies
generally, as well as their proposals regarding the core CDB mission of improved local
service integration.
Throughout, the report presents excerpts from individual CDB Strategies, designed to
illustrate the messages which are being synopsised more generically.
Figure 1.1 summarises the common planning steps used by the CDBs and the corresponding
chapter of this report.
12

Figure 1.1: Standard CDB Planning Steps and Report Chapters
13
Eight-Step Approach used by CDBs Related chapter in this report
Step 1 Chapter 3 CDB Strategies: OverviewProcess Initiation:Aims/Philosophy
Step 2 Chapter 4 CDB Strategies: Services Audits, Audit of Service Provision Socio-economic Profiles and SWOT
Analyses
Step 3 Chapter 4 CDB Strategies: Services Audits, Analysis of Present Economic, Social and Socio-economic Profiles and SWOTCultural Situation Analyses
Step 4 Chapter 4 CDB Strategies: Services Audits,Analysis of Strengths, Weaknesses, Socio-economic Profiles and SWOTOpportunities and Threats Analyses
Step 5 Chapter 5 CDB Strategies: VisionDevelopment of Vision, Goals and Objectives Statements, Goals and Objectives
Step 6 Chapter 5 CDB Strategies: VisionIdentification and Selection of Options Statements, Goals and Objectivesand Development of Strategies
Step 7 Chapter 6 CDB Strategies: ProposedEstablishment of Targets and Key ActionsResult Areas
Step 8 Chapter 7 CDB Strategies: DeliveryDrafting of the Section on Monitoring, MechanismsFeedback and Evaluation

2.1 Introduction
As referred to in Chapter 1, the CDBs and their Strategies have their origins in the work of
the Interdepartmental Task Force on the Integration of Local Government and Local
Development Systems. This Task Force recommended their establishment and set out their
objectives and structure. It set their aim as being better local service integration, and an
agreed CDB Strategy as the vehicle through which this is to be achieved. The Task Force also
issued broad common national guidelines for how CDB Strategies were to be prepared and
structured. This chapter sets out the role and output of the Task Force in more detail because
it constitutes the core backdrop to the CDB Strategies.
Section 2.2 outlines the key findings and proposals in the Task Force’s first report on The
Integration of Local Government and Local Development Systems. Section 2.3 details the findings
of the follow-up report, Preparing the Ground: Guidelines for the Progress from Strategy Groups to
County/City Development Boards. Finally, section 2.4 gives an overview of the Guidelines
issued to CDBs – A Shared Vision: Guidelines on the CDB Strategies for Economic, Social and
Cultural Development.
2.2 “Report of the Task Force on the Integration of Local Government and Local Development
Systems”, August 1998
2.2.1 Overview
The CDB process has its origins in the Report of the Interdepartmental Task Force on the
Integration of Local Government and Local Development Systems, issued in August 1998. This set
out to address and develop a model for the better integration of local government and local
development and public services delivered locally. The Task Force was chaired by the then
Minister for the Environment and Local Government, Mr. Noel Dempsey T.D., and included
senior officials from most Government Departments.
In its report, the Task Force noted:
• most policy functions cannot be addressed in isolation from other policy areas;
• the need for recognition of the continuing key role of central Government in setting a
policy context at national level;
• the significance alongside this of local decision-making and the role of local democratic
structures;
• the lack of linkages between local area-based public and local development agencies and
local-based government structures.
14
2. CDB Strategies: Background and Guidelines

These considerations led the Task Force to conclude that there is a need to create a shared
vision for the development of the economic and social life of local areas - in effect, to create
joined-up policies/activities between all public and local development agencies at local
level. Its view was that the coherent allocation of responsibilities among public and local
development agencies would be a central plank in delivering on such a shared vision.
2.2.2 Key Principles in Local Strategic Development
The Task Force set out a series of underlying principles that should underpin a process of
integration of public services at local level. These included:
Community Development Democratic Legitimacy Value for Money
Social Inclusion Voluntary Effort Process
Partnership/Participation Simplicity Flexibility
Linkages with various Local democratic Thematic/Area
programmes leadership Based
In applying these principles to the public agencies and development bodies operating at
local level, the Task Force found an environment that:
• needed recognition of the proliferation of separate plans with potential for conflicting
objectives, overlap and gaps in service provision;
• should be addressed through a comprehensive and agreed Economic, Social and Cultural
Strategy for each county/city, with sufficient flexibility to recognise the need for different
responses as required at local and sub-county level;
15
Purpose of CDBs
The County/City Development Board will replace the County/City Strategy Group. The
primary function of the Board will be to draw up and work towards the implementation of the
Strategy for Economic, Social and Cultural Development within the county/city. It would
work in a series of steps towards the production of the Strategy by 1 January 2002, promote
and encourage co-operation and co-ordination between the various agencies and interests on
an ongoing basis, and monitor the delivery of the Strategy. All agencies will need to be advised
to participate fully in this process.
Source: Report of the Interdepartmental Task Force on the Integration of Local
Government and Local Development Systems, August 1998.
• should allow for a 10 year planning period and set targets of 3-5 years to be delivered
through the activities of national, local and social partners, and with built-in provision to
monitor delivery at local level. This would enable adoption of national policy to suit local
circumstances.
2.2.3 County/City Development Boards, Directors of Community and Enterprise
In order to address the issue of improved integration via an agreed local Strategy, the Task
Force proposed the establishment of local authority-led County/City Development Boards
(CDBs) and the appointment of Directors of Community and Enterprise (DCEs) to service
these, in each county and city local authority. The primary function of a Board was to draw
up a Strategy for Economic, Social and Cultural Development by 1 January 2002 and
subsequently oversee its implementation by member organisations. These proposals were
implemented and led directly to the 34 Strategies synthesised in this report.
The Boards consist of members drawn from four sectors representative of local interests in
the county/city. Total membership would generally be in the order of 27 members in each
case. Membership would include the Council Chairperson, chairpersons of the local
authority Strategic Policy Committees and the County/City Manager; representatives from
the local development sector (to include as appropriate LEADER, Area Partnerships and
Enterprise Boards); re p resentatives of State agencies operating at local level; and
representatives of the social partners drawn from the local community.
The Task Force set the expectation that State agencies represented on the CDB would
contribute to the Board’s process in developing and implementing the Strategy through
practical supports such as financial contributions, staff secondments, and assistance in the
development of specific projects.
2.2.4 Community Fora
In addition to the establishment of the CDBs, the Interdepartmental Task Forc e
recommended the setting up of Community and Voluntary Fora in each county/city. These
Fora reflected recognition on the part of the Task Force of the importance of this sector in the
social and economic life of local communities, and of their potential for contributing to the
cultural development of such communities. The Fora were to be clustered around:
• groups with a focus on social inclusion;
• groups with a focus on cultural/sporting/recreational/residence-association type work.
The Fora were to be the means through which community and voluntary representatives
were to be nominated to the CDB and other consultative mechanisms, such as Strategic
Policy Committees and local area committees of local authorities.
16
2.2.5 County/City Strategies
As noted above, the Task Force envisaged the CDB Strategies as being at the heart of the new
drive for local public service integration. It recommended that individual organisational
plans of locally based authorities and agencies “should fit into the Strategy adopted by the
Board”. The Strategy for each county/city would provide the “broad framework within
which these agencies would operate”. The Task Force suggested that the Strategy could
encompass “all public services delivered locally”. It also envisaged its continuation as the
Task Force to provide guidance and support to the Boards to drive the process forward at
central level.
The Strategy framework adopted by each Board was expected by the Task Force to provide
for a series of overall “objectives, targets and indicators for the county/city and would
identify the agencies responsible for (and their role for delivering on) these objectives”. The
framework in each case was expected to:
• involve each CDB member agency on an ongoing basis in proofing their individual plans
and performance against the Strategy as agreed by the Board;
• provide input into the overall national development planning process;
• emphasise consultative process;
• co-ordinate the delivery of local public and local development services;
• be informed by national policy.
The framework therefore pointed to the need for local agencies to come to an agreement that
would provide for co-ordination of public service delivery in each county/city.
17
CDB Strategies
At present many of the agencies which would be represented on the Board have their own
plans. It is important that these individual plans should fit in with the Strategy adopted by the
Board. Ultimately, the Strategy should provide a broad framework within which these agencies
would operate. It will be prepared with a 10-year vision and manageable 3-5 year targets;
ultimately it will encompass all public services delivered locally. The Strategy will be given
democratic endorsement by the County/City Council.
Source: Report of the Interdepartmental Task Force on the Integration of Local
Government and Local Development Systems, August 1998
2.2.6 Organisational Adjustments
In recognition of the cross-agency demands that the Boards would have to address in
developing and implementing their Strategy, the Task Force recommended that each Strategy
should address:
• the need for common areas ideally based upon county/city boundaries;
• the need to reduce functional overlaps.
In addition, the Task Force recommended that:
• relevant Government Departments should proceed in the context of the National
Development Plan to consolidate enterprise support in a single agency with an aligning
of the County/City Enterprise Board process with local government;
• where a comprehensive county/city Strategy has been agreed, state-funded community
development and local development projects should be proofed by the County/City
Development Board within the context of that Strategy.
2.3 “Preparing the Ground” Report, April 1999
In April 1999, following Government acceptance of its report, the Task Force issued a follow-
up report on the detailed establishment of the CDBs – “Guidelines for the Progress from Strategy
Groups to County/City Development Boards”. These Guidelines contained the following key
points:
• provided detailed guidance on the composition and structure of the CDBs;
• provided guidance on the arrangements for wider input into the strategy-making process
by non-members of the Boards;
• provided guidance on the role of the Director of Community and Enterprise;
• addressed the role of local authority area committees as expanded to encompass
community development;
• set out an indicative template for the strategy process;
• set underlying principles for the operation of the CDBs and local authority area
committees;
• specified that CDB members were to be drawn from four sectors:
e local government
e local development
e state agencies
e social partners
18
19
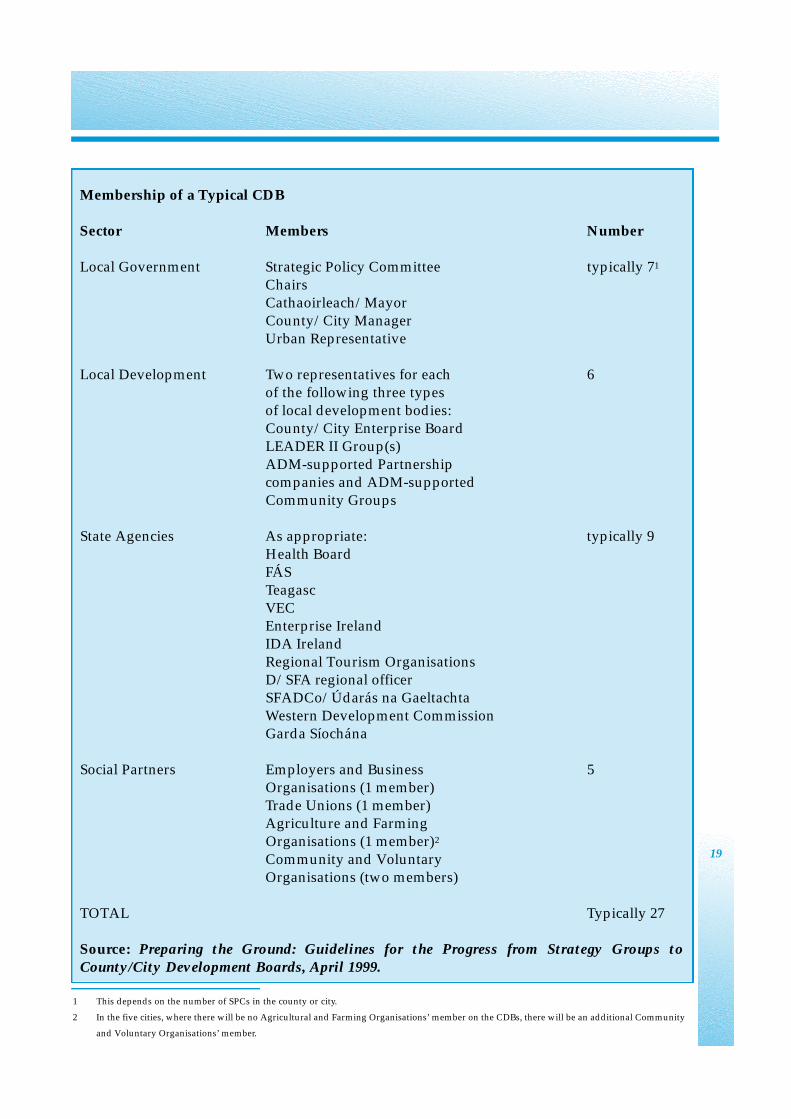
Membership of a Typical CDB
Sector Members Number
Local Government Strategic Policy Committee typically 71
ChairsCathaoirleach/MayorCounty/City ManagerUrban Representative
Local Development Two representatives for each 6of the following three types of local development bodies:County/City Enterprise BoardLEADER II Group(s)ADM-supported Partnership companies and ADM-supported Community Groups
State Agencies As appropriate: typically 9Health BoardFÁSTeagascVECEnterprise IrelandIDA IrelandRegional Tourism OrganisationsD/SFA regional officerSFADCo/Údarás na GaeltachtaWestern Development CommissionGarda Síochána
Social Partners Employers and Business 5Organisations (1 member)Trade Unions (1 member)Agriculture and Farming Organisations (1 member)2
Community and Voluntary Organisations (two members)
TOTAL Typically 27
Source: P reparing the Ground: Guidelines for the Pro g ress from Strategy Groups toCounty/City Development Boards, April 1999.
1 This depends on the number of SPCs in the county or city.
2 In the five cities, where there will be no Agricultural and Farming Organisations’ member on the CDBs, there will be an additional Community
and Voluntary Organisations’ member.

The Guidelines also stated that the CDB members should have their mandate confirmed after
two years of membership, with terms of office of each Board coterminous with the
County/City Councils.
The Guidelines also provided for:
• mandatory participation by the state agencies;
• establishment of Community and Voluntary Fora for organisations involved in
community and voluntary activities;
• appointment of Community Liaison Officers (later re-named Community and Enterprise
Development Officers, CEDOs) as additional staff working with the new Directors of
Community and Enterprise.
These and other Task Force guidelines were given statutory effect in Section 129 of the Local
Government Act, 2001.
2.4 “A Shared Vision” Report, May 2000
2.4.1 Overview
The Task Force had also recommended that central guidance should be formulated to
support the CDBs’ key task, i.e. preparation of the County/City Strategies. A third report was
therefore published by the Task Force in May 2000 – “A Shared Vision for County/City
Development Boards; Guidelines on the CDB Strategies for Economic, Social and Cultural
Development”.
These Guidelines established a common agreed template to enable preparation of distinct
individual CDB Strategies, while at the same time maintaining a common, broadly national
format. Provision of this framework has been critical to the completion of this report in that
it facilitated collation of the Strategies in a structured way.
The Guidelines summarise the aims of the Boards as:
• the organisation of local operations and the development and monitoring on a combined
basis of locally delivered public services;
• the minimisation of overlaps and duplication;
• the filling of service gaps;
• the achievement of a more coherent and integrated approach to public and local
development service delivery at local level;
• the addressing of the particular needs of local areas.
20
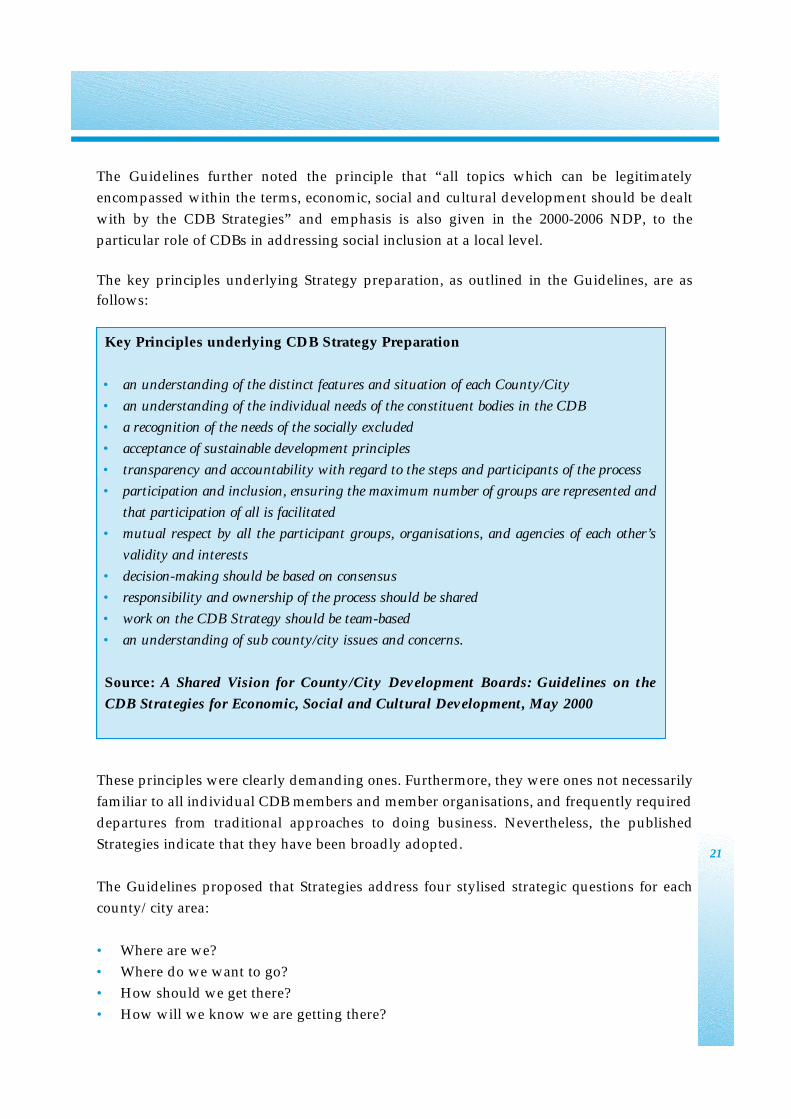
The Guidelines further noted the principle that “all topics which can be legitimately
encompassed within the terms, economic, social and cultural development should be dealt
with by the CDB Strategies” and emphasis is also given in the 2000-2006 NDP, to the
particular role of CDBs in addressing social inclusion at a local level.
The key principles underlying Strategy preparation, as outlined in the Guidelines, are as
follows:
These principles were clearly demanding ones. Furthermore, they were ones not necessarily
familiar to all individual CDB members and member organisations, and frequently required
departures from traditional approaches to doing business. Nevertheless, the published
Strategies indicate that they have been broadly adopted.
The Guidelines proposed that Strategies address four stylised strategic questions for each
county/city area:
• Where are we?
• Where do we want to go?
• How should we get there?
• How will we know we are getting there?
21
Key Principles underlying CDB Strategy Preparation
• an understanding of the distinct features and situation of each County/City
• an understanding of the individual needs of the constituent bodies in the CDB
• a recognition of the needs of the socially excluded
• acceptance of sustainable development principles
• transparency and accountability with regard to the steps and participants of the process
• participation and inclusion, ensuring the maximum number of groups are represented and
that participation of all is facilitated
• mutual respect by all the participant groups, organisations, and agencies of each other’s
validity and interests
• decision-making should be based on consensus
• responsibility and ownership of the process should be shared
• work on the CDB Strategy should be team-based
• an understanding of sub county/city issues and concerns.
Source: A Shared Vision for County/City Development Boards: Guidelines on the
CDB Strategies for Economic, Social and Cultural Development, May 2000
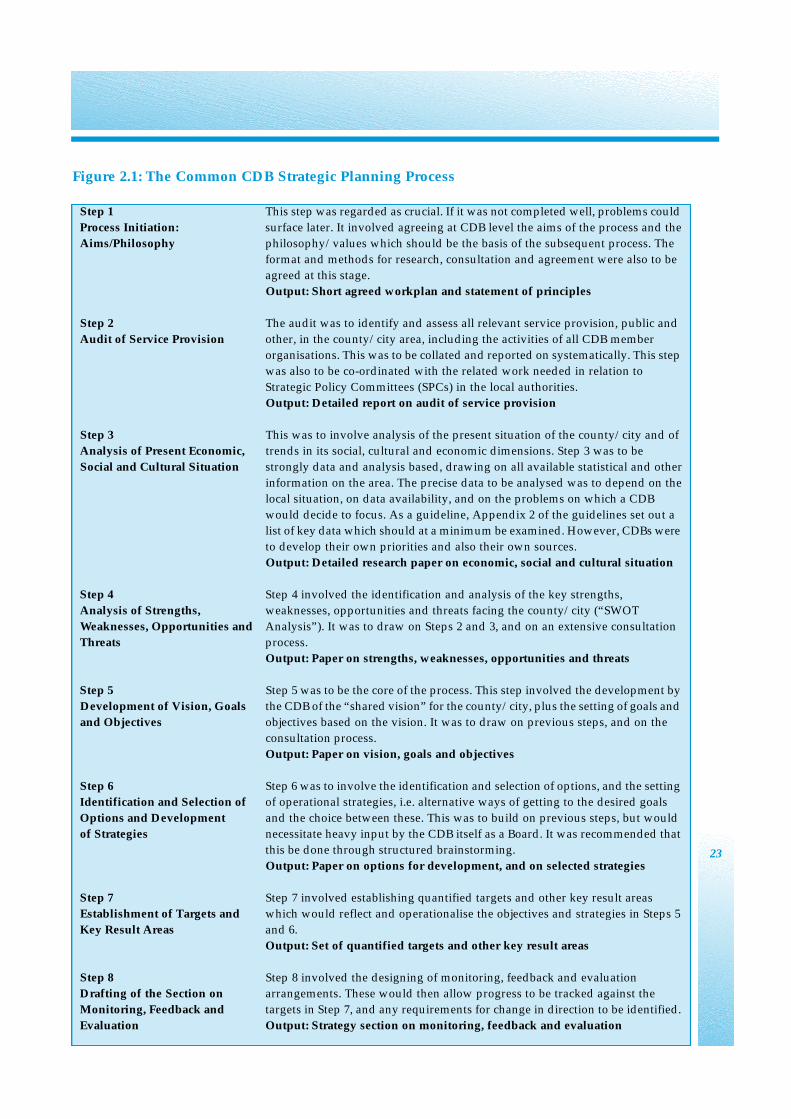
A logical sequence of eight work steps was recommended to address these strategic
questions. These steps, as set out in Figure 2.1, were broadly followed in practice. As referred
to in section 1.4, this has facilitated the subsequent chapters of this synopsis to be based
around them.
An element of the Guidelines was that provision was to be made for proofing of the emerging
CDB Strategy against national policy parameters, and that there be a regional dimension at
both NUTS II and III levels. In addition, the County/City Development Plans were in turn to
be adopted in the context of the Strategy (the Planning and Development Act 2000 now
provides for preliminary consultation with the CDBs on the part of planning authorities with
regard to revisions to County/City Development Plans), while the Strategy was also to reflect
the need for sustainable development at each step of the process (provided for under the
national guidelines for Local Agenda 21). Particular reference was made to the need to
address cultural development as an integrated part of the overall development of the
county/city. In addition, the need to ensure integration of cultural aspects of a community
with the economic and social framework of development was specifically provided for in the
Guidelines.
22
23
Figure 2.1: The Common CDB Strategic Planning Process
Step 1 This step was regarded as crucial. If it was not completed well, problems couldProcess Initiation: surface later. It involved agreeing at CDB level the aims of the process and the Aims/Philosophy philosophy/values which should be the basis of the subsequent process. The
format and methods for research, consultation and agreement were also to be agreed at this stage.Output: Short agreed workplan and statement of principles
Step 2 The audit was to identify and assess all relevant service provision, public and Audit of Service Provision other, in the county/city area, including the activities of all CDB member
organisations. This was to be collated and reported on systematically. This stepwas also to be co-ordinated with the related work needed in relation to Strategic Policy Committees (SPCs) in the local authorities.Output: Detailed report on audit of service provision
Step 3 This was to involve analysis of the present situation of the county/city and of Analysis of Present Economic, trends in its social, cultural and economic dimensions. Step 3 was to be Social and Cultural Situation strongly data and analysis based, drawing on all available statistical and other
information on the area. The precise data to be analysed was to depend on the local situation, on data availability, and on the problems on which a CDB would decide to focus. As a guideline, Appendix 2 of the guidelines set out a list of key data which should at a minimum be examined. However, CDBs wereto develop their own priorities and also their own sources.Output: Detailed research paper on economic, social and cultural situation
Step 4 Step 4 involved the identification and analysis of the key strengths, Analysis of Strengths, weaknesses, opportunities and threats facing the county/city (“SWOT Weaknesses, Opportunities and Analysis”). It was to draw on Steps 2 and 3, and on an extensive consultation Threats process.
Output: Paper on strengths, weaknesses, opportunities and threats
Step 5 Step 5 was to be the core of the process. This step involved the development byDevelopment of Vision, Goals the CDB of the “shared vision” for the county/city, plus the setting of goals andand Objectives objectives based on the vision. It was to draw on previous steps, and on the
consultation process.Output: Paper on vision, goals and objectives
Step 6 Step 6 was to involve the identification and selection of options, and the settingIdentification and Selection of of operational strategies, i.e. alternative ways of getting to the desired goals Options and Development and the choice between these. This was to build on previous steps, but would of Strategies necessitate heavy input by the CDB itself as a Board. It was recommended that
this be done through structured brainstorming.Output: Paper on options for development, and on selected strategies
Step 7 Step 7 involved establishing quantified targets and other key result areas Establishment of Targets and which would reflect and operationalise the objectives and strategies in Steps 5 Key Result Areas and 6.
Output: Set of quantified targets and other key result areas
Step 8 Step 8 involved the designing of monitoring, feedback and evaluation Drafting of the Section on arrangements. These would then allow progress to be tracked against the Monitoring, Feedback and targets in Step 7, and any requirements for change in direction to be identified.Evaluation Output: Strategy section on monitoring, feedback and evaluation
2.4.2 The Strategy Documents
The May 2000 Guidelines stated that each published CDB Strategy document was to be:
• “substantive, and publicly available;
• adequately reflect the comprehensive, detailed and extensive analysis and consultation which will
underlie it;
• well presented, readable, easily followed but not overly glossy;
• have a main text that should be about 50 A4-page equivalents, with an executive summary of no
more than three pages;
• be accessible and meaningful to disadvantaged and marginalized groups and their representatives;
• be published in hard copy, and also electronically (if possible, to be available on the internet);
• have a series of chapters, with clearly defined and headed sections and subsections;
• use where possible maps and charts;
• have a clear regional and sub county element generally based on local electoral area or a
combination of local electoral areas.”
The suggested template for each Strategy is set out in Figure 2.2.
24
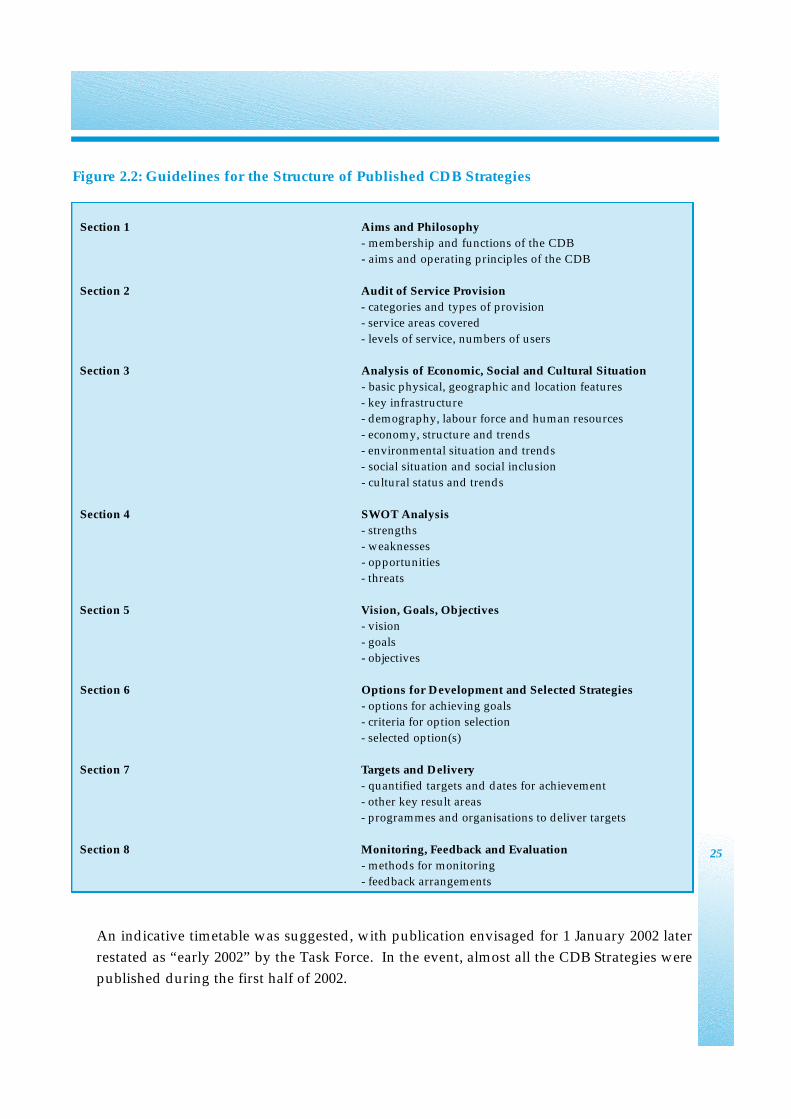
Figure 2.2: Guidelines for the Structure of Published CDB Strategies
An indicative timetable was suggested, with publication envisaged for 1 January 2002 later
restated as “early 2002” by the Task Force. In the event, almost all the CDB Strategies were
published during the first half of 2002.
25
Section 1 Aims and Philosophy- membership and functions of the CDB- aims and operating principles of the CDB
Section 2 Audit of Service Provision- categories and types of provision- service areas covered- levels of service, numbers of users
Section 3 Analysis of Economic, Social and Cultural Situation- basic physical, geographic and location features- key infrastructure- demography, labour force and human resources- economy, structure and trends- environmental situation and trends- social situation and social inclusion- cultural status and trends
Section 4 SWOT Analysis- strengths- weaknesses- opportunities- threats
Section 5 Vision, Goals, Objectives- vision- goals- objectives
Section 6 Options for Development and Selected Strategies- options for achieving goals- criteria for option selection- selected option(s)
Section 7 Targets and Delivery- quantified targets and dates for achievement- other key result areas- programmes and organisations to deliver targets
Section 8 Monitoring, Feedback and Evaluation- methods for monitoring- feedback arrangements
2.5 Key Messages
• The challenge of better integration of public and local development services is well
recognised and has been the subject of extensive deliberation, publication and action by
the Interdepartmental Task Force on the Integration of Local Government and Local
Development Systems.
• The County/City Development Boards (CDBs) – led by local government and
representative of local public and local development agencies, employers, unions,
farming and community interests – were established to progress this agenda in a practical
way on the ground at county/city level.
• The Boards are to achieve this through preparation and overseeing the implementation,
through their member agencies, of agreed Strategies for Economic, Social and Cultural
Development in their county/city local authority areas.
• Support from central Government Departments, especially via the Interdepartmental
Task Force, has continued to be crucial.
26
3.1 Introduction
As a prelude to the more detailed description in later chapters, this chapter presents an
overview of the 34 published CDB Strategies. Its aim is to give a “feel” for the nature and
content of the documents to those who may not ever read (or perhaps even see) any of them.
Section 3.2 provides details on the number of Strategies published, timing of publication and
supporting published material. Section 3.3 reviews the structure, scope and coverage of the
Strategies, while section 3.4 outlines the preparation process. Section 3.5 records any regional
or other patterns emerging at this stage from the Strategies.
3.2 The Strategy Publications
The 34 CDB Strategies that this report examines, covering all of the county/city local
authority areas of Ireland, were all published between January and October 2002. The
majority were produced in March - April. There is now, therefore, for the first time a
comprehensive series of integrated Strategies (albeit often aspirational) for the local delivery
of public services across the State. These are, of course, statements of overall strategy at local
level and detailed delivery plans remain a matter for individual organisations. However,
implementation of the Strategies is the responsibility of the CDB member agencies, who are
required to ‘proof’ their operational plans against the published CDB Strategies.
27
3. CDB Strategies: Overview
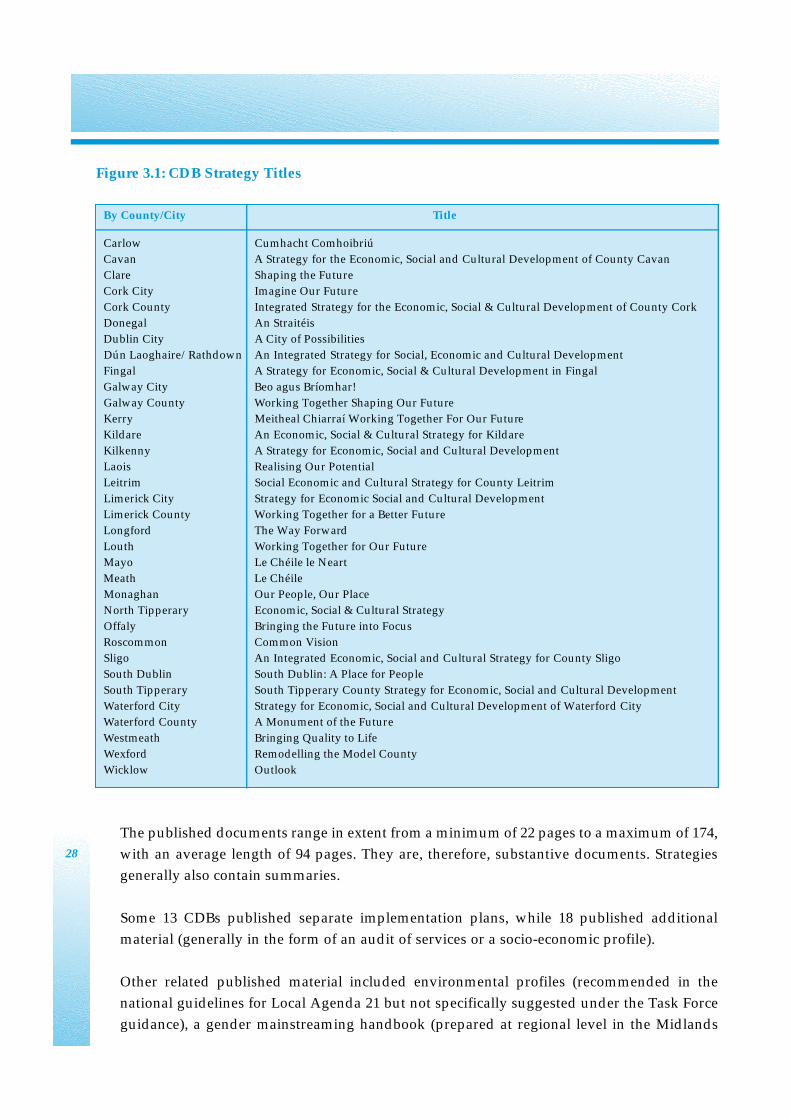
Figure 3.1: CDB Strategy Titles
The published documents range in extent from a minimum of 22 pages to a maximum of 174,
with an average length of 94 pages. They are, therefore, substantive documents. Strategies
generally also contain summaries.
Some 13 CDBs published separate implementation plans, while 18 published additional
material (generally in the form of an audit of services or a socio-economic profile).
Other related published material included environmental profiles (recommended in the
national guidelines for Local Agenda 21 but not specifically suggested under the Task Force
guidance), a gender mainstreaming handbook (prepared at regional level in the Midlands
28
By County/City Title
Carlow Cumhacht Comhoibriú
Cavan A Strategy for the Economic, Social and Cultural Development of County Cavan
Clare Shaping the Future
Cork City Imagine Our Future
Cork County Integrated Strategy for the Economic, Social & Cultural Development of County Cork
Donegal An Straitéis
Dublin City A City of Possibilities
Dún Laoghaire/Rathdown An Integrated Strategy for Social, Economic and Cultural Development
Fingal A Strategy for Economic, Social & Cultural Development in Fingal
Galway City Beo agus Bríomhar!
Galway County Working Together Shaping Our Future
Kerry Meitheal Chiarraí Working Together For Our Future
Kildare An Economic, Social & Cultural Strategy for Kildare
Kilkenny A Strategy for Economic, Social and Cultural Development
Laois Realising Our Potential
Leitrim Social Economic and Cultural Strategy for County Leitrim
Limerick City Strategy for Economic Social and Cultural Development
Limerick County Working Together for a Better Future
Longford The Way Forward
Louth Working Together for Our Future
Mayo Le Chéile le Neart
Meath Le Chéile
Monaghan Our People, Our Place
North Tipperary Economic, Social & Cultural Strategy
Offaly Bringing the Future into Focus
Roscommon Common Vision
Sligo An Integrated Economic, Social and Cultural Strategy for County Sligo
South Dublin South Dublin: A Place for People
South Tipperary South Tipperary County Strategy for Economic, Social and Cultural Development
Waterford City Strategy for Economic, Social and Cultural Development of Waterford City
Waterford County A Monument of the Future
Westmeath Bringing Quality to Life
Wexford Remodelling the Model County
Wicklow Outlook
29
and Roscommon), county/city atlases, directories of service and social inclusion handbooks.
All 29 CDBs in rural counties also prepared rural transport service audits in their areas1.
Some of the Boards published additional material using the internet or CD-Rom.
3.3 Structure, Scope and Coverage of Strategies
The Strategies largely follow the template suggested in the Shared Vision Guidelines. As
noted already, this broad consistency of approach has facilitated the preparation of this
national synthesis report (as it was designed to do).
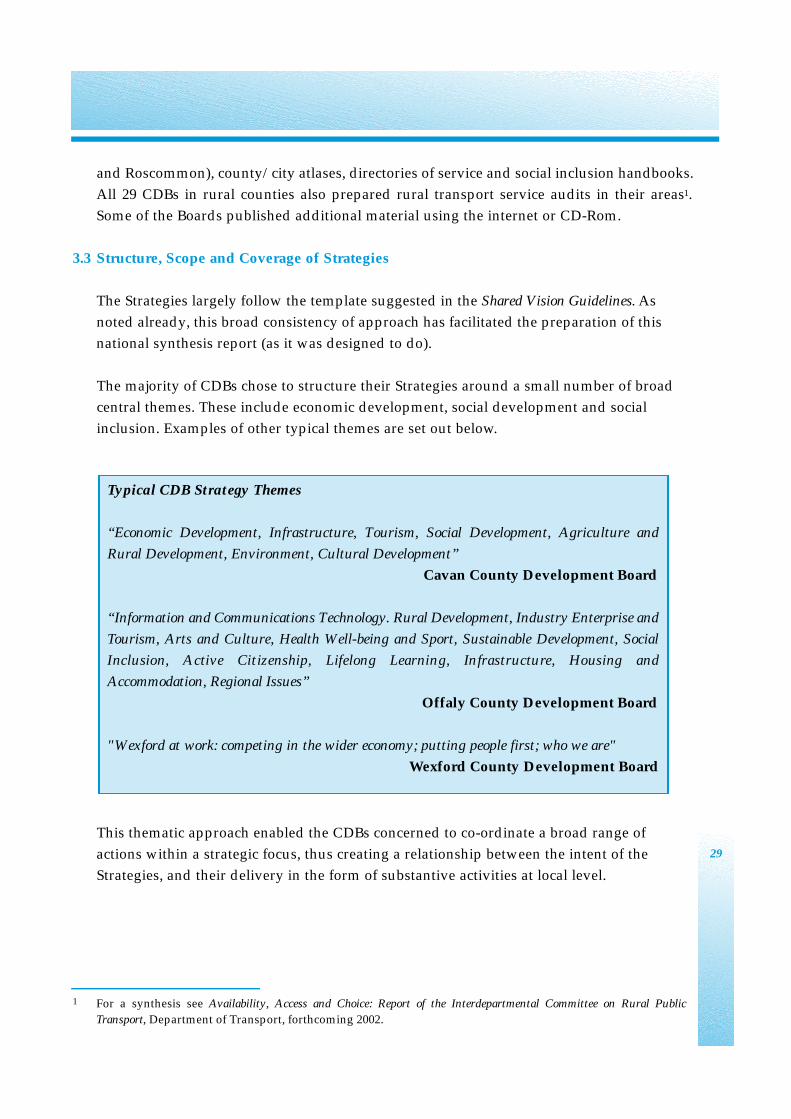
The majority of CDBs chose to structure their Strategies around a small number of broad
central themes. These include economic development, social development and social
inclusion. Examples of other typical themes are set out below.
This thematic approach enabled the CDBs concerned to co-ordinate a broad range of
actions within a strategic focus, thus creating a relationship between the intent of the
Strategies, and their delivery in the form of substantive activities at local level.
Typical CDB Strategy Themes
“Economic Development, Infrastructure, Tourism, Social Development, Agriculture and
Rural Development, Environment, Cultural Development”
Cavan County Development Board
“Information and Communications Technology. Rural Development, Industry Enterprise and
Tourism, Arts and Culture, Health Well-being and Sport, Sustainable Development, Social
Inclusion, Active Citizenship, Lifelong Learning, Infrastructure, Housing and
Accommodation, Regional Issues”
Offaly County Development Board
"Wexford at work: competing in the wider economy; putting people first; who we are"
Wexford County Development Board
1 For a synthesis see Availability, Access and Choice: Report of the Interdepartmental Committee on Rural PublicTransport, Department of Transport, forthcoming 2002.
3.4 Strategy Preparation Process
The process as recommended in the national guidelines emphasised the need for ongoing
consultation both within the Board itself and beyond the Board to the wider community in
each county/city. It is clear from the Strategies that the level of consultation was extensive,
community-based and involved a clear understanding of the need to involve the members
of the Boards in the development of the Strategies.
The role of consultation manifests itself in the Strategies through references to the numbers
of public meetings, workshops and other consultative methodologies. In particular there is
extensive reference to the establishment of the Community and Voluntary Fora1.
3.5 Key Messages
• All 34 CDBs have prepared and published a Strategy broadly within the proposed
timeframe.
• Generally, they followed the eight-step template suggested by the Task Force.
• There was a very large degree of consultation across all relevant interests and the active
involvement of Board members in the preparatory process.
30
1 Community & Voluntary Fora have been established in each county and city as part of the County/CityDevelopment Board (CDB) process. Their role is to facilitate the community in making an input to the CDBs,local authorities and other public sector agencies for the purposes of consultation.
4.1 Introduction
As a response to the core question “where are we?”, the national guidelines advised the
preparation by each CDB of:
•an audit of existing local public service provision in the county/city;
• an analysis of the current economic, social and cultural situation in the area;
•strengths, weaknesses, opportunities and threats (SWOT) analysis.
This, in turn, was to lead to the identification of any key problems that would require
resolution and the strengths that might be built on in the resolution of such problems.
Sections 4.2, 4.3 and 4.4 of this chapter present a synthesis of these three steps across the
published Strategies.
4.2 Audits of Service Provision
It was envisaged in the national guidelines that the Boards would identify all service
providers and levels of provision in each area. This was to enable the Boards to address
who does what, where, when and how in their county or city.
The Boards were to establish at a minimum a full understanding of the operational plans
and strategies of organisations concerned with both internal and external aspects of their
county/city. In addition, they were to understand attitudes regarding the services in their
county/city that might be held by the general population as well as by key stakeholders.
They were also intended to develop a full understanding of the different planning and
service boundaries that, as Boards, they would have to address.
Almost all Strategies include elements of a completed audit, although explicit reference to
them is limited. Most of the separately published audits are, in effect, directories of service
provision rather than analyses explicitly specifying weaknesses or gaps in service delivery.
In those Strategies that explicitly address gaps in service provision in their county/city, the
key issues presented relate to a lack of delivery of specific services. In some instances this
applies to urban/rural imbalance in service levels; in others, it relates to a complete
absence of service.
A further issue raised is the inadequate level of public knowledge in relation to service
availability, e.g. health and other social services.
31
4. CDB Strategies: Services Audits, Socio-economic Profiles and SWOT Analyses
4.3 Analysis of Socio-economic Situation
Almost all of the completed Strategies reference the underlying socio-economic analysis of
their county or city.
There is a common concern with regard to the dependence on out-of-date data sources (in
particular the 1996 census). In addition, there are concerns about the inability to derive
county-level information in a simple and effective way from unpublished data held by
Government Departments and others.
The socio-economic profiles across the 34 Strategies can be synopsised under a range of
headings as follows:
• Demography: The key issue raised here is the decline in rural population alongside
increased urbanisation. Associated with this decline are the increasingly divergent age
structures of rural/urban populations.
• Infrastructure: Concerns are set out in the Strategies with regard to the poor levels of
road and rail infrastructure, the need for continuous renewal of the energy and
telecommunications networks, the need for provision of greater industrial capacity
including waste management, and the requirement for ongoing investment in health
and other social infrastructure.
• Employment: The profiles reflect the generally positive position of the economy at the
time of writing, with concerns regarding the balanced spread of foreign direct
32
Audit of Services
“The rural nature of the county also presents critical challenges for public service delivery.
Agencies and delivery organisations must find new ways of developing services in a way that
provides equality of access from City through to the most dispersed or rural communities.”
Kilkenny County Development Board
“An audit of services has been completed for County Laois, which enabled analysing the
availability and range of services provided by agencies within the county. The audit will be
updated by the CDB on an annual basis.”
Laois County Development Board
“The purpose of this audit is to assess what services are available, who is providing them, who
is using them and where gaps in service provision lie.”
Wicklow County Development Board
investment plus the need to grow indigenous sectors. Specific concerns are expressed in
each of the Midlands’ Strategies with regard to the possible shut down of State industry
in electricity generation and peat production.
• Education: Generally the profiles in the Strategies reflect the progress in encouraging
third-level education. Concerns are expressed about the need to establish and retain
flows of graduates across all areas.
• Social Inclusion: The profiles identify affected groups ranging from elderly persons,
travellers and one-parent families, to non-national residents as those with the potential
to be socially excluded. There is a broad consensus with regard to the continued
widespread presence of such groups throughout the State, and the need to address
their issues within the Strategies.
• Housing: In general, the profiles concentrate on social housing, while the influence of
the private housing sector manifests itself with regard to pricing and affordability
issues.
• Environment: This area is addressed in a limited number of profiles. Those Strategies
that do address it point to the current challenges being addressed by the local
authorities with regard to this issue.
• Information and Communication Technology: This is primarily referenced in the
context of the development of broadband investment, with relatively little profiling of
ICT development in the counties/cities.
• Culture: There is a general recognition of the improvements to infrastructure in these
areas in the recent past. There is also a wish to continue to support the use of Irish.
33
Socio-economic Profile
“At the end of 2000 in Clare, foreign-owned companies employed more than 75% of employees
in the services sector and 72% of employees in the manufacturing sector.”
Clare County Development Board
“Despite the economic boom over the past six years, disparities between disposable income
levels in Monaghan and the State average have widened from 92.3% in 1994 to 90% in 1998.”
Monaghan County Development Board
“Within County Donegal there are eleven community-based hospitals providing locally based
healthcare for older people and other groups.”
Donegal County Development Board
4.4 Summary of SWOT
Most published Strategies make re f e rence to an underlying analysis of stre n g t h s ,
weaknesses, opportunities and threats (SWOT) analysis. These references range from a
detailed list of issues to a short statement indicating that a SWOT analysis was undertaken.
In general, the strengths cited refer to community identity and voluntary effort, quality of life
in the area, developing economic performance, good education facilities and good location.
In the case of weaknesses, poor infrastructure of all types is a constant theme. So are
demographic issues. In some Strategies, concerns with community facilities and support
services are flagged.
Opportunities frequently refer to the potential of better spatial planning and the role the
specific area could play in this context. Threats that are frequently cited include lack of
service integration, decline in volunteerism, population drain in rural areas, and the lack of
balanced regional development.
The SWOT analyses in the 34 Strategies can be synthesised under the same headings as the
socio-economic profiles above:
• Demographic: Demographic issues here are generally regarded as weaknesses, in
particular the structural changes applying to rural areas, and the resulting population
reductions.
• Infrastructure: This is generally regarded as a major weakness across all Strategies,
although there is an evident difference between urban and rural areas. Transport gets a
critical definition in the cities, while social (lack of and limited range of recreational
facilities) and environmental infrastructure (waste water and sewerage facilities) are the
main points of concern in rural areas.
• Employment: Employment is seen as a strength with opportunity regarding continued
investment by both indigenous and international investors.
• Education: This is seen as a strength generally, with opportunity attached through
lifelong learning developments.
• Social Inclusion: This area is seen as critical in all the SWOT analyses, and as posing a
major threat if the Boards and others fail to see through the delivery of the social inclusion
elements of their Strategies.
• Housing: A major weakness cited in the Strategies is the current condition of the housing
market and the difficulty in delivering on social housing. Housing is seen as an on-going
threat to the integrated development of the counties and cities.
• Environment: This area is seen as a strength, but with a large level of threat given
pressures arising from development.
34
• Information and Communication Technology: This is seen as one of the more significant
opportunities for all of the counties/cities.
• Culture: This is seen as a major opportunity, particularly in regard to the development of
separate county identities.
4.5 Regional or Other Patterns
No strong regional patterns are discernable regarding the audit of services, analysis of the
current socio-economic positions or the SWOT. Some patterns arise with regard to the
urban/rural differences, particularly levels of emphasis on differing types of infrastructure.
In the larger urban areas, transport is a key point for discussion. In rural areas, the lack of
social infrastructure and water supply is a clear concern. The perceptible differences are,
however, relatively minor, as is the approach taken to presentation.
4.6 Key Messages
• Analysis of the socio-economic situation presented a predictable picture, with emphasis
on demographic and socio-economic issues.
• Strengths of the areas frequently cited refer to community identity and voluntary effort,
quality of life issues, developing economic performance, good education facilities and
location.
• Weaknesses were poor infrastructure, along with demographic issues and in some cases
concerns with community facilities and support services.
35
SWOT Analysis
“Opportunities include tax incentives, the county’s natural resources and waterways,
tourism, location on the Dublin/Belfast border, increasing focus on community and voluntary
sector.”
Leitrim County Development Board
“Galway has many strengths from an economic standpoint. The current economic momentum
is characterised by high levels of employment, a strong indigenous sector and an established
tourist trade.”
Galway City Development Board
“To maximise potential of the formal mechanism that is in place for co-operation and
integration between member groups of the City Development Board.”
Cork City Development Board
• Systematic audits of service provision proved difficult, in turn making clear identification
of service gaps and/or overlaps difficult. This is an area which CDBs could usefully
revisit as part of their future work plans.
• No regional patterns are discernable regarding the audits of services, analyses of the
current positions or the SWOTs. Some patterns arise in relation to the urban/rural
differences particularly as regards to the level of emphasis on differing types of
infrastructure deficits. In rural areas the lack of social infrastructure (e.g. healthcare and
water) is a clear concern. The perceptible differences are relatively minor as is the
approach taken to presentation.
• Lack of recent and relevant data at county-level has hindered analysis, and needs to be
addressed.
36
5.1 Introduction
This chapter deals with the CDB Strategies’ development of a ‘shared vision’ for their
county/city areas and the subsequent setting of specific goals and objectives based on that
vision (i.e. Steps 5 and 6 of Figure 2.1).
The majority of CDBs linked their vision, goals and objectives, as shown in Figure 5.1.
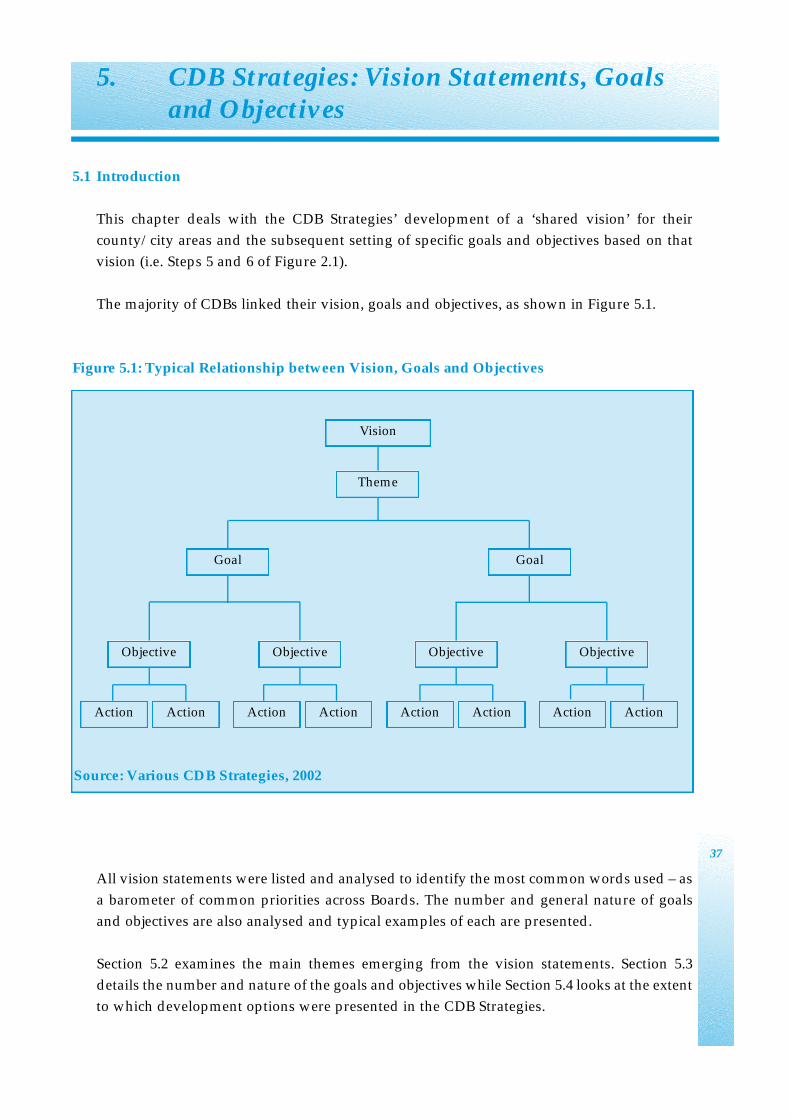
Figure 5.1: Typical Relationship between Vision, Goals and Objectives
All vision statements were listed and analysed to identify the most common words used – as
a barometer of common priorities across Boards. The number and general nature of goals
and objectives are also analysed and typical examples of each are presented.
Section 5.2 examines the main themes emerging from the vision statements. Section 5.3
details the number and nature of the goals and objectives while Section 5.4 looks at the extent
to which development options were presented in the CDB Strategies.
37
5. CDB Strategies: Vision Statements, Goals and Objectives
Source: Various CDB Strategies, 2002
Action Action Action Action Action Action Action Action
Objective Objective Objective Objective
Goal Goal
Vision
Theme
5.2 Vision Statements
The Guidelines on the preparation of the Strategies issued by the Task Force recommended
that CDBs develop an overall vision, i.e. a broad qualitative statement of their desired
destination, an answer to the question “where do we want to go?” This was seen as an
important unifying element, giving focus to the shared Strategy, and so in turn contributing
to the better service integration objective. (Reflecting this, the Task Force’s guidelines on the
Strategy preparation were entitled “A Shared Vision” – see Section 2.4).
The setting of the vision was to be based on the aspirations of the county/city and its
communities for the future. CDBs were advised to involve as many stakeholders as possible
in the setting of the overall vision.
Examples of vision statements are outlined in the text box below. Vision statements for all
CDBs are listed in Annex 2.
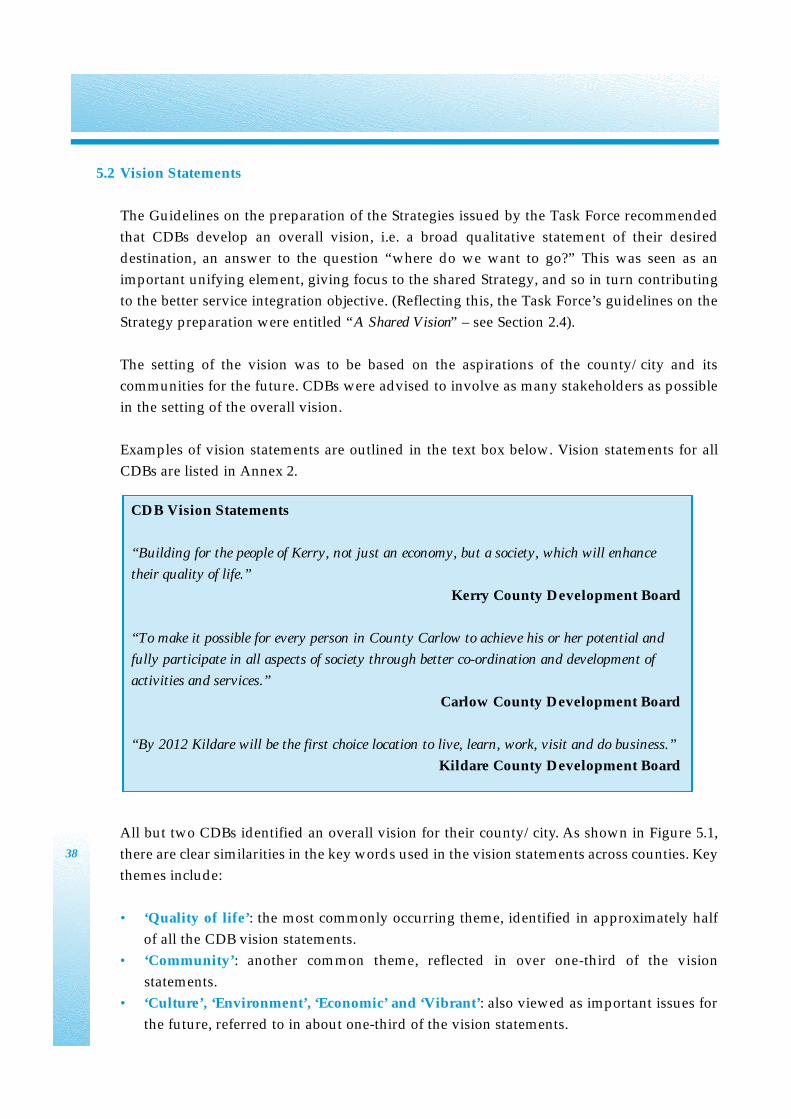
All but two CDBs identified an overall vision for their county/city. As shown in Figure 5.1,
there are clear similarities in the key words used in the vision statements across counties. Key
themes include:
• ‘Quality of life’: the most commonly occurring theme, identified in approximately half
of all the CDB vision statements.
• ‘ C o m m u n i t y ’: another common theme, reflected in over one-third of the vision
statements.
• ‘Culture’, ‘Environment’, ‘Economic’ and ‘Vibrant’: also viewed as important issues for
the future, referred to in about one-third of the vision statements.
38
CDB Vision Statements
“Building for the people of Kerry, not just an economy, but a society, which will enhance
their quality of life.”
Kerry County Development Board
“To make it possible for every person in County Carlow to achieve his or her potential and
fully participate in all aspects of society through better co-ordination and development of
activities and services.”
Carlow County Development Board
“By 2012 Kildare will be the first choice location to live, learn, work, visit and do business.”
Kildare County Development Board
Figure 5.2: Key Issues in the CDB Vision Statements
5.3 Goals and Objectives
5.3.1 Goals
In the Guidelines, CDBs were advised to develop goals and objectives - clear statements
of the ultimate aims at which the CDB wishes to arrive. They should contribute to the
overall vision. The Guidelines suggest that the goals should be measurable.
Goals are identified in over three-quarters of the Strategies. On average, there are 39 per
Strategy. However, there is quite a variation in the number of goals in individual
Strategies. As shown in Figure 5.3, in those Strategies where goals are identified, over half
have less than 30 goals, while around one-tenth have over 100 goals.
39
Note: For all the above words, with the exception of “Quality of Life”, some variations of the word may
have been counted, e.g. in the case of ‘Sustainable’, words such as “sustain”, and “sustainability”
have been included to bring the total to 8.
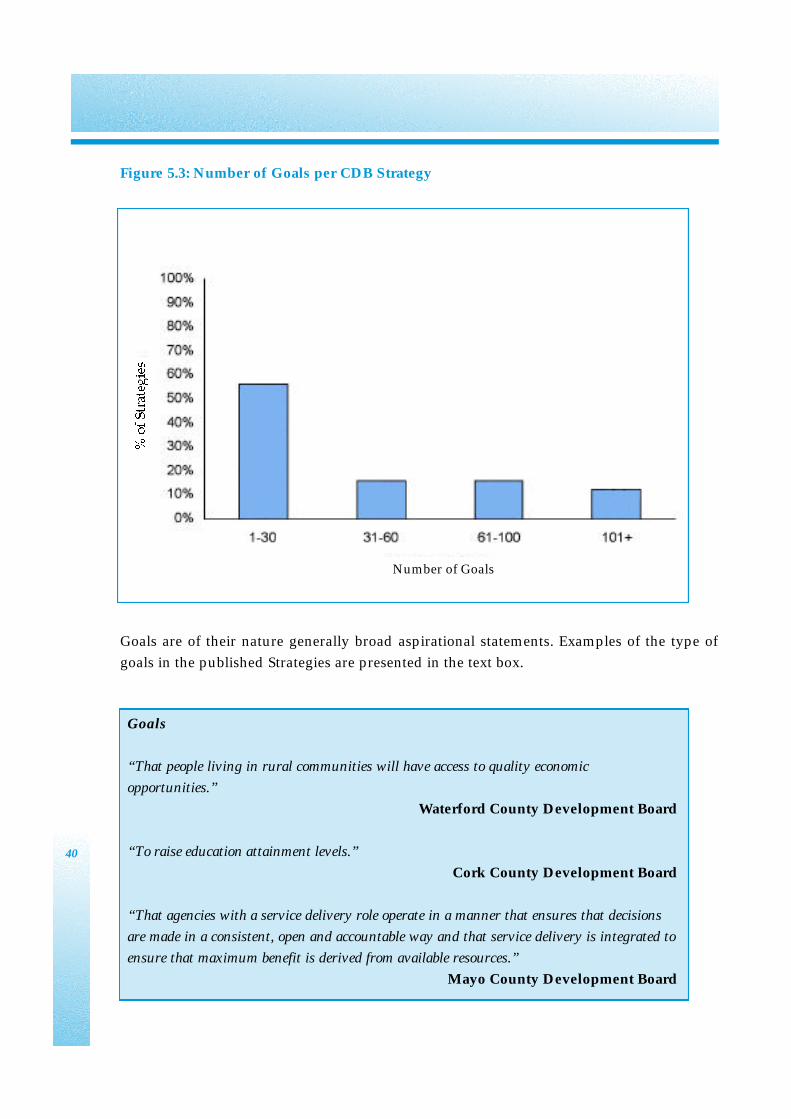
Figure 5.3: Number of Goals per CDB Strategy
Goals are of their nature generally broad aspirational statements. Examples of the type of
goals in the published Strategies are presented in the text box.
40
Goals
“That people living in rural communities will have access to quality economic
opportunities.”
Waterford County Development Board
“To raise education attainment levels.”
Cork County Development Board
“That agencies with a service delivery role operate in a manner that ensures that decisions
are made in a consistent, open and accountable way and that service delivery is integrated to
ensure that maximum benefit is derived from available resources.”
Mayo County Development Board
Number of Goals
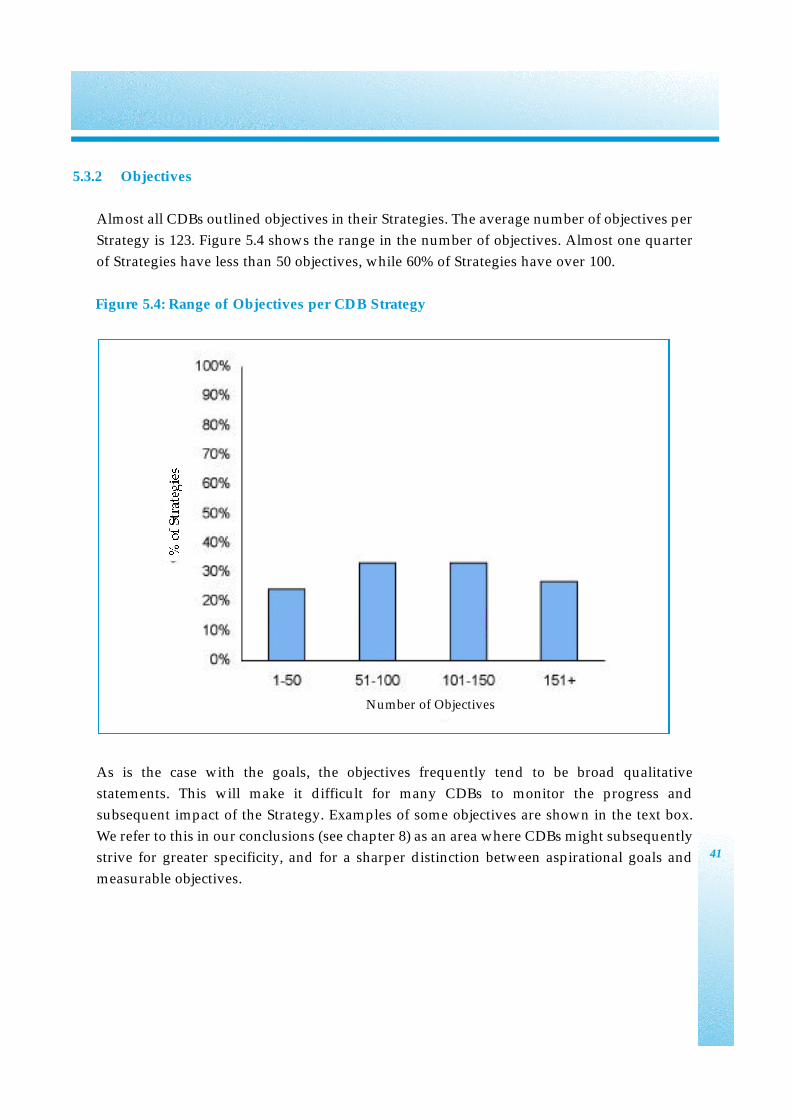
5.3.2 Objectives
Almost all CDBs outlined objectives in their Strategies. The average number of objectives per
Strategy is 123. Figure 5.4 shows the range in the number of objectives. Almost one quarter
of Strategies have less than 50 objectives, while 60% of Strategies have over 100.
Figure 5.4: Range of Objectives per CDB Strategy
As is the case with the goals, the objectives frequently tend to be broad qualitative
statements. This will make it difficult for many CDBs to monitor the progress and
subsequent impact of the Strategy. Examples of some objectives are shown in the text box.
We refer to this in our conclusions (see chapter 8) as an area where CDBs might subsequently
strive for greater specificity, and for a sharper distinction between aspirational goals and
measurable objectives.
41
Number of Objectives
5.4.Development Options
Step 6 of the suggested preparatory process involved the identification and selection of
options, i.e. alternative means by which CDBs might get to the desired goals and objectives.
In Step 6, CDBs were to have already detailed where they want to go by identifying the
vision, goals and objectives. Now, they were to select the approach or action they wish to
take to get there, given that there are different ways of meeting the same objective. This Step
was to give Board members an opportunity to think ‘laterally’ and perhaps adopt a new more
co-ordinated solution to the problem. The Guidelines suggest that Step 6 would require
heavy input from the Board itself and it was recommended that this be done through
structured brainstorming.
Generally, CDB Strategies did not outline development options. There may, however, have
been debate about what actions were needed to achieve the overall objectives, but this is not
recorded in the published documents. A few presented different development options
(approximately five) for each theme.
Limitations on Step 6 were the likelihood of having a menu of “bottom-up” proposed actions
as candidate solutions. It can also be said that serious thinking about alternative solutions is
not a feature of individual CDB member bodies. In retrospect, Step 6 was perhaps
unrealistically challenging. Nevertheless, it is also not one where the process should entirely
let itself “off the hook”.
42
Objectives
“To improve the physical, social and economic infrastructure of the smaller towns.”
Limerick County Development Board
“To promote the benefits of volunteering and encourage volunteerism in local communities.”
Louth County Development Board
“To provide an inter-agency approach to homelessness in Westmeath.”
Westmeath County Development Board
5.5. Key Messages
• Virtually all CDBs developed an overall vision for their county/city. Improved quality of
life is a key issue for many of the CDBs, while other key themes include community,
culture, environment and economy.
• There are a large number of goals and objectives, which are quite varied in their nature.
Generally, they are visionary and the targets are not quantified.
• CDBs did not generally include a “development options” section in the published
Strategy document, although aspects of this Step may have taken place during the
preparation process.
43
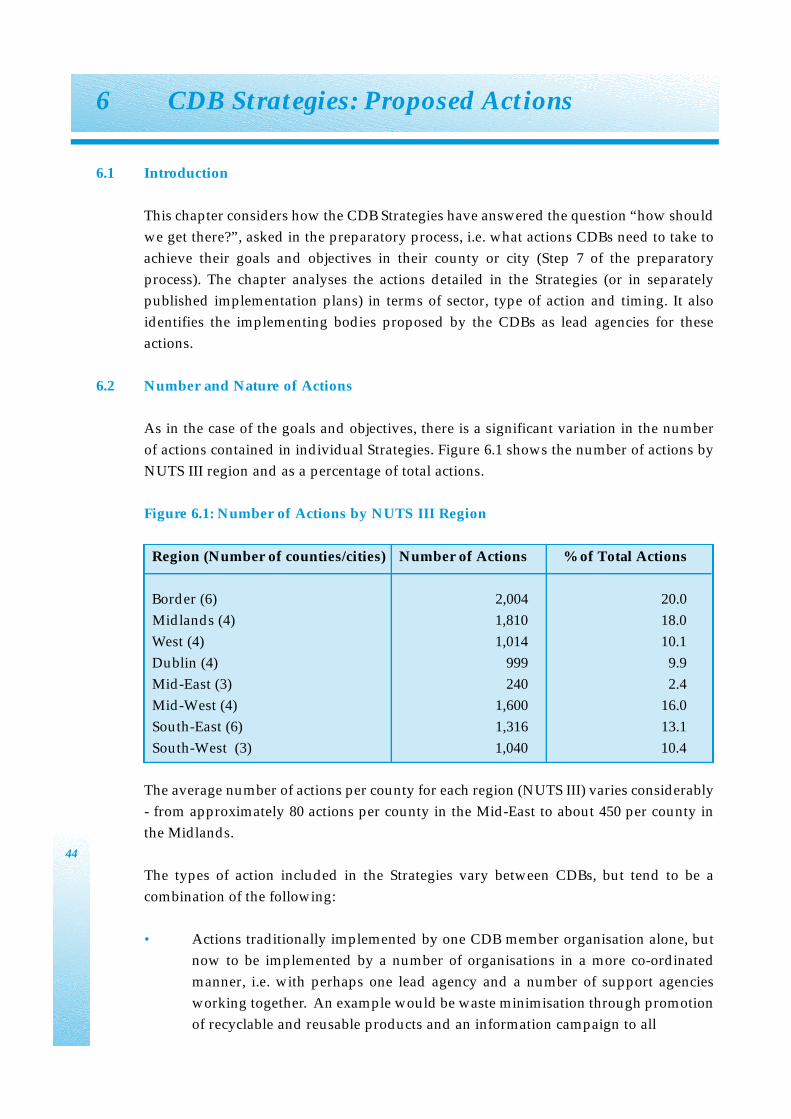
6.1 Introduction
This chapter considers how the CDB Strategies have answered the question “how should
we get there?”, asked in the preparatory process, i.e. what actions CDBs need to take to
achieve their goals and objectives in their county or city (Step 7 of the preparatory
process). The chapter analyses the actions detailed in the Strategies (or in separately
published implementation plans) in terms of sector, type of action and timing. It also
identifies the implementing bodies proposed by the CDBs as lead agencies for these
actions.
6.2 Number and Nature of Actions
As in the case of the goals and objectives, there is a significant variation in the number
of actions contained in individual Strategies. Figure 6.1 shows the number of actions by
NUTS III region and as a percentage of total actions.
Figure 6.1: Number of Actions by NUTS III Region
The average number of actions per county for each region (NUTS III) varies considerably
- from approximately 80 actions per county in the Mid-East to about 450 per county in
the Midlands.
The types of action included in the Strategies vary between CDBs, but tend to be a
combination of the following:
• Actions traditionally implemented by one CDB member organisation alone, but
now to be implemented by a number of organisations in a more co-ordinated
manner, i.e. with perhaps one lead agency and a number of support agencies
working together. An example would be waste minimisation through promotion
of recyclable and reusable products and an information campaign to all
6 CDB Strategies: Proposed Actions
44
Region (Number of counties/cities) Number of Actions % of Total Actions
Border (6) 2,004 20.0
Midlands (4) 1,810 18.0
West (4) 1,014 10.1
Dublin (4) 999 9.9
Mid-East (3) 240 2.4
Mid-West (4) 1,600 16.0
South-East (6) 1,316 13.1
South-West (3) 1,040 10.4
households on the need for waste recovery (led by the local authority and
supported by the community and voluntary sector, schools, environmental
g roups and local development agencies). Another example would be
establishing a multi-agency enterprise group facilitated to develop policy (led by
the County/City Enterprise Board and supported by Enterprise Ireland, the
Industrial Development Authority of Ireland, the Chamber of Commerce, and
the County Council Community Development Agency). A third example would
be to prepare a policy on estate management with implementing agencies
including the housing section of the county/city council, local development
groups, the health board, and the community forum).
• New pilot initiatives to fill identified gaps to be implemented by a number of
agencies e.g. to ensure the Gardaí and the Health Board have an input into a
schools programme outlining dangers of drug/alcohol abuse, which is delivered
by specially trained teachers (partner agencies – Department of Education and
Science, schools, an Gardaí Síochana, Health Board, Vocational Education
Committee), or re s e a rch models and introduce a pilot project on active
citizenship, including creating more awareness and understanding of public
issues, leading to increased participation in local democracy (led by county/city
council and supported by the Community and Voluntary Foru m ,
Partnerships/Community Groups and the town councils), or pre p a re a
comprehensive county/city energy policy plan to be developed, adapted and
implemented by the county/city council and the CDB (Energy Action Team,
Industrial Development Authority of Ireland, Teagasc, IBEC, Energy Centre,
Udárás).
• Actions already underway in one organisation, and which will continue to be so,
but which are nevertheless endorsed by the CDB as particularly important to
their vision, goals and objectives for their county/city. These, which are the
minority of action types across Boards as a whole, are typically in health services.
The actions in the Strategies are reasonably specific and many have quantified outputs
attributed to each action. The text box below shows examples of some actions e.g.
undertaking research, pilot initiative and consultations.
45

Some Strategies attempt to prioritise their actions based on agreed criteria. Examples
include one CDB that highlighted 12 key actions it felt were critical to the successful
implementation of its Strategy, and another which categorised its actions into three
different prioritisation levels: level 1 (actions that were likely to happen any way), level
2 (actions that require slight revision which can be achieved through co-ordinated effort),
and level 3 (actions where high level and strategic co-ordinated approaches are needed
if they are to be achieved).
6.3 Actions by Sector
Actions proposed in the 34 CDB Strategies can also be allocated to sectors based on
definitions used in the Strategies themselves i.e. if an action is under the economic sector
in a Strategy, it is recorded as an action under the economic sector for the purposes of this
analysis. The text box below shows examples of actions from two sectors.
46
Examples of CDB Actions
“To undertake research, by 2003, into what the people of Fingal want in terms of parks, open
spaces, recreational and community facilities.”
Fingal County Development Board
“pilot a self-build initiative for young people out of home or at risk of homelessness”
South Dublin County Development Board
“consult with minority groups such as asylum seekers, refugees, migrant workers,
ethnic/religious minorities, etc to design and deliver a plan to promote inclusion of their
cultures in the county”
South Tipperary County Development Board
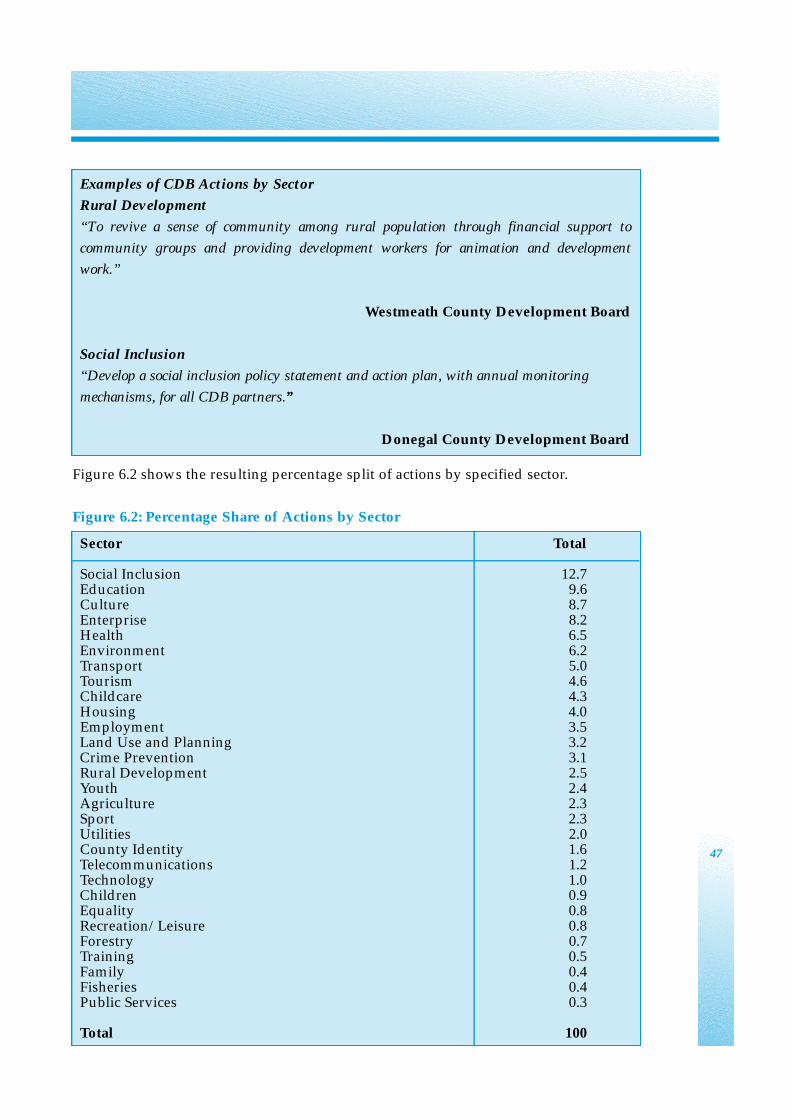
Figure 6.2 shows the resulting percentage split of actions by specified sector.
Figure 6.2: Percentage Share of Actions by Sector
47
Examples of CDB Actions by Sector
Rural Development
“To revive a sense of community among rural population through financial support to
community groups and providing development workers for animation and development
work.”
Westmeath County Development Board
Social Inclusion
“Develop a social inclusion policy statement and action plan, with annual monitoring
mechanisms, for all CDB partners.”
Donegal County Development Board
Sector Total
Social Inclusion 12.7Education 9.6Culture 8.7Enterprise 8.2Health 6.5Environment 6.2Transport 5.0Tourism 4.6Childcare 4.3Housing 4.0Employment 3.5Land Use and Planning 3.2Crime Prevention 3.1Rural Development 2.5Youth 2.4Agriculture 2.3Sport 2.3Utilities 2.0County Identity 1.6Telecommunications 1.2Technology 1.0Children 0.9Equality 0.8Recreation/Leisure 0.8Forestry 0.7Training 0.5Family 0.4Fisheries 0.4Public Services 0.3
Total 100

Almost 13% of all actions thus classified related to social inclusion. Other sectors that
scored relatively high are education (10%), culture (9%) and enterprise (8%). Sectors such
as fisheries, forestry, family and training have a lower percentage share of the actions.
Low percentage shares may, however, still involve considerable numbers of actions in an
absolute sense.
There are no significant differences in the allocation of actions by sector across CDBs in
the NUTS III regions, although there are slight variations in certain sectors such as
education, childcare and rural development.
6.4 Actions Targeted at Social Inclusion
CDBs were proposed by the Interdepartmental Task Force on the Integration of Local
Government and Local Development Systems as the appropriate structure to have a
specific role in relation to local co-ordination of social inclusion measures, initially in the
context of the National Development Plan (NDP) and subsequently in relation to all
social inclusion activity at county/city level. In practice, this has involved the CDBs in a
more detailed assessment of the level of co-ordination of social inclusion activities at
local level and identifying gaps and overlaps in this sector.
Figure 6.2 has already shown the percentage share of the total actions outlined in the
Strategies that relate exclusively to social inclusion as a defined sector in its own right
(and described as such in the Strategies). However, many actions in other sectors may
also relate to social inclusion, as shown in Figure 6.3.
Figure 6.3: Percentage Share of Total Actions Relating to Social Inclusion
48
Note: Social Inclusion actions are those defined as social inclusion in the Strategy documents. OtherSocial Inclusion actions are those allocated to another sector, but it states in the action that itis targeted at a disadvantaged group.
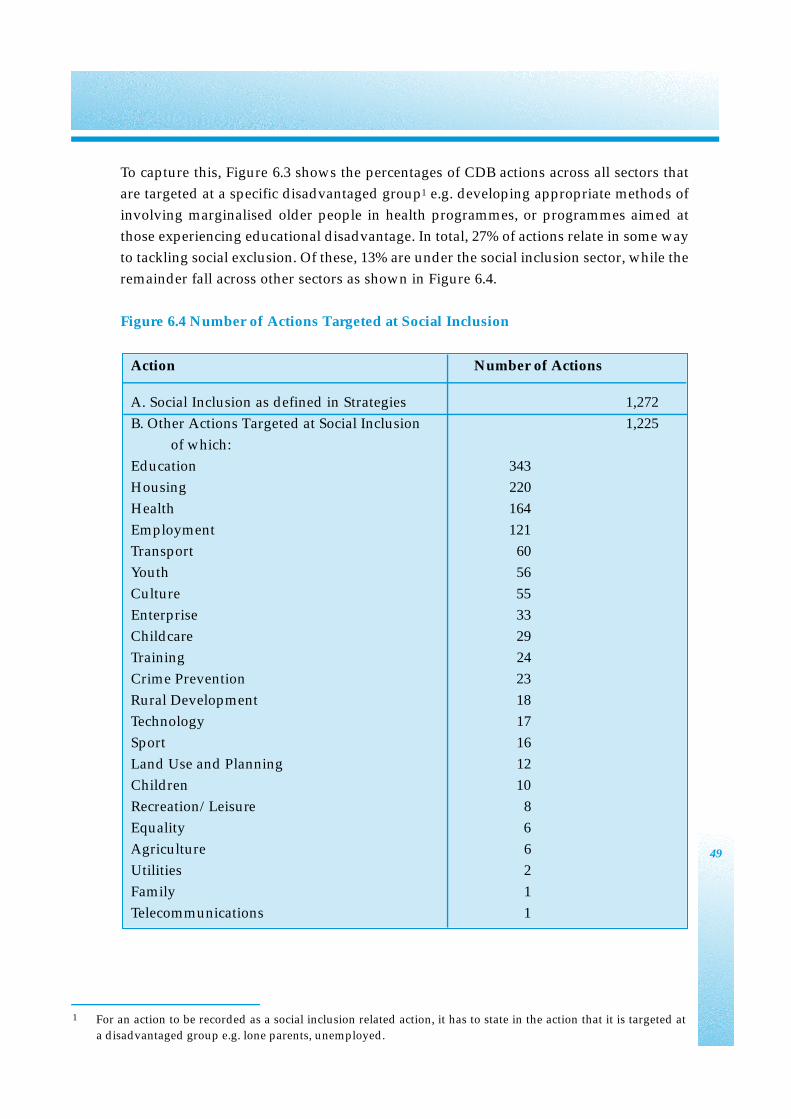
To capture this, Figure 6.3 shows the percentages of CDB actions across all sectors that
are targeted at a specific disadvantaged group1 e.g. developing appropriate methods of
involving marginalised older people in health programmes, or programmes aimed at
those experiencing educational disadvantage. In total, 27% of actions relate in some way
to tackling social exclusion. Of these, 13% are under the social inclusion sector, while the
remainder fall across other sectors as shown in Figure 6.4.
Figure 6.4 Number of Actions Targeted at Social Inclusion
49
1 For an action to be recorded as a social inclusion related action, it has to state in the action that it is targeted ata disadvantaged group e.g. lone parents, unemployed.
Action Number of Actions
A. Social Inclusion as defined in Strategies 1,272
B. Other Actions Targeted at Social Inclusion 1,225
of which:
Education 343
Housing 220
Health 164
Employment 121
Transport 60
Youth 56
Culture 55
Enterprise 33
Childcare 29
Training 24
Crime Prevention 23
Rural Development 18
Technology 17
Sport 16
Land Use and Planning 12
Children 10
Recreation/Leisure 8
Equality 6
Agriculture 6
Utilities 2
Family 1
Telecommunications 1
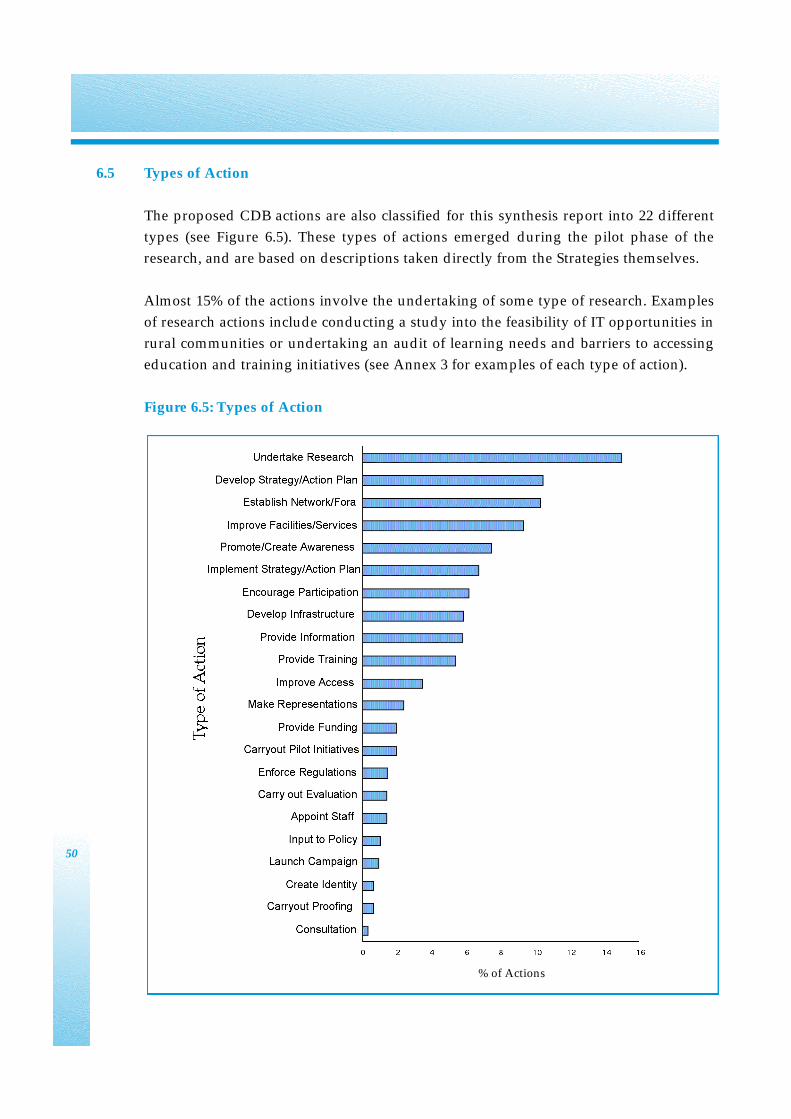
6.5 Types of Action
The proposed CDB actions are also classified for this synthesis report into 22 different
types (see Figure 6.5). These types of actions emerged during the pilot phase of the
research, and are based on descriptions taken directly from the Strategies themselves.
Almost 15% of the actions involve the undertaking of some type of research. Examples
of research actions include conducting a study into the feasibility of IT opportunities in
rural communities or undertaking an audit of learning needs and barriers to accessing
education and training initiatives (see Annex 3 for examples of each type of action).
Figure 6.5: Types of Action
50
% of Actions

Developing a strategy/action plan accounts for approximately 10% of the actions, while
a further 10% involve establishing a network or forum. Roughly 9% of actions in the
Strategies involve improving existing services or facilities, e.g. increasing the frequency
of trains between certain centres.
Actions are therefore skewed towards the “softer” variety of research, planning,
networking. However, given the nature of the CDBs, this is perhaps both inevitable and
correct. The Boards are not new separate implementing agencies. They are designed
primarily to improve working relationships between their existing members with a view
to better joined-up delivery of services at local level.
51
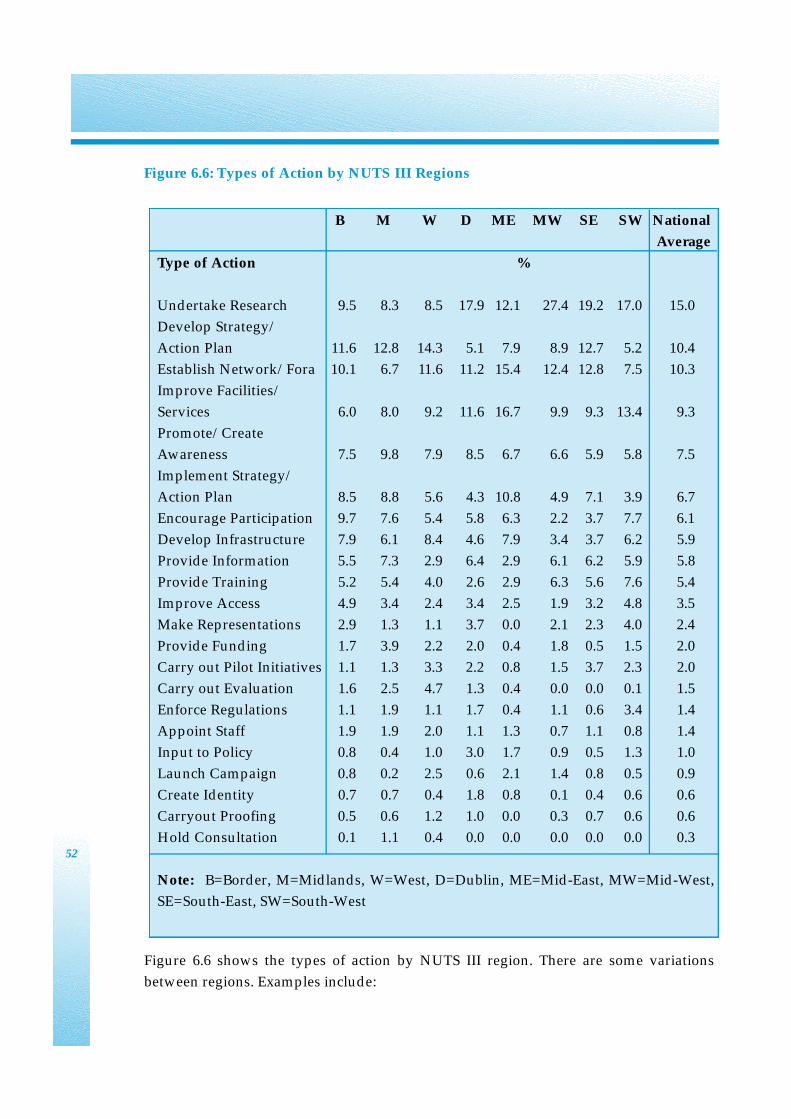
Figure 6.6: Types of Action by NUTS III Regions
Figure 6.6 shows the types of action by NUTS III region. There are some variations
between regions. Examples include:
52
B M W D ME MW SE SW National
Average
Type of Action %
Undertake Research 9.5 8.3 8.5 17.9 12.1 27.4 19.2 17.0 15.0
Develop Strategy/
Action Plan 11.6 12.8 14.3 5.1 7.9 8.9 12.7 5.2 10.4
Establish Network/Fora 10.1 6.7 11.6 11.2 15.4 12.4 12.8 7.5 10.3
Improve Facilities/
Services 6.0 8.0 9.2 11.6 16.7 9.9 9.3 13.4 9.3
Promote/Create
Awareness 7.5 9.8 7.9 8.5 6.7 6.6 5.9 5.8 7.5
Implement Strategy/
Action Plan 8.5 8.8 5.6 4.3 10.8 4.9 7.1 3.9 6.7
Encourage Participation 9.7 7.6 5.4 5.8 6.3 2.2 3.7 7.7 6.1
Develop Infrastructure 7.9 6.1 8.4 4.6 7.9 3.4 3.7 6.2 5.9
Provide Information 5.5 7.3 2.9 6.4 2.9 6.1 6.2 5.9 5.8
Provide Training 5.2 5.4 4.0 2.6 2.9 6.3 5.6 7.6 5.4
Improve Access 4.9 3.4 2.4 3.4 2.5 1.9 3.2 4.8 3.5
Make Representations 2.9 1.3 1.1 3.7 0.0 2.1 2.3 4.0 2.4
Provide Funding 1.7 3.9 2.2 2.0 0.4 1.8 0.5 1.5 2.0
Carry out Pilot Initiatives 1.1 1.3 3.3 2.2 0.8 1.5 3.7 2.3 2.0
Carry out Evaluation 1.6 2.5 4.7 1.3 0.4 0.0 0.0 0.1 1.5
Enforce Regulations 1.1 1.9 1.1 1.7 0.4 1.1 0.6 3.4 1.4
Appoint Staff 1.9 1.9 2.0 1.1 1.3 0.7 1.1 0.8 1.4
Input to Policy 0.8 0.4 1.0 3.0 1.7 0.9 0.5 1.3 1.0
Launch Campaign 0.8 0.2 2.5 0.6 2.1 1.4 0.8 0.5 0.9
Create Identity 0.7 0.7 0.4 1.8 0.8 0.1 0.4 0.6 0.6
Carryout Proofing 0.5 0.6 1.2 1.0 0.0 0.3 0.7 0.6 0.6
Hold Consultation 0.1 1.1 0.4 0.0 0.0 0.0 0.0 0.0 0.3
Note: B=Border, M=Midlands, W=West, D=Dublin, ME=Mid-East, MW=Mid-West,
SE=South-East, SW=South-West
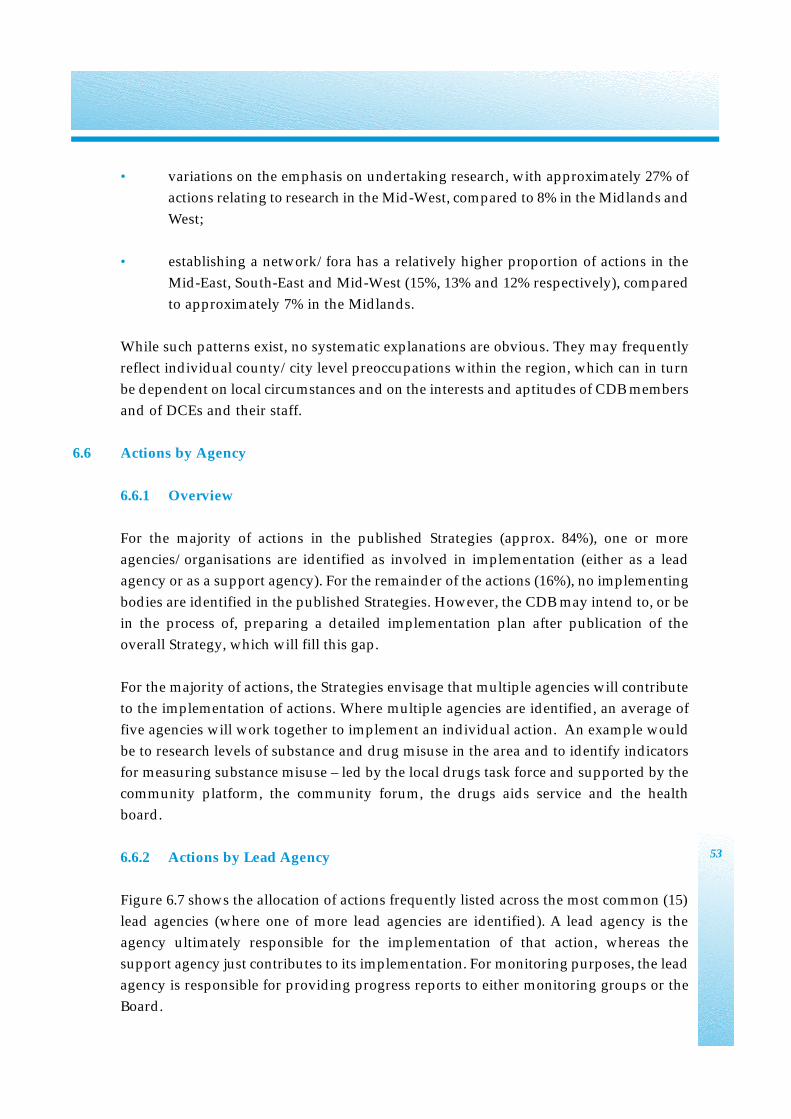
• variations on the emphasis on undertaking research, with approximately 27% of
actions relating to research in the Mid-West, compared to 8% in the Midlands and
West;
• establishing a network/fora has a relatively higher proportion of actions in the
Mid-East, South-East and Mid-West (15%, 13% and 12% respectively), compared
to approximately 7% in the Midlands.
While such patterns exist, no systematic explanations are obvious. They may frequently
reflect individual county/city level preoccupations within the region, which can in turn
be dependent on local circumstances and on the interests and aptitudes of CDB members
and of DCEs and their staff.
6.6 Actions by Agency
6.6.1 Overview
For the majority of actions in the published Strategies (approx. 84%), one or more
agencies/organisations are identified as involved in implementation (either as a lead
agency or as a support agency). For the remainder of the actions (16%), no implementing
bodies are identified in the published Strategies. However, the CDB may intend to, or be
in the process of, preparing a detailed implementation plan after publication of the
overall Strategy, which will fill this gap.
For the majority of actions, the Strategies envisage that multiple agencies will contribute
to the implementation of actions. Where multiple agencies are identified, an average of
five agencies will work together to implement an individual action. An example would
be to research levels of substance and drug misuse in the area and to identify indicators
for measuring substance misuse – led by the local drugs task force and supported by the
community platform, the community forum, the drugs aids service and the health
board.
6.6.2 Actions by Lead Agency
Figure 6.7 shows the allocation of actions frequently listed across the most common (15)
lead agencies (where one of more lead agencies are identified). A lead agency is the
agency ultimately responsible for the implementation of that action, whereas the
support agency just contributes to its implementation. For monitoring purposes, the lead
agency is responsible for providing progress reports to either monitoring groups or the
Board.
53
As shown, the local authorities are the lead (or one of the lead agencies) on 33% of the
actions, a reflection of the multi-purpose responsibilities of the local authorities and their
lead role in the CDBs. The CDBs lead on approximately 26% of actions. CDBs were
identified as lead agency for some actions in the published Strategies, but now are in the
process of identifying alternative lead agencies for some of these actions. The actions on
which they are leading generally involve undertaking research, improving access or
establishing a network/forum.
Figure 6.7: Agencies/Organisations that appear most frequently as Lead Agency in
CDB Actions
The type of action for which each agency is responsible is broadly the same as the overall
pattern. A relatively high proportion of actions relating to undertaking research,
developing and implementing strategies/action plans and establishing networks
continues to apply at agency level. However, a number of agencies deviate slightly from
the broad pattern, with a relatively higher proportion of actions falling into their typical
type of work e.g. providing training for Teagasc, improving services for the health
boards, developing infrastructure for the local authorities.
54
Note: Partnership/Community and LEADER Groups have been combined because in cases where anorganisation administers a number of programmes (LEADER+, National Mainstream and theLocal Development Social Inclusion Programme), it was not possible to determine whichprogramme the action is funded under.
Partnership/LEADER
CDB
Health Board
VEC
Ad hoc groups/Fora
FÁS
CEB
Teagasc
County Childcare Committee
Enterprise Ireland
Gardaí
Third Level College
Regional Tourism Authority
Dept Social and Family Affairs
Local Authorities
3,0002,5002,0001,5001,0005000
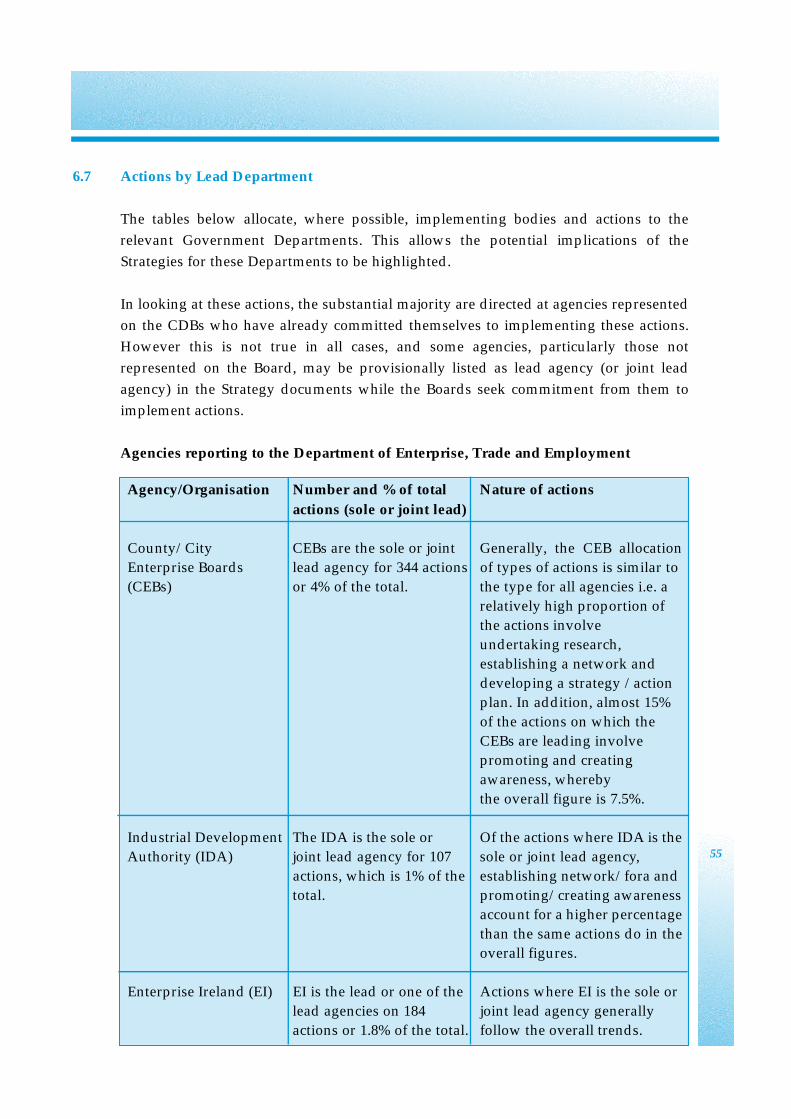
6.7 Actions by Lead Department
The tables below allocate, where possible, implementing bodies and actions to the
relevant Government Departments. This allows the potential implications of the
Strategies for these Departments to be highlighted.
In looking at these actions, the substantial majority are directed at agencies represented
on the CDBs who have already committed themselves to implementing these actions.
However this is not true in all cases, and some agencies, particularly those not
represented on the Board, may be provisionally listed as lead agency (or joint lead
agency) in the Strategy documents while the Boards seek commitment from them to
implement actions.
Agencies reporting to the Department of Enterprise, Trade and Employment
55
Agency/Organisation Number and % of total Nature of actions
actions (sole or joint lead)
County/City CEBs are the sole or joint Generally, the CEB allocationEnterprise Boards lead agency for 344 actions of types of actions is similar to (CEBs) or 4% of the total. the type for all agencies i.e. a
relatively high proportion of the actions involveundertaking research, establishing a network and developing a strategy /action plan. In addition, almost 15% of the actions on which the CEBs are leading involve promoting and creating awareness, whereby the overall figure is 7.5%.
Industrial Development The IDA is the sole or Of the actions where IDA is the Authority (IDA) joint lead agency for 107 sole or joint lead agency,
actions, which is 1% of the establishing network/fora and total. promoting/creating awareness
account for a higher percentagethan the same actions do in the overall figures.
Enterprise Ireland (EI) EI is the lead or one of the Actions where EI is the sole or lead agencies on 184 joint lead agency generally actions or 1.8% of the total. follow the overall trends.
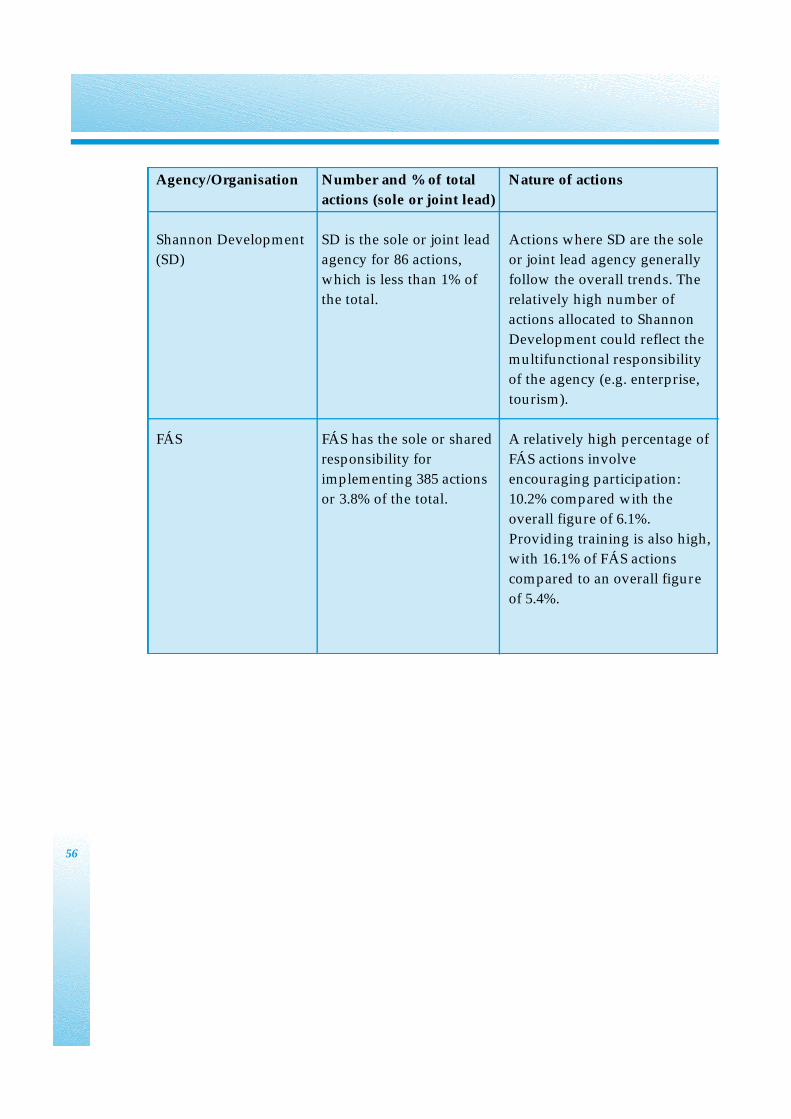
56
Agency/Organisation Number and % of total Nature of actions
actions (sole or joint lead)
Shannon Development SD is the sole or joint lead Actions where SD are the sole
(SD) agency for 86 actions, or joint lead agency generally
which is less than 1% of follow the overall trends. The
the total. relatively high number of
actions allocated to Shannon
Development could reflect the
multifunctional responsibility
of the agency (e.g. enterprise,
tourism).
FÁS FÁS has the sole or shared A relatively high percentage of
responsibility for FÁS actions involve
implementing 385 actions encouraging participation:
or 3.8% of the total. 10.2% compared with the
overall figure of 6.1%.
Providing training is also high,
with 16.1% of FÁS actions
compared to an overall figure
of 5.4%.
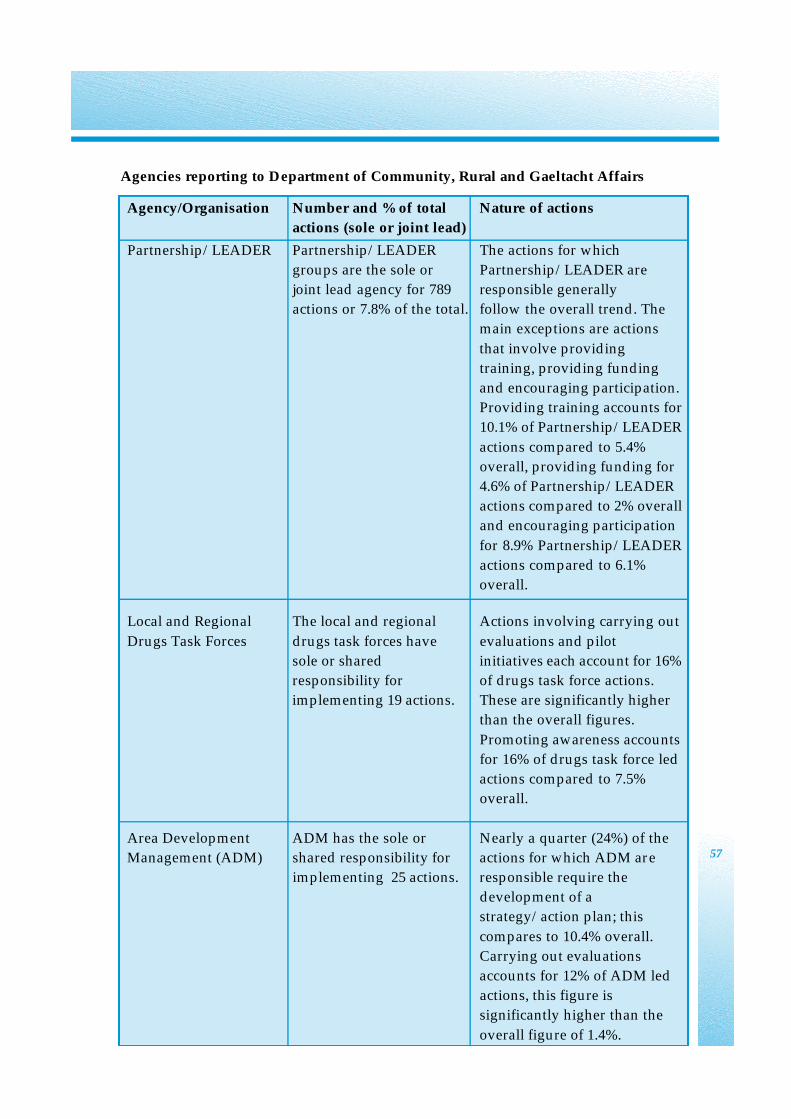
Agencies reporting to Department of Community, Rural and Gaeltacht Affairs
57
Agency/Organisation Number and % of total Nature of actions actions (sole or joint lead)
Partnership/LEADER Partnership/LEADER The actions for which groups are the sole or Partnership/LEADER arejoint lead agency for 789 responsible generally actions or 7.8% of the total. follow the overall trend. The
main exceptions are actions
that involve providing training, providing funding and encouraging participation. Providing training accounts for10.1% of Partnership/LEADER
actions compared to 5.4% overall, providing funding for 4.6% of Partnership/LEADER actions compared to 2% overalland encouraging participation
for 8.9% Partnership/LEADERactions compared to 6.1% overall.
Local and Regional The local and regional Actions involving carrying out
Drugs Task Forces drugs task forces have evaluations and pilot sole or shared initiatives each account for 16% responsibility for of drugs task force actions. implementing 19 actions. These are significantly higher
than the overall figures.
Promoting awareness accounts for 16% of drugs task force led actions compared to 7.5% overall.
Area Development ADM has the sole or Nearly a quarter (24%) of the Management (ADM) shared responsibility for actions for which ADM are
implementing 25 actions. responsible require the development of a strategy/action plan; this
compares to 10.4% overall. Carrying out evaluations accounts for 12% of ADM led actions, this figure is significantly higher than the
overall figure of 1.4%.
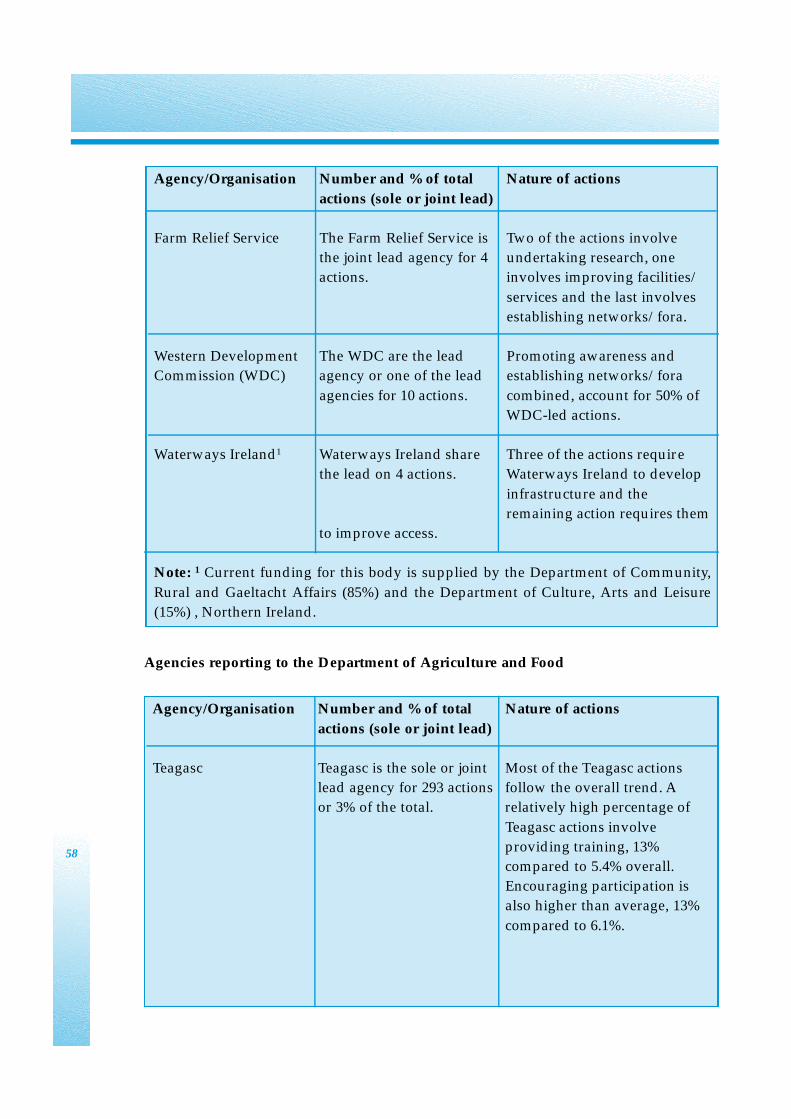
Agencies reporting to the Department of Agriculture and Food
58
Agency/Organisation Number and % of total Nature of actions
actions (sole or joint lead)
Farm Relief Service The Farm Relief Service is Two of the actions involve the joint lead agency for 4 undertaking research, one actions. involves improving facilities/
services and the last involves establishing networks/fora.
Western Development The WDC are the lead Promoting awareness and Commission (WDC) agency or one of the lead establishing networks/fora
agencies for 10 actions. combined, account for 50% of WDC-led actions.
Waterways Ireland1 Waterways Ireland share Three of the actions requirethe lead on 4 actions. Waterways Ireland to develop
infrastructure and the remaining action requires them
to improve access.
Note: 1 Current funding for this body is supplied by the Department of Community,
Rural and Gaeltacht Affairs (85%) and the Department of Culture, Arts and Leisure(15%) , Northern Ireland.
Agency/Organisation Number and % of total Nature of actions
actions (sole or joint lead)
Teagasc Teagasc is the sole or joint Most of the Teagasc actions lead agency for 293 actions follow the overall trend. Aor 3% of the total. relatively high percentage of
Teagasc actions involve providing training, 13% compared to 5.4% overall. Encouraging participation is also higher than average, 13%
compared to 6.1%.
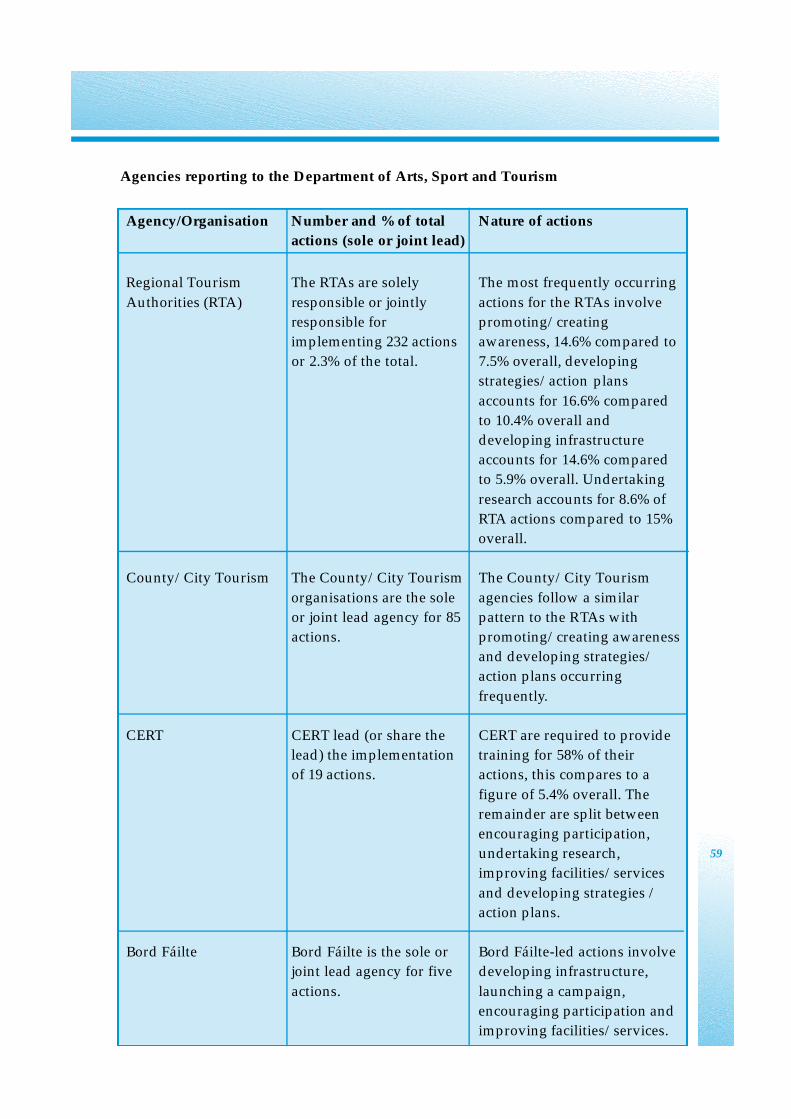
Agencies reporting to the Department of Arts, Sport and Tourism
59
Agency/Organisation Number and % of total Nature of actions actions (sole or joint lead)
Regional Tourism The RTAs are solely The most frequently occurring
Authorities (RTA) responsible or jointly actions for the RTAs involve responsible for promoting/creating implementing 232 actions awareness, 14.6% compared to or 2.3% of the total. 7.5% overall, developing
strategies/action plans
accounts for 16.6% compared to 10.4% overall and developing infrastructureaccounts for 14.6% compared to 5.9% overall. Undertaking
research accounts for 8.6% of RTA actions compared to 15% overall.
County/City Tourism The County/City Tourism The County/City Tourism
organisations are the sole agencies follow a similar or joint lead agency for 85 pattern to the RTAs with actions. promoting/creating awareness
and developing strategies/ action plans occurring
frequently.
CERT CERT lead (or share the CERT are required to provide lead) the implementation training for 58% of their of 19 actions. actions, this compares to a
figure of 5.4% overall. The remainder are split between encouraging participation, undertaking research, improving facilities/services
and developing strategies /action plans.
Bord Fáilte Bord Fáilte is the sole or Bord Fáilte-led actions involvejoint lead agency for five developing infrastructure,
actions. launching a campaign, encouraging participation and improving facilities/services.
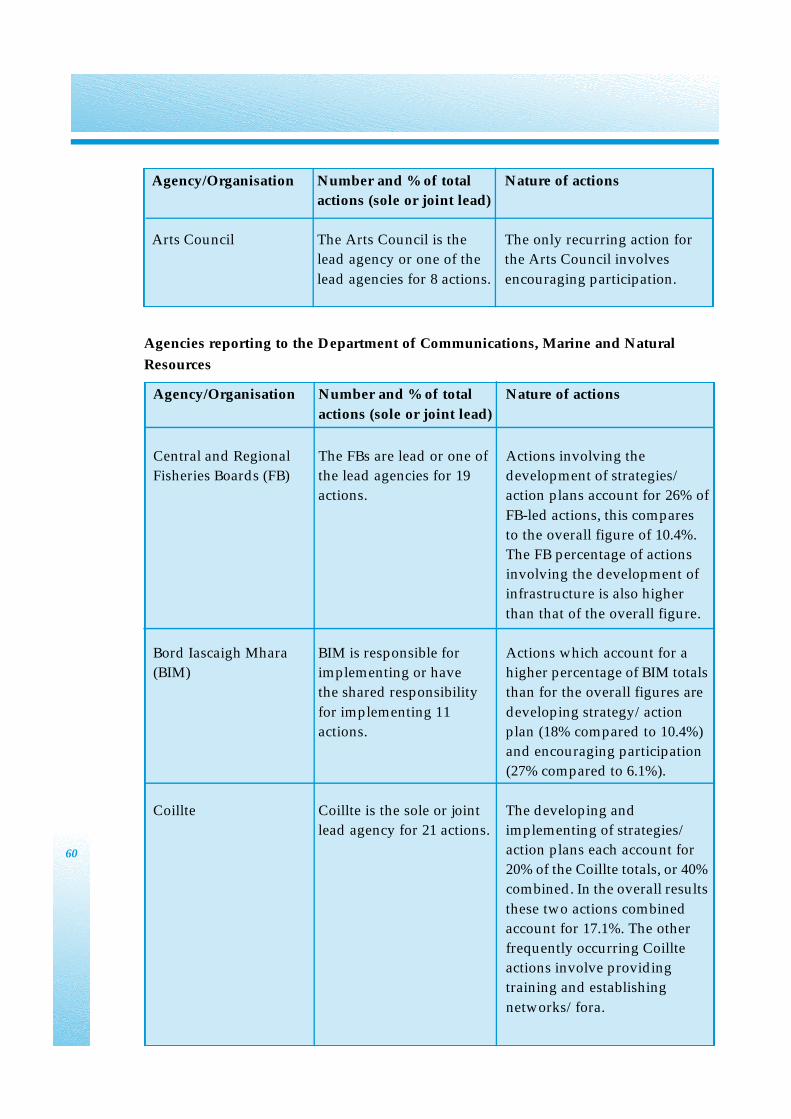
Agencies reporting to the Department of Communications, Marine and Natural
Resources
60
Agency/Organisation Number and % of total Nature of actions actions (sole or joint lead)
Arts Council The Arts Council is the The only recurring action for lead agency or one of the the Arts Council involves
lead agencies for 8 actions. encouraging participation.
Agency/Organisation Number and % of total Nature of actions
actions (sole or joint lead)
Central and Regional The FBs are lead or one of Actions involving the Fisheries Boards (FB) the lead agencies for 19 development of strategies/
actions. action plans account for 26% of
FB-led actions, this compares to the overall figure of 10.4%. The FB percentage of actions involving the development of infrastructure is also higher
than that of the overall figure.
Bord Iascaigh Mhara BIM is responsible for Actions which account for a (BIM) implementing or have higher percentage of BIM totals
the shared responsibility than for the overall figures are
for implementing 11 developing strategy/action actions. plan (18% compared to 10.4%)
and encouraging participation (27% compared to 6.1%).
Coillte Coillte is the sole or joint The developing and lead agency for 21 actions. implementing of strategies/
action plans each account for 20% of the Coillte totals, or 40%combined. In the overall results
these two actions combined account for 17.1%. The other frequently occurring Coillte actions involve providing training and establishing
networks/fora.
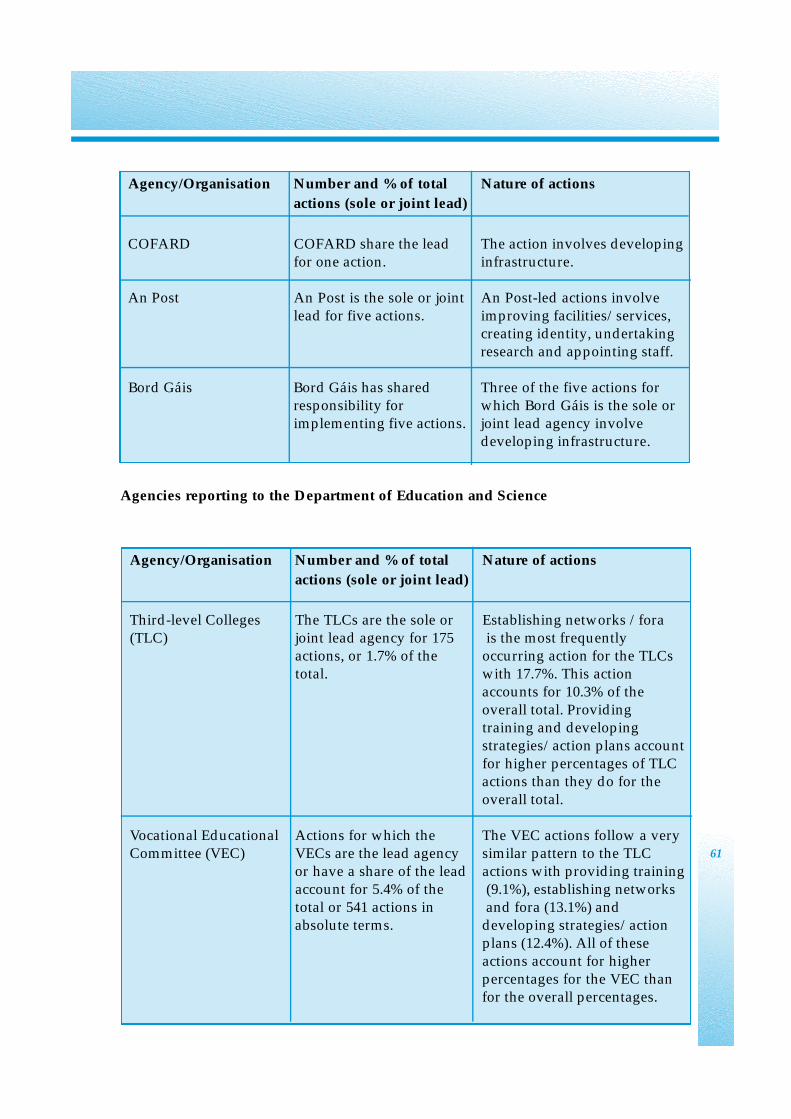
Agencies reporting to the Department of Education and Science
61
Agency/Organisation Number and % of total Nature of actions actions (sole or joint lead)
COFARD COFARD share the lead The action involves developing for one action. infrastructure.
An Post An Post is the sole or joint An Post-led actions involve lead for five actions. improving facilities/services,
creating identity, undertaking research and appointing staff.
Bord Gáis Bord Gáis has shared Three of the five actions for responsibility for which Bord Gáis is the sole or implementing five actions. joint lead agency involve
developing infrastructure.
Agency/Organisation Number and % of total Nature of actions actions (sole or joint lead)
Third-level Colleges The TLCs are the sole or Establishing networks /fora(TLC) joint lead agency for 175 is the most frequently
actions, or 1.7% of the occurring action for the TLCs total. with 17.7%. This action
accounts for 10.3% of the overall total. Providing training and developing strategies/action plans accountfor higher percentages of TLC actions than they do for the overall total.
Vocational Educational Actions for which the The VEC actions follow a veryCommittee (VEC) VECs are the lead agency similar pattern to the TLC
or have a share of the lead actions with providing trainingaccount for 5.4% of the (9.1%), establishing networkstotal or 541 actions in and fora (13.1%) andabsolute terms. developing strategies/action
plans (12.4%). All of these actions account for higher percentages for the VEC than for the overall percentages.
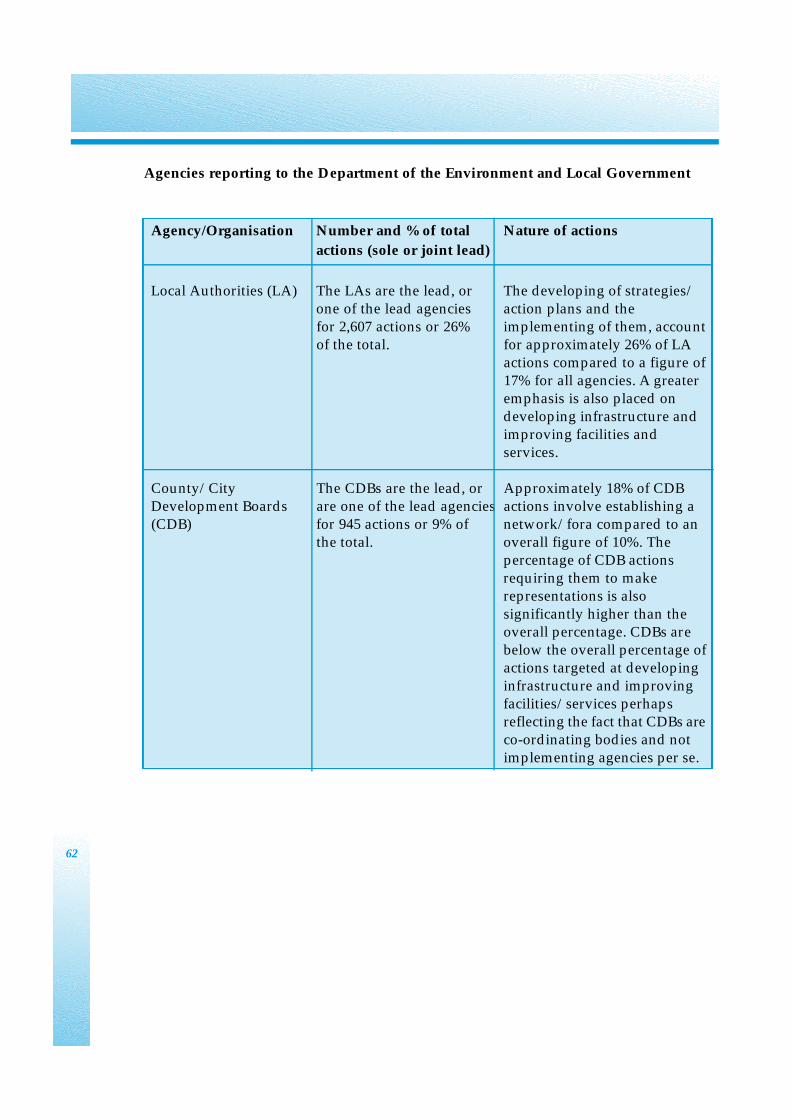
Agencies reporting to the Department of the Environment and Local Government
62
Agency/Organisation Number and % of total Nature of actions actions (sole or joint lead)
Local Authorities (LA) The LAs are the lead, or The developing of strategies/one of the lead agencies action plans and the for 2,607 actions or 26% implementing of them, account of the total. for approximately 26% of LA
actions compared to a figure of 17% for all agencies. A greater emphasis is also placed on developing infrastructure and improving facilities and services.
County/City The CDBs are the lead, or Approximately 18% of CDB Development Boards are one of the lead agencies actions involve establishing a (CDB) for 945 actions or 9% of network/fora compared to an
the total. overall figure of 10%. The percentage of CDB actions requiring them to make representations is also significantly higher than the overall percentage. CDBs arebelow the overall percentage ofactions targeted at developing infrastructure and improving facilities/services perhaps reflecting the fact that CDBs areco-ordinating bodies and not implementing agencies per se.
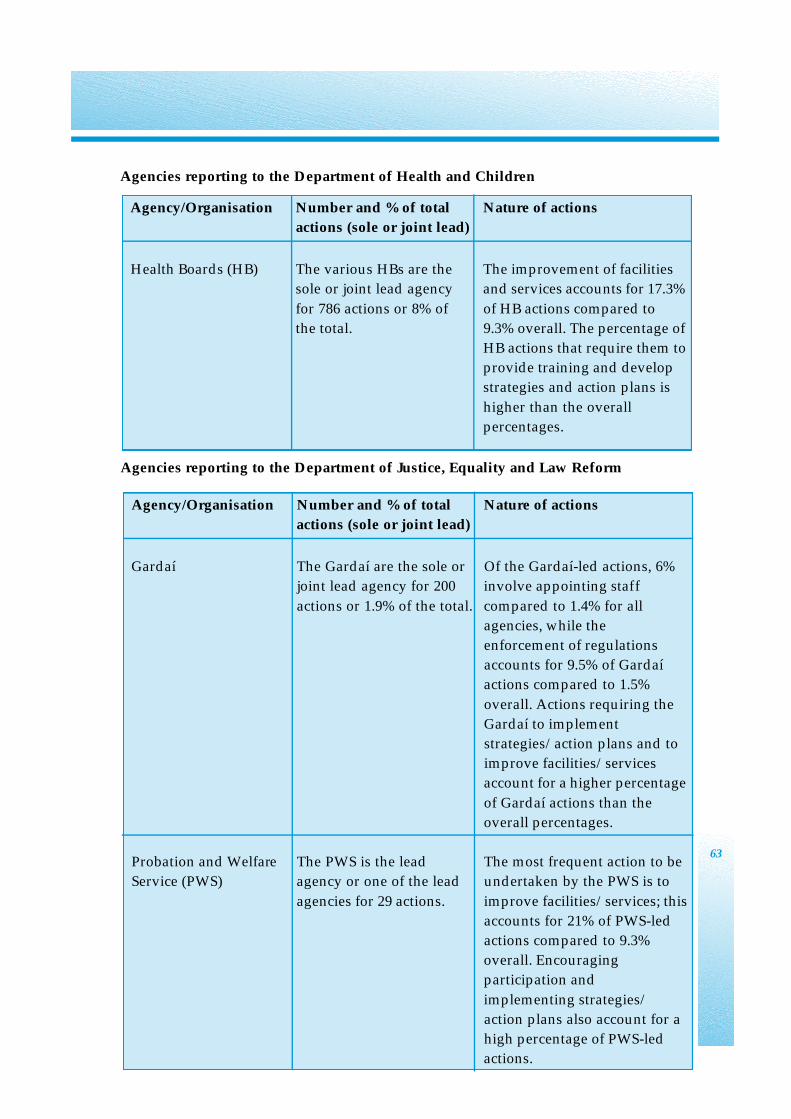
Agencies reporting to the Department of Health and Children
Agencies reporting to the Department of Justice, Equality and Law Reform
63
Agency/Organisation Number and % of total Nature of actions actions (sole or joint lead)
Health Boards (HB) The various HBs are the The improvement of facilities sole or joint lead agency and services accounts for 17.3%
for 786 actions or 8% of of HB actions compared to the total. 9.3% overall. The percentage of
HB actions that require them toprovide training and develop strategies and action plans is
higher than the overall percentages.
Agency/Organisation Number and % of total Nature of actions actions (sole or joint lead)
Gardaí The Gardaí are the sole or Of the Gardaí-led actions, 6% joint lead agency for 200 involve appointing staff
actions or 1.9% of the total. compared to 1.4% for all agencies, while the enforcement of regulations accounts for 9.5% of Gardaí actions compared to 1.5%
overall. Actions requiring the Gardaí to implement strategies/action plans and to improve facilities/services account for a higher percentage
of Gardaí actions than the overall percentages.
Probation and Welfare The PWS is the lead The most frequent action to be Service (PWS) agency or one of the lead undertaken by the PWS is to
agencies for 29 actions. improve facilities/services; thisaccounts for 21% of PWS-led actions compared to 9.3% overall. Encouraging participation and
implementing strategies/ action plans also account for a high percentage of PWS-led actions.

Agencies reporting to the Department of Social and Family Affairs
64
Agency/Organisation Number and % of total Nature of actions
actions (sole or joint lead)
Equality Authority (EA) There are 3 actions where The actions involve carrying the EA is the sole or joint out an evaluation, providing lead agency. training and undertaking
research.
County/City Childcare There are 215 actions for The CCC actions differ from Committee (CCC) which the CCCs are the the overall trends in the actions
lead agency or one of the requiring them to provide
lead agencies, equivalent information, 10.3% compared to 2.1% of the total. to 5.8% overall and actions
requiring them to improve facilities/services, 13.4% compared to 9.3% overall.
However, in general they follow the overall trend.
Agency/Organisation Number and % of total Nature of actions actions (sole or joint lead)
Combat Poverty The CPA is the sole or Over 25% of the CPA-led Agency (CPA) joint lead agency for 11 actions require the agency to
actions. develop a strategy/action plan and 18% of the actions require
them to encourage participation.
Comhairle Comhairle is the sole or Providing information and joint lead agency for 10 developing strategies/action
actions. plans account for 80% of Comhairle-led actions.
Department of Social The DSFA is the sole or Approximately one fifth of the and Family Affairs joint lead agency for 141 actions relate to research, a
(DSFA)1 actions. further 14% to providing funding, while almost 14% relate to developing an action plan/strategy.
Note: 1 Although it is not an agency, the Department itself has been listed as there is adepartment representative on each of the CDBs.
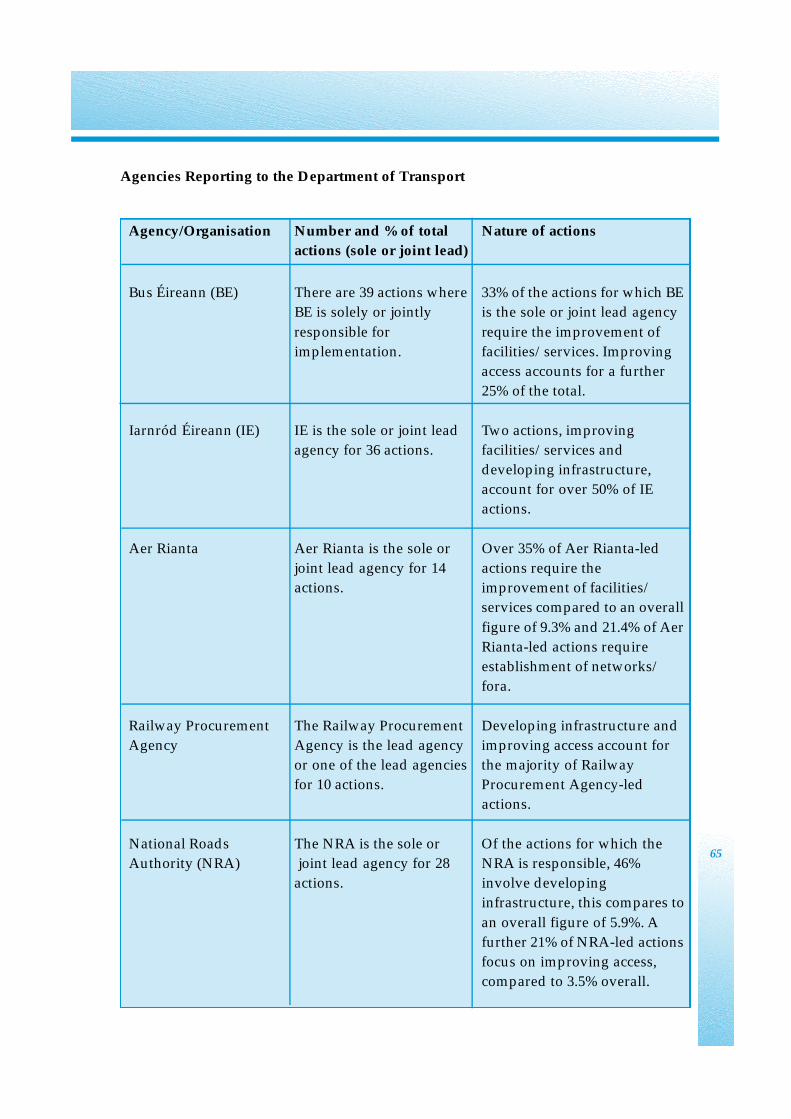
Agencies Reporting to the Department of Transport
65
Agency/Organisation Number and % of total Nature of actions actions (sole or joint lead)
Bus Éireann (BE) There are 39 actions where 33% of the actions for which BE BE is solely or jointly is the sole or joint lead agency
responsible for require the improvement of implementation. facilities/services. Improving
access accounts for a further 25% of the total.
Iarnród Éireann (IE) IE is the sole or joint lead Two actions, improvingagency for 36 actions. facilities/services and
developing infrastructure, account for over 50% of IE actions.
Aer Rianta Aer Rianta is the sole or Over 35% of Aer Rianta-led joint lead agency for 14 actions require the actions. improvement of facilities/
services compared to an overall
figure of 9.3% and 21.4% of AerRianta-led actions requireestablishment of networks/ fora.
Railway Procurement The Railway Procurement Developing infrastructure and Agency Agency is the lead agency improving access account for
or one of the lead agencies the majority of Railway for 10 actions. Procurement Agency-led
actions.
National Roads The NRA is the sole or Of the actions for which the Authority (NRA) joint lead agency for 28 NRA is responsible, 46%
actions. involve developing infrastructure, this compares to
an overall figure of 5.9%. Afurther 21% of NRA-led actionsfocus on improving access, compared to 3.5% overall.

6.8 Timing of the Actions
Figure 6.8 shows that, of the actions where a timeframe is indicated, almost 70% are to
be implemented in the short term i.e. the first three years of the implementation phase.
About 22% of actions will be implemented in the medium term, while the remainder will
be implemented in eight to ten years.
Figure 6.8: Timing of Actions (from commencement)
6.9 Issues Identified in Regional Sections
There are specific regional sections in over three quarters of the Strategies. These deal
with the aspects of the Strategy that spill over into neighbouring counties/ cities in the
region. As shown in Figure 6.9, some regions seem to have collaborated more than others
in identifying the issues that should be addressed. In some cases, CDBs intend to
establish a regional co-ordination committee to monitor certain actions or further
develop some proposals they feel are best addressed at a regional level. Examples of
these issues include transport, energy, health, tourism, IT and third-level education.
66
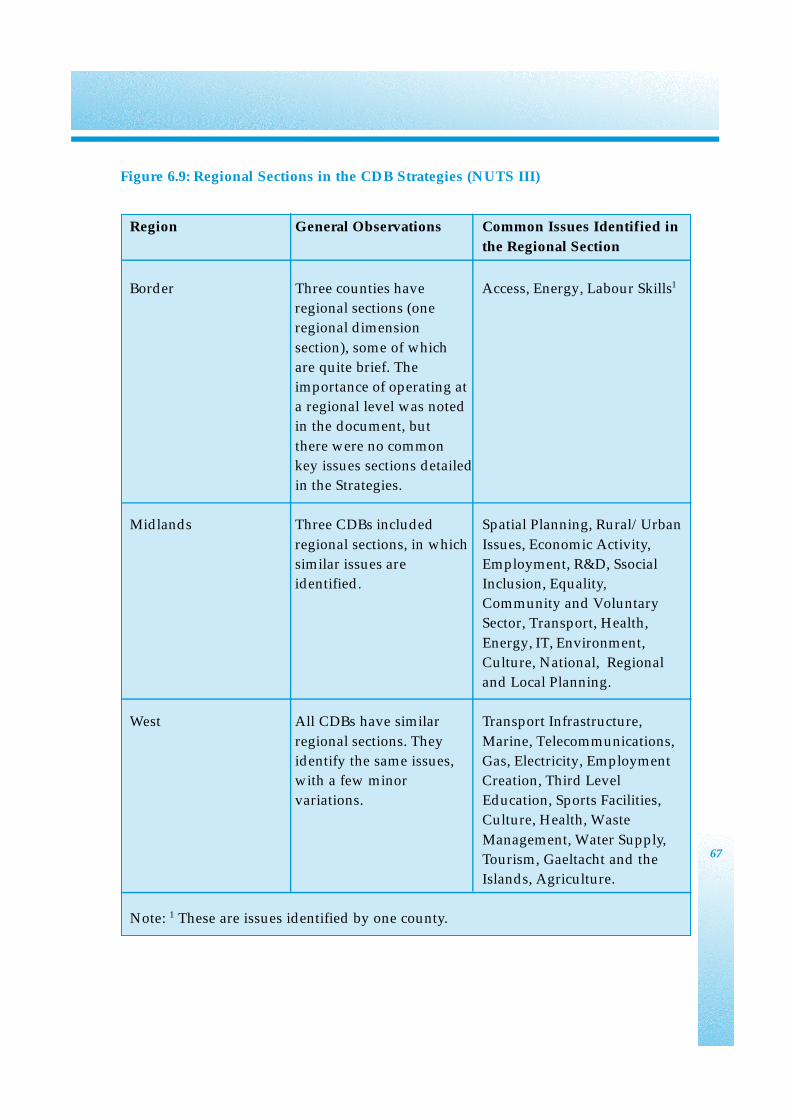
Figure 6.9: Regional Sections in the CDB Strategies (NUTS III)
67
Region General Observations Common Issues Identified in
the Regional Section
Border Three counties have Access, Energy, Labour Skills1
regional sections (one regional dimension
section), some of which are quite brief. The importance of operating ata regional level was noted in the document, but
there were no common key issues sections detailed in the Strategies.
Midlands Three CDBs included Spatial Planning, Rural/Urban
regional sections, in which Issues, Economic Activity,similar issues are Employment, R&D, Ssocial identified. Inclusion, Equality,
Community and VoluntarySector, Transport, Health,
Energy, IT, Environment, Culture, National, Regional and Local Planning.
West All CDBs have similar Transport Infrastructure,
regional sections. They Marine, Telecommunications, identify the same issues, Gas, Electricity, Employment with a few minor Creation, Third Level variations. Education, Sports Facilities,
Culture, Health, Waste
Management, Water Supply,Tourism, Gaeltacht and the Islands, Agriculture.
Note: 1 These are issues identified by one county.
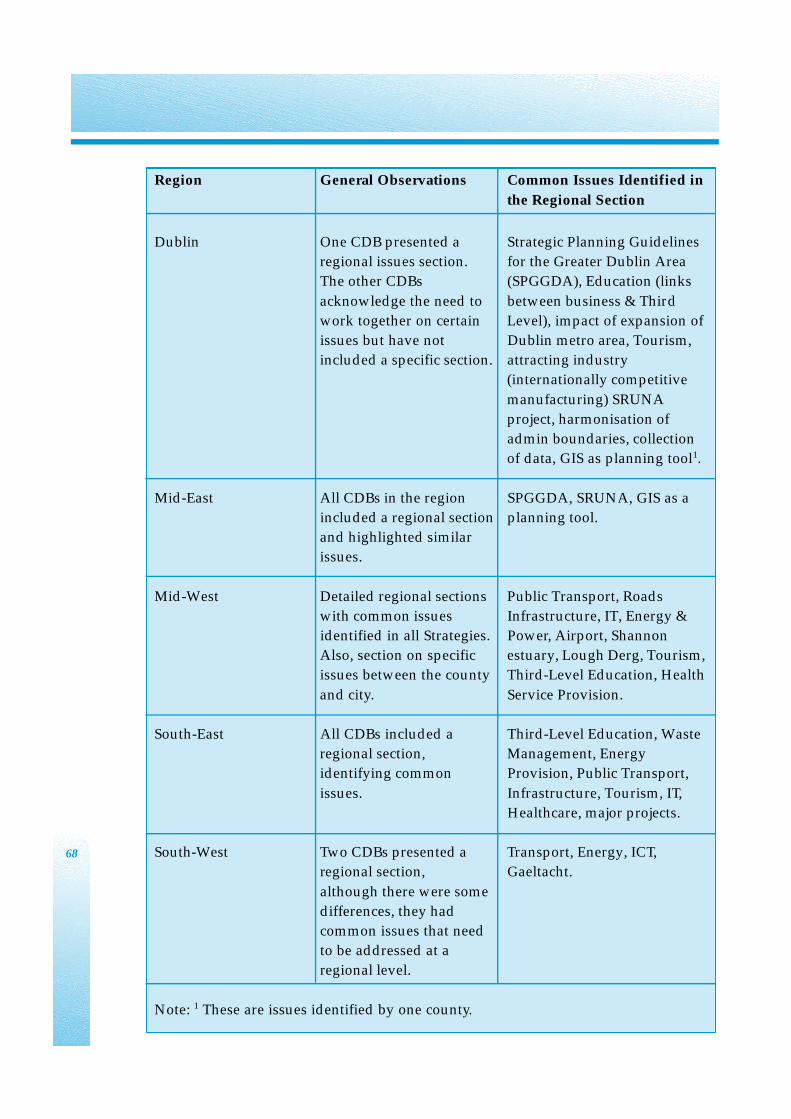
68
Region General Observations Common Issues Identified in
the Regional Section
Dublin One CDB presented a Strategic Planning Guidelines regional issues section. for the Greater Dublin Area The other CDBs (SPGGDA), Education (links
acknowledge the need to between business & Thirdwork together on certain Level), impact of expansion of issues but have not Dublin metro area, Tourism, included a specific section. attracting industry
(internationally competitive
manufacturing) SRUNAproject, harmonisation of admin boundaries, collection of data, GIS as planning tool1.
Mid-East All CDBs in the region SPGGDA, SRUNA, GIS as a included a regional section planning tool.and highlighted similar issues.
Mid-West Detailed regional sections Public Transport, Roads with common issues Infrastructure, IT, Energy & identified in all Strategies. Power, Airport, Shannon Also, section on specific estuary, Lough Derg, Tourism, issues between the county Third-Level Education, Health
and city. Service Provision.
South-East All CDBs included a Third-Level Education, Waste regional section, Management, Energy identifying common Provision, Public Transport,
issues. Infrastructure, Tourism, IT,Healthcare, major projects.
South-West Two CDBs presented a Transport, Energy, ICT,regional section, Gaeltacht.
although there were some differences, they had common issues that need to be addressed at a regional level.
Note: 1 These are issues identified by one county.
6.10 Key Messages
• The average number of actions per county/city varies between regions e.g. the
average per county in the Mid-East is 80, while it is 450 in the Midlands, many
are quantifiable and have specific outputs envisaged.
• Three types of actions are generally included in the Strategies, actions that were
traditionally implemented by one organisation but are now to be implemented
by a number of organisations in a more co-ordinated way, pilot initiatives to fill
identified gaps to be implemented by a number of organisations, those already
being implemented by a certain member organisation that contribute to the
overall vision, goals and objectives. The majority of actions fall into the first and
second categories.
• Social inclusion and education sectors have the highest percentage share of
sectoral actions relating directly to them, accounting for 13% and almost 10%
respectively. Approximately 27% of all actions relate to tackling social inclusion
in some way.
• Local authorities are lead agency, or one of the lead agencies, on one-third of all
actions with a lead identified. The CDBs are lead, or one of the lead agencies, on
approximately one-quarter of the actions. Other agencies leading on a relatively
high proportion of the actions include Partnerships/LEADER groups, Health
Boards and VECs.
• Undertaking re s e a rch is the most common type of action, followed by
developing a strategy/action plan and establishing a network/forum. These
vary to some extent between NUTS III regions.
• Over two-thirds of the actions will commence in the first three years of the
Strategy.
• Issues CDBs feel should be addressed at regional level include transport, energy,
health, tourism, IT and third level education.
69
7.1 Introduction
The final agreed step in the CDB planning process (Step 8) referred to arrangements for
implementation, monitoring and evaluation. This chapter summarises this component of
the published Strategies. In addition, it summarises how CDB Strategies propose to
achieve greater public service integration at local level.
Section 7.2 deals with the overall proposals for monitoring the implementation of the
Strategies, section 7.3 synthesises their content regarding targets and indicators, and
section 7.4 deals with evaluation. Section 7.5 deals with CDB proposals for achieving
greater public service integration at local level, while section 7.6 comments on the cost of
implementation.
7.2 Monitoring
All CDBs state that they intend to monitor implementation of their Strategies. However,
some outlined the proposed process in more detail than others.
Approaches to monitoring generally fall into one of three broad categories, depending
on the reporting structure:
• a monitoring process led by implementation groups that report directly to the
Board;
• a monitoring process led by a lead agency or the Community and Enterprise
Section that, in turn, report to the Board;
• a layered approach to monitoring – lead agencies reporting to the monitoring
groups and the monitoring groups in turn to the Board.
There is a relatively even divide among the three approaches selected by the CDBs (one-
third selecting each approach). Examples of statements on monitoring are shown in the
text box below.70
7. CDB Strategies: Delivery Mechanisms
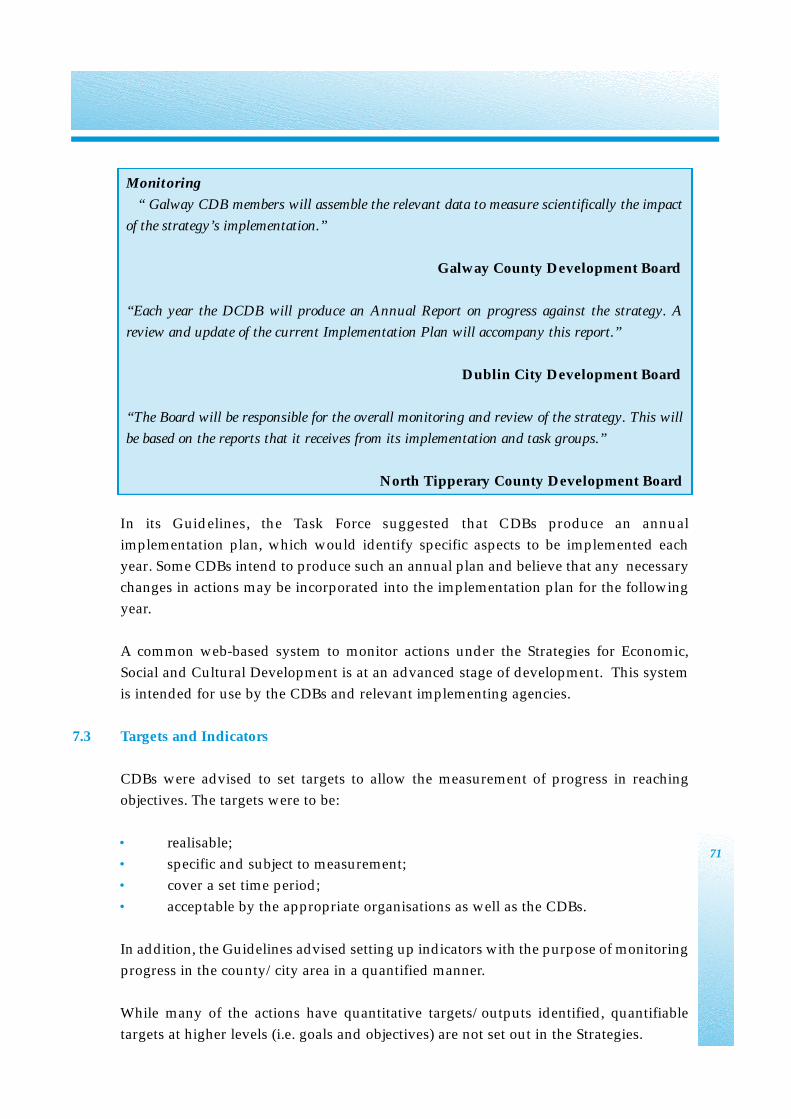
In its Guidelines, the Task Force suggested that CDBs produce an annual
implementation plan, which would identify specific aspects to be implemented each
year. Some CDBs intend to produce such an annual plan and believe that any necessary
changes in actions may be incorporated into the implementation plan for the following
year.
A common web-based system to monitor actions under the Strategies for Economic,
Social and Cultural Development is at an advanced stage of development. This system
is intended for use by the CDBs and relevant implementing agencies.
7.3 Targets and Indicators
CDBs were advised to set targets to allow the measurement of progress in reaching
objectives. The targets were to be:
• realisable;
• specific and subject to measurement;
• cover a set time period;
• acceptable by the appropriate organisations as well as the CDBs.
In addition, the Guidelines advised setting up indicators with the purpose of monitoring
progress in the county/city area in a quantified manner.
While many of the actions have quantitative targets/outputs identified, quantifiable
targets at higher levels (i.e. goals and objectives) are not set out in the Strategies.
71
Monitoring
“ Galway CDB members will assemble the relevant data to measure scientifically the impact
of the strategy’s implementation.”
Galway County Development Board
“Each year the DCDB will produce an Annual Report on progress against the strategy. A
review and update of the current Implementation Plan will accompany this report.”
Dublin City Development Board
“The Board will be responsible for the overall monitoring and review of the strategy. This will
be based on the reports that it receives from its implementation and task groups.”
North Tipperary County Development Board
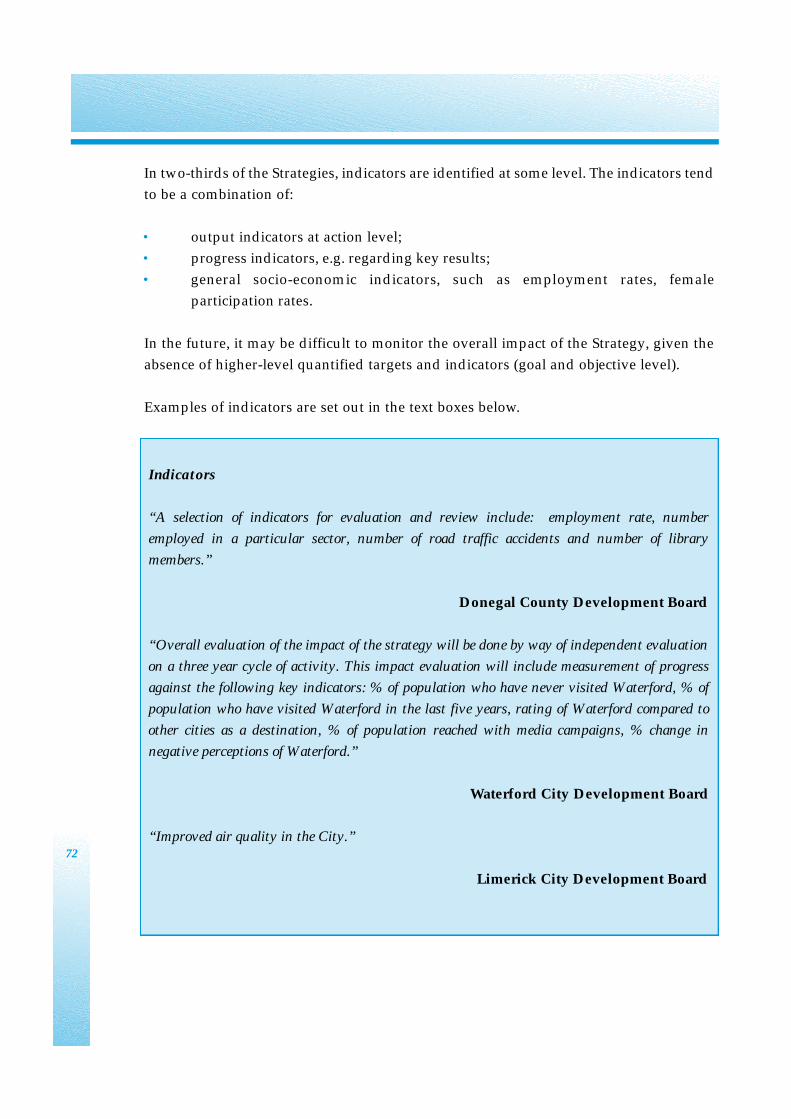
In two-thirds of the Strategies, indicators are identified at some level. The indicators tend
to be a combination of:
• output indicators at action level;
• progress indicators, e.g. regarding key results;
• general socio-economic indicators, such as employment rates, female
participation rates.
In the future, it may be difficult to monitor the overall impact of the Strategy, given the
absence of higher-level quantified targets and indicators (goal and objective level).
Examples of indicators are set out in the text boxes below.
72
Indicators
“A selection of indicators for evaluation and review include: employment rate, number
employed in a particular sector, number of road traffic accidents and number of library
members.”
Donegal County Development Board
“Overall evaluation of the impact of the strategy will be done by way of independent evaluation
on a three year cycle of activity. This impact evaluation will include measurement of progress
against the following key indicators: % of population who have never visited Waterford, % of
population who have visited Waterford in the last five years, rating of Waterford compared to
other cities as a destination, % of population reached with media campaigns, % change in
negative perceptions of Waterford.”
Waterford City Development Board
“Improved air quality in the City.”
Limerick City Development Board
7.4 Evaluation
About four-fifths of the Strategies incorporate details on how CDBs intend to evaluate
impact. The remainder indicate their intention to evaluate, but have not provided any
details on the process envisaged.
Through the evaluation, Strategies indicate that CDBs intend to measure the impact of
the Strategy on some, if not all, of the following:
• service delivery: are agencies delivering a more coherent service to the public;
• changes in the external environment: have there been significant economic
changes to the external environment that may impact on the relevance of the
actions in the Strategy;
• achievement of the targets: are the quantifiable targets outlined in the Strategy
being met?
Three Strategies indicate that they plan to undertake a survey of the population of the
catchment area to determine whether services have improved, or issues that may now
be pertinent.
Of the 14 Boards who gave a timeframe for the evaluation, approximately two-thirds
plan to evaluate every three years. The remainder will prepare annual reports, or
alternatively produce both annual reports and an overall evaluation every three years.
73
Evaluation
“ CDB will produce an annual review, with a more in-depth evaluation of the Strategy’s
progress after three years. This will provide an outline of the progress of the Strategy and will
measure performance against the targets set.”
Cavan County Development Board
“a comprehensive evaluation of the strategy will be undertaken at three yearly intervals. This
will focus on the ultimate impact of the CDB on the ground as well as measuring progress”
Wicklow County Development Board

As referred to under indicators, lack of specificity in targets above the level of actions is
a weakness from an evaluation perspective. It means that while progress on achievement
of actions themselves can be assessed, their impact on the overarching goals and
objectives, as stated in the Strategies, will be difficult to assess in practice.
7.5 Proposals for Service Integration
Throughout the Strategies, CDBs recognise the core objective of service integration at
local level.
The main methods proposed in the Strategies to achieve more coherent delivery of public
and local development services at local level are as follows:
• establishing new county/city issue specific sub-groups (e.g. Coastal Zone Management
Group, Integrated Transport Co-ordinating Group) is the principal vehicle for
integration. This aims to ensure all the relevant players are involved in the
implementation of these initiatives;
• developing a local strategy for a particular sector (e.g. energy, homelessness, adult
education) that gives agencies clear guidance on the activities they should be
implementing, and the other agencies within the sector with whom they should
be working;
• selecting lead and support agencies to implement actions that may have already
been, or currently are being, implemented, but will now be implemented in a
more integrated fashion. A large proportion of the actions in the Strategies are
envisaged as implemented by multiple agencies (lead and supporting agencies,
multiple lead agencies, or multiple supporting agencies);
• developing a niche role for the CDB, which often incorporates actions aimed at
supporting integration such as undertaking research, developing strategies or
action plans, and establishing networks;
• agencies proofing their policies, i.e. against the agreed CDB Strategies, to ensure
consistency.
In addition to the local issue specific groups referred to above, various such groups have
already been established on a nationwide basis as a result of national decisions. These
include the County/City Childcare Committees, Adult Learning Boards, and Social
Inclusion Measures (SIM) Co-ordinating Groups.
74
A feature of these proposals is that they all involve a relatively commonsense level of co-
operation between independent actions at local level. This is welcome progress, and is
understandable at this first stage in the CDB process. However, it is also relatively
modest progress and suggests a need for a more ambitious follow-on approach – at
national and at local level – if the more difficult issues of overlap, duplication and gaps
are to be tackled.
7.6 Costs of Implementation
There was no specific requirement on CDBs to address the issue of costs in the Strategies
and, with one exception, they have not attempted to do so. This may be partly because
many of the initiatives do not involve significant extra resources, and new initiatives
may involve re-directing or shifting the allocation of existing resources.
7.7 Key Messages
• Most CDBs have incorporated some details on how they propose to monitor their
Strategy. In a number of instances, implementation groups will be established to
monitor the Strategy, or alternatively it will be the responsibility of the lead
agencies or the Community and Enterprise Unit. In addition, some CDBs
propose to prepare annual implementation plans.
• In relation to evaluation, CDBs generally have proposed conducting evaluations
at three year intervals.
• Targets and indicators are defined mainly at lower levels i.e. at the level of
actions, with a general lack of higher level (goals and objectives) targets and
indicators. Lack of specificity in targets at goal and objective level means that in
practice, it may be difficult to evaluate the impact of the Strategy at a later date.
• The main proposal for service integration is establishing local issue specific sub-
groups, made up of the relevant players in that area, to implement an action.
Other ways of achieving better integration and co-ordination of services include
both identifying lead and support agencies to implement actions, CDBs ‘filling a
gap’ in terms of undertaking ‘co-ordination type activities‘ such as networking
and research, and agencies proofing their policies against CDB Strategies.
• The vast majority of CDBs have not addressed the issue of costs in their
Strategies, although there was no specific requirement on them to do so. Some of
the initiatives may be resourced through the re-prioritisation of existing funds.
75
8.1 Introduction
The purpose of this report has been to synopsise the key messages arising from the 34
published County/City Development Board Strategies taken as a whole. Previous
chapters, following the broad agreed common structure of the Strategy documents, have
identified these key messages. The aim here is to present a series of overall conclusions,
and to draw out their implications for key central and local stakeholders.
8.2 Overview
Underlying the decision to establish the County/City Development Boards – and to
specifically request them to prepare integrated Economic, Social and Cultural Strategies
for their areas – was the objective of greater integration of public and local development
service delivery at local level. By coming together, formulating and implementing such
a “shared vision” for their areas, the separate organisations represented at the CDB table
would gradually move up the “integration ladder” from network/information exchange
through co-ordination to co-operation and collaboration (see Figure 8.1).
Against this aim, the published CDB Strategies as a package must be regarded as a
significant achievement in a number of respects:
• all Boards have published Strategies, and have done so broadly on schedule;
• these Strategies broadly follow the guidelines originally set out by the Task Force
for their preparation;
• the Strategies are generally clear, logical and well presented.
The published Strategies provide evidence of extensive research, and of an unparalleled
breadth of local consultation on a nationwide basis. They represent very extensive
research, analysis and consultation on the part of hundreds of Board members and
thousands of others associated with ad hoc working groups and other structures who
participated directly in the formulation of the Strategy, and on the part of the 34 Directors
of Community and Enterprise and their staff in each individual county and city.
One of the key challenges facing the Strategies, and appreciated from the outset, is that
of achieving buy-in on the part of the various organisations on the Boards. While the
challenge of achieving such buy-in is far from complete, a level of reassurance can be
taken from what has already been achieved. Publication of agreed Strategies by all CDBs
is itself evidence of this. So too is the range of agencies that have put themselves forward
as lead organisations for more co-ordinated activities and actions.
76
8. Conclusions and Implications
Published Strategies also provide evidence of many small but important “wins” through
co-operation at local level among agencies that may have hitherto not co-operated
extensively with each other. It will now be critical to the entire process that there is now
t r a n s p a rent delivery on the commitments in the Strategies by each org a n i s a t i o n
represented on the Boards countrywide.
At the centre of the CDB process is the aim of more coherent and integrated service
delivery at local level. The Strategies demonstrate that this aim has been retained, and
has been a key focus during their preparation. This is manifest in the great many actions
proposed in the Strategies which are to be implemented or overseen by local level
committees, task forces, working groups, etc.
The Strategies, therefore, already go some distance in helping to inculcate a culture of co-
operation, and make such co-operation a more routine feature of the operations of
agencies at local level. While valuable work had already been done in this respect within
their own spheres by Area Partnerships, LEADER Groups, County/City Strategy
Groups and by local authorities – the CDBs give it a new impetus and greatly broaden
the range of players and service-areas involved. Again, it will be important for the whole
process that this impetus is not lost and that there are identifiable early “wins” in
implementation of the Strategies.
Publication of the Strategies is a key milestone in the life of the CDB process. There is still
much to do and it is not a time for complacency. However, successful delivery of all the
Strategies is nevertheless an achievement from which the Boards and all their members
can take some satisfaction.
8.3 Challenges Ahead for CDBs
It is not the aim of this report to individually evaluate CDB Strategies per se, or to
benchmark them against good practice or the original guidelines for their preparation.
The primary aim is instead to take them as they are and to extract the key messages from
them for key stakeholders, e.g., Government Departments, State agencies, etc.
Nevertheless, from our examination of all the Strategies, we can point to a number of
areas where there is scope for consolidation and further development of the CDB
Strategy model. These are as follows:
• prioritisation: many Strategies contain a large number of proposed actions. This
is not, in itself, either a positive or negative feature. In many cases, for example,
individual actions are closely related to each other and are part of a wider
77
process or group of activities1. Nevertheless, there is an issue for some Boards as
to whether the number of actions can be delivered, of whether there is a need to
prioritise some of these over others, and whether in some cases actions have been
included mainly in the interest of consensus-building rather than on their merit.
This is an area for examination by individual Boards;
• implementation plans: annual action/implementation plans can be an important
means by which to operationalise the Strategies, and to give time-based priority
to some proposed actions. Many Boards already have such plans, or indicate the
intention to prepare them. Where this is not already the case, we would commend
this approach to CDBs;
• costs: absence from most Strategies of any reference to the cost of proposals is an
issue. Again, this is not necessarily a criticism. Indeed, to an extent this is
understandable, given that the CDBs are meant to improve co-operation among
existing public service activities rather than proposing new lines of expenditure.
Nevertheless, especially in the present budgetary climate, the virtual absence of
reference to costs is notable.
An approach here would be for Boards to now distinguish between actions which
involve existing agency activities and for which funding will therefore come from
routine agency budgets, and actions which would involve significant new
activities or proposed new investments;
• achieving service integration benefits: looking ahead there will be a need for a
more challenging approach to the area of improved local service integration. As
shown in Figure 8.1, activities contained in the Strategies are generally in the area
of networking and co-ordination between agencies. To date, there would appear
from published Strategies to be less evidence of proposals to share resources and
undertaking joint activities or of the corollary i.e. the ceding of territory by
agencies where others are performing similar activities. From the CDB
perspective a “softly-softly” approach is understandable initially in the interest of
consensus. However, if the real benefits of service integration are to occur,
avoiding overlap and duplication, providing a better service to the client, and
ultimately achieving better value for money - it will be necessary to move up the
integration ladder from information exchange and co-ordination towards co-
operation and collaboration (see Figure 8.1);
78
1 e.g. feasibility study, design, build, operate a facility listed as four actions.
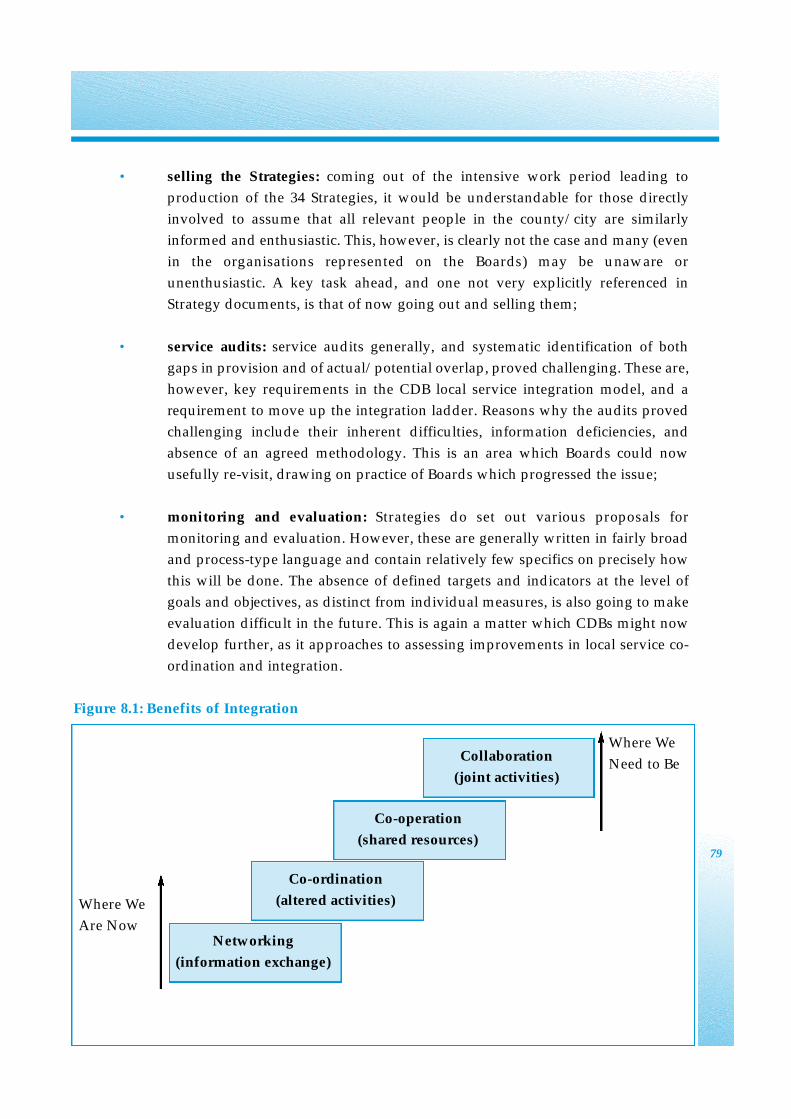
• selling the Strategies: coming out of the intensive work period leading to
production of the 34 Strategies, it would be understandable for those directly
involved to assume that all relevant people in the county/city are similarly
informed and enthusiastic. This, however, is clearly not the case and many (even
in the organisations re p resented on the Boards) may be unaware or
unenthusiastic. A key task ahead, and one not very explicitly referenced in
Strategy documents, is that of now going out and selling them;
• service audits: service audits generally, and systematic identification of both
gaps in provision and of actual/potential overlap, proved challenging. These are,
however, key requirements in the CDB local service integration model, and a
requirement to move up the integration ladder. Reasons why the audits proved
challenging include their inherent difficulties, information deficiencies, and
absence of an agreed methodology. This is an area which Boards could now
usefully re-visit, drawing on practice of Boards which progressed the issue;
• monitoring and evaluation: Strategies do set out various proposals for
monitoring and evaluation. However, these are generally written in fairly broad
and process-type language and contain relatively few specifics on precisely how
this will be done. The absence of defined targets and indicators at the level of
goals and objectives, as distinct from individual measures, is also going to make
evaluation difficult in the future. This is again a matter which CDBs might now
develop further, as it approaches to assessing improvements in local service co-
ordination and integration.
Figure 8.1: Benefits of Integration
79
Collaboration
(joint activities)
Co-operation
(shared resources)
Co-ordination
(altered activities)
Networking
(information exchange)
Where We
Need to Be
Where We
Are Now
8.4 Implications for the Task Force
An important purpose of this review has been to identify key messages for the central
Government reader generally, and for the Task Force on the Integration of Local
Government and Local Development Systems in particular. Specific challenges here are:
• agency procedures: individual Government Departments should ask their main
implementing agencies/arms to review their procedures and practices in order to
ensure that these are not inadvertent obstacles to service integration at local level.
This would include, for example, policies in relation to shared budgetary
resources, shared facilities, and co-funding of projects;
• central buy-in: as was clear from the outset of the CDB process, buy-in from
central Government Departments and agencies is vital. It is clear that there may
be at best discomfort, at worst scepticism, in some parts of central Government
agencies in relation to the CDB process. This is frequently not necessarily
institutionalised but may reflect the attitudes of individual staff members in
different parts of the country. It is vital that the Task Force continue to encourage
Government Departments to inculcate appropriate change within their agencies
in this regard;
• proofing: one of the original provisions of the establishment of the CDBs is that,
once their Strategies were published, those of other local development
organisations would need to be proofed against them. With the publication of the
CDB Strategies the time is now ripe for this. Under the National Development
Plan there is provision that all relevant programmes and projects (covered by the
NDP), and their delivery mechanisms, should accord with the CDB framework.
The NDP/CSF Evaluation Unit should now examine this issue in the context of
its forthcoming review of social inclusion co-ordinating mechanisms;
• county/city data: a feature of the CDB Strategy process, and one evident in many
Strategies, is the difficulty of obtaining local level data and information
(particularly at county/city level) with re g a rd to the activity of central
Government Departments and agencies. This is an area which individual
Departments and agencies should examine (or re-examine), in particular with
regard to the provision of existing information rather than the collection of any
new information;
80
• CDB resources: another feature of the original CDB model is that the other
Departments and their agencies would contribute to its resources at local level.
The CDB Strategies contain no evidence that this is occurring, and all substantive
staffing and resources come from the local government sector. This is an area
which merits a re-examination both by the Task Force itself and subsequently by
individual Government Departments and agencies;
• new local entities: the CDBs, under local authority leadership, provide the
potential vehicle through which the local dimension of national Government
Departments and agencies can be provided. Nevertheless, since the
establishment of the CDBs, a number of other new local initiatives have created
their own new local structures. This practice has the potential to cause further
overlap and duplication, and to undermine the CDB process which Government
has already established to increase service coherence at local level. The Task Force
should aim to ensure that it now becomes standard practice that any new local
level dimension of national policies consider the CDB structure as their local
vehicle before any new structures are launched;
• Department/agency county/city level plans: a key requirement for the success of
the CDB process, and for monitoring progress, is that it be evident whether or not
Departments and agencies have been able to meet whatever they promise in CDB
Strategies. To this end there is a need to initiate arrangements where b y
Government Departments and agencies directly involved in local service
delivery indicate clearly within their operational/work plans the extent to which
their commitments to CDB Strategies will be delivered.
8.5 Overall Conclusion
The County/City Development Boards generally, and CDB Strategies in particular are,
a new approach to the challenging topic of more “joined-up” government at local level
in Ireland. Publication of the CDB Strategies, and the nature and content of these, is a
positive omen that the model can make progress with regard to improved public service
co-ordination. The county/city level cannot, however, make this progress alone.
A key determinant of the ultimate success of the CDB model is commitment, support,
and flexibility at central Government Department and agency level. The county/city
level cannot go very far past where the central level wishes or allows it to go. So, for the
central level, the key message of the Strategies is that the local service integration
mission will ultimately be as successful or unsuccessful as central Government
organisations wish it to be.
81

82
Interdepartmental Task Force on the Integration of Local Government and Local Development
Membership (November 2002)
83
Annex 1
Task Force Members
Martin Cullen, T.D. Minister for the Environment and Local Government (chair)
Declan Coppinger Department of Agriculture and Food
Mary Jackson Department of Arts, Sport and Tourism
Raphael Kelly Department of Communications, Marine and Natural
Resources
Deirdre Carroll Department of Community, Rural and Gaeltacht Affairs
Frank O’Donnell Department of Community, Rural and Gaeltacht Affairs
Kathleen Stack Department of Community, Rural and Gaeltacht Affairs
Margaret Kelly Department of Education & Science
Fergus McCafferty Department of Enterprise, Trade & Employment
Joe Allen Department of the Environment and Local Government
Stephen O’Neill Department of Finance
William Beausang Department of Health and Children
Sylda Langford Department of Justice, Equality and Law Reform
Eoin Ó Seaghdha Department of Social and Family Affairs
Eileen Kehoe Department of the Taoiseach
Task Force Secretariat
Mairéad Ryan Department of the Environment and Local Government
Ivana McCormack Department of the Environment and Local Government
Paris Beausang Department of the Environment and Local Government
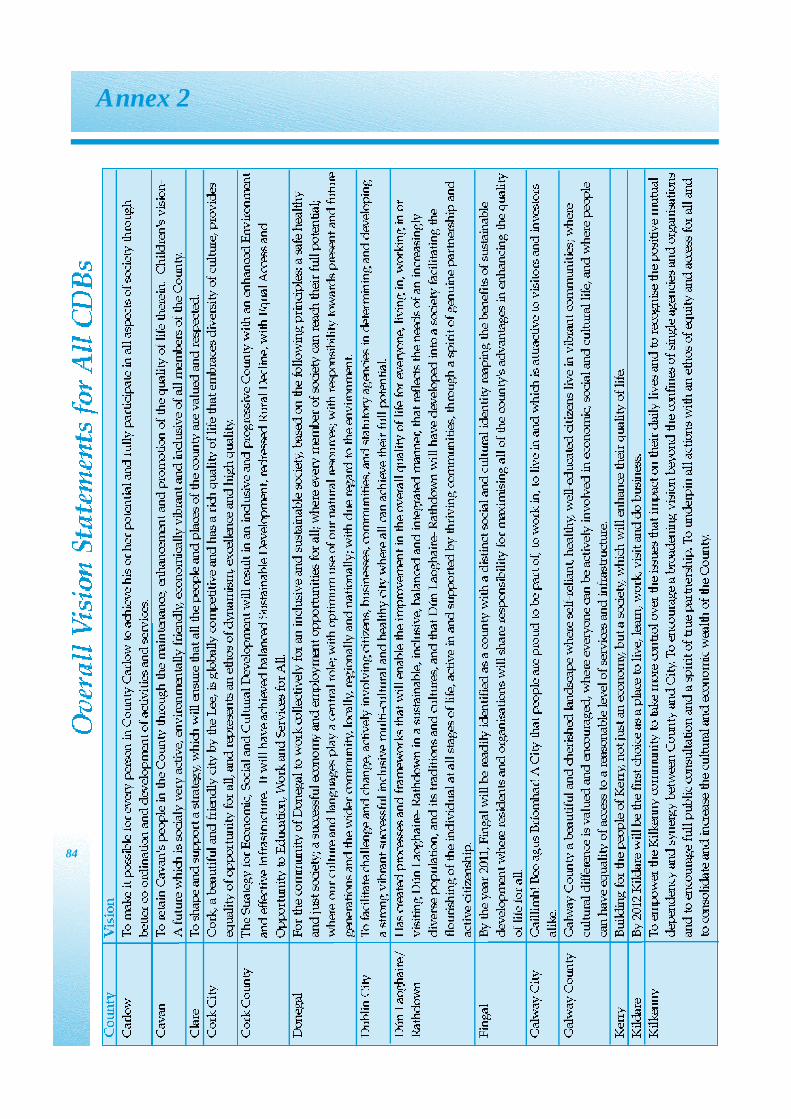
84
Annex 2
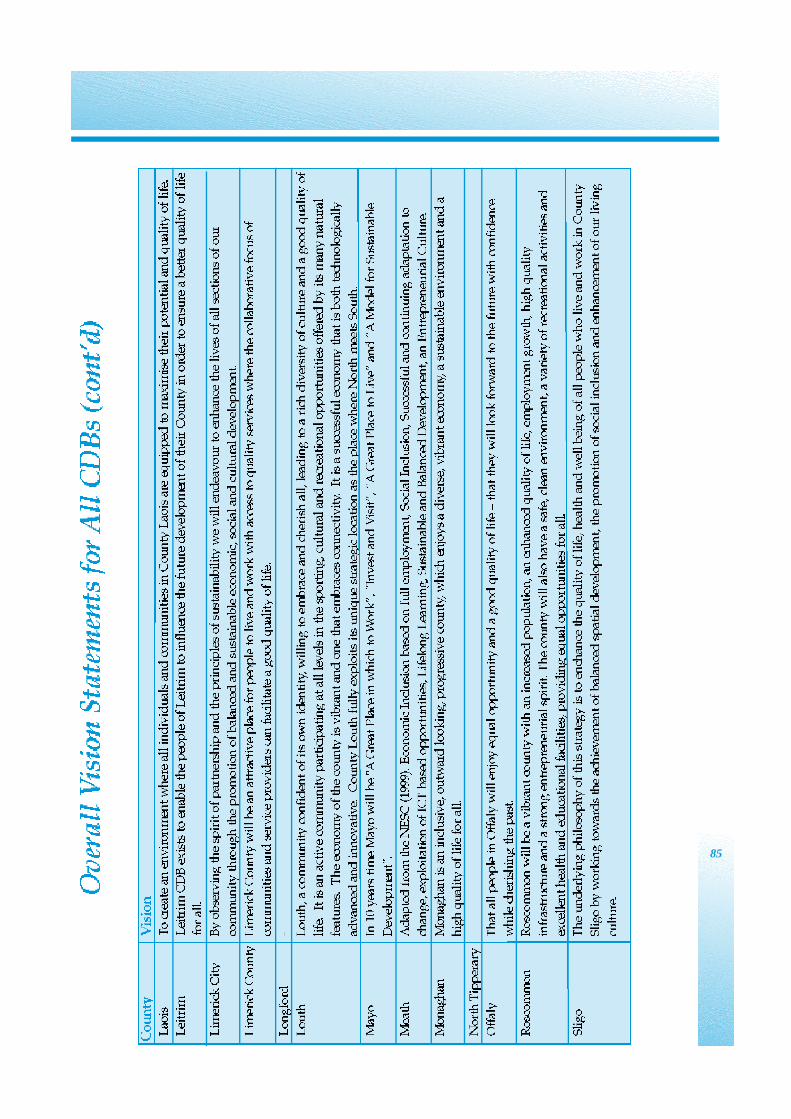
85

86
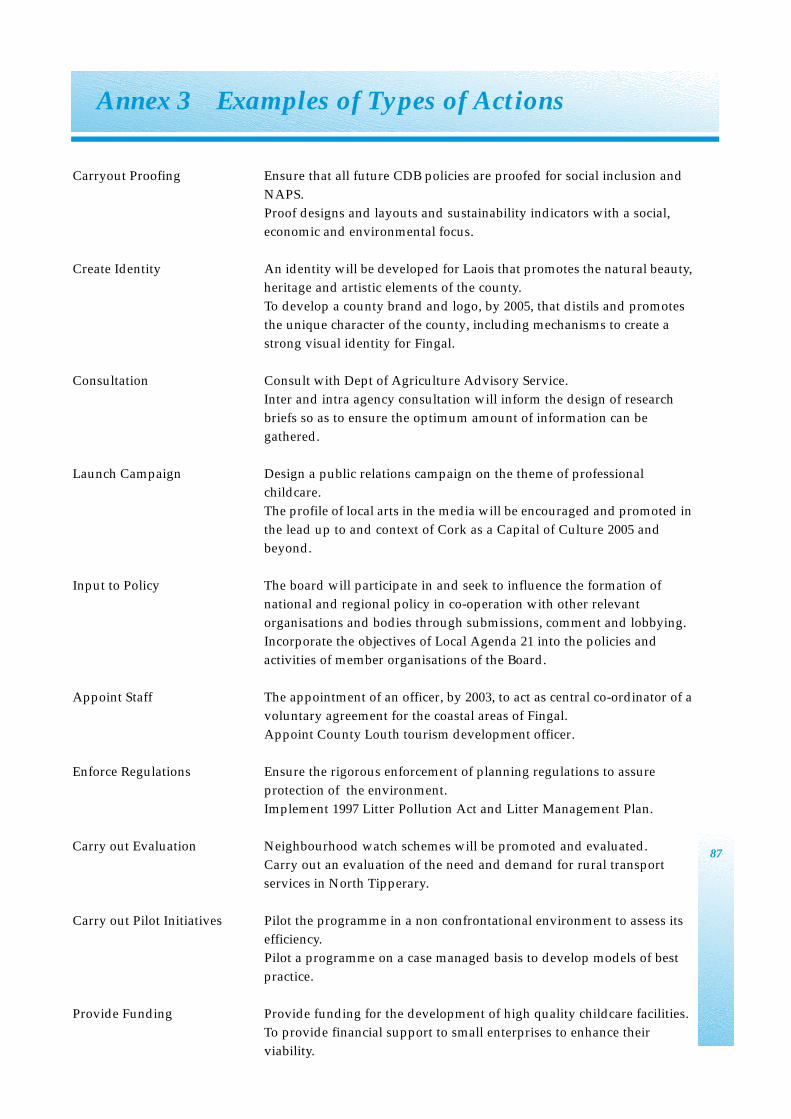
Carryout Proofing Ensure that all future CDB policies are proofed for social inclusion and
NAPS.
Proof designs and layouts and sustainability indicators with a social,
economic and environmental focus.
Create Identity An identity will be developed for Laois that promotes the natural beauty,
heritage and artistic elements of the county.
To develop a county brand and logo, by 2005, that distils and promotes
the unique character of the county, including mechanisms to create a
strong visual identity for Fingal.
Consultation Consult with Dept of Agriculture Advisory Service.
Inter and intra agency consultation will inform the design of research
briefs so as to ensure the optimum amount of information can be
gathered.
Launch Campaign Design a public relations campaign on the theme of professional
childcare.
The profile of local arts in the media will be encouraged and promoted in
the lead up to and context of Cork as a Capital of Culture 2005 and
beyond.
Input to Policy The board will participate in and seek to influence the formation of
national and regional policy in co-operation with other relevant
organisations and bodies through submissions, comment and lobbying.
Incorporate the objectives of Local Agenda 21 into the policies and
activities of member organisations of the Board.
Appoint Staff The appointment of an officer, by 2003, to act as central co-ordinator of a
voluntary agreement for the coastal areas of Fingal.
Appoint County Louth tourism development officer.
Enforce Regulations Ensure the rigorous enforcement of planning regulations to assure
protection of the environment.
Implement 1997 Litter Pollution Act and Litter Management Plan.
Carry out Evaluation Neighbourhood watch schemes will be promoted and evaluated.
Carry out an evaluation of the need and demand for rural transport
services in North Tipperary.
Carry out Pilot Initiatives Pilot the programme in a non confrontational environment to assess its
efficiency.
Pilot a programme on a case managed basis to develop models of best
practice.
Provide Funding Provide funding for the development of high quality childcare facilities.
To provide financial support to small enterprises to enhance their
viability.
87
Annex 3 Examples of Types of Actions
Make Representations Lobby for National Water Conservation strategy.
Lobby the Dept. of Justice to provide additional funding for social and
cultural activities.
Improve Access To Provide access to training for employment for all.
To identify and eliminate barriers to equal access to health services.
Provide Training Provide advice and efficiency/competitiveness training.
Provide 'organic farming' training programmes for advisory personnel.
Provide Information Provide up to date baseline data on early school leaving.
Distribute available information to all employers through 'Excellence
through People' programme.
Develop Infrastructure Develop broadband infrastructure in viable locations.
Develop infrastructural tourism needs.
Encourage Participation Increase take-up of science subjects at second level.
Encourage participation in Tidy Towns Competition.
Implement Strategy/ Produce and implement a heritage plan.
Action Plan Implement regional waste plan.
Promote/Create Awareness Raise awareness of waste management with schools, communities and in
the workplace.
To increase awareness of environmental matters through the use of local
media and distribution of information.
Improve Facilities/Services Further develop Traveller education services.
Improve public lighting in towns and villages.
Establish Network/Fora Establish a tourism action group.
Develop a network of 8 discussion/development groups linked to the
dairy monitor farms.
Develop Strategy/Action Plan Develop a local Anti-Poverty strategy.
Develop a strategy to protect and enhance natural resources as
appropriate.
Undertake Research To carry out an audit of leisure amenities available in the County.
Explore the development of alternative energy sources.
88
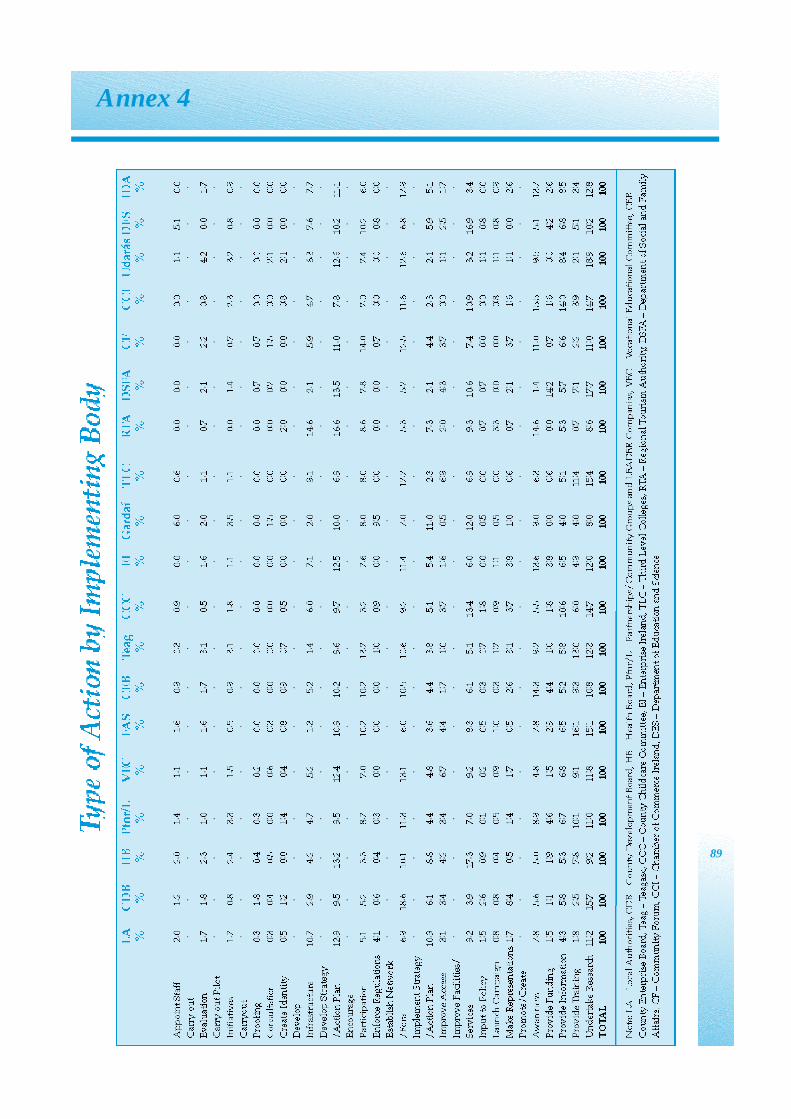
89
Annex 4
Task Force Steering Group on the Review & Analysis of the CDB Strategies
Members
Mr. Joe Allen, Department of the Environment & Local Government (chair)
Mr. Frank O’Donnell, Department of Community, Rural & Gaeltacht Affairs
Ms. Eileen Kehoe, Department of the Taoiseach
Mr. Ger Deering, Carlow County Council
Ms. Mairéad Ryan, Department of the Environment & Local Government
Ms. Hilary Curley, NDP-CSF Evaluation Unit, Department of Finance
Secretariat
Ms. Ivana McCormack, Department of the Environment & Local Government
Mr. Paris Beausang, Department of the Environment & Local Government
Annex 5
90

Notes
91

Notes
92