Embed Size (px)
Citation preview
Content-based image retrieval inradiology: analysis of variability inhuman perception of similarity
Jessica FaruqueChristopher F. BeaulieuJarrett RosenbergDaniel L. RubinDorcas YaoSandy Napel
Content-based image retrieval in radiology: analysisof variability in human perception of similarity
Jessica Faruque,a,* Christopher F. Beaulieu,b Jarrett Rosenberg,c Daniel L. Rubin,d Dorcas Yao,e andSandy NapelfaStanford University, Department of Electrical Engineering, 350 Serra Mall, Stanford, California 94305, United StatesbStanford University Medical Center, Department of Radiology, 300 Pasteur Drive, Room S078, MC 5105, Stanford, California 94305,United StatescStanford University, Department of Radiology, Lucas MRS Imaging Center, 1201 Welch Road, Room P-280, Stanford, California 94305-5488,United StatesdStanford University, Departments of Radiology and Medicine (Biomedical Informatics), Richard M. Lucas Center P285, 1201 Welch Road,Stanford, California 94305-5488, United StateseStanford University, Department of Radiology, 3801 Miranda Avenue, Palo Alto, California 94304-1290, United StatesfStanford University, Department of Radiology, James H. Clark Center, 318 Campus Drive, W3.1, Stanford, California 94305-5441, United States
Abstract. We aim to develop a better understanding of perception of similarity in focal computed tomography(CT) liver images to determine the feasibility of techniques for developing reference sets for training and val-idating content-based image retrieval systems. In an observer study, four radiologists and six nonradiologistsassessed overall similarity and similarity in 5 image features in 136 pairs of focal CT liver lesions. We computedintra- and inter-reader agreements in these similarity ratings and viewed the distributions of the ratings. Thereaders’ ratings of overall similarity and similarity in each feature primarily appeared to be bimodally distributed.Median Kappa scores for intra-reader agreement ranged from 0.57 to 0.86 in the five features and from 0.72 to0.82 for overall similarity. Median Kappa scores for inter-reader agreement ranged from 0.24 to 0.58 in the fivefeatures and were 0.39 for overall similarity. There was no significant difference in agreement for radiologists andnonradiologists. Our results show that developing perceptual similarity reference standards is a complex task.Moderate to high inter-reader variability precludes ease of dividing up the workload of rating perceptual similarityamong many readers, while low intra-reader variability may make it possible to acquire large volumes of data byasking readers to view image pairs over many sessions. © 2015 Society of Photo-Optical Instrumentation Engineers (SPIE) [DOI: 10
.1117/1.JMI.2.2.025501]
Keywords: liver; perception; content-based image retrieval; reference standards; computed tomography; similarity.
Paper 15011R received Jan. 27, 2015; accepted for publication Mar. 10, 2015; published online Apr. 3, 2015.
1 IntroductionLiver cancer is a leading cause of cancer mortality, and earlydetection of cancer using radiological images plays a crucial rolein improving survival rates.1 However, early detection is chal-lenging due to inter-reader variability in image interpretationand the need for more efficiency in interpreting large volumesof imaging data resulting from increased screening rates.2–4
Predictive and learning techniques for assisting in radiologi-cal decision making are becoming increasingly sophisticatedand may improve the accuracy and efficiency of cancer diagno-sis.5,6 One technique, content-based image retrieval (CBIR),involves the presentation of images containing visually similarlesions alongside images requiring diagnosis in order to improvediagnostic accuracy and efficiency.7–9 Studies involving CBIRsystems for clinical decision support demonstrate that they maybe useful in assisting diagnosis.10–12
A recurring challenge in building a robust CBIR system isobtaining an accurate reference set (or “gold standard”) for train-ing and validating the system. Even though major strides havemade in image feature analysis and prediction algorithms,obtaining training and testing data that accurately reflect the
higher-level perceptual judgments necessary for diagnosisremains a major obstacle to progress.13–21
The study of medical image perception is an ongoingtask.22–25 Recent publications about medical image similarityhave focused on mammograms. Many of these studies showedthat asking several radiologists and nonradiologists to ratesimilarity in pairs of mammograms may be a feasible way toacquire similarity data, particularly when readers’ ratings areaveraged.26,27 Recent work also involves using artificial neuralnetworks to impute similarity ratings, showing that the neuralnetworks produced ratings with variability that may be compa-rable with variability between radiologist readers.28,29 Similarwork was also performed with lung nodules using a classifierthat used perceptual similarity measures to determine if thelesion was benign or malignant.30
Some of these techniques focus on predicting similarity inimage features rather than overall similarity between images,which is a much more difficult task.31 Also, while many of thesecharacterize interoperator variability in evaluating similar images,these techniques lack scalability, making it difficult to obtainsufficient data for large databases. When investigating imagesimilarity, asking readers to view every pairwise combination ofimages in a large database is a daunting and time-consuming
*Address all correspondence to: Jessica Faruque, E-mail: [email protected] 2329-4302/2015/$25.00 © 2015 SPIE
Journal of Medical Imaging 025501-1 Apr–Jun 2015 • Vol. 2(2)
Journal of Medical Imaging 2(2), 025501 (Apr–Jun 2015)
task. Additionally, many of these studies involve mammographywith a benign or malignant classification or other binary classi-fiers, not addressing cases with multiple diagnoses or appearan-ces. Finally, some of these studies do not address intra-readeragreement and the repeatability of a reader’s subjective ratings ofimage similarity. Thus, considerable work still remains to bedone in the topic of medical image similarity.32
In previously published work, we developed a scheme forfinding a reference standard using three readers’ ratings ofa variety of image features from images viewed individuallyand imputing pairwise similarity ratings from these values.33
While this technique has a great deal of promise as a methodfor developing a reference standard that may be used forlarge databases, we found that moderate to high inter-readervariability makes it difficult to combine readers’ ratings. Wethen developed a model that predicts inter-reader agreementfor studies with more readers. This model predicts that inclusionof 10 or more readers may overcome some of the issues relatedto inter-reader variability.34
In this paper, we investigate data regarding the similarity offeatures of images of liver lesions seen at computed tomogra-phy (CT) from 10 readers in order to quantify various charac-teristics of these data such as the distributions of the ratings,intra- and inter-reader agreements, and relevance of specificimage features. Additionally, we determine if the variability inthese data makes different paradigms of perceptual similaritydata collection feasible. By quantifying many characteristics ofthe perception of image similarity in liver lesions, this work willassist with a wide range of applications in CBIR and medicaldecision support.
2 MethodsInstitutional approval was obtained to allow use of the images,collection of observer data, and the analyses performed in thisproject. The readers in the study provided informed consentprior to participation.
2.1 Data Collection
Image selection and image pair generation: A radiologistselected 53 DICOM images of liver lesions from 53 differentpatients (27 male, 26 female, age range 24 to 90, acquiredon May 2001 through December 2009) containing focal liverlesions comprising a variety of diagnoses (Table 1) from ourPACS system, which were deidentified in a HIPAA-compliantmanner prior to use. These images were CT scans in the portalvenous enhancement phase reconstructed on a 512 by 512 gridwith slice thickness ranging from 2 to 10 mm, with the majoritybeing 5 mm. The radiologist outlined each lesion with a rectan-gular region of interest.
Given 53 images, there are 1378 unique pairings (computedcombinatorially as “53 choose 2”). We selected a subset of allpairwise combinations of the 53 image pairs for evaluation. Thiswas done for multiple reasons, with the first being that it is quitetime consuming for readers to evaluate 1378 pairs of images.Second, since the goal of this project is for CBIR for similarimages, we selected image pairs that are somewhat similar toeach other, which are more relevant for achieving our goal.
Based on this reasoning, we generated a set of 136 imagepairs as follows. First, two radiologists (one of whom alsoselected the images) who were not participants in the study, byconsensus, divided the 53 images into nine groups (Table 2),with each group containing four to nine images. Each of the
Table 1 Diagnoses of the 53 CT images of focal liver lesions used inthe study.
Diagnosis Number of images
Metastasis 15
Hepatocellular carcinoma 10
Hemangioma 5
Abcess 4
Carcinoid 2
Cholangiocarcinoma 2
Cyst 2
Focal nodular hyperplasia 2
Gastrointestinal stromal tumor 2
Adenoma 1
Confluent hepatic fibrosis 1
Glomus tumor 1
Inflammatory pseudotumor 1
Lymphoma 1
Sarcoma 1
Two or more diagnoses 3
Total 53
Table 2 The 53 images divided into 9 groups of images.
Imagegroup no.
No. ofimages Description of visual appearance
1 6 Hypodense, well-defined, and homogeneous
2 4 Isodense, homogeneous, and somewhatwell-defined
3 5 Slightly hypodense, heterogeneous, andmoderately well-defined
4 5 Heterogeneous, hypodense, and moderatelywell-defined
5 7 Hypodense, homogeneous, and moderatelywell-defined
6 6 Ill-defined, heterogeneous, and hypodense
7 5 Heterogeneous and well-defined
8 7 Mixed densities with nodular areas ofhyperdensity
9 8 Well-defined, mixed densities, loculations(compartments), bands
Total 53
Journal of Medical Imaging 025501-2 Apr–Jun 2015 • Vol. 2(2)
Faruque et al.: Content-based image retrieval in radiology. . .

groups was defined by phrases describing the visual character-istics of the lesions within the images. For example, the firstgroup was described as “hypodense, well-defined, and homo-geneous.” Each group contained images that were similar toeach other in visual appearance, though not all the images ina group had the same diagnoses. Next, we generated a set ofall pairwise combinations of the images within each of thenine groups. For example, in Group 1, we obtained 15 imagepairs by generating all pairwise combinations of all 6 imagesin the group. Finally, we combined all the pairs generatedfrom each of these groups into a set of 136 image pairs. Thisresulted in the 136 selected image pairs being more similarto each other than the pairs not included. However, the 136pairs still varied substantially in the amount of similaritybetween the images. The participants were not told about theimage selection process or the fact that we chose a specific sub-set of all possible image pairs.
Study participants: Ten readers (four radiologists notinvolved in image selection and presentation and six nonradiol-ogists) participated in this study. We included both radiologistsand nonradiologists in order to determine if the two groupsdiffered in their perception of similarity. Of the radiologists,one was a fifth year fellow and three were the faculty with10, 18, and 31 years of experience, respectively. All the readerswere compensated with a $5 gift card for their participation.
Image features and reader training:We asked readers to pro-vide a numerical rating for overall visual similarity between thelesions presented in each pair of images on a continuous scale of1 (for least similar) to 9 (for most similar). We also asked readersto evaluate lesion similarity in five separate image features(Table 3) that two radiologists selected by consensus. Therewere two reasons we asked readers to perform this task:(1) to determine how the perception of overall similarity andthe perception of feature similarity are related, and (2) to inves-tigate if inter- and intra-reader variability are lower in ratings ofspecific imaging features. Figure 1 shows the training examplesthat each reader viewed prior to rating similarity in each feature.
Image pair randomization and repetition: We used the fol-lowing paradigm for image pair presentation to allow determi-nation of both inter- and intra-reader agreements as well as theeffects, if any, of the ordering of the image pairs. First, we with-held 15 out of the 136 pairs of images. We randomized the orderof the remaining 121 pairs of images and divided them into threegroups of approximate thirds, containing 40, 41, and 40 pairs,
respectively. The withheld 15 pairs were added into each ofthese three groups so that the groups contained 65, 66, and65 pairs, respectively, so that intra-reader variability could beestimated. Next, the ordering of the pairs within each of thesegroups was randomized. Finally, we assembled each of thesethirds sequentially to create a set of 166 image pairs (includingrepetitions) that were presented to readers. This process resultedin three presentations of the 15 pairs of images that were viewed
Table 3 The five features evaluated by the study participants.
Feature Description
Margin definition How sharp or blurry the margin of the lesion was against the surrounding normal liver tissue.
Margin contour The smoothness or irregularity of the lesion’s outer contour or the shape of the lesion boundary againstthe surrounding normal liver tissue. Readers were asked to disregard the lesion-to-liver contrast andthe sharpness of the margin.
Average overall lesion density The attenuation (dark or bright) relative to the surrounding normal liver tissue, ranging fromhypodense to hyperdense. Readers were asked to disregard densities of any rim or capsulespresent in the lesion. If the lesion was heterogeneous, they were instructed to estimate whatthe mean density would be if they combined component densities.
Structural heterogeneity The complexity of the lesion structure such as the “number of compartments” within a lesion.
Density heterogeneity The number of different densities that is visible in the lesion. This could include density of enhancement.
Fig. 1 Training examples presented to the readers prior to performingthe study.
Journal of Medical Imaging 025501-3 Apr–Jun 2015 • Vol. 2(2)
Faruque et al.: Content-based image retrieval in radiology. . .
multiple times by the readers. All readers viewed the same 166image pairs, and the left-right ordering of the two images in eachpair was randomized to reduce the possibility of bias from thisordering.
Image pair presentation: The images were presented ona web-based graphical user interface generated using theQualtrics survey software (Qualtrics, Provo, Utah). Before view-ing the images, the readers were first asked to answer somequestions such as whether or not they were radiologists, andif a radiologist, their training levels. Next, they viewed a briefstatement explaining the task and the rating scheme.
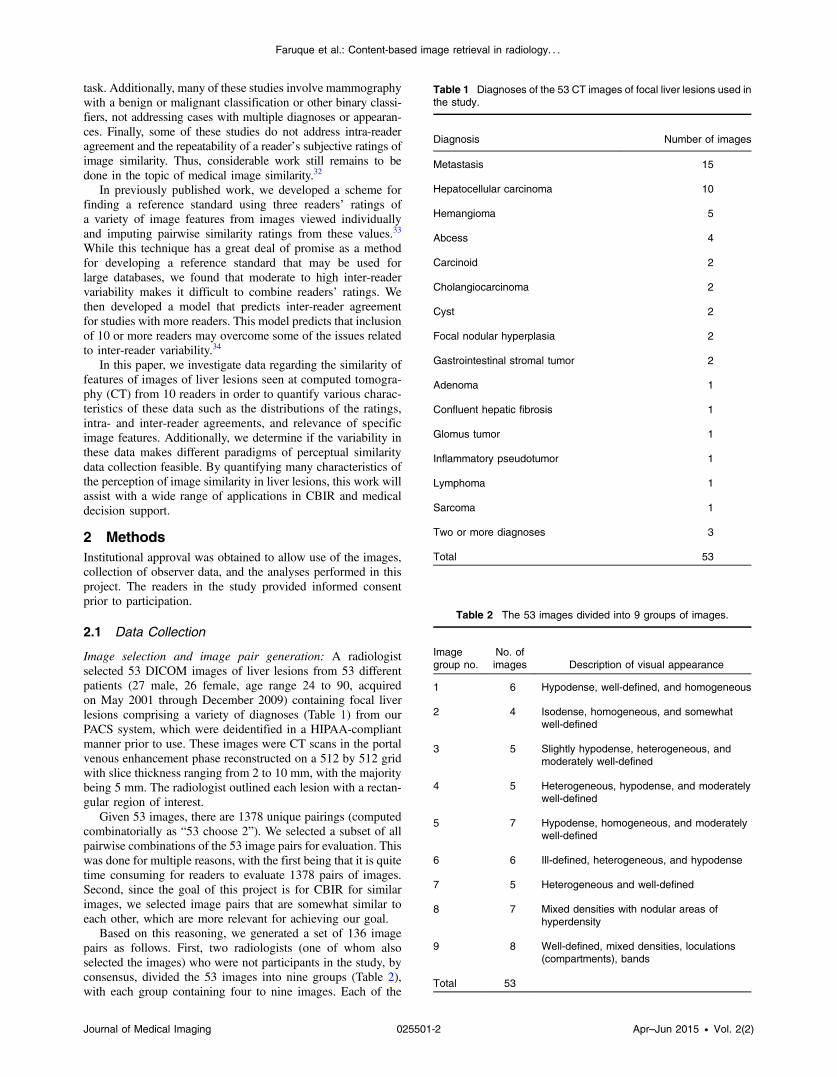
For consistency in image presentation, all readers viewed theimages at the same workstation, which consisted of an AppleMC914LL/A monitor with a 27-in. display and a screen reso-lution of 2560 by 1440 pixels. All the images were set tohave a standard CT liver window (40/400 HU window/level).To prevent the feature similarity ratings from biasing thereaders’ ratings of overall similarity, readers first rated onlyoverall similarity between the lesions in the image pairs (Fig. 2).Following rating overall similarity, readers rated similarity ineach feature.
To avoid reader fatigue and reduce bias, the study was dividedinto two sessions. While six separate sessions would have beenideal, this proved difficult to schedule and would have reducedparticipation in the study. During the first session, readers ratedoverall similarity and similarity in two features. During thesecond session, readers rated similarity in the remaining threefeatures. The presentation order of the features for each readerwas randomized, so each of the readers rated different subsetsand different orderings of the features in each session.
Readers’ comments: Immediately after rating overall similar-ity, we asked readers a set of subjective questions about the basisby which they determined similarity, what lesion features theyused in making similarity judgments, and, for the radiologistreaders, what imaging features they primarily use when making
diagnoses involving liver lesions. After readers completed allthe tasks, we asked them about the difficulty level of the studyand what challenges they faced, if any.
2.2 Data Analysis
We performed the following analyses to characterize variousproperties of these data such as intra- and inter-reader variability.
Distributions of the ratings: First, we viewed histograms ofthe readers’ ratings to see what the distributions of ratingslooked like and if readers’ ratings followed similar distributions.
Intra-reader agreement: Next, we computed intra-readeragreement using a quadratically weighted Kappa statisticbetween the first and second, first and third, and second andthird instances of the 15 repeated pairs for each reader.35 Weused a Wilcoxon signed-rank test to determine if any differencesexisted between the three different sets of Kappas. For these val-ues of Kappa and all following, we used the scaling detailed byLandis and Koch36,37 to determine the agreement level. We alsoused a Wilcoxon signed-rank test to determine if any statisticallysignificant difference between the Kappa values for radiologistsand nonradiologists existed.
Inter-reader agreement: To determine reader agreement,we computed a quadratically weighted Kappa statistic betweenevery pair of readers. Again, we used a Wilcoxon signed-ranktest to determine if any statistically significant differencebetween the Kappa values for radiologists and nonradiologistsexisted. As before, we performed these computations and testsfor both the feature and overall similarity ratings.
We viewed image pairs in which inter-reader agreementwas either very high or very low in overall similarity to seeif there were any distinguishing characteristics. We computedthe Euclidean distance between the 10 readers’ ratings of overallsimilarity for each image pair to measure the inter-reader agree-ment for that pair.
Fig. 2 Screen capture of the graphical user interface (GUI) presented to readers for overall similarity. TheGUI for each of the features was similar, with the words “overall similarity” replaced by the name ofthe feature.
Journal of Medical Imaging 025501-4 Apr–Jun 2015 • Vol. 2(2)
Faruque et al.: Content-based image retrieval in radiology. . .

3 ResultsDistributions of the ratings: Distributions of ratings of all fourradiologists’ and four of the six nonradiologists’ ratings of over-all similarity appeared to be bimodal distributions (Fig. 3). Forthe remaining readers, the distributions appeared to be Gaussian.The feature similarity ratings also showed mostly bimodal dis-tributions that were similar to the distributions of ratings foroverall similarity.
Intra-reader agreement: We report median values of Kappasince the distribution of Kappa values is often skewed. Themedian Kappa values for intra-reader agreement for overall
similarity between the first and the second, first and third, andsecond and third presentations of the 15 repeated pairs were0.78, 0.72, and 0.82, respectively (Fig. 4). For all the feature simi-larities and image repetitions, the median intra-reader agreementranged between 0.57 (for agreement between the second and thirdpresentations for the density heterogeneity feature) and 0.86(for agreement between the second and third presentations forthe average density feature). Hypothesis testing for differencesbetween the radiologists and nonradiologists did not achievestatistical significance (p-values ranged from 0.08 to 0.82).
Inter-reader agreement: The median Kappa value for inter-reader agreement values for overall similarity was 0.39 (Fig. 5).
Fig. 3 Distributions of ratings of radiologist and nonradiologist ratings for overall similarity between thelesions in the images. The y -axis shows the number of occurrences at each of the values on the 9-pointrating scale.
Fig. 4 Intra-reader agreement (Kappa) between the first and second,first and third, and second and third presentations of image pairs for allthe readers. Plots show the median (white line), minimum and maxi-mum (ends of the whiskers), and the first and third quartiles (ends ofthe boxes).
Fig. 5 Inter-reader agreement for overall similarity and similarity ineach of the five features. Plots show the median (white line), minimumand maximum (ends of the whiskers), and the first and third quartiles(ends of the boxes).
Journal of Medical Imaging 025501-5 Apr–Jun 2015 • Vol. 2(2)
Faruque et al.: Content-based image retrieval in radiology. . .

For only radiologists and only nonradiologists, respectively,the median Kappa values were 0.51 and 0.45. For the imagefeature similarity ratings, the median inter-reader agreementfor all the readers ranged from 0.24 (for the density hetero-geneity feature) to 0.58 (for the average density feature). Forthe radiologists’ ratings of image features, the median valuesranged from 0.31 (for the margin contour feature) to 0.62(for the average density feature); for the nonradiologists, themedian values ranged from 0.26 (for the density heterogeneityfeature) to 0.57 (for the average density feature). Hypothesistesting for differences between the inter-reader agreement inradiologists, nonradiologists, and all readers did not achievestatistical significance for overall similarity and each of the
features (p-values ranged from 0.08 to 0.42) using a two-sided Wilcoxon test.
We viewed the image pairs in which the readers’ ratings foroverall perceptual similarity agreed the least and the most asmeasured by the Euclidean distances between the ratings(Fig. 6). The five image pairs with the greatest agreement, orthe least Euclidean distance between the ratings, all appeared tobe pairs in which readers thought that the two lesions were verysimilar or very dissimilar. In the five image pairs with the leastagreement, or the greatest Euclidean distance between the rat-ings, readers’ ratings for each pair spanned the entire scale. Ofthese five pairs, one pair was the second pair presented insequence to odd numbered readers (and the 165th pair presented
Fig. 6 (a) Five pairs of images in which agreement between the readers was the greatest, and (b) fivepairs of images in which agreement between the readers was the least. High values indicate that readersthought lesions were very similar, whereas low values indicate that readers thought the lesions werevery different. Mean similarity ratings are shown below each image, with the ranges in parentheses.
Journal of Medical Imaging 025501-6 Apr–Jun 2015 • Vol. 2(2)
Faruque et al.: Content-based image retrieval in radiology. . .

to even numbered readers), and another pair was the 166th pairpresented to the odd numbered readers (and the very first pairpresented to even numbered readers).
Readers’ comments: Following completion of rating overallsimilarity in the images, multiple readers responded that theyused the following lesion features for their similarity judgments:
• Lesion texture
• Lesion edge sharpness
• Density (or brightness or intensity)
• Contrast
• Lesion size.
4 Discussion
4.1 Data Collection
Our technique of selecting a subset of pairs of already somewhatsimilar images allowed readers to complete the study in a matterof hours. One of the challenges with this technique, however, isthat the results may change when highly dissimilar images arealso included. Studies that include images which are more dis-similar to each other, such as a random sampling of all possiblepairs, may be used to investigate this. Additionally, the processof grouping the 53 images for this study into groups that weresomewhat similar to each other is in itself a task that may besubjected to high levels of variability. Thus, this work couldalso benefit from further studies that evaluate the repeatabilityand variability of performing this task.
4.2 Data Analysis
Distributions of ratings: One possible reason for the mostlybimodal distribution of the ratings is that the readers may per-ceive similarity between images as either somewhat similar orsomewhat dissimilar and then refine further within each cat-egory. Since the image pairs presented were within groups ofimages that were chosen to be somewhat similar to eachother, we hypothesized that a larger fraction of the ratingswould be on the end of the scale corresponding to imagesthat were considered very similar. However, most readersused the entire 9-point rating scale and did not seem to providemore ratings near the upper end of the scale corresponding tohigh similarity. It is interesting that in a previous study that pre-sented images that were assumed to be very dissimilar as well asimages that were assumed to be similar to each other, readers’ratings of similarity were also bimodally distributed across theentire scale.33 It is thus possible that the selection of any subsetof image pairs may nonetheless result in bimodally distributedratings of similarity as the readers calibrate their ratings basedon the image pairs that they see.
Another notable observation is that the distributions of all theradiologist readers’ ratings were bimodal, whereas two nonradi-ologists’ distributions of ratings were not. One possible explan-ation for the radiologists’ better consistency is that they haveyears of training in medical image interpretation. Anotherexplanation is that the distributions of the ratings may clusterinto different groups, with bimodal distributions being the larg-est group.
Intra-reader agreement: The median values of intra-readeragreement for the overall similarity ratings were above 0.8,which is considered excellent according to the scale by Landis
and Koch.35,36 For the feature ratings, the intra-reader agreementfor average density appeared to be the highest, with excellentagreement, followed by margin definition, also with excellentagreement. The median values for intra-reader agreement formargin contour, structural heterogeneity, and density hetero-geneity were above 0.6, and all values except the median agree-ment between the second and third presentations of the densityheterogeneity feature were above 0.6, which is consideredsubstantial agreement. Since statistically significant differenceswere not noted between intra-reader agreement in the imagepairs, there may not be a “learning curve” for readers to decidehow to rate similarity in images as hypothesized. However,the small sample size (15 repeated pairs) may not have beensufficient to reveal this effect.
One technique for obtaining similarity ratings for large imagedatabases involves dividing the tasks into multiple sessions overlonger periods of time. Since the levels of intra-reader agreementwe measured are generally high, this technique may thus befeasible.
Inter-reader agreement: There was fair to moderate inter-reader agreement for overall similarity between readers. Forthe features, inter-reader agreement varied from fair, with thelowest and highest agreement levels being density heterogeneityand average density, respectively.35 The median values for inter-reader agreement for each of the features were generally lowerthan the values for intra-reader agreement, which is reasonablesince readers are expected to agree more with themselves thanothers. There was no statistically significant difference in inter-reader agreement between radiologists and nonradiologists,which may be because radiologists are trained to make diagno-ses rather than to evaluate similarity between images. Also,a significant difference may not be apparent because of thesmall number of radiologist readers.
Inter-reader agreement may be low for some features becausedifferent readers may have different ways of interpreting simi-larity in those features. For example, with structural hetero-geneity and density heterogeneity, readers may disagree ona pair of lesions because some readers may interpret a lesionas homogeneous with a fine texture, whereas other readersmay interpret the same lesion as having many different piecesand thus very heterogeneous.
Our study showed rectangular ROIs around each tumor todistinguish it from any other tumors that might have been onthe image and asked radiologists to rate features of what theyperceived to be the tumor. Within the rectangle, perceptionsof whether a region is part of the tumor may vary among radi-ologists and may contribute to inter-reader variability.
Our considerations when selecting image pairs included(a) selecting a number of pairs that could be viewed by the par-ticipants in a reasonable amount of time, and (b) selecting a sub-set of pairs that is somewhat similar to each other. To achievethis, we divided the images into groups and selected image pairsfor comparison from within each group. However, this tech-nique has its limitations, such as inadequate representation ofall possible pairs, and not obtaining information about highlydissimilar pairs.
In the image pairs with the least and most Euclidean distancebetween the ratings, the pairs with the least distance (or mostagreement) were the pairs that readers all rated as either verysimilar or very dissimilar. This is expected, since readersmay agree more with each other when rating similarity at theextreme ends of the spectrum. The image pairs with the most
Journal of Medical Imaging 025501-7 Apr–Jun 2015 • Vol. 2(2)
Faruque et al.: Content-based image retrieval in radiology. . .
distance (or least agreement) appear to contain images that aremore ambiguous in interpretation. For example, in images inwhich a region of the lesion was isodense with the surroundingliver, some readers may have considered this region to be part ofthe lesion and others may have not, resulting in discrepancies inthe similarity ratings. Also, two of the five image pairs withthe greatest Euclidean distance were among the very first pairsthat some readers viewed during the study. The ratings for thesepairs may have high variability because readers had not yetviewed enough pairs to calibrate their ratings relative to theother presented pairs. Approaches for reducing both intra- andinter-reader variability may include presenting more trainingexamples prior to beginning the similarity evaluation task.Additionally, there are a number of other distance metrics thatcould be used in the future instead of the Euclidean distancemetric, each with their advantages and disadvantages.
One technique of obtaining similarity ratings for large data-sets involves assigning a different subset of images to eachreader and patching the results together into a similarity matrix.Since the results here show that the inter-reader agreement wasonly moderate in some cases, this technique may be challengingto implement without first investigating techniques for improv-ing inter-reader agreement.
Responses to survey questions: In the survey responses,many of the imaging features that the readers noted were usefulin making both diagnoses and image similarity judgments werealso the features that we selected for the study tasks, whichprovided good verification that these were indeed relevant fea-tures for analysis. These included features such as texture,sharpness, and density. However, several readers also respondedthat the lesion size, which we asked readers to disregard, wasalso a factor in their decision making. Based on this, it maybe useful in future studies to ask readers to evaluate lesionsize in addition to existing features. While most of the readersfelt that the image texture was important, high inter-readervariability existed in the ratings of structural heterogeneity anddensity heterogeneity.
In conclusion, our results show that the medical image sim-ilarity perception is a complex visual task that requires rigorousattention to training, experimental detail, and careful attention tointra- and inter-reader effects. Our results also show that deter-mining whether CT liver image similarity can be quantifiedwell enough for CBIR is not straightforward and may dependon how the reference standard is generated. For example, theintra- and inter-reader variability in our data show that sometechniques for developing accurate reference standards forlarge databases, such as asking readers to view many imagesover extended periods of time, may be feasible, whereas othertechniques, such as patching together multiple readers’ ratingsinto a single similarity matrix, may prove challenging. Toaddress these findings, future work includes developing CBIRsystems that update their notions of similarity over time as indi-vidual readers use the system, and that can be customized bythe user(s).
AcknowledgmentsWe would like to thank our participants for evaluating theimages in this study, which included R. Brooke Jeffrey, MD,Rupesh Kalthia, MD, Dorcas Yao, MD, Ashwini Zenooz, MD,Adrian Albert, Jocelyn Barker, Tim Dorn, Daniel Golden, andDebra Willrett.
References1. American Cancer Society, Cancer Facts and Figures 2013, American
Cancer Society, Atlanta, GA (2013).2. D. Marin et al., “Imaging approach for evaluation of focal liver lesions,”
Clin. Gastroenterol. Hepatol. 7, 624–634 (2009).3. I. R. Kamel, E. Liapi, and E. K. Fishman, “Liver and biliary system:
evaluation by multidetector CT,” Radiol. Clin. North Am. 43, 977–997,vii (2005).
4. K. J. Mortele and P. R. Ros, “Cystic focal liver lesions in the adult:differential CT and MR imaging features,” RadioGraphics 21, 895–910(2001).
5. H. Muller et al., “A review of content-based image retrieval systems inmedical applications: clinical benefits and future directions,” Int. J.Med. Inf. 73, 1–23 (2004).
6. H. Muller et al., “Benefits of content-based visual data access in radi-ology,” RadioGraphics 25, 849–858 (2005).
7. H. Muller et al., “A review of content-based image retrieval systems inmedical applications-clinical benefits and future directions,” Int. J. Med.Inf. 73(1), 1–23 (2003).
8. J. P. Eakins, “Towards intelligent image retrieval,” Pattern Recognit.35, 3–14 (2002).
9. R. Datta et al., “Image retrieval: ideas, influences, and trends of the newage,” ACM Comput. Surv. 40, 5:1–5:60 (2008).
10. K. Doi, “Computer-aided diagnosis in medical imaging: historicalreview, current status and future potential,” Comput. Med. ImagingGraphics 31, 198–211 (2007).
11. D. L. Akgul et al., “Content-based image retrieval in radiology:current status and future directions,” J. Digit. Imaging 24(2), 208–222(2011).
12. C. Muramatsu et al., “Investigation of psychophysical similaritymeasures for selection of similar images in the diagnosis of clusteredmicrocalcifications on mammograms,” Med. Phys. 35, 5695–5702(2008).
13. B. M. Mehtre, M. S. Kankanhalli, and W. F. Lee, “Shape measures forcontent based image retrieval: a comparison,” Inform. Process. Manag.33(3), 319–337 (1997).
14. J. Xu et al., “A comprehensive descriptor of shape: method and appli-cation to content-based retrieval of similar appearing lesions in medicalimages,” J Digit. Imaging 25, 121–128 (2012).
15. P. W. Huang and S. K. Dai, “Design of a two-stage content-based imageretrieval system using texture similarity,” Inform. Process. Manag.40(1), 81–96 (2004).
16. C. Lin, R. Chen, and Y. Chan, “A smart content-based image retrievalsystem based on color and texture feature,” Image Vision Comput. 27,658–665 (2009).
17. G. Giacinto and F. Roli, “Bayesian relevance feedback for content-based image retrieval,” Pattern Recognit. 37, 1499–1508 (2004).
18. G. Duan, J. Yang, and Y. Yang, “Content-based image retrievalresearch,” Phys. Procedia 22, 471–477 (2011).
19. R. Zhang and Z. Zhang, “BALAS: empirical Bayesian learning inthe relevance feedback for image retrieval,” Image Vision Comput. 24,211–223 (2006).
20. J. Peng, B. Bhanu, and S. Qing, “Probabilistic feature relevancelearning for content-based image retrieval,” Comput. Vision ImageUnderstanding 75, 150–164 (1999).
21. Y. Liu et al., “A survey of content-based image retrieval with high-levelsemantics,” Pattern Recognit. 40, 262–282 (2007).
22. E. A. Krupinski and K. S. Berbaum, “The medical image perceptionsociety update on key issues for image perception research,” Radiology253, 230–233 (2009).
23. E. A. Krupinski, “The role of perception in imaging: past and future,”Semin. Nucl. Med. 41, 392–400 (2011).
24. D. J. Manning, A. Gale, and E. A. Krupinski, “Perception research inmedical imaging,” Br. J. Radiol. 78, 683–685 (2005).
25. C. A. Beam et al., “The place of medical image perception in 21st-century health care,” J. Am. Coll. Radiol. 3, 409–412 (2006).
26. C. Muramatsu et al., “Experimental determination of subjective similar-ity for pairs of clustered microcalcifications on mammograms: observerstudy results,” Med. Phys. 33, 3460–3468 (2006).
27. R. Nakayama et al., “Evaluation of objective similarity measures forselecting similar images of mammographic lesions,” J Digit. Imaging24, 75–85 (2011).
Journal of Medical Imaging 025501-8 Apr–Jun 2015 • Vol. 2(2)
Faruque et al.: Content-based image retrieval in radiology. . .
28. C. Muramatsu et al., “Investigation of psychophysical measure forevaluation of similar images for mammographic masses: preliminaryresults,” Med. Phys. 32, 2295–2304 (2005).
29. C. Muramatsu et al., “Determination of similarity measures for pairs ofmass lesions on mammograms by use of BI-RADS lesion descriptorsand image features,” Acad. Radiol. 16, 443–449 (2009).
30. Q. Li et al., “Investigation of new psychophysical measures forevaluation of similar images on thoracic computed tomography fordistinction between benign and malignant nodules,” Med. Phys. 30,2584–2593 (2003).
31. A. W. M. Smeulders et al., “Content-based image retrieval at the end ofthe early years,” IEEE Trans. Pattern Anal. Mach. Intell. 22, 1349–1380(2000).
32. H. Muller et al., “Performance evaluation in content-based imageretrieval: overview and proposals,” Pattern Recognit. Lett. 22, 593–601(2001).
33. J. Faruque et al., “A scalable reference standard of visual similarity fora content-based image retrieval system,” IEEE Healthcare Inf. ImagingSyst. Biol. 158–165 (2011).
34. J. Faruque et al., “Modeling perceptual similarity measures in CTimages of focal liver lesions,” J. Digit. Imaging 26(4), 714–720(2013).
35. J. L. Fleiss and J. Cohen, “The equivalence of weighted Kappa andthe intraclass correlation coefficient as measures of reliability,” Educ.Psychol. Meas. 33(3), 613–619 (1973).
36. J. R. Landis and G. G. Koch, “The measurement of observer agreementfor categorical data,” Biometrics 33, 159–174 (1977).
37. H. L. Kundel and M. Polansky, “Measurement of observer agreement,”Radiology 228, 303–308 (2003).
Jessica Faruque is currently a postdoctoral fellow at the NationalInstitutes of Health. She received her PhD in electrical engineeringfrom Stanford University in 2014. She received her master’s degreein electrical engineering from Stanford University, and bachelor’sdegrees in electrical engineering and mathematics from CaliforniaPolytechnic State University, San Luis Obispo. Her research focuseson medical imaging, image processing, and machine learning.
Christopher F. Beaulieu is a professor of radiology and chief ofmusculoskeletal imaging at Stanford University. He received his MDand PhD degrees from the University of Washington in Seattle,Washington, USA, and was a radiology resident at Duke University inDurham, North Carolina. He completed a fellowship in abdominal im-aging at Stanford University. His research focuses on image process-ing, imaging informatics, and computer-aided detection in radiology.
Jarrett Rosenberg is a research scientist and biostatistician in theDepartment of Radiology at Stanford Medical School. He has exten-sive experience in both industrial and academic settings on experi-mental studies of measurement.
Daniel L. Rubin is an assistant professor of radiology and medicine(Biomedical Informatics Research) at Stanford University. He is PI oftwo centers in the NCI Quantitative Imaging Network (QIN), chair ofQIN Executive Committee, and chair of Informatics Committee of theECOG-ACRIN cooperative group. His NIH-funded research programfocuses on quantitative imaging and techniques to integrate thesedata and discover imaging phenotypes that can predict underlyingbiology, define disease subtypes, and personalize treatment.
Dorcas Yao is a Stanford University affiliated clinical associate pro-fessor at the VA Palo Alto Health Care System. She is board-certifiedin clinical informatics and radiology, with 15+ years of clinical expe-rience. She is passionate about improving health care delivery,with extensive experience in healthcare information technology andchange management. She is also an MBA candidate with a concen-tration in medical management and leads projects aimed at improvingoperation, quality, processes, and outcomes.
Sandy Napel received his BS in engineering sciences from SUNYStony Brook (1974), and his MS (1976) and PhD (1981) degreesin electrical engineering from Stanford University. He is a professorof radiology and, by courtesy, of electrical engineering and medicineat Stanford University. He co-leads the Stanford Radiology 3D andQuantitative Imaging Lab and the Section on Integrative BiomedicalImaging Informatics, where he is developing techniques linking imagefeatures to molecular properties of disease.
Journal of Medical Imaging 025501-9 Apr–Jun 2015 • Vol. 2(2)
Faruque et al.: Content-based image retrieval in radiology. . .
![Image Retrieval for Image-Based Localization Revisited · 2015. 4. 9. · retrieval systems [7,25,30] and image retrieval approaches for image-based localization. The former aim at](https://img.dokumen.tips/doc/110x75/601719b1ed8cce647e7cea7c/image-retrieval-for-image-based-localization-revisited-2015-4-9-retrieval-systems.jpg)
![Medical Image Retrieval Using Fuzzy Connectedness Image ... · Medical Image Retrieval Using Fuzzy Connectedness Image Segmentation ... expectation maximization [4]-[6] algorithm](https://img.dokumen.tips/doc/110x75/5b7bb89f7f8b9a004b8d3109/medical-image-retrieval-using-fuzzy-connectedness-image-medical-image-retrieval.jpg)


![Content Based Image Retrieval using Query by Approximate … · Retrieval (KBIR), Semantic Based Image Retrieval (SBIR) and Content Based Image Retrieval (CBIR) [1]. The KBIR methods](https://img.dokumen.tips/doc/110x75/604cc727f7fc662d1d5e1fe3/content-based-image-retrieval-using-query-by-approximate-retrieval-kbir-semantic.jpg)