Embed Size (px)
Citation preview

7/28/2019 Container Corporation - MoST
http://slidepdf.com/reader/full/container-corporation-most 1/42
On high ground
Container Corporation of India
15 October 2012
Initiating Coverage | Sector: Logistics
Siddharth Bothra ([email protected]); +91 22 3029 5127

7/28/2019 Container Corporation - MoST
http://slidepdf.com/reader/full/container-corporation-most 2/42
Container Corporation of India
15 October 2012 2
Container Corporation of India: On high ground
Page No.
Summary ............................................................................................................ 3
Story in charts ................................................................................................ 4-5
Set to further expand its inimitable moat ................................................. 6-11
Industry background ................................................................................. 12-14
Multiple medium-to-long-term triggers ................................................... 15-22
Leveraging strategic JVs to provide total logistics services ..................... 23-24
Financials robust despite higher competition ......................................... 25-33
Initiating coverage with Buy ..................................................................... 34-39
Financials and valuation ........................................................................... 40-41

7/28/2019 Container Corporation - MoST
http://slidepdf.com/reader/full/container-corporation-most 3/42
Container Corporation of IndiaCMP: INR1,048 TP: INR1,250 Buy
Bloomberg CCRI IN
Equity Shares (m) 130.0
52-Week Range (INR) 1,057/805
1,6,12 Rel. Perf. (%) 3/0/-7
M.Cap. (INR b) 130.9
M.Cap. (USD b) 2.5
15 October 2012
Initiating Coverage | Sector: Logistics
BSE SENSEX S&P CNX
18,793 5,705
On high groundKey beneficiary of GoI’s thrust on Indian Railways to correct freight modal
mix / key reforms; competition unable to mimic success
Over FY13-17, CCRI would be a big beneficiary of (1) the government’s focus on Indian
Railways to correct freight transport modal mix, (2) infrastructure projects like the DFC
and container port capacity expansions, and (3) key reforms such as GST and FDI in retail.
Since 2006, ~15 new players have entered the container train operation (CTO) business.
However, none of them have been able to mimic CCRI’s success.
By virtue of its legacy pan India strategic assets, CCRI enjoys an inimitable resource
advantage over its peers, which is steadily increasing with time.
While concerns such as high empties cost and muted near-term growth outlook remain,the long-term prospects are favorable for CCRI and outweigh near-term concerns. We
initiate coverage with a Buy rating.
Set to further expand its inimitable moat
By virtue of its legacy low cost pan India strategic assets, Container Corporation
of India (CCRI) enjoys an inimitable resource advantage over its peers, which is
steadily increasing with time. None of the 15-odd new players that have entered
since the container train operation (CTO) industry was opened in FY06 have even
achieved minimum economies of scale. CCRI is implementing preemptive capex
of INR62b, which will not only further enhance its competitive advantage, but
also allow it to position itself as a total logistics player.
Multiple medium-to-long-term triggers
CCRI is one of the best proxies to play multiple themes such as (1) infrastructure
thrust, especially investments aimed at correcting the freight transport modal
mix, (2) reforms – GST, FDI in Retail, and (3) ongoing structural trends –
containerization, shift from road to rail. Successful execution of proposed
infrastructure capex and key reforms could result in container rail traffic growing
at 17.6% over FY13-18. As the undisputed leader, CCRI should benefit the most.
We expect CCRI’s volumes to grow at a CAGR of 17.1% over FY13-18.
Leveraging strategic JVs to provide total logistics services
CCRI’s key strength is its ability to provide single window facility for multimodal
logistics services. It is able to do so through its strategic JVs with its customers
(GDL/Allcargo), port operators (APM/ DPI), road haulers (TCI), air cargo (HALCON/
GVK) and shipping lines (Maersk).
Initiating coverage with Buy
We believe CCRI’s inimitable pan India network provides it with a significant
moat, which coupled with positive long-term industry prospects, will allow it to
enjoy a prolonged period of growth. We believe DCF is the best way to capture
the intrinsic value of CCRI, given its stable cash flow, consistent payout ratio,
robust operational RoCE and low reinvestment requirements. Initiate coverage
with a Buy rating and a target price of INR1,250 (upside of 19.3%).
15 October 2012
Stock performance (1 year)
Shareholding pattern (%)
As on Jun-12 Mar-12 Jun-11
Promoter 63.09 63.09 63.09
Dom. Inst 7.09 7.31 7.24
Foreign 25.55 25.65 26.51
Others 4.28 3.96 3.16
Investors are advised to refer
through disclosures made at the end
of the Research Report.
3
Valuation summary (INR b)
Y/E March 2012 2013E 2014E
Sales 41.0 44.5 49.9
EBITDA 10.2 11.3 13.0
NP 8.7 9.4 10.0
EPS (INR) 66.6 72.4 77.0
EPS Gr. (%) -1.2 8.7 6.3
BV/Sh. (INR) 427.4 480.0 536.1
P/E (x) 14.0 12.9 12.1
P/BV (x) 2.2 1.9 1.7
EV/EBITDA (x) 10.6 10.1 8.8
EV/Sales (x) 2.7 2.6 2.3
RoE (%) 16.5 16.0 15.1
RoCE (%) 22.3 21.0 20.0
Prices as on 11 October 2012
7/28/2019 Container Corporation - MoST
http://slidepdf.com/reader/full/container-corporation-most 4/42
Container Corporation of India
15 October 2012 4
Story in charts Key beneficiary of thrust to correct freight modal mix
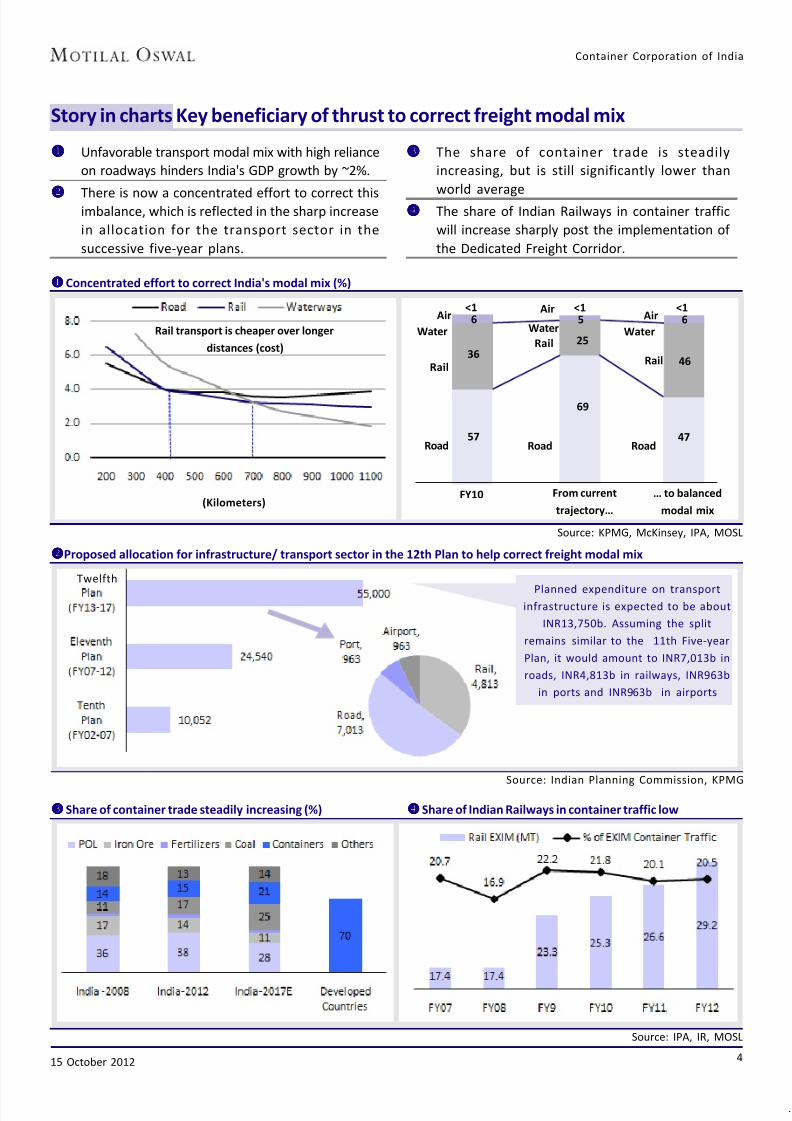
Unfavorable transport modal mix with high reliance
on roadways hinders India's GDP growth by ~2%.
There is now a concentrated effort to correct thisimbalance, which is reflected in the sharp increase
in allocation for the transport sector in the
successive five-year plans.
The share of container trade is steadily
increasing, but is still significantly lower than
world average
The share of Indian Railways in container traffic
will increase sharply post the implementation of
the Dedicated Freight Corridor.
Planned expenditure on transportinfrastructure is expected to be about
INR13,750b. Assuming the split
remains similar to the 11th Five-year
Plan, it would amount to INR7,013b in
roads, INR4,813b in railways, INR963b
in ports and INR963b in airports
Source: Indian Planning Commission, KPMG
Concentrated effort to correct India's modal mix (%)
Source: KPMG, McKinsey, IPA, MOSL
Air
Water
Rail
Road
<1 <1 <1
FY10 From current
trajectory…
… to balanced
modal mix
6
36
57
69
47
25
5 6Air
Water
Rail
Road
Air
Water
Rail
Road
46
(Kilometers)
Rail transport is cheaper over longer
distances (cost)
Proposed allocation for infrastructure/ transport sector in the 12th Plan to help correct freight modal mix
Source: IPA, IR, MOSL
Share of container trade steadily increasing (%) Share of Indian Railways in container traffic low
Twelfth
7/28/2019 Container Corporation - MoST
http://slidepdf.com/reader/full/container-corporation-most 5/42
Container Corporation of India
15 October 2012 5
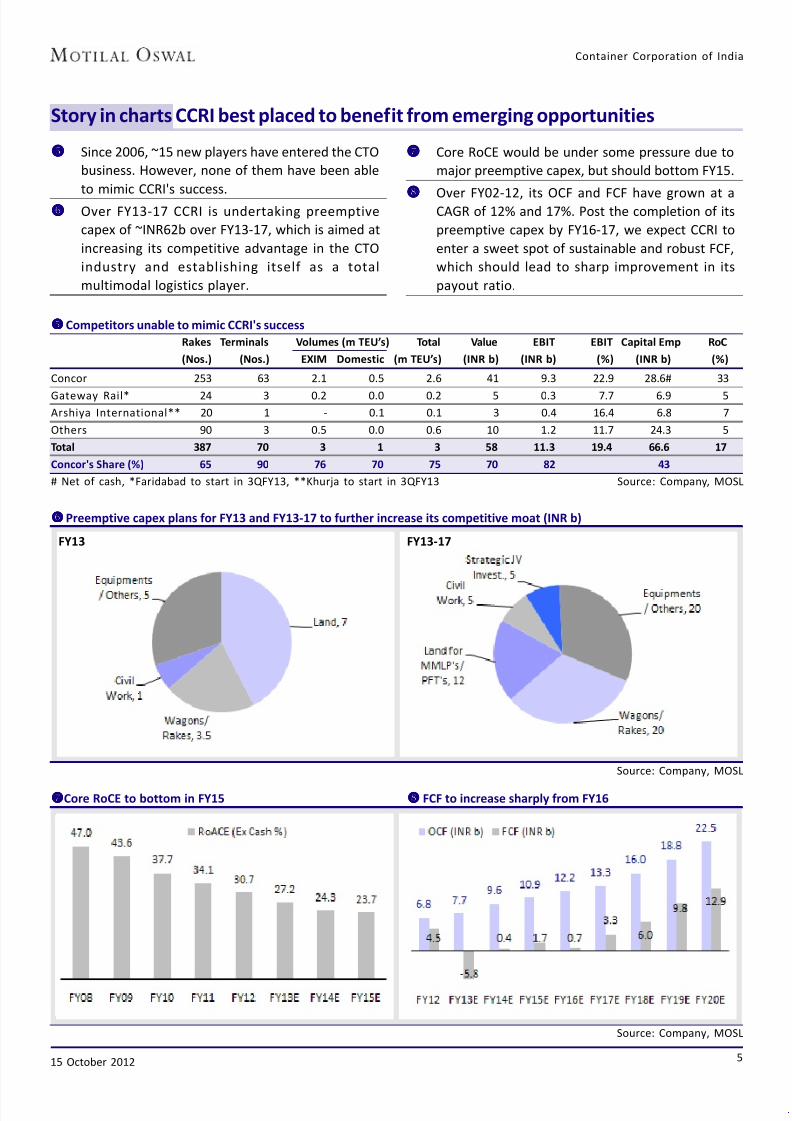
Since 2006, ~15 new players have entered the CTO
business. However, none of them have been able
to mimic CCRI's success.
Over FY13-17 CCRI is undertaking preemptive
capex of ~INR62b over FY13-17, which is aimed at
increasing its competitive advantage in the CTO
industry and establishing itself as a total
multimodal logistics player.
Core RoCE would be under some pressure due to
major preemptive capex, but should bottom FY15.
Over FY02-12, its OCF and FCF have grown at aCAGR of 12% and 17%. Post the completion of its
preemptive capex by FY16-17, we expect CCRI to
enter a sweet spot of sustainable and robust FCF,
which should lead to sharp improvement in its
payout ratio.
Story in charts CCRI best placed to benefit from emerging opportunities
Competitors unable to mimic CCRI's success
Rakes Terminals Volumes (m TEU’s) Total Value EBIT EBIT Capital Emp RoC
(Nos.) (Nos.) EXIM Domestic (m TEU’s) (INR b) (INR b) (%) (INR b) (%)
Concor 253 63 2.1 0.5 2.6 41 9.3 22.9 28.6# 33
Gateway Rail* 24 3 0.2 0.0 0.2 5 0.3 7.7 6.9 5
Arshiya International** 20 1 - 0.1 0.1 3 0.4 16.4 6.8 7
Others 90 3 0.5 0.0 0.6 10 1.2 11.7 24.3 5
Total 387 70 3 1 3 58 11.3 19.4 66.6 17
Concor's Share (%) 65 90 76 70 75 70 82 43
# Net of cash, *Faridabad to start in 3QFY13, **Khurja to start in 3QFY13 Source: Company, MOSL
Source: Company, MOSL
Preemptive capex plans for FY13 and FY13-17 to further increase its competitive moat (INR b)
FY13 FY13-17
Core RoCE to bottom in FY15 FCF to increase sharply from FY16
Source: Company, MOSL
7/28/2019 Container Corporation - MoST
http://slidepdf.com/reader/full/container-corporation-most 6/42
Container Corporation of India
15 October 2012 6
Set to further expand its inimitable moat
Competitive intensity abating; emerging as a total logistics player
By virtue of its legacy low cost pan India strategic assets, CCRI enjoys an inimitable resource
advantage over its peers, which is steadily increasing with time.
None of the 15-odd new players that have entered since the container train operation
(CTO) industry was opened in FY06 have even achieved minimum economies of scale.
CCRI is implementing preemptive capex of INR62b, which will not only further enhance its
competitive advantage, but also allow it to position itself as a total logistics player.
Enjoys inimitable resource advantages
Incorporated in 1988 as a state-owned entity under the Ministry of Railways, CCRI had
the benefit of obtaining Indian Railways’ surplus land at strategic locations at very
attractive long-term lease rates. Till 2006, when private operators were permitted
and licensed to enter the container rail business, it was the monopoly player. CCRI’sfirst mover advantage and legacy low cost strategic rail assets give it inimitable
resource advantages over its peers, which are steadily increasing with time.
Key success factors for a container train operator (CTO)
Extensive pan India asset network of rail terminals / container freight stations
(CFSs) / inland container depots (ICDs) at strategic trade locations
Relationships with major international shipping lines
Ability to offer multi-modal services
Has the largest rail terminal network in IndiaThe nature of the CTO business is such that higher volumes can be captured only if a
player has access to a wide network to handle and consolidate freight. CCRI has ~63
rail terminals at strategic locations across the country. Of these, 18 are pure EXIM
terminals, 33 are combined terminals and 12 are pure domestic terminals. Rail terminal
yards allow consolidation of cargo and enable implementation of the hub and spoke
model. They also enable value addition and drive cost efficiencies.
Setting up a rail terminal is not only capex intensive but also involves the arduous
task of (a) acquiring large contiguous land in close proximity to the railway track for
inland container depots (ICDs) and near ports for container freight stations (CFSs),and (b) procuring regulatory approvals from the central government and linkages
from Indian Railways. Even six years after 15 private CTOs entered the business, they
have cumulatively set up only ~7 terminals.
Though its competitors have added ~134 rakes, ~55% of CCRI's rake capacity of ~253
rakes, they have failed to capture a proportionate share of volumes or industry profits.
Thus, they have been unable to mimic CCRI's financial success. While there are two
key terminals in the NCR region by GDL (at Faridabad) / Arshiya (at Khurja), that are
slated to get operational by 3QFY13 and another 12-15 terminals at planning/
implementation stage by various other CTO players, none of the competitors arelikely to have the network presence to pose any major challenge to CCRI's dominance
in the medium term.
The nature of the CTO
business is such that
higher volumes can be
captured only if a player
has access to a wide
network to handle and
consolidate freight

7/28/2019 Container Corporation - MoST
http://slidepdf.com/reader/full/container-corporation-most 7/42
Container Corporation of India
15 October 2012 7
Favorably placed with respect to power centers in the industry
The importer or exporter typically appoints a shipping company (like Maersk,
Mediterranean Shipping, etc) or a third-party logistics provider (3PL), which in turn
engages ancillary service providers such as CTOs. The hypothetical cost break-up of a
typical container movement between India and US is: ocean freight 58%, destination
delivery 15%, surcharges and taxes 15%, and others ~12%. The CTO accounts for a
small proportion of an exporter/importer’s overall logistics costs.
The three key power centers in the CTO value chain are: (1) international shipping
lines/alliances, (2) Indian Railways, and (3) pan India rail terminal network owners.
Unless, a player has some inimitable advantage with respect to one or more of these
power centers, it is likely to get squeezed and fail to appropriate the value created on
a sustained basis.
1. International shipping lines/alliances: According to industry estimates, ~75% of
the global cargo capacity is controlled by 12-15 international shipping lines/
alliances. They use their power to squeeze counterparty prices, switch between
rail/road, etc. Unless a CTO has a wide network and large scale, it will be unable to
capture the EXIM business, which constitutes ~75% of the CTO market and is
significantly more profitable.
2. Indian Railways: Indian Railways is the sole owner of the rail network and the sole
haulage service provider in India. Since 2006, when private sector companies were
allowed to enter the CTO industry, Indian Railways has increased haulage charges
by ~23%. Haulage charges constitute 70-75% of a CTO’s overall costs and unless aplayer has reasonable pricing power, it will not be in a position to pass through
the frequent increases in haulage charges.
CTOs in India - a snapshot
Name Group Rakes Rail Exim Domestic Locations Other Activities
Terminals (%) (%)
Adani Logistics Adani 6 2 33 67 Gurgaon/ Ports, Container terminals,
Kishangarh CTO, CFS
Concor IR# 253 63 80 20 Pan India Multi modal operator
CRRS* DPW 8 - 100 - Ports, Container terminal
CWC PSU - - 100 - Warehousing, CFS
ETA Star Group Dubai 11 - 80 20 Shipping and port services
Gateway Rail GDL 21 3 84 16 Ludhiana/ Mumbai/ CFS, CTO
Freight Faridabad
Hind Terminals MSC 14 - 100 - Shipping/ Freight Forwarding
India Infra. APL 9 - 98 2 Container shipping, infra
SICAL Logistics - 8 - - 100 CFS, container terminal
Boxtrans (India)** JM Baxi & Co. 12 - 10 90 Container terminal, CFS,
TransRail Logistics - 2 - - 100 TruckingArshiya Rail Infra. - 20 1 5 95 Khurja
KRIL - 8 - 4 96 Fertilizers
Inlogistics NOL, Singapore 15 - - -
Total 387 69 76 24
Concor Share (%) 65 91 76 70
*Cont ai ner RAIL Road Serv ices; **Boxt ra ns (Ind ia ) Logi st ic s Servi ces, #IR: Indi an Rai lway Source: Industry, MOSL
According to industry
estimates, ~75% of the
global cargo capacity is
controlled by 12-15
international shipping
lines/alliances

7/28/2019 Container Corporation - MoST
http://slidepdf.com/reader/full/container-corporation-most 8/42
Container Corporation of India
15 October 2012 8
3. Pan India rail terminal network owners: A pan India rail terminal network owner
like CCRI is able to (1) withstand the bargaining power of international shipping
lines/alliances, and (2) pass through the increases in Indian Railways’ haulage
charges. This allows it to retain the value created on a sustainable basis and enjoy
attractive returns on its capital employed.
In a position to play the game strategicallySetting up rail terminals is capital intensive. The minimum economies of scale
(volume) needed to break even are high, given that the product is homogeneous and
demand exogenous. Success primarily depends on achieving economies of scale,
operational excellence and low cost advantage (establishment cost for CCRI is just 2%
of sales). The size of most sub-markets is limited and setting up a terminal close to an
existing one divides the traffic. Since there is limited scope to create variance in
service offerings, there is risk of price-based competition, which lowers RoCE and
increases the gestation period. By virtue of its first mover and low cost resource
advantages, CCRI is in a position to play the game strategically.
The MES (volume)
needed to break even are
high, given that the
product is homogeneous
and demand exogenous
Understanding the CTO value chain
Source: KPMG Analytics
Sourcing & IntermediationOutbound Cargo Handling
& Domestic Receipt
Inbound Cargo Handling
& International Receipt
Exporter /
ProducerExpress Cargo Agent
Freight Forwarder
Trucking Company
3PL / 4PL Agent
Local
FactoryYard /
Storage
Key Activities:
Sourcing and
Intermediation
LTL / FTL
Management
NVOCC
Management
Arranging /
Broking
Tracking (GPS / IT)
Insurance
Air Cargo Centre
Central Warehouse
ICD
(Container Cargo)
CFS
(Container Cargo)
Key Activities:
Unloading
Inspection
Sorting
Storage
Consolidating /
Bu lk Break in g
Stuffing / De-
stuffing
Customs Handling
/ Clearing
Documentation
Loading
Transit Airport
Local Warehouse
/ Pick Up Point
Consumer
International
Airport
Central
Warehouse
Customs House
Agent
CFS / ICD
Incoming Port
Shipping Line
Importer
Local Warehouse
/ Pick up point
Customs House
Agent
Outgoing Port
Bulk / Break
Bulk Cargo
Legend:
Transport Mode:Road
Rail
Air
Sea
Intermediary Type:
Service Providers
Infrastructure Points
End Users

7/28/2019 Container Corporation - MoST
http://slidepdf.com/reader/full/container-corporation-most 9/42
Container Corporation of India
15 October 2012 9
Competition unable to mimic CCRI's success
Since 2006, when private operators were permitted into the CTO business, ~15 new
players have entered. These players were largely attracted by: (1) robust financials of
the incumbent (PAT margin of 20%; operational RoCE of ~40%), (2) growth potential of
the CTO industry, (3) confidence in their ability to create variance in service offerings,and (4) underestimation of minimum economies of scale.
Most of these players have been unable to mimic CCRI’s success and have been forced
to curtail their expansion plans. This is because of a confluence of factors such as: (1)
shrinking EXIM business due to global economic turmoil, (2) poor economic returns
on capital employed, (3) difficulty in land acquisition for setting up rail terminals, and
(4) contraction of domestic market growth (trade shift to roadways) due to sharp
~22% increase in haulage charges by Indian Railways.
Comparative performance of key playersRakes Terminals Volumes (m TEU’s) Total Value EBIT EBIT Capital Emp RoC
(Nos.) (Nos.) EXIM Domestic (m TEU’s) (INR b) (INR b) (%) (INR b) (%)
Concor 253 63 2.1 0.5 2.6 41 9.3 22.9 28.6# 33
Gateway Rail* 24 3 0.2 0.0 0.2 5 0.3 7.7 6.9 5
Arshiya International** 20 1 - 0.1 0.1 3 0.4 16.4 6.8 7
Others 90 3 0.5 0.0 0.6 10 1.2 11.7 24.3 5
Total 387 70 3 1 3 58 11.3 19.4 66.6 17
Concor's Share (%) 65 90 76 70 75 70 82 43
# Net of cash, *Faridabad to start in 3QFY13, ** Khurja to start in 3QFY13 Source: Company, MOSL
Initially, most of these players were able to expand the market by entering new and
under-serviced routes and concentrating on the neglected domestic market. Almost
10 of these players had initially tied up with CCRI to use its rail terminal network, with
few non-compete clauses. Faced with intense competition, CCRI took several strategic
measures to protect its market share: (a) reduction in tariffs for FEU (forty foot
equivalent unit) containers, (b) reduction in rates on selected routes, (c) introduction
of incentive schemes (volume discounts, bulk discounts, rebates, lower rates for
moving empty containers, and longer free time for clearing loaded containers), and
(d) strategic JVs to provide end-to-end logistics solutions. Since FY11, CCRI’s market
share has stabilized at ~75%.
Most of the new entrants are not making reasonable returns on capital employed and
a few are highly leveraged. Though one of the reasons for the low returns is the fact
that investments are front loaded, nevertheless, since competitors still far away from
reaching MES, the returns are likely to remain under pressure in the medium term.
On the other hand, the financial situation of CCRI remains robust (net cash of INR30b
+ operating cash flow of INR10b). As such, the competition does not pose a major
challenge to CCRI in the near term. While its competitors plan to cumulatively add
~18-20 rakes in FY13, CCRI alone intends to induct ~30 rakes during the year.
Most of the
new entrants are not
making reasonable
returns on capital
employed and a few are
highly leveraged

7/28/2019 Container Corporation - MoST
http://slidepdf.com/reader/full/container-corporation-most 10/42
Container Corporation of India
15 October 2012 10
Volume comparison over FY07-12 (Industry v/s CCRI)
FY07 FY08 FY9 FY10 FY11 FY12 CAGR (%) CAGR
(FY07-12) (FY10-12)
Indian Railways (m tons)
EXIM 17.4 17.4 23.3 25.3 26.6 29.1 10.9 7.3
Domestic 2.9 3.7 7.1 9.6 11.0 9.2 26.0 -2.2
Total 20.3 21.1 30.3 35.0 37.6 38.4 13.6 4.8
% Change
EXIM -0.1 33.9 8.7 4.9 9.6
Domestic 28.9 88.5 36.6 14.3 -16.4
Total 4.1 43.6 15.2 7.6 2.0
Concor (m TEU's)
EXIM 1.7 1.9 1.9 1.9 2.0 2.1 4.5 6.5
Domestic 0.4 0.5 0.5 0.5 0.5 0.5 3.7 -6.8
Total 2.1 2.5 2.3 2.4 2.6 2.6 4.3 3.7
% Change
EXIM 15.3 -6.2 1.5 7.2 5.8Domestic 20.7 -3.6 18.9 0.9 -13.9
Total 16.3 -5.7 4.9 5.8 1.6
Container Traffic by Ports 84 103 105 116 132 142 11.1 10.6
Railway Share of EXIM (%) 21 17 22 22 20 21
Source: Company, MOSL, Indian Railways
Competitive intensity decliningCCRI’s market share has declined from 85% in FY08 to ~74% in 1QFY13. However, only
2-3 players (like GDL, Arshiya and Boxtrans) have been able to achieve any credible
scale and none of the new entrants have achieved minimum economies of scale.
Also, the incremental loss of market share for CCRI (gap between growth rates for
industry and CCRI) has reduced sharply over FY11-12. We expect this trend to sustain
and CCRI’s market share to become more resilient with competitive intensity abating.
New entrants seem to have underestimated minimum economies of scale: The
new entrants seem to have underestimated minimum economies of scale. Based
on our industry interaction, we estimate the minimum economies of scale at ~45
rakes and 6-7 terminals spread across the country, with a high concentration inthe North-West. This implies minimum investment of ~INR13b (terminals: INR1.2b-
1.5b each and rakes: INR120m each).
CCRI EXIM growth has stabalized (YoY) Domestic growth under pressure (YoY)
Source: Company, MOSL
The new entrants
seem to have
underestimated MES
7/28/2019 Container Corporation - MoST
http://slidepdf.com/reader/full/container-corporation-most 11/42
Container Corporation of India
15 October 2012 11
CCI ruling brings increased clarity: The recent ruling by Competition Commission
of India (CCI) on a case between Arshiya International and CCRI has increased
clarity on the rights of private players to use its rail infrastructure. Arshiya had
moved the Commission alleging that Indian Railways and CCRI work as a group
and indulge in exclusionary price discrimination and unfair trade practices. TheCommission ruled that there was no abuse of dominant position by the two
entities. However, it admonished Indian Railways for frequently changing its
haulage charges.
Emerging as a total logistics player
CCRI is implementing a preemptive capex of INR62b, which will not only further
enhance its inimitable competitive advantage, but also allow it to position itself as a
total logistics player. A multi-modal (sea, rail, air, etc) service provider has an edge
over a standalone operator. CCRI aims to provide a unique value proposition by offering
a multi-modal single window facility, coordinating with various agencies and servicesinvolved in the containerized cargo trade. These include customers, gateway port,
railways, road haulers, consolidators, forwarders, custom house agents and shipping
lines. To achieve a high degree of customization, CCRI plans to offer packages designed
to provide the most cost effective combination.
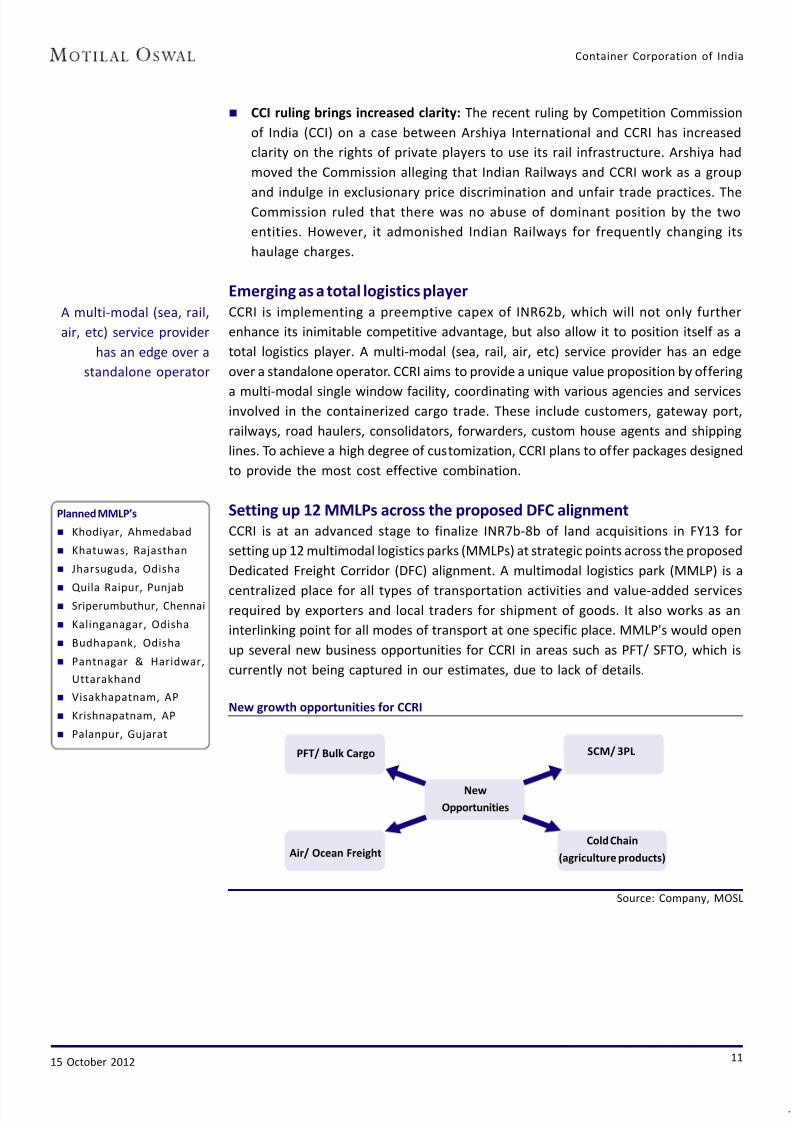
Setting up 12 MMLPs across the proposed DFC alignment
CCRI is at an advanced stage to finalize INR7b-8b of land acquisitions in FY13 for
setting up 12 multimodal logistics parks (MMLPs) at strategic points across the proposed
Dedicated Freight Corridor (DFC) alignment. A multimodal logistics park (MMLP) is a
centralized place for all types of transportation activities and value-added servicesrequired by exporters and local traders for shipment of goods. It also works as an
interlinking point for all modes of transport at one specific place. MMLP's would open
up several new business opportunities for CCRI in areas such as PFT/ SFTO, which is
currently not being captured in our estimates, due to lack of details.
New growth opportunities for CCRI
PFT/ Bulk Cargo SCM/ 3PL
New
Opportunities
Air/ Ocean FreightCold Chain
(agriculture products)
Source: Company, MOSL
Planned MMLP’s
Khodiyar, Ahmedabad
Khatuwas, Rajasthan
Jharsuguda, Odisha
Quila Raipur, Punjab Sriperumbuthur, Chennai
Kalinganagar, Odisha
Budhapank, Odisha
Pantnagar & Haridwar,
Uttarakhand
Visakhapatnam, AP
Krishnapatnam, AP
Palanpur, Gujarat
A multi-modal (sea, rail,
air, etc) service provider
has an edge over a
standalone operator
7/28/2019 Container Corporation - MoST
http://slidepdf.com/reader/full/container-corporation-most 12/42
Container Corporation of India
15 October 2012 12
Size of the industry
The size of India’s rail container transport operation (CTO) industry is ~38m tons in
volume terms and ~INR58b in value terms.
Industry segmentation
The CTO industry can be divided into two segments – EXIM and domestic. The
EXIM segment accounts for ~75% of the market while the domestic segment
accounts for ~25% of the market.
EBIT margins in the EXIM segment are high at 21-25% compared with 9-12% in the
domestic segment. The key reasons for this variance are: (1) the EXIM segment
enjoys higher terminal handling revenue due to customs, clearance, etc, (2) the
EXIM trade has more balanced up and down loads, leading to lower empties cost,
and (3) turnaround time for the domestic segment is high. The north western part of India accounts for ~70% of the EXIM trade, with JNPT
alone handling ~41% of the container port traffic.
The traffic-handling capacity of major ports has increased at a CAGR of 13.4% from
504.7m tons in FY07 to 947m tons in FY12. During this period, most major ports
operated at a capacity of over 90%.
Liberalization of the industry
The domestic CTO industry was first liberalized in 1988, when Indian Railways
carved out its CTO operations, leading to the creation of Container Corporation of
India (CCRI). CCRI was established with the objective of facilitating primarily EXIMcontainer movement and providing other logistics services like one-window
customs clearing, ICD/CFS, etc. To carry out these services effectively, it was
provided with land by Indian Railways at strategic locations where trade originates.
On 5 January 2006, private sector companies were permitted to enter the industry,
with a view to attract a greater share of container traffic for Indian Railways and to
introduce competition in rail freight services. Indian Railways remains the sole
owner of the rail network and the sole haulage service provider in India.
Since 2006, ~15 new players (13 private and two state-owned) have entered the
industry. To satisfy the requirement of access to terminals, 10 of the 15 new CTOs
initially signed MoUs with CCRI. The new CTOs were able to compete with CCRI, a monopoly service provider for
nearly 17 years, by offering value-added services. CCRI’s market share declined
from 85% in FY08 to ~75% in FY12.
Industry background
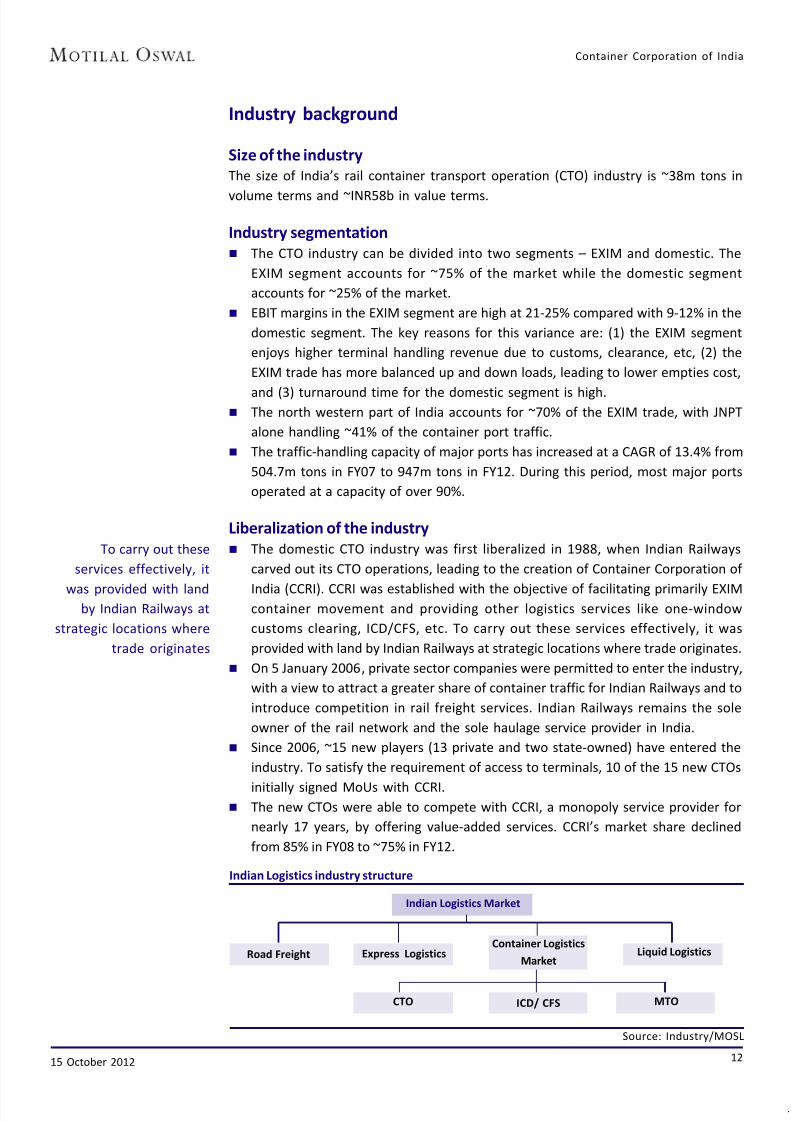
Indian Logistics industry structure
Indian Logistics Market
Express LogisticsRoad FreightContainer Logistics
MarketLiquid Logistics
CTO ICD/ CFS MTO
Source: Industry/MOSL
To carry out these
services effectively, it
was provided with landby Indian Railways at
strategic locations where
trade originates

7/28/2019 Container Corporation - MoST
http://slidepdf.com/reader/full/container-corporation-most 13/42
Container Corporation of India
15 October 2012 13
Industry structure: Homogeneous oligopoly market
Competitive analysis for the CTO industry
Homogeneous Oligopoly Market
Top 4 players control >80% of the market
Nature of demand
Product homogenous
Demand exogenous
Nature of firm interaction
High interdependence
amongst firms
Oligopolies can retain
abnormal profits in the
long run, because
barriers to entry prevent
sideline firms from
entering market to
capture excess profits
Potential to differentiate
Firms sell similar goods
and services, which are
close substitutes and,
thus, price sensitive.
Ability to create service
variance limited
Coordination in industry
capacity so as to avoid
gluts
Willingness to Pay
Substitutes - High
Alternatives to
railways exist, e.g.
road transport,
particularly for
shorter distances
Opportunity Cost
Price
Cost
Value received by
customer
Value received by
firms in the industry
Value received
by supplier
Entry Barriers - High
Minimum economies of scale
(MES) high
High exit barriers due to high
capex intensity
Regulatory requirements
Access to favorable locations
Supplier Power - Medium
Multiple wagon
manufacturers
Many competing suppliers -
products standardized
Buyer Power - High
Buyers consolidated
Availability of possible
substitutes increases buyer
power
Switching cost low for buyers
Rivalry amongst firms - High
Given homogenous product and exogenous demand,
competition is price based. Firms need to rely on operational
excellence and low cost advantage to distinguish themselves
and retain high returns. If competitors are weak, the market
could witness 'winner takes it all' kind of stuation.
Source: Company, MOSL

7/28/2019 Container Corporation - MoST
http://slidepdf.com/reader/full/container-corporation-most 14/42
Container Corporation of India
15 October 2012 14
Container Traffic Growth with GDP EXIM with Container Traffic Growth
Container Traffic vs Port Traffic (%) Container Traffic vs Concor Exim Traffic (%)
India Export Break-up India Import Break-up
*Report of Working Group for Port Sector for the 12th five year plan, Ministry of Shipping Source: IPA, Company, MOSL
Major vs Non Major share (%) Port traffic mix (MT)*
FY02-12 CAGR - 14%FY02-12 CAGR - 23.7%
FY02-12CAGR - 9.4%
FY02-12CAGR - 9.0%

7/28/2019 Container Corporation - MoST
http://slidepdf.com/reader/full/container-corporation-most 15/42
Container Corporation of India
15 October 2012 15
Infrastructure thrust; sharp increase in allocation to transport
It is estimated that India’s transportation and logistics bottlenecks hinder its GDP
growth by ~2%. This is primarily due to the fragmented nature of the industry,
infrastructure constraints across transport modes, and an unfavorable modal mix,
with very high reliance on roadways. There is now a concentrated effort to correctthis imbalance, which is reflected in the sharp increase in allocation for the transport
sector in the successive five-year plans.
Multiple medium-to-long-term triggers
Infrastructure thrust, reforms, structural trends
CCRI is one of the best proxies to play multiple themes such as (1) infrastructure thrust,
especially investments aimed at correcting the freight transport modal mix, (2) reforms –
GST, FDI in Retail, and (3) ongoing structural trends – containerization, shift from road to rail.
Successful execution of proposed infrastructure capex plans and implementation of key
reforms could result in container traffic increasing by 17.6% over FY13-18.
Given that CCRI is the undisputed leader in the industry, it should benefit the most. We
expect CCRI's volumes to grow at a CAGR of 17.1% over FY13-18.
Indian Railways’ Vision 2020 aims to correct the modal mix
The route network of Indian Railways has expanded very slowly. In 1947, Indian
Railways inherited 53,996km of rail network, which stood at ~64,099km, an increase
of 10,000km over 62 years (FY10). Indian Railways’ Vision 2020 proposes to add
25,000km of new lines by 2020, supported by government funding and increase in
PPP. While road transport is the least expensive for distances up to 400km, rail and
waterways are cheaper for longer distances. Currently, traffic flows where rail
transport is structurally cheaper than road transport account for around two-thirds
of the total traffic.
Currently, traffic flows
where rail transport is
structurally cheaper than
road transport account
for around two-thirds of
the total traffic
It is estimated that India’s
transportation and
logistics bottlenecks
hinder its GDPgrowth by ~2%
100% = INR5,785b
100% = INR2,568b
Planned expenditure on
transport infrastructure
is expected to be about
INR13,750b. Assuming
the split remains similar
to the 11th Five-yearPlan, it would amount to
INR7,013b in roads,
INR4,813b in railways,
INR963b in ports and
INR963b in airports
Planned spend
on Transport
Infrastructure
Twelfth
Proposed allocation for infrastructure/ transport sector in the 12th Plan
Source: Indian Planning Commission, KPMG

7/28/2019 Container Corporation - MoST
http://slidepdf.com/reader/full/container-corporation-most 16/42
Container Corporation of India
15 October 2012 16
Dedicated Freight Corridor (DFC) project to transform CTO
The Dedicated Freight Corridor (DFC) is one of the largest infrastructure projects
undertaken by the Indian Railways since independence. Dedicated Freight Corridor
Corporation of India (DFCCIL), a special purpose vehicle (SPV) set up under the
administrative control of the Ministry of Railways, is constructing two corridors
spanning ~3,300km in the first phase – the Western DFC and the Eastern DFC. The
Eastern DFC, starting from Ludhiana in Punjab will pass through the states of Haryana,Uttar Pradesh, Bihar, and terminate at Dankuni in West Bengal. The Western DFC will
traverse the distance from Dadri to Mumbai, passing through the states of Delhi,
Haryana, Rajasthan, Gujarat and Maharashtra.
The Indian Railways’ quadrilateral linking the four metropolitan cities of Delhi,
Mumbai, Chennai and Kolkata, commonly known as the Golden Quadrilateral, and its
two diagonals (Delhi-Chennai and Mumbai-Howrah), adding up to a total route length
of 10,122km carries more than 55% of Indian Railways’ revenue-earning freight traffic.
The existing trunk routes of Howrah-Delhi on the Eastern Corridor and Mumbai-Delhi
on the Western Corridor are highly saturated, line capacity utilization varying between115% and 150%. The surging power needs requiring heavy coal movement, booming
infrastructure construction and growing international trade has led to the conception
of the DFCs.
Category-wise modal share (%)
The Dedicated Freight
Corridor (DFC) is one of
the largest infrastructure
projects undertaken by
the Indian Railways since
independence
Opening up of CTO industry in
2006 alone had led to
industry witnessing a 2.5x/
1.5x/ 1.6x volume growth in
the EXIM/ domestic/ total
segments, over FY08-10.
Rail transport is cheaper over longer distances (cost) Concentrated effort to correct India's modal mix (%)
Source: KPMG, McKinsey, IPA, MOSL
Air
Water
Rail
Road
<1 <1 <1
FY10 From current
Trajectory…
… to balanced
modal mix
6
36
57
69
47
25
5 6Air
Water
Rail
Road
Air
Water
Rail
Road
46
(KM's)
7/28/2019 Container Corporation - MoST
http://slidepdf.com/reader/full/container-corporation-most 17/42
Container Corporation of India
15 October 2012 17
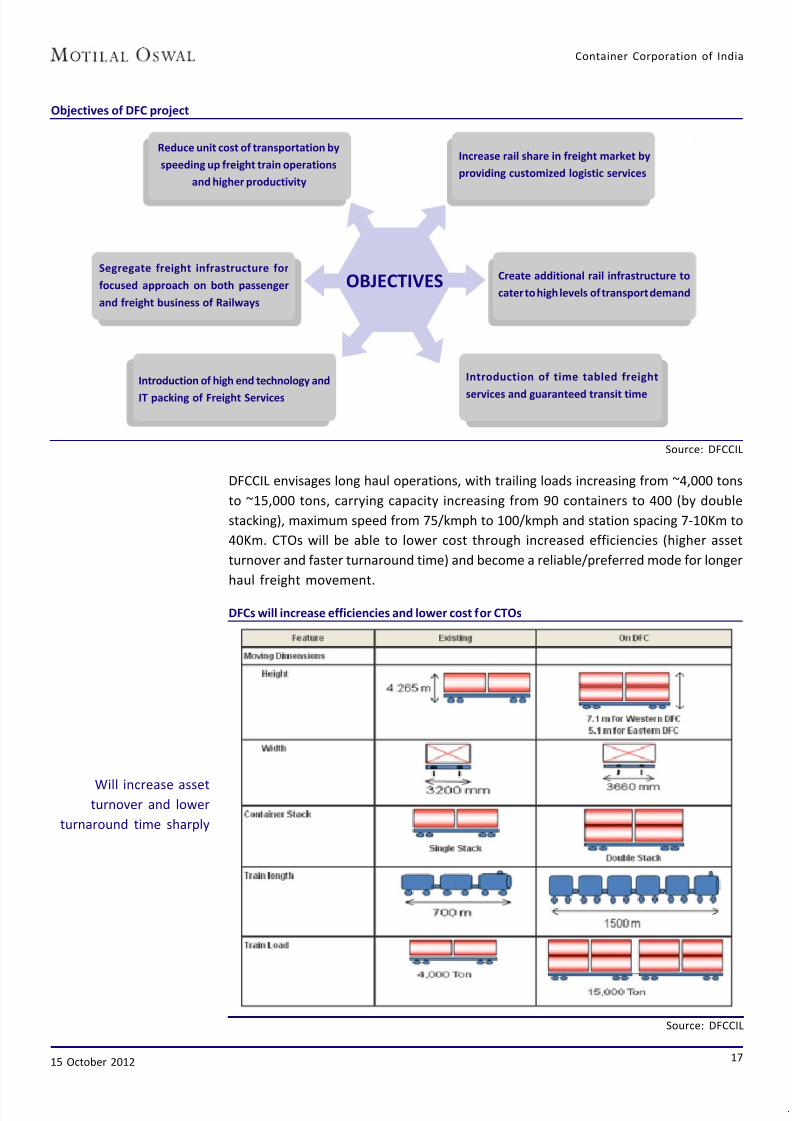
DFCCIL envisages long haul operations, with trailing loads increasing from ~4,000 tons
to ~15,000 tons, carrying capacity increasing from 90 containers to 400 (by double
stacking), maximum speed from 75/kmph to 100/kmph and station spacing 7-10Km to
40Km. CTOs will be able to lower cost through increased efficiencies (higher asset
turnover and faster turnaround time) and become a reliable/preferred mode for longer
haul freight movement.
Objectives of DFC project
Source: DFCCIL
Reduce unit cost of transportation by
speeding up freight train operations
and higher productivity
Introduction of high end technology and
IT packing of Freight Services
Introduction of time tabled freight
services and guaranteed transit time
Create additional rail infrastructure to
cater to high levels of transport demand
Increase rail share in freight market by
providing customized logistic services
Segregate freight infrastructure for
focused approach on both passenger
and freight business of Railways
DFCs will increase efficiencies and lower cost for CTOs
Source: DFCCIL
OBJECTIVES
Will increase assetturnover and lower
turnaround time sharply

7/28/2019 Container Corporation - MoST
http://slidepdf.com/reader/full/container-corporation-most 18/42
Container Corporation of India
15 October 2012 18
Update on DFC progress
We expect substantial part of the project awards to be completed in FY13/14. The
Western DFC is likely to be commissioned by FY16/17. We believe that the DFC project
will provide a ‘multiplier effect’ for India in many ways.
Phase-wise project details
Western Corridor Year
Phase I Rewari- Vadodara (920 Kms) 2009-2016
Phase II Vadodara- JNPT(430Kms) 2010-2017
Phase III Rewari – Dadri(140 Kms) 2010-2017
Eastern Corridor
Phase I-APL1 Khurja - Kanpur (343 Kms) 2009-2016
Phase II-APL2 Kanpur - Mughalsarai (390 Kms) 2010-2016
Phase III-APL3 Khurja-Ludhiana (397 Kms) 2011-2016
Phase IV (Funding thr ough PPP) Da nkuni - Sonnaga r ( 550 K ms) 2011-2016
Phase Ia* Sonnagar - Mugal Sarai (125 Kms) 2010-2016
*Funding by Ministry of Railways Source: Company, MOSL
Project cost and funding: The total project cost is INR930b, including land cost of
INR70b. The net requirement for the DFC project is INR880b. Of this, INR100b of
Sonnagar-Dankuni (Eastern DFC) will be funded on PPP basis – IDC: INR60b; Bridges:
INR60b. Thus, DFCCIL requires funding of INR680b – debt of INR420b (JICA: INR280b
and WB: INR140b) and equity of INR260b.
Project awards to commence in FY13: The final bids for project awards for the Western
DFC of 300-350km each are expected to be awarded by October 2012, while work is
expected to commence from 1QCY13. The signaling/electrical contract is likely to be
taken up for bidding by mid-FY14. For the Eastern DFC, bidding for 345km began in
2QFY13, with ~11 bidders being shortlisted.
Land acquisition: The Western DFC is being contemplated in three phases: Vadodara
to Rewari (920km), JNPT to Vadodara (430km), and Rewari to Dadri (140km). While
land acquisition for the Vadodara-Rewari section has been completed to the extent
of 83%, issues in terms of land acquisition in Mumbai/Thane and 10-12 villages in
Gujarat have also been sorted out during 2QFY13.
Western Dedicated Freight Corridor: Land acquisition status
Total Scope 20A 20E 20F Progress Compensation (INR M)
kms Area (Ha) kms Area (Ha) kms Area (Ha) kms Area (Ha) (%) Award Disbursed
Jaipur 274 1,064 274 1,064 274 1,064 274 1,064 100.0 1,960 1,370
Ajmer 359 958 359 958 339 924 339 924 96.5 1,450 770
Ahmedabad 196 907 144 721 80 459 78 411 45.3 820 130
Vadodara 75 558 75 552 75 412 73 386 69.2 3,550 3,280
Dadri 27 122 27 122 23 82 - - - - -
Total Phase 1 930 3,608 930 3,608 826 3,205 776 2,998 83.1 7,780 5,550
Mumbai 202 460 202 460 59 77 - - - - -
Surat 118 239 118 239 95 148 4 3 1.3 73 44
Vadodara 108 612 108 612 108 446 108 362 59.2 3,590 3,400
Dadri 141 942 141 942 52 307 - - - - -
Total Phase 2 569 2,252 569 2252 464 1718 143 782 34.7 3,663 3,444
Grand Total 1,499 5,860 1,499 5,860 1,290 4,923 919 3,780 64.5 22,886 1,370
Issues in terms of land
acquisition in Mumbai/
Thane and 10-12 villages
in Gujarat have also been
sorted out during 2QFY13
7/28/2019 Container Corporation - MoST
http://slidepdf.com/reader/full/container-corporation-most 19/42
Container Corporation of India
15 October 2012 19
Key reforms that could revolutionize the logistics sector
The CTO industry could get a major fillip from few key reforms such as (1) the
implementation of GST, and (2) FDI in multi-brand retail. CCRI has strategically
positioned itself to capitalize on these opportunites once they become available.
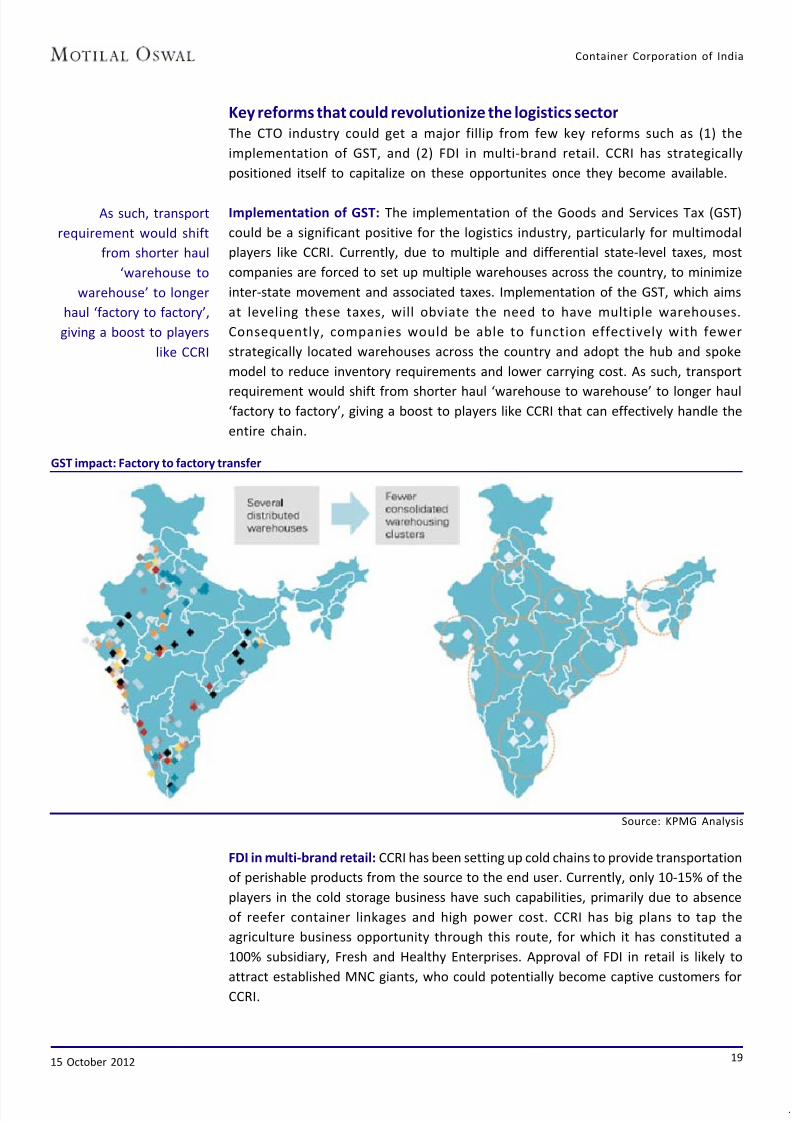
Implementation of GST: The implementation of the Goods and Services Tax (GST)
could be a significant positive for the logistics industry, particularly for multimodal
players like CCRI. Currently, due to multiple and differential state-level taxes, most
companies are forced to set up multiple warehouses across the country, to minimize
inter-state movement and associated taxes. Implementation of the GST, which aims
at leveling these taxes, will obviate the need to have multiple warehouses.
Consequently, companies would be able to function effectively with fewer
strategically located warehouses across the country and adopt the hub and spoke
model to reduce inventory requirements and lower carrying cost. As such, transport
requirement would shift from shorter haul ‘warehouse to warehouse’ to longer haul‘factory to factory’, giving a boost to players like CCRI that can effectively handle the
entire chain.
GST impact: Factory to factory transfer
Source: KPMG Analysis
FDI in multi-brand retail: CCRI has been setting up cold chains to provide transportation
of perishable products from the source to the end user. Currently, only 10-15% of the
players in the cold storage business have such capabilities, primarily due to absence
of reefer container linkages and high power cost. CCRI has big plans to tap the
agriculture business opportunity through this route, for which it has constituted a
100% subsidiary, Fresh and Healthy Enterprises. Approval of FDI in retail is likely to
attract established MNC giants, who could potentially become captive customers forCCRI.
As such, transport
requirement would shift
from shorter haul
‘warehouse to
warehouse’ to longer
haul ‘factory to factory’,
giving a boost to players
like CCRI
7/28/2019 Container Corporation - MoST
http://slidepdf.com/reader/full/container-corporation-most 20/42
Container Corporation of India
15 October 2012 20
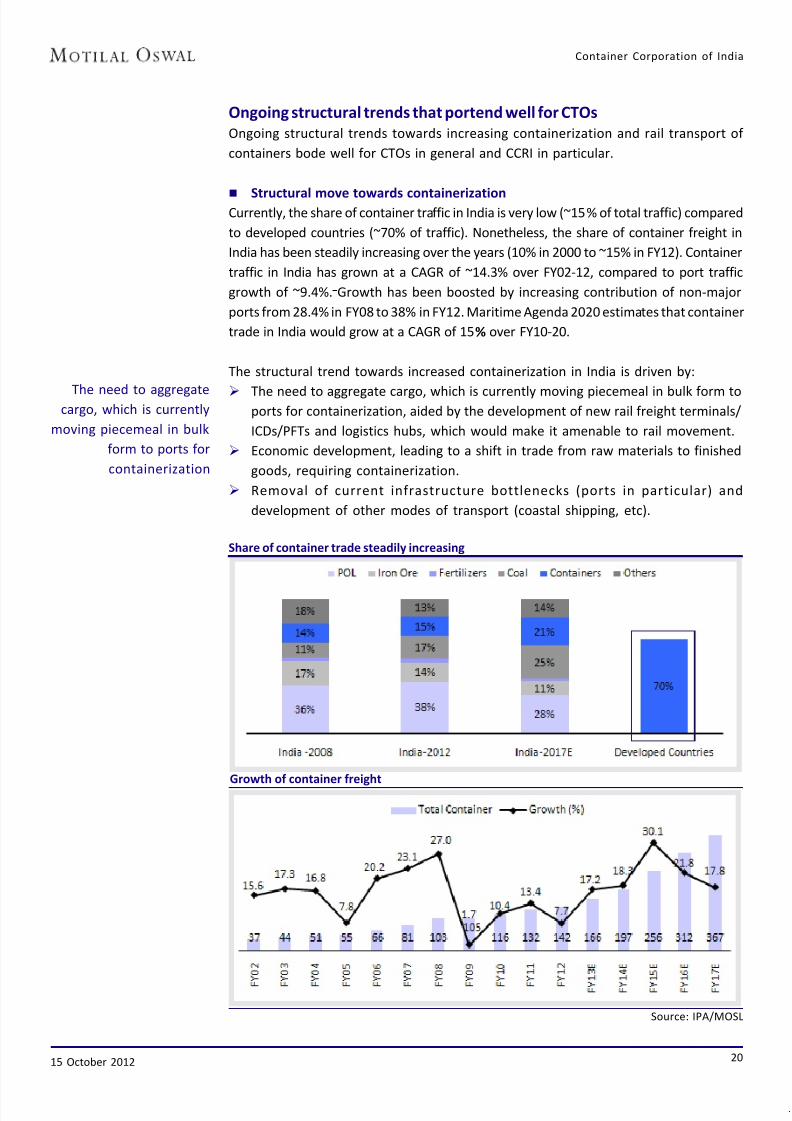
Ongoing structural trends that portend well for CTOs
Ongoing structural trends towards increasing containerization and rail transport of
containers bode well for CTOs in general and CCRI in particular.
Structural move towards containerizationCurrently, the share of container traffic in India is very low (~15% of total traffic) compared
to developed countries (~70% of traffic). Nonetheless, the share of container freight in
India has been steadily increasing over the years (10% in 2000 to ~15% in FY12). Container
traffic in India has grown at a CAGR of ~14.3% over FY02-12, compared to port traffic
growth of ~9.4%. Growth has been boosted by increasing contribution of non-major
ports from 28.4% in FY08 to 38% in FY12. Maritime Agenda 2020 estimates that container
trade in India would grow at a CAGR of 15% over FY10-20.
The structural trend towards increased containerization in India is driven by:
The need to aggregate cargo, which is currently moving piecemeal in bulk form toports for containerization, aided by the development of new rail freight terminals/
ICDs/PFTs and logistics hubs, which would make it amenable to rail movement.
Economic development, leading to a shift in trade from raw materials to finished
goods, requiring containerization.
Removal of current infrastructure bottlenecks (ports in particular) and
development of other modes of transport (coastal shipping, etc).
Share of container trade steadily increasing
Growth of container freight
Source: IPA/MOSL
The need to aggregatecargo, which is currently
moving piecemeal in bulk
form to ports for
containerization
7/28/2019 Container Corporation - MoST
http://slidepdf.com/reader/full/container-corporation-most 21/42
Container Corporation of India
15 October 2012 21
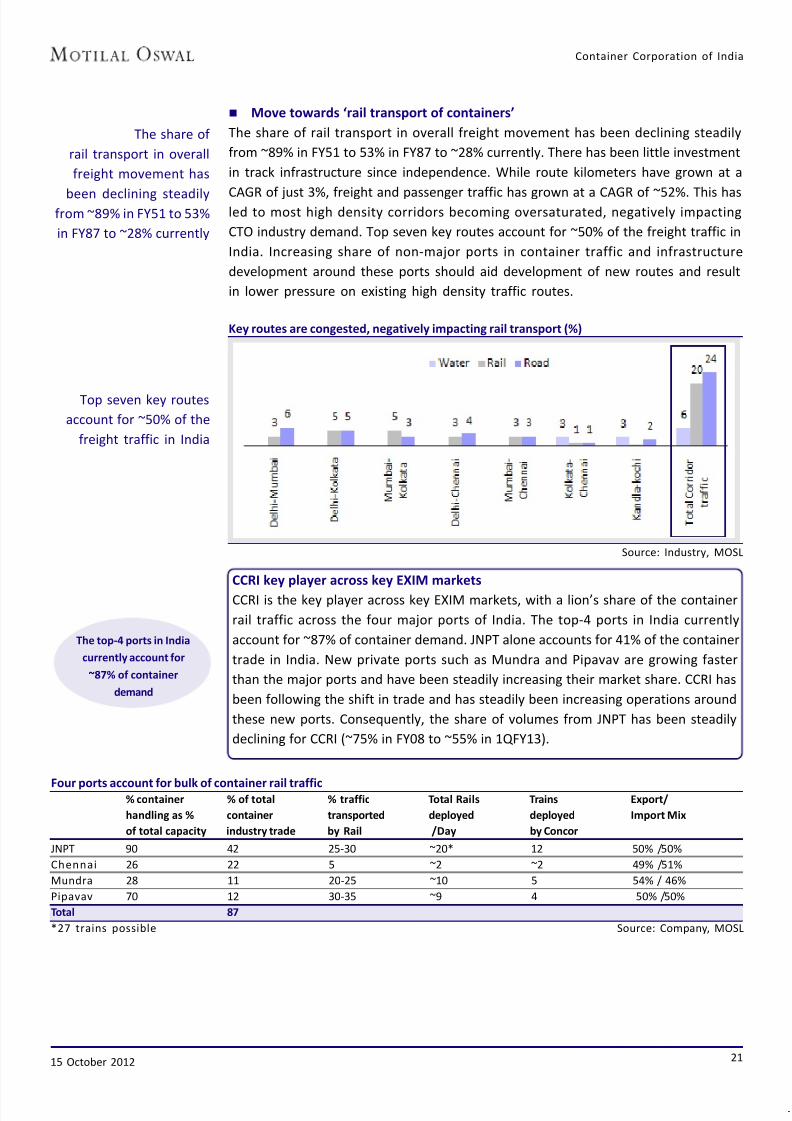
Move towards ‘rail transport of containers’
The share of rail transport in overall freight movement has been declining steadily
from ~89% in FY51 to 53% in FY87 to ~28% currently. There has been little investment
in track infrastructure since independence. While route kilometers have grown at a
CAGR of just 3%, freight and passenger traffic has grown at a CAGR of ~52%. This hasled to most high density corridors becoming oversaturated, negatively impacting
CTO industry demand. Top seven key routes account for ~50% of the freight traffic in
India. Increasing share of non-major ports in container traffic and infrastructure
development around these ports should aid development of new routes and result
in lower pressure on existing high density traffic routes.
Key routes are congested, negatively impacting rail transport (%)
CCRI key player across key EXIM markets
CCRI is the key player across key EXIM markets, with a lion’s share of the container
rail traffic across the four major ports of India. The top-4 ports in India currently
account for ~87% of container demand. JNPT alone accounts for 41% of the container
trade in India. New private ports such as Mundra and Pipavav are growing faster
than the major ports and have been steadily increasing their market share. CCRI has
been following the shift in trade and has steadily been increasing operations around
these new ports. Consequently, the share of volumes from JNPT has been steadily
declining for CCRI (~75% in FY08 to ~55% in 1QFY13).
Source: Industry, MOSL
Four ports account for bulk of container rail traffic% container % of total % traffic Total Rails Trains Export/
handling as % container transported deployed deployed Import Mix
of total capacity industry trade by Rail /Day by Concor
JNPT 90 42 25-30 ~20* 12 50% /50%
Chennai 26 22 5 ~2 ~2 49% /51%
Mundra 28 11 20-25 ~10 5 54% / 46%
Pipavav 70 12 30-35 ~9 4 50% /50%
Total 87
*27 trains possible Source: Company, MOSL
Top seven key routes
account for ~50% of the
freight traffic in India
The share of
rail transport in overall
freight movement has
been declining steadilyfrom ~89% in FY51 to 53%
in FY87 to ~28% currently
The top-4 ports in India
currently account for
~87% of container
demand
7/28/2019 Container Corporation - MoST
http://slidepdf.com/reader/full/container-corporation-most 22/42
Container Corporation of India
15 October 2012 22
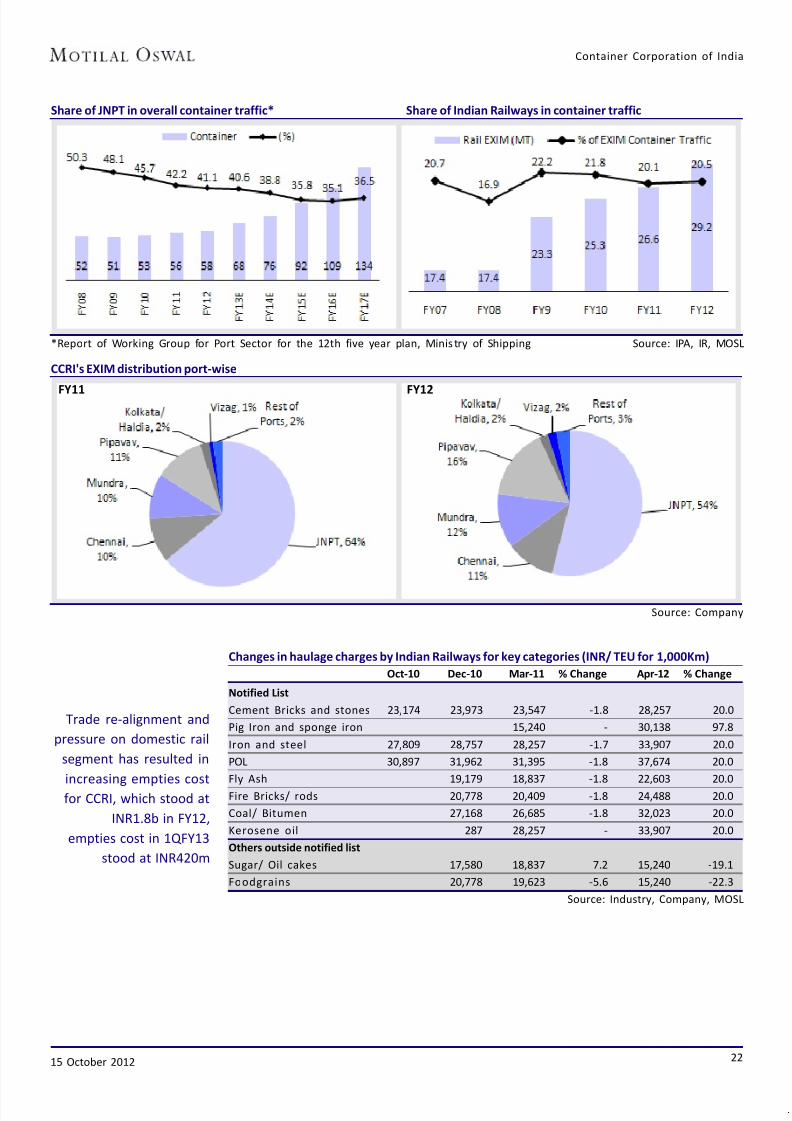
Share of JNPT in overall container traffic* Share of Indian Railways in container traffic
*Report of Working Group for Port Sector for the 12th five year plan, Minis try of Shipping Source: IPA, IR, MOSL
CCRI's EXIM distribution port-wise
FY11 FY12
Source: Company
Changes in haulage charges by Indian Railways for key categories (INR/ TEU for 1,000Km)
Oct-10 Dec-10 Mar-11 % Change Apr-12 % Change
Notified List
Cement Bricks and stones 23,174 23,973 23,547 -1.8 28,257 20.0
Pig Iron and sponge iron 15,240 - 30,138 97.8
Iron and steel 27,809 28,757 28,257 -1.7 33,907 20.0
POL 30,897 31,962 31,395 -1.8 37,674 20.0
Fly Ash 19,179 18,837 -1.8 22,603 20.0
Fire Bricks/ rods 20,778 20,409 -1.8 24,488 20.0
Coal/ Bitumen 27,168 26,685 -1.8 32,023 20.0
Kerosene oil 287 28,257 - 33,907 20.0
Others outside notified list
Sugar/ Oil cakes 17,580 18,837 7.2 15,240 -19.1
Foodgrains 20,778 19,623 -5.6 15,240 -22.3
Source: Industry, Company, MOSL
Trade re-alignment and
pressure on domestic rail
segment has resulted in
increasing empties costfor CCRI, which stood at
INR1.8b in FY12,
empties cost in 1QFY13
stood at INR420m
7/28/2019 Container Corporation - MoST
http://slidepdf.com/reader/full/container-corporation-most 23/42
Container Corporation of India
15 October 2012 23
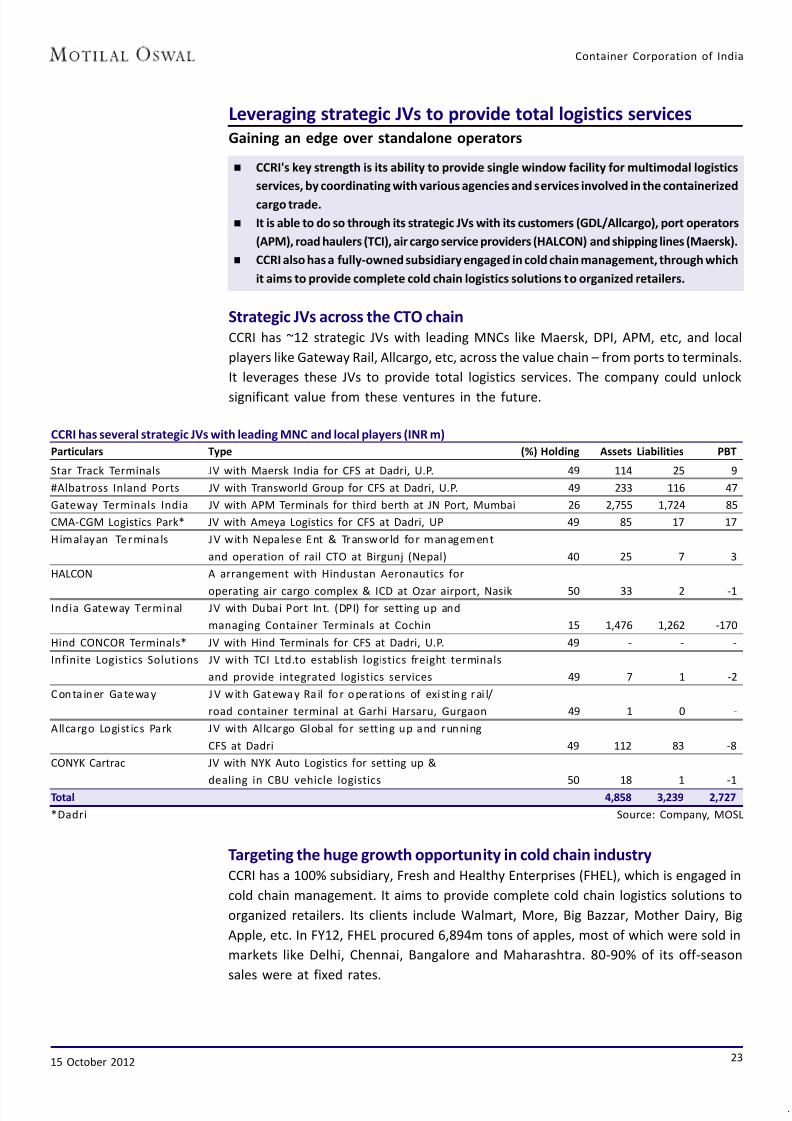
Leveraging strategic JVs to provide total logistics services
Gaining an edge over standalone operators
CCRI's key strength is its ability to provide single window facility for multimodal logistics
services, by coordinating with various agencies and services involved in the containerized
cargo trade.
It is able to do so through its strategic JVs with its customers (GDL/Allcargo), port operators
(APM), road haulers (TCI), air cargo service providers (HALCON) and shipping lines (Maersk).
CCRI also has a fully-owned subsidiary engaged in cold chain management, through which
it aims to provide complete cold chain logistics solutions to organized retailers.
Strategic JVs across the CTO chain
CCRI has ~12 strategic JVs with leading MNCs like Maersk, DPI, APM, etc, and local
players like Gateway Rail, Allcargo, etc, across the value chain – from ports to terminals.
It leverages these JVs to provide total logistics services. The company could unlock
significant value from these ventures in the future.
CCRI has several strategic JVs with leading MNC and local players (INR m)
Particulars Type (%) Holding Assets Liabilities PBT
Star Track Terminals JV with Maersk India for CFS at Dadri, U.P. 49 114 25 9
#Albatross Inland Ports JV with Transworld Group for CFS at Dadri, U.P. 49 233 116 47
Gateway Terminals India JV with APM Terminals for third berth at JN Port, Mumbai 26 2,755 1,724 85
CMA-CGM Logistics Park* JV with Ameya Logistics for CFS at Dadri, UP 49 85 17 17
Himalayan Terminals JV with Nepalese Ent & Transworld for management
and operation of rail CTO at Birgunj (Nepal) 40 25 7 3
HALCON A arrangement with Hindustan Aeronautics for
operating air cargo complex & ICD at Ozar airport, Nasik 50 33 2 -1
India Gateway Terminal JV with Dubai Port Int. (DPI) for setting up and
managing Container Terminals at Cochin 15 1,476 1,262 -170
Hind CONCOR Terminals* JV with Hind Terminals for CFS at Dadri, U.P. 49 - - -
Infinite Logistics Solutions JV with TCI Ltd.to establish logistics freight terminals
and provide integrated logistics services 49 7 1 -2
C onta iner Ga tewa y J V wit h Gat ewa y Ra il for operat ions of exi st ing r ai l/
road container terminal at Garhi Harsaru, Gurgaon 49 1 0 -
Allcargo Logistics Park JV with Al lcargo Global for setting up and running
CFS at Dadri 49 112 83 -8
CONYK Cartrac JV with NYK Auto Logistics for setting up &
dealing in CBU vehicle logistics 50 18 1 -1Total 4,858 3,239 2,727
*Dadri Source: Company, MOSL
Targeting the huge growth opportunity in cold chain industry
CCRI has a 100% subsidiary, Fresh and Healthy Enterprises (FHEL), which is engaged in
cold chain management. It aims to provide complete cold chain logistics solutions to
organized retailers. Its clients include Walmart, More, Big Bazzar, Mother Dairy, Big
Apple, etc. In FY12, FHEL procured 6,894m tons of apples, most of which were sold in
markets like Delhi, Chennai, Bangalore and Maharashtra. 80-90% of its off-season
sales were at fixed rates.

7/28/2019 Container Corporation - MoST
http://slidepdf.com/reader/full/container-corporation-most 24/42
Container Corporation of India
15 October 2012 24
Source: KPMG, MOSL
Almost 35% of the fruits
and vegetables produced
perish due to lack of cold
chain and distribution
infrastructure
Cold chain management in India offers huge growth opportunity. The fruit and
vegetable business in India is almost entirely in the unorganized sector and is worth
an estimated ~INR200b. Trade is carried on primarily on credit. Almost 35% of the
fruits and vegetables produced perish due to lack of cold chain and distribution
infrastructure. Farm sizes are small and farmers sell their produce at nearby markets/mandis. Almost the entire chain is currently composed of unorganized players. The
introduction of GST will lead to increased requirement of total logistics solutions
such as 3PL/4PL, inventory /warehouse management, contract logistics services and
knowledge support services.
3PL at a nascent stage in India
The role of third-party logistics service (3PL) providers is at an early stage of evolution
in India. Unlike their global counterparts, Indian customers are yet to witness end-
to-end management of transport & logistics services by 3PLs. Growth of 3PLs will
increase demand for multimodal players like CCRI.
Penetration of 3PL in key countries
7/28/2019 Container Corporation - MoST
http://slidepdf.com/reader/full/container-corporation-most 25/42
Container Corporation of India
15 October 2012 25
Financials robust despite higher competition
Core RoCE at ~30%; to bottom out at ~22.7% in FY16
We expect CCRI’s revenue to grow at a CAGR of 11% and PAT to grow at a CAGR of ~8% over
FY12-15. Net margin should sustain at ~20%.
RoE is likely to remain subdued in the near term due to its high preemptive capex of
INR60b. We expect RoE to decline from 16.5% in FY12 to 14.9% in FY15.
We expect core RoCE, which is currently ~30%, to remain under pressure over the next ~4
years and bottom at ~22.7% in FY16.
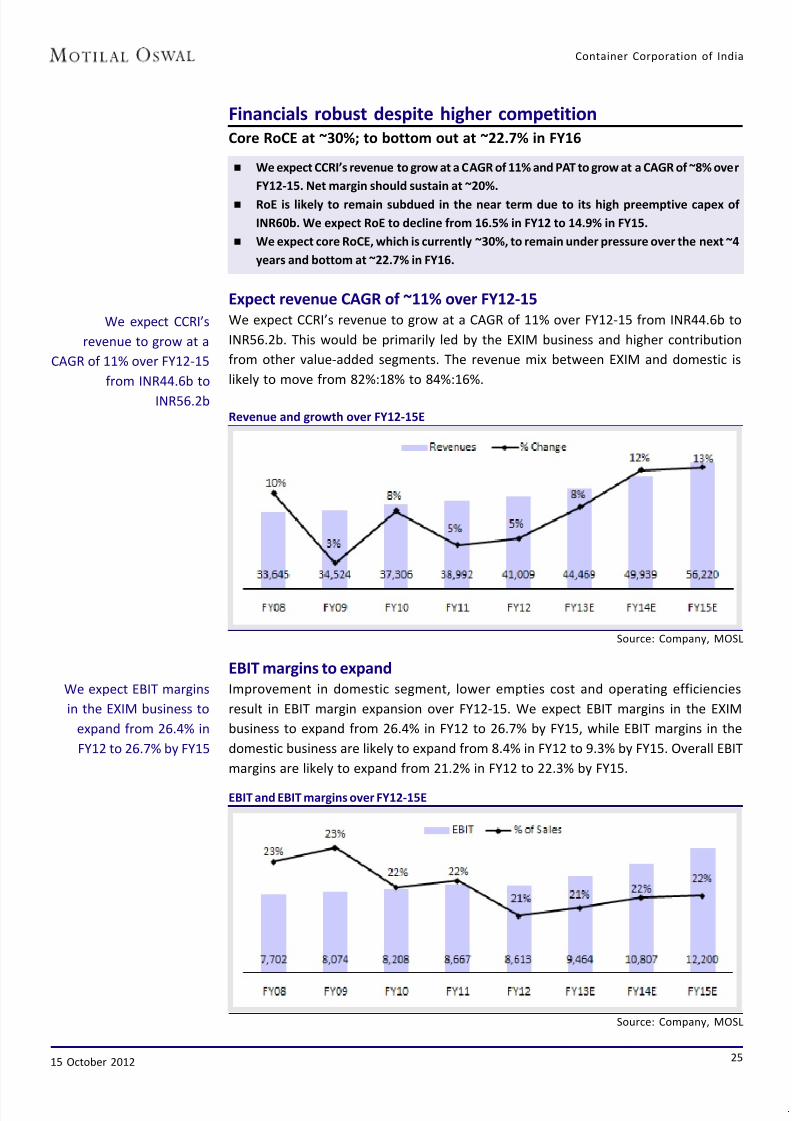
Expect revenue CAGR of ~11% over FY12-15
We expect CCRI’s revenue to grow at a CAGR of 11% over FY12-15 from INR44.6b to
INR56.2b. This would be primarily led by the EXIM business and higher contribution
from other value-added segments. The revenue mix between EXIM and domestic is
likely to move from 82%:18% to 84%:16%.
Revenue and growth over FY12-15E
Source: Company, MOSL
EBIT margins to expand
Improvement in domestic segment, lower empties cost and operating efficiencies
result in EBIT margin expansion over FY12-15. We expect EBIT margins in the EXIM
business to expand from 26.4% in FY12 to 26.7% by FY15, while EBIT margins in the
domestic business are likely to expand from 8.4% in FY12 to 9.3% by FY15. Overall EBIT
margins are likely to expand from 21.2% in FY12 to 22.3% by FY15.
EBIT and EBIT margins over FY12-15E
Source: Company, MOSL
We expect EBIT margins
in the EXIM business to
expand from 26.4% in
FY12 to 26.7% by FY15
We expect CCRI’s
revenue to grow at a
CAGR of 11% over FY12-15
from INR44.6b to
INR56.2b

7/28/2019 Container Corporation - MoST
http://slidepdf.com/reader/full/container-corporation-most 26/42
Container Corporation of India
15 October 2012 26
Source: Company, MOSL
RoE to remain subdued in the near term due to high capex intensiy
CCRI’s RoE is likely to remain subdued in the near term due to its high preemptive
capex of INR62b. We expect RoE to decline from 16.5% in FY12 to 15.4% in FY15, and
asset turnover ratio to remain flat at 0.8x over FY12-15. The biggest gain for CCRI is
likely to be benefits with regard to asset turnover improvement. We expect CCRI’s
asset turnover to increase from 0.8x in FY12 to ~1.4x in FY18, while EBIT margins arelikely to improve from 21% in FY12 to ~24% by FY18, resulting in RoAE improving from
16.5% in FY12 to 20% in FY18.
RoE to remain under pressure in the near term
CCRI is undertaking
the capex to position
itself strategically for the
huge opportunity aroundFY17-18
CCRI’s RoE is
likely to remain subdued
in the near term due to
its high preemptive
capex of INR62b
Expect PAT CAGR of ~8.3% over FY12-15
CCRI has historically maintained a net margin of ~20% due to its pricing power given
its dominant position in the industry. We do not see any major decline in CCRI’s
pricing power and expect this profitability to sustain. We model ~8.3% CAGR in net
profit over FY12-15. Given new investment would have a 2-3 year gestation period, inthe interim higher depreciation charge and lower other income would exert pressure
on the net profit growth. CCRI is undertaking the capex to position itself strategically
for the huge opportunity around FY17-18, when DFC gets completed. Industry experts
estimate that the completion of the DFC project would result in a jump of 1.7-2x in
CTO trade, with shortening of turnaround time, increased asset turnover due to double
stacking, and improved efficiencies.
Notwithstanding near-term pressure on net profit growth and RoCE due to the high
capex plans, we view this as a key positive, as the preemptive capex would (1) further
increase CCRI’s competitive advantage and allow it to capitalize on the large emerging
opportunity, and (2) correct CCRI’s capital structure by utilizing its surplus cash.
PAT growth to be subdued over FY12-15E (INR m)
7/28/2019 Container Corporation - MoST
http://slidepdf.com/reader/full/container-corporation-most 27/42
Container Corporation of India
15 October 2012 27
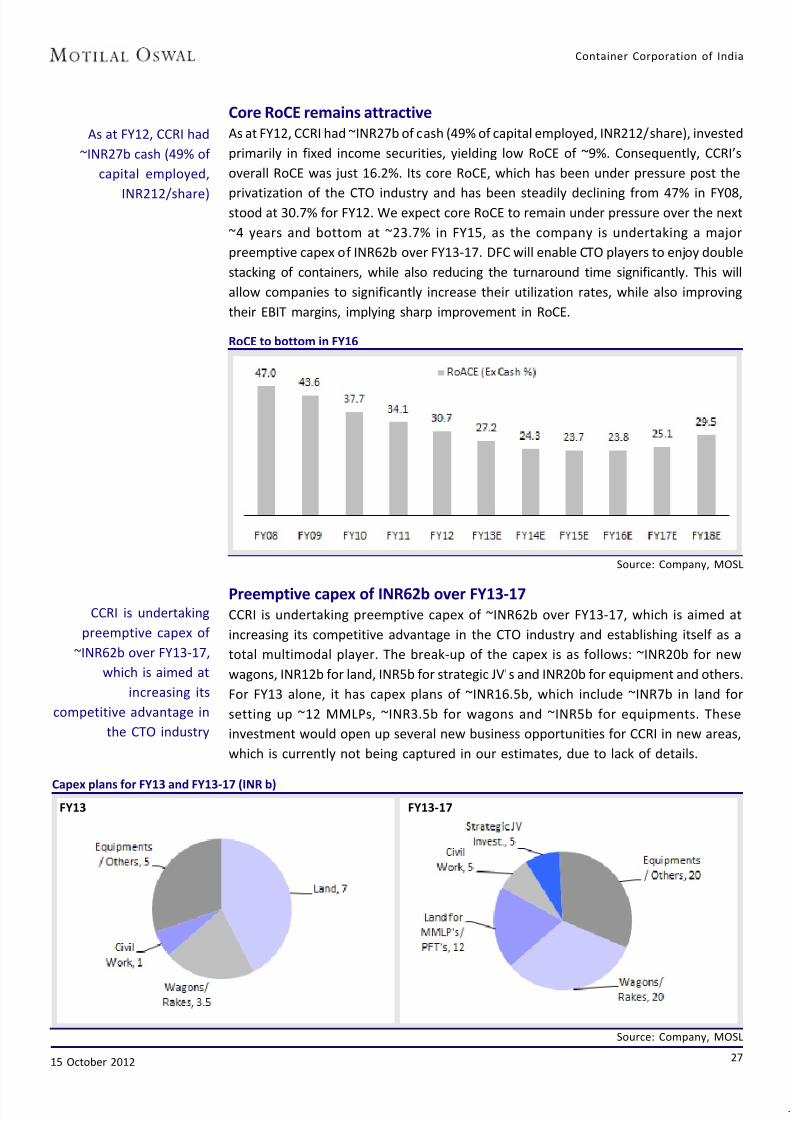
Core RoCE remains attractive
As at FY12, CCRI had ~INR27b of cash (49% of capital employed, INR212/share), invested
primarily in fixed income securities, yielding low RoCE of ~9%. Consequently, CCRI’s
overall RoCE was just 16.2%. Its core RoCE, which has been under pressure post the
privatization of the CTO industry and has been steadily declining from 47% in FY08,stood at 30.7% for FY12. We expect core RoCE to remain under pressure over the next
~4 years and bottom at ~23.7% in FY15, as the company is undertaking a major
preemptive capex of INR62b over FY13-17. DFC will enable CTO players to enjoy double
stacking of containers, while also reducing the turnaround time significantly. This will
allow companies to significantly increase their utilization rates, while also improving
their EBIT margins, implying sharp improvement in RoCE.
RoCE to bottom in FY16
Source: Company, MOSL
Preemptive capex of INR62b over FY13-17CCRI is undertaking preemptive capex of ~INR62b over FY13-17, which is aimed at
increasing its competitive advantage in the CTO industry and establishing itself as a
total multimodal player. The break-up of the capex is as follows: ~INR20b for new
wagons, INR12b for land, INR5b for strategic JV's and INR20b for equipment and others.
For FY13 alone, it has capex plans of ~INR16.5b, which include ~INR7b in land for
setting up ~12 MMLPs, ~INR3.5b for wagons and ~INR5b for equipments. These
investment would open up several new business opportunities for CCRI in new areas,
which is currently not being captured in our estimates, due to lack of details.
CCRI is undertaking
preemptive capex of
~INR62b over FY13-17,
which is aimed at
increasing its
competitive advantage in
the CTO industry
As at FY12, CCRI had
~INR27b cash (49% of
capital employed,
INR212/share)
Source: Company, MOSL
Capex plans for FY13 and FY13-17 (INR b)
FY13 FY13-17

7/28/2019 Container Corporation - MoST
http://slidepdf.com/reader/full/container-corporation-most 28/42
Container Corporation of India
15 October 2012 28
Dividend payout ratio has been stable between 25-30%, over FY06-FY15E
Source: Company, MOSL
Has steady and sustainable free cash flows
CCRI is a debt-free company (net cash of INR27b as at March 2012) and enjoys steady
OCF and FCF. Over FY02-12, its OCF and FCF have grown at a CAGR of 12% and 17%,
respectively. This is against net profit CAGR of 13%, due to low reinvestment
requirements. It has historically maintained a dividend payout ratio of 25-30%. DespiteCCRI’s INR62b capex initiative over FY13-17, we expect it to maintain 24-25% payout
ratio during this period. Post the completion of its preemptive capex by FY16-17, we
expect CCRI to enter a sweet spot of sustainable and robust FCF, which should lead to
sharp improvement in its payout ratio.
OCF & FCF generation over FY06-FY15E
Over FY02-12, its OCF and
FCF have grown at a CAGR
of 12% and 17%,
respectively
Post the completion of its
preemptive capex byFY16-17, we expect CCRI
to enter a sweet spot of
sustainable and robust
FCF, which should lead to
sharp improvement in its
payout ratio

7/28/2019 Container Corporation - MoST
http://slidepdf.com/reader/full/container-corporation-most 29/42
Container Corporation of India
15 October 2012 29
Key Assumptions
FY08 FY09 FY10 FY11 FY12 FY13E FY14E FY15E CAGR
(FY12-15)
EXIM
Volumes (m TEU) 2.0 1.9 1.9 2.0 2.1 2.3 2.5 2.7 8.6
% Change 15.3 -6.2 1.5 7.2 5.8 6.5 9.5 9.8
Realization* 13,385 14,693 15,399 14,820 15,293 15,645 16,005 16,357 2.3
% Change -6.1 9.8 4.8 -3.8 3.2 2.3 2.3 2.2
Value (INR b) 26.5 27.3 29.0 29.9 32.7 35.6 39.9 44.7 11.1
% Change 8.2 3.0 6.3 3.2 9.2 8.9 12.0 12.2
EBIT/ TEU 3,694 4,360 4,017 4,103 4,040 4,068 4,257 4,384 2.8
% Change -12.7 18.0 -7.9 2.1 -1.5 0.7 4.7 3.0
EBIT (INR b) 7.3 8.1 7.6 8.3 8.6 9.3 10.6 12.0 11.6
% Change 0.6 10.7 -6.5 9.5 4.2 7.2 14.6 13.1
% of Sales 27.6 29.7 26.1 27.7 26.4 26.0 26.6 26.8
Domestic
Volumes (m TEU) 0.5 0.5 0.5 0.5 0.5 0.5 0.6 0.6 11.1% Change 20.7 -3.6 18.9 0.9 -13.9 10.0 11.2 12.0
Realization* 14,895 15,176 14,977 15,387 16,983 17,238 17,583 17,899 1.8
% Change -2.0 1.9 -1.3 2.7 10.4 1.5 2.0 1.8
Value (INR b) 7.0 6.9 8.1 8.4 8.0 8.9 10.1 11.5 13.0
% Change 18.3 -1.8 17.3 3.7 -4.9 11.7 13.4 14.0
EBIT/ TEU 2,032 2,104 2,413 1,474 1,420 1,465 1,618 1,665 5.5
% Change -22.1 3.5 14.6 -38.9 -3.7 3.2 10.4 2.9
EBIT (INR b) 1.0 1.0 1.3 0.8 0.7 0.8 0.9 1.1 17.1
% Change -6.0 -0.2 36.3 -38.4 -17.1 13.5 22.8 15.3
% of Sales 13.6 13.9 16.1 9.6 8.4 8.5 9.2 9.3
Total
Volumes (m TEU) 2.4 2.3 2.4 2.6 2.6 2.8 3.1 3.4 9.0
% Change 16.3 -5.7 4.9 5.8 1.6 7.1 9.8 10.2
Value (INR b) 33 34 37 38 41 44 50 56 11.4
% Change 10.2 2.0 8.6 3.3 6.1 9.5 12.3 12.6
Realization* 13,675 14,788 15,305 14,940 15,597 15,939 16,300 16,650 2.2
% Change -5.2 8.1 3.5 -2.4 4.4 2.2 2.3 2.1
EBIT/ TEU 3,147 3,498 3,390 3,383 3,307 3,367 3,583 3,720 4.0
% Change -16.9 11.2 -3.1 -0.2 -2.2 1.8 6.4 3.8
EBIT (INR b) 7.7 8.1 8.2 8.7 8.6 9.4 11.0 12.6 13.4
% Change -3.4 4.8 1.7 5.6 -0.6 9.1 16.9 14.4
*Realization: INR/TEU Source: Company, MOSL
EXIM volumes (in m TEU and INR b) Domestic volumes (in m TEU and INR b)
Source: Company, MOSL
7/28/2019 Container Corporation - MoST
http://slidepdf.com/reader/full/container-corporation-most 30/42
Container Corporation of India
15 October 2012 30
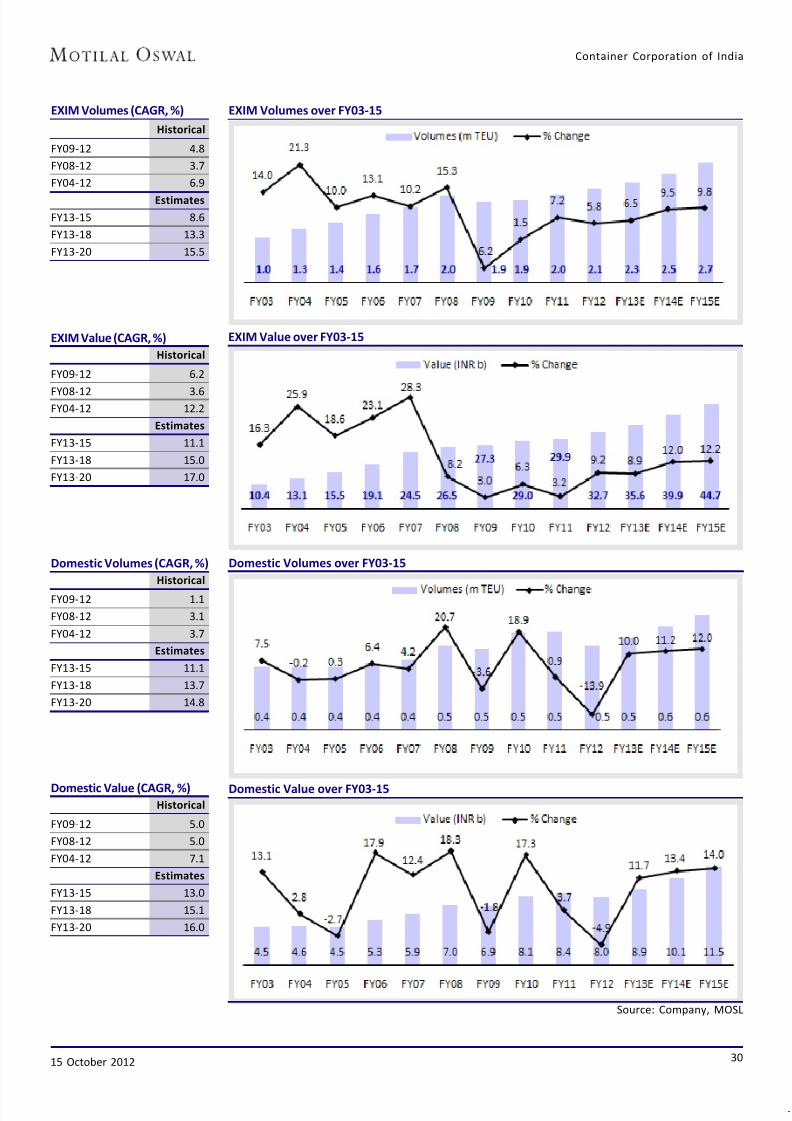
EXIM Volumes over FY03-15
EXIM Value over FY03-15
Domestic Volumes over FY03-15
Domestic Value over FY03-15
Source: Company, MOSL
EXIM Volumes (CAGR, %)
Historical
FY09-12 4.8
FY08-12 3.7
FY04-12 6.9
Estimates
FY13-15 8.6
FY13-18 13.3
FY13-20 15.5
EXIM Value (CAGR, %)
Historical
FY09-12 6.2
FY08-12 3.6FY04-12 12.2
Estimates
FY13-15 11.1
FY13-18 15.0
FY13-20 17.0
Domestic Volumes (CAGR, %)
Historical
FY09-12 1.1
FY08-12 3.1
FY04-12 3.7
Estimates
FY13-15 11.1
FY13-18 13.7
FY13-20 14.8
Domestic Value (CAGR, %)Historical
FY09-12 5.0
FY08-12 5.0
FY04-12 7.1
Estimates
FY13-15 13.0
FY13-18 15.1
FY13-20 16.0
7/28/2019 Container Corporation - MoST
http://slidepdf.com/reader/full/container-corporation-most 31/42
Container Corporation of India
15 October 2012 31
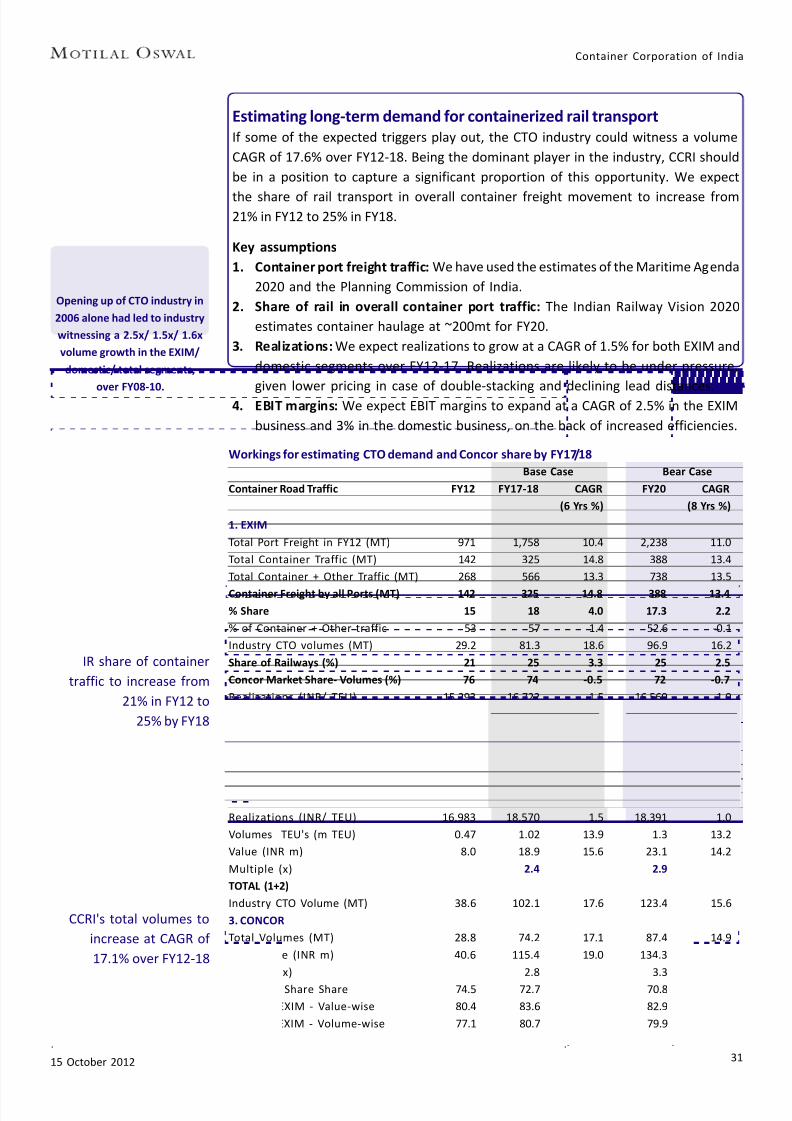
Estimating long-term demand for containerized rail transport
If some of the expected triggers play out, the CTO industry could witness a volume
CAGR of 17.6% over FY12-18. Being the dominant player in the industry, CCRI should
be in a position to capture a significant proportion of this opportunity. We expect
the share of rail transport in overall container freight movement to increase from21% in FY12 to 25% in FY18.
Key assumptions
1. Container port freight traffic: We have used the estimates of the Maritime Agenda
2020 and the Planning Commission of India.
2. Share of rail in overall container port traffic: The Indian Railway Vision 2020
estimates container haulage at ~200mt for FY20.
3. Realizations: We expect realizations to grow at a CAGR of 1.5% for both EXIM and
domestic segments over FY12-17. Realizations are likely to be under pressure,
given lower pricing in case of double-stacking and declining lead distances.4. EBIT margins: We expect EBIT margins to expand at a CAGR of 2.5% in the EXIM
business and 3% in the domestic business, on the back of increased efficiencies.
Workings for estimating CTO demand and Concor share by FY17/18
Base Case Bear Case
Container Road Traffic FY12 FY17-18 CAGR FY20 CAGR
(6 Yrs %) (8 Yrs %)
1. EXIM
Total Port Freight in FY12 (MT) 971 1,758 10.4 2,238 11.0
Total Container Traffic (MT) 142 325 14.8 388 13.4
Total Container + Other Traffic (MT) 268 566 13.3 738 13.5
Container Freight by all Ports (MT) 142 325 14.8 388 13.4
% Share 15 18 4.0 17.3 2.2
% of Container + Other traffic 53 57 1.4 52.6 -0.1
Industry CTO volumes (MT) 29.2 81.3 18.6 96.9 16.2
Share of Railways (%) 21 25 3.3 25 2.5
Concor Market Share- Volumes (%) 76 74 -0.5 72 -0.7
Realizations (INR/ TEU) 15,293 16,722 1.5 16,560 1.0
TEU's ('000) 2.1 5.8 18.0 6.8 15.6
Value (INR m) 33 96 19.8 111 16.6
Multiple (x) 3.0 3.5
2. DOMESTIC
Industry CTO Volumes (MT) 9.4 20.9 14.2 26.5 13.8Concor Market Share (%) 70 69 -0.3 66.6 -0.6
Realizations (INR/ TEU) 16,983 18,570 1.5 18,391 1.0
Volumes TEU's (m TEU) 0.47 1.02 13.9 1.3 13.2
Value (INR m) 8.0 18.9 15.6 23.1 14.2
Multiple (x) 2.4 2.9
TOTAL (1+2)
Industry CTO Volume (MT) 38.6 102.1 17.6 123.4 15.6
3. CONCOR
Total Volumes (MT) 28.8 74.2 17.1 87.4 14.9
Total Value (INR m) 40.6 115.4 19.0 134.3 16.1
Multiple (x) 2.8 3.3
% Market Share Share 74.5 72.7 70.8 -0.6
Share of EXIM - Value-wise 80.4 83.6 82.9 0.4
Share of EXIM - Volume-wise 77.1 80.7 79.9 0.4
IR share of container
traffic to increase from
21% in FY12 to
25% by FY18
CCRI's total volumes to
increase at CAGR of
17.1% over FY12-18
Opening up of CTO industry in
2006 alone had led to industry
witnessing a 2.5x/ 1.5x/ 1.6x
volume growth in the EXIM/
domestic/ total segments,
over FY08-10.

7/28/2019 Container Corporation - MoST
http://slidepdf.com/reader/full/container-corporation-most 32/42
Container Corporation of India
15 October 2012 32
Workings for estimating CTO demand and Concor share by FY17/18 (Cont. from earlier page)
Base Case Bear Case
Container Road Traffic FY12 FY17-18 CAGR FY20 CAGR
(6 Yrs %) (8 Yrs %)
EBIT/ TEU
EXIM (INR/ TEU) 4,040 4,686 2.5 4,375 1.0
Domestic (INR/ TEU) 1,420 1,695 3.0 1,798 3.0
Concor - Volumes (TEU's)
EXIM 2.1 5.8 18.0 5.6 12.8
Domestic 0.5 1.0 13.9 1.4 14.8
Total 2.6 6.8 17.3 7.0 13.1
Multiple (x) 2.6 2.7
Concor - EBIT (INR b)
EXIM 8.6 27.0 21.0 24.4 13.9
Domestic 0.7 1.7 17.3 2.5 18.2
Total 9.3 28.7 20.7 26.9 14.2
Multiple (x) 3.1 2.9Tax 2.0 8.6 27.6 9.2 20.9
Operational PAT (INR b) 7.3 20.1 18.4 17.8 11.8
Multiple (x) 2.8 2.4
Source: Company, MOSL
Port-wise Container Traffic Assumptions (FY12-18)
FY12 FY13E FY14E FY15E FY16E FY17E FY18E % CAGR
(FY12-18)
Major Ports (m tons)
Kolkata 7 8 8 9 10 12 12 9.9
Chennai 30 27 27 30 32 32 37 1.0
Tuticorin 9 7 7 9 9 10 10 1.4
Cochin 5 12 15 17 18 19 19 25.7
JNPT 58 58 76 92 105 105 109 10.3
Other Major Ports* 14 14 17 33 45 45 49 21.8
Total Major Ports 123 125 150 189 219 223 236 10.4
Non Major Ports 19 31 46 67 76 84 89 28.1
Total Major and Non-Major Ports 142 156 197 256 295 307 325 13.7
Major Ports (%)
Kolkata 4.8 5.0 4.2 3.4 3.2 3.9 3.7 9.9
Chennai 21.2 17.1 13.6 11.7 10.9 10.4 11.4 1.0
Tuticorin 6.5 4.2 3.6 3.3 3.1 3.3 3.1 1.4Cochin 3.3 7.4 7.6 6.6 6.0 6.0 5.8 25.7
JNPT 41.1 37.3 38.8 35.8 35.7 34.3 33.5 10.3
Other Major Ports* 9.7 9.0 8.6 12.8 15.3 14.7 15.1 21.8
Total Major Ports 86.6 80.0 76.4 73.7 74.2 72.6 72.6 10.4
Non Major Ports 13.4 20.0 23.6 26.3 25.8 27.4 27.4 28.1
Total Major and Non-Major Ports 100.0 100.0 100.0 100.0 100.0 100.0 100.0 13.7
* Includes Haldia, Paradip, Visakapatpam, Ennore, New Mangalore, Morgumao, Kandla and Port Blair Source: MOSL
Expect operating PAT to
increase by 2.8x over
FY12-18

7/28/2019 Container Corporation - MoST
http://slidepdf.com/reader/full/container-corporation-most 33/42
Container Corporation of India
15 October 2012 33
Lead distance under pressure in EXIM (kms)
Source: Indian Railways
Distance Between North India ICDs and Ports (kms)
Nhava Sheva Mundra Pipavav Closer to Closer to(Kms) (Kms) (Kms) Mundra by Pipavav by
(Kms) (Kms)
TKD 1,513 1,276 1,333 237 180
Loni 1,380 1,183 1,325 197 55
Dadri 1,460 1,228 1,280 232 180
Ludhiana 1,895 1,551 1,590 344 305
Source: Industry
Maritime Agenda 2010-20 growth assumptions (%)
Cargo Volumes CAGR (FY10-17) CAGR (FY10-20)
Coal 23.0 18.0
POL 7.0 7.0
Iron-ore 6.0 6.0
Containers 19.0 15.0
Others 15.0 13.0
Total 13.0 11.0
Source: Maritime Agenda 2010-20
Summary of Projected Freight Loading by IR by 2020 (M tons)
2011 2020 Increase CAGR
(x) (FY11-20)
Coal 420 700 1.7 5.8
RM for steel plants 13 39 2.9 12.7
Pig Iron & Finished Steel 33 108 3.3 14.2
Cement 99 250 2.5 10.8
Iron Ore (Exports) 26 75 2.9 12.6
Iron Ore (Imports) 93 150 1.6 5.5
Food grains 43 50 1.2 1.6
Ferilizers 48 70 1.5 4.2
POL 39 48 1.2 2.2
Containers 38 210 5.6 21.1
Others 69 150 2.2 9.0Total 922 1,850 2.0 8.0
Source: Indian Railway Vision 2020
Lead distance has been
under pressure in the
Exim segment, while it
has increased in the
domestic segment
Increasing share of
Mundra and Pipavav
leading to shorter lead
distance for EXIM
segment

7/28/2019 Container Corporation - MoST
http://slidepdf.com/reader/full/container-corporation-most 34/42
Container Corporation of India
15 October 2012 34
DCF based target price of INR1,250
We believe DCF is the best way to capture the intrinsic value of CCRI, given its stable
cash flow, consistent payout ratio, robust ROCE and low re-investment requirements.
CCRI's inimitable pan India network provides it with significant entry barriers, which
coupled with positive industry growth outlook, will allow it to enjoy a prolonged
period of growth. We model CCRI to register a revenue CAGR of 11.5% over FY13-32,
driven a high growth period between FY13-20, post which we have assumed its growth
rate to move from 9.3% in FY21 towards its terminal growth assumption of 5.4%. Our
terminal growth rate assumption is based on RoCE spread of 2.5% over its terminal
period cost of capital at 12.9%. Using the DCF methodology, we arrive at a value of
INR1,250.
Initiating coverage with Buy
Target price of INR1,250 implies 19% upside
While concerns such as high empties cost and muted near term growth outlook in particular
remain, the long-term prospects are favorable for CCRI and outweigh near term concerns.
We value CCRI using DCF methodology. While our DCF value is INR1,250 (19% upside).
Given CCRI’s strong FCF generation capability, high operating RoCE and stable payout ratio,
the best way to value it is through DCF.
Key assumptions
Valuation Inputs (%) Comments
Growth PeriodRisk free Rate (Rf) 8.0 RBI 10 year G-sec Bond Yield 5/10/2012
Levered Raw Beta (B) 0.40 Bloomberg 1 year average Raw Regression Beta
Market Risk Premium (Rmp) 7.5 Implied India Risk Premium based on Sensex
Cost of Equity: Rf+B(Rmp) 11.0 CAPM
Stable Period
Risk free Rate (Rf) 8.0 RBI 10 year G-sec Bond Yield
Levered Raw Beta (B) 0.65 Assuming long term Beta will trend towards 1x
Market Risk Premium (Rmp) 7.5 Implied India Risk Premium based on Sensex
Cost of Equity: Rf+B(Rmp) 12.9 CAPM
India country Default Spread 2.0 Based on S&P Bond Default spread of 2% based
on India’s BBB+ rating
Adjusted Risk free Rate (Rf) 6.0 Real Risk free rate in India
Terminal Growth rate (Tg) 5.4 ROCE spread of 2.5% over terminal cost of capital
Source: MOSL

7/28/2019 Container Corporation - MoST
http://slidepdf.com/reader/full/container-corporation-most 35/42

7/28/2019 Container Corporation - MoST
http://slidepdf.com/reader/full/container-corporation-most 36/42
Container Corporation of India
15 October 2012 36
Comparative Valuations
Company Name Mkt Cap BV (INR) EPS Gr. (%) P/E (x) P/BV (x) EV/ EBITDA (x) RoE (%)
CMP (USD b) FY13 FY14 FY13 FY14 FY13 FY14 FY13 FY14 FY13 FY14 FY13 FY14
Concor 1,048 2.6 480.0 536.1 8.7 6.3 14.5 13.6 2.2 2.0 9.6 8.3 16.0 15.1
Gateway Distripark 142 0.3 90.3 97.9 13.0 16.7 10.3 8.9 1.6 1.5 6.6 5.7 15.6 16.7
Allcargo 130 0.3 131.6 146.8 -6.0 15.7 7.5 6.4 1.0 0.9 5.3 4.7 14.1 14.5
Arshiya International 134 0.1 167.8 200.7 29.8 48.1 5.2 3.5 0.8 0.7 7.4 5.4 14.6 18.4
Guangshen Railway 3 2.8 3.7 3.7 10.9 24.9 12.6 10.1 0.7 0.7 4.2 3.5 5.8 6.8
China Railway Tielong 6 1.3 3.7 4.3 24.3 18.3 11.6 9.8 1.7 1.5 6.8 5.5 14.7 15.7
Union Pacific Corp 121 57.3 46.6 51.9 14.9 14.0 12.7 11.1 2.6 2.3 7.0 6.3 20.8 23.2
Canadian Pacific Railway 86 15.2 34.4 39.6 29.2 21.5 15.7 12.9 2.5 2.2 9.2 8.1 16.4 18.7
CSX Corp. 21 22.0 9.9 11.1 12.2 12.6 10.6 9.4 2.1 1.9 6.2 5.7 22.2 20.5
Prices as on 11 October 2012 Source: Bloomberg, Company, MOSL
PE below historical average of 15.3x P/B below historical average of 2.6x
EV/ Sales below historical average of 3.1x EV/ EBITDA below historical average of 10.5x

7/28/2019 Container Corporation - MoST
http://slidepdf.com/reader/full/container-corporation-most 37/42
Container Corporation of India
15 October 2012 37
Risks and concerns
Execution risk / possible delays in DFC implementation: Successful execution of the
DFC project has the potential to increase container rail traffic by 1.7-2x. Given its
critical nature and the possible upside from its implementation, the project has beenable to garner considerable support from both the central and state governments.
Nonetheless, the project faces considerable challenges in the form of pending land
acquisitions, funding requirements and execution risks. Any delays in project
execution would mean delayed upsides and lower our estimated valuations for CCRI.
Forays into new segments: CCRI is foraying into new segments such as warehousing,
air cargo, ports, and cold chain management. While this would transform CCRI into a
total logistics player, it would also present significant execution challenges.
Unfavorable EXIM trade mix leading to high empties cost: Due to the mismatchbetween exports and imports in trade, particularly at some of the new ports and in
domestic operations, the empties cost of CCRI has been steadily increasing.
Unbalanced trade at key ports could further increase empties cost, which stood at
INR1.2b in FY12 and INR423m in 1QFY13.
Risks related with economic slowdown: Bulk of the container rail transport in India is
for EXIM trade, which is highly correlated with GDP growth. Any slowdown in economic
growth would have a negative impact on EXIM trade, and in turn on the growth outlook
for CTOs like CCRI.
Overdependence on single rail corridor: Another key risk holding back growth of CTO
players is single rail corridor at key ports like Mundra and Pipavav, due to which
turnaround time increases and rail traffic gets negatively impacted. Rail transport of
the overall container traffic is low at 20-30%.
Challenges with regard to JNPT expansion plans: With regard to JNPT expansion for
terminal-4, the erstwhile bidders withdrew in August 2012. The port authorities are
in the process of inviting fresh bids, which could delay the planned capacity additions.
Tariff Authority for Major Ports (TAMP) related issues: In February 2012, TAMP orderedNhava Sheva International Container Terminal (NSICT) and Gateway Terminal (GTICT)
to lower tariffs by 27.85% and 44.28%, respectively. The tariff cut was largely because
these ports were operating at 117%/135% capacity utilization (based on the minimum
guaranteed throughput). This tantamounts to punishing efficiency, as the revenue
share (paid to JNPT) is not allowed as cost while fixing the tariff. Hence, the operators
will attempt to lower their throughput to just the minimum guaranteed.

7/28/2019 Container Corporation - MoST
http://slidepdf.com/reader/full/container-corporation-most 38/42
Container Corporation of India
15 October 2012 38
Company background
Container Corporation of India (CONCOR; Bloomberg Code: CCRI) is a state-owned
company incorporated in March 1988. It was set up with the intent to develop
multimodal transport and logistics support for domestic and internationalcontainerized cargo. Post the commencement of its operations, Indian Railways’
container freight service is being handled by CONCOR through yearly MoUs.
Revenue break-up (FY12) EBIT break-up (FY12)
Source: MOSL, Company
Source: MOSL, Company
Region-wise break-up Top terminal contributors (% of total)
Organizational structure
Managing Director
Director (International
Marketing & OperationDirector (P&S) Director (Finance) Director (Domestic)
(Exim, Operation,
Commercial, Marketing
Air Cargo)
Projects, Engineering
Technical & MIS
(Finance, Accounts,
Secretarial & Internal
Audit)
(Domestic Operation,
Common Marketing)
HRD

7/28/2019 Container Corporation - MoST
http://slidepdf.com/reader/full/container-corporation-most 39/42
Container Corporation of India
15 October 2012 39
CCRI's Pan-India terminal network
Source: Company

7/28/2019 Container Corporation - MoST
http://slidepdf.com/reader/full/container-corporation-most 40/42
Container Corporation of India
15 October 2012 40
Financials and Valuation
Income Statement (INR Million)
Y/E March 2011 2012 2013E 2014E 2015E
Net Sales 38,992 41,009 44,469 49,939 56,220
Change (%) 4.5 5.2 8.4 12.3 12.6EBITDA 10,156 10,234 11,331 13,029 14,752
Margin (%) 26.0 25.0 25.5 26.1 26.2
Depreciation 1,489 1,621 1,867 2,222 2,552
EBIT 8,667 8,613 9,464 10,807 12,200
Int. and Finance Charges 49 54 29 32 34
Other Income - Rec. 1,971 3,135 2,992 2,457 2,543
PBT after EO Exp. 10,588 11,693 12,426 13,232 14,709
Current Tax 1,647 2,885 2,808 3,003 3,447
Deferred Tax 179 152 211 226 259
Tax Rate (%) 17.2 26.0 24.3 24.4 25.2
Reported PAT 8,763 8,656 9,406 10,004 11,002
Change (%) 12.7 -1.2 8.7 6.3 10.0
Margin (%) 22.5 21.1 21.2 20.0 19.6
Balance Sheet (INR Million)
Y/E March 2011 2012 2013E 2014E 2015E
Equity Share Capital 1,300 1,300 1,300 1,300 1,300
Total Reserves 48,088 54,252 61,095 68,385 76,523
Net Worth 49,388 55,552 62,395 69,685 77,822
Deferred Liabilities 2,288 2,438 2,438 2,438 2,438
Other Liabilities 695 449 494 543 598
Total Loans 296 234 254 274 294
Capital Employed 52,667 58,673 65,581 72,940 81,152
Gross Block 33,683 35,856 49,356 58,556 67,756
Less: Accum. Deprn. 9,722 11,268 13,135 15,356 17,908
Net Fixed Assets 23,961 24,588 36,221 43,200 49,848
Capital WIP 1,069 1,151 1,151 1,151 1,151
Total Investments 1,956 2,447 2,447 2,447 2,447
Other Assets 2,475 3,903 4,002 3,995 4,217
Curr. Assets, Loans&Adv. 28,230 32,989 28,289 29,204 31,452
Inventory 125 360 396 442 496
Account Receivables 296 303 311 350 394
Cash and Bank Balance 22,961 27,616 22,246 22,420 23,816
Loans and Advances 4,848 4,710 5,336 5,993 6,746
Curr. Liability & Prov. 5,023 6,406 6,530 7,057 7,963
Current Liabilities 3,662 4,865 5,020 5,443 6,110
Provisions 1,361 1,540 1,510 1,614 1,853
Net Current Assets 23,207 26,583 21,759 22,147 23,489
Appl. of Funds 52,667 58,673 65,581 72,940 81,152
E: MOSL Estimates; * Adjusted for treasury stocks

7/28/2019 Container Corporation - MoST
http://slidepdf.com/reader/full/container-corporation-most 41/42
Container Corporation of India
15 October 2012 41
Financials and Valuation
Ratios
Y/E March 2011 2012 2013E 2014E 2015E
Basic (INR) *
Consol EPS 67.4 66.6 72.4 77.0 84.6
Cash EPS 78.9 79.1 86.7 94.1 104.3
BV/Share 380.0 427.4 480.0 536.1 598.7
DPS 18.0 19.2 19.7 20.9 22.0
Payout (%) 26.8 28.8 27.2 27.1 26.0
Valuation (x) *
P/E 14.0 12.9 12.1 11.0
Cash P/E 11.8 10.8 9.9 9.0
P/BV 2.2 1.9 1.7 1.6
EV/Sales 2.7 2.6 2.3 2.0
EV/EBITDA 10.6 10.1 8.8 7.6
Dividend Yield (%) 2.1 2.1 2.2 2.4
FCF per share 58.5 -21.5 22.3 32.9
Return Ratios (%)
RoE 19.0 16.5 16.0 15.1 14.9
RoCE 22.9 22.3 21.0 20.0 19.9
Working Capital Ratios
Asset Turnover (x) 0.7 0.7 0.7 0.7 0.7
Inventory (Days) 1.7 4.6 4.7 4.7 4.7
Debtor (Days) 2.7 2.7 2.5 2.5 2.5
Creditor (Days) 49.4 62.2 59.4 57.6 57.6
Leverage Ratio (x)
Current Ratio 5.6 5.1 4.3 4.1 3.9
Interest Cover Ratio 177 160 323 341 358
Cash Flow Statement (INR Million)
Y/E March 2011 2012 2013E 2014E 2015E
EBIT 8,667 8,613 9,464 10,807 12,200
Depreciation 1,489 1,621 1,867 2,222 2,552
Direct Taxes Paid 1,825 3,037 3,020 3,229 3,707
(Inc)/Dec in WC -2,793 -395 -601 -158 -113
CF from Operations 5,537 6,801 7,710 9,643 10,932
(inc)/dec in FA -2,095 -2,331 -13,500 -9,200 -9,200
(Pur)/Sale of Investments -34 -491 0 0 0
Investment Income 1,971 3,135 2,992 2,457 2,543
CF from investments -159 312 -10,508 -6,743 -6,657
(Inc)/Dec in Debt -128 -62 20 20 20
Interest Paid 49 54 29 32 34
Dividend Paid 2,345 2,493 2,563 2,714 2,865
(Inc)/Dec in Deff Tax Liab 179 150 0 0 0
CF from Fin. Activity -2,344 -2,459 -2,572 -2,726 -2,879
Inc/Dec of Cash 3,035 4,655 -5,370 174 1,396
Add: Beginning Bal 19,925 22,961 27,616 22,246 22,420
Closing Balance 22,960 27,616 22,246 22,420 23,816

7/28/2019 Container Corporation - MoST
http://slidepdf.com/reader/full/container-corporation-most 42/42
Motilal Oswal Securities LtdM til l O l T L l 9 S i R d P bh d i M b i 400 025
DisclosuresThis report is for personal information of the authorized recipient and does not construe to be any investment, legal or taxation advice to you. This research report does not constitute an offer, invitation or inducement
to invest in securities or other investments and Motilal Oswal Securities Limited (hereinafter referred as MOSt) is not soliciting any action based upon it. This report is not for public distribution and has been
furnished to you solely for your information and should not be reproduced or redistributed to any other person in any form.
Unauthorized disclosure, use, dissemination or copying (either whole or partial) of this information, is prohibited. The person accessing this information specifically agrees to exempt MOSt or any of its affiliates
or employees from, any and all responsibility/liability arising from such misuse and agrees not to hold MOSt or any of its affiliates or employees responsible for any such misuse and further agrees to hold MOSt
or any of its affiliates or employees free and harmless from all losses, costs, damages, expenses that may be suffered by the person accessing this information due to any errors and delays.
The information contained herein is based on publicly available data or other sources believed to be reliable. While we would endeavour to update the information herein on reasonable basis, MOSt and/or its
affiliates are under no obligation to update the information. Also there may be regulatory, compliance, or other reasons that may prevent MOSt and/or its affiliates from doing so. MOSt or any of its affiliates or
employees shall not be in any way responsible and liable for any loss or damage that may arise to any person from any inadvertent error in the information contained in this report . MOSt or any of its affiliates
or employees do not provide, at any time, any express or implied warranty of any kind, regarding any matter pertaining to this report, including without limitation the implied warranties of merchantability, fitness
for a particular purpose, and non-infringement. The recipients of this report should rely on their own investigations.
This report is intended for distribution to institutional investors. Recipients who are not institutional investors should seek advice of their independent financial advisor prior to taking any investment decision
based on this report or for any necessary explanation of its contents.
MOSt and/or its affiliates and/or employees may have interests/positions, financial or otherwise in the securities mentioned in this report. To enhance transparency, MOSt has incorporated a Disclosure of Interest
Statement in this document. This should, however, not be treated as endorsement of the views expressed in the report.
Disclosure of Interest Statement Container Corporation of India
1. Analyst ownership of the stock No2. Group/Directors ownership of the stock No
3. Broking relationship with company covered No
4. Investment Banking relationship with company covered No
Analyst Certif icat ionThe views expressed in this research report accurately reflect the personal views of the analyst(s) about the subject securities or issues, and no part of the compensation of the research analyst(s) was, is, or
will be directly or indirectly related to the specific recommendations and views expressed by research analyst(s) in this report. The research analysts, strategists, or research associates principally responsible
for preparation of MOSt research receive compensation based upon various factors, including quality of research, investor client feedback, stock picking, competitive factors and firm revenues.
Regional Disclos ures (outside India)This report is not directed or intended for distribution to or use by any person or entity resident in a state, country or any jurisdiction, where such distribution, publication, availability or use would be contrary to
law, regulation or which would subject MOSt & its group companies to registration or licensing requirements within such jurisdictions.
For U.K.
This report is intended for distribution only to persons having professional experience in matters relating to investments as described in Article 19 of the Financial Services and Markets Act 2000 (FinancialPromotion) Order 2005 (referred to as "investment professionals"). This document must not be acted on or relied on by persons who are not investment professionals. Any investment or investment activity to
which this document relates is only available to investment professionals and will be engaged in only with such persons.
For U.S.MOSt is not a registered broker-dealer in the United States (U.S.) and, therefore, is not subject to U.S. rules. In reliance on the exemption from registration provided by Rule 15a-6 of the U.S. Securities Exchange
Act of 1934, as amended (the "Exchange Act") and interpretations thereof by the U.S. Securities and Exchange Commission ("SEC") in order to conduct business with Institutional Investors based in the U.S.,
Motilal Oswal has entered into a chaperoning agreement with a U.S. registered broker-dealer, Marco Polo Securities Inc. ("Marco Polo"). Any business interaction pursuant to this report will have to be executed
within the provisions of this Chaperoning agreement.
This report is intended for distribution only to "Major Institutional Investors" as defined by Rule 15a-6(b)(4) of the Exchange Act and interpretations thereof by SEC (henceforth referred to as "major institutional
investors"). This document must not be acted on or relied on by persons who are not major institutional investors. Any investment or investment activity to which this document relates is only available to major
institutional investors and will be engaged in only with major institutional investors.
The Research Analysts contributing to the report may not be registered /qualified as research analyst with FINRA. Such research analyst may not be associated persons of the U.S. registered broker-dealer, Marco
Polo and therefore, may not be subject to NASD rule 2711 and NYSE Rule 472 restrictions on communication with a subject company, public appearances and trading securities held by a research analyst account.