Embed Size (px)
Citation preview

EMGT 835 Field Project
IMPROVING CONSUMER COMPLAINT REPORTING BY THE DEVELPOMENT OF A
RELATIONAL DATABASE
By
Amadeo Martinez
Master of Science
The University of Kansas
Fall Semester, 2005
An EMGT Field Project report submitted to the Engineering Management Program and the Faculty of the Graduate School of The University of Kansas in
partial fulfillment of the requirements for the degree of Master of Science.
_________________________________Herb Tuttle Date Committee Chair _________________________________Annette Tetmeyer Date Committee Member _________________________________Robert Zerwekh Date Committee Member

EMGT 835 – Field Project Improving Consumer Complaint Reporting A. Martinez
Consumer Complaint Application Page 2 of 36

EMGT 835 – Field Project Improving Consumer Complaint Reporting A. Martinez
Consumer Complaint Application Page 3 of 36
Acknowledgements I would like to say thanks… …To my parents for having made it possible for me to pursue my first degree and hence everything else that followed. …To Christina for her support, friendship and encouragement. …To Herb Tuttle for all the advice he’s given me so far and for all the future advice I’ll seek. …To my employer for having paid for this degree.

EMGT 835 – Field Project Improving Consumer Complaint Reporting A. Martinez
Consumer Complaint Application Page 4 of 36
Confidentiality Notice Due to the competitive environment in which consumer goods companies operate and the nature of the topic being discussed it was decided to protect the name of the company where this project was developed. From this point on the company will be referred to solely as “the company”. Any screen shots of the application which reveal confidential data or the names of products will be partially or fully covered. Any data that may remain displayed is solely for illustrative purposes only and is not to be assumed to be accurate.

EMGT 835 – Field Project Improving Consumer Complaint Reporting A. Martinez
Consumer Complaint Application Page 5 of 36
Abstract Consumer complaints are an important indicator of the perception of a product by consumers. It is also in some instances a regulatory requirement that such systems are in place. For those two reasons it is very important to have an effective system to track and analyze this type of information. The company uses an application called CRS to enter data at the call centers. However, this software is limited in its internal data analysis capabilities. For that reason the raw data from this software is used to externally create reports. Due to the nature of the complaint data and the output from CRS the process is highly involved and manual in nature. It can take 2-4 days of work by one of the Quality Engineers to generate a report for a particular manufacturing site (there are 4 major sites in North America). It is the intent of this project to improve the process of creating the consumer complaint reports by using a relational database to import the data and then manipulate it to create the reports.
EMGT 835 – Field Project Improving Consumer Complaint Reporting A. Martinez
Consumer Complaint Application Page 6 of 36
Executive Summary: As stated in the Project Goal Statement, the goal of this project was to
“significantly reduce the time being spent by the quality engineers generating consumer complaint reports by:
1) Automating the import of raw data into the application. 2) Providing a “single click” standard monthly report. 3) Providing the ability to choose different combinations of data and how
it should be displayed.” The three objectives of the project were successfully met.
In the first goal to the import of raw data, the application is able to open and read the 13 month consumer complaint files and directly import all the required data instead of manually transcribing. The production data is just as easily imported from a two column file containing the product designation and production numbers. The implementation of the “single click” report was overall successful and exceeded expectations with regard to the flexibility of creating reports. The initial proposal had suggested a standard report to be used by all sites but in the process of developing the report it was found that it would be more advantageous to build in flexibility. This allows for the reports to be created by the users by selecting certain criteria and saving each set of criteria as individual components of the report. A welcome consequence of this approach is that it would also “future-proof” the application should the reporting needs were to change, eliminating the possible need and added expense of programming new reports.
The ability of choosing any and whichever combination of data to be
displayed, totalized, broken down, etc. was fully implemented. Again, this goal was exceeded by the addition of “Product Categories/Families” which an extra to the original proposal. This function allows the user to subgroup products within a focus factory. Validation/Verification
The application has been validated following the guidelines of the corporate software validation template to perform as designed per the Main Functions & Implementation Summary. Supporting evidence is included in the validation appendix.

EMGT 835 – Field Project Improving Consumer Complaint Reporting A. Martinez
Consumer Complaint Application Page 7 of 36
Table of contents: Acknowledgements Abstract Executive Summary Table of Contents 1.0 Introduction
1.1 Background 1.2 Project Goal Statement 1.3 Project Conceptual Description 1.4 Project Viability 1.5 Project Bidding
2.0 Literature Review 3.0 Main Functions and Implementation Summary
3.1 Complaint Data Import 3.2 Production Data Import 3.3 Data filtering, reviewing, editing and exporting 3.4 Technology 3.5 Change Control & Maintenace 3.6 Security
4.0 Appendix
4.1 Validation Justification & Approach 4.2 Risk assessment Worksheet 4.3 Calculation Verification
5.0 Suggestions for Additional work
EMGT 835 – Field Project Improving Consumer Complaint Reporting A. Martinez
Consumer Complaint Application Page 8 of 36
1) IntroductionThis section will give the reader some background on the Consumer Complaint reporting process, introduce the problem and give justification to the proposed solution. 1.1) Background The company is a global consumer goods manufacturer with major manufacturing sites in the US and many others overseas. As part of regulatory compliance as well as good manufacturing practice, the company has systems in place to collect consumer complaint information. In the packaging of each product made the company has placed a phone number that consumers can call to provide feedback about the products. The type of feedback may range from positive to negative and can be categorized into areas such as packaging, product performance, personal preference, personal injury, adverse reaction, etc. At the call centre the operators log the call in an application named CRS. This application is in turn used to follow up on the case and store data. The application itself is deficient in regards to using the data it collects to generate reports. Its capabilities are generally limited to outputting the data. For that reason the data output from CRS is then manipulated to create useful reports showing rates, trends, particular complaints or products. Consumer complaint reporting is usually done on a monthly, quarterly and yearly basis. This is done across all multiple manufacturing sites and corporate offices. Two different types of information are needed to calculate the complaint rate: 1) the consumer complaint data from CRS and 2) the production data that can come from a variety of sources. Currently both sets of data are manually entered into a MS Excel workbook and by the use of multiple tabs gets filtered. After extensive manual manipulation this process yields the data that is to be used for some of the reports. If the data being requested changed or a different analysis is required the spreadsheet template becomes of little help and a new set of tabs would have to be created to extract the necessary data. From this data a report is created and issued. The whole process can take up to 3-4 days worth of work to complete due to its highly manual nature. The typical data for the monthly reports includes:
- Top 10 complaints for the last year by product - Top 10 complaint for the last year by type - Year to date and monthly complaint totals & rates - Year to date and monthly complaints by product and/or type - 12 month trend charts (absolute and rate) - Individual charts for “new products” (that is products for which the first
complaint received is less than 6 months old of the product has been in

EMGT 835 – Field Project Improving Consumer Complaint Reporting A. Martinez
Consumer Complaint Application Page 9 of 36
production less that 9 months) so that they can be separately tracked in the critical first few months in the market
The current process takes up to 3-4 days to complete. Since a great part of the time is now spent transcribing data between CRS output and excel files, automating the import will be a vital part of improving the process. Then, the next step of analyzing the data is cumbersome at best with the current tool (MS Excel) and quite time consuming if a new or different way to look at the data is needed.

EMGT 835 – Field Project Improving Consumer Complaint Reporting A. Martinez
Consumer Complaint Application Page 10 of 36
1.2) Project Goal Statement The goal of this project is to significantly reduce the time being spent by the quality engineers generating consumer complaint reports by:
1) Automating the import of raw data into the application. 2) Providing a “single click” standard monthly report. 3) Providing the ability to choose different combinations of data and how
it should be displayed. The objectives above can be easily met by using a relational database such as MS Access to develop a software application. This off the shelf database software has enough functionality to provide all the required functionality as well as being already installed in most user PC’s in the company.
With this application the time spent each month on consumer complaints would be reduced from days to hours for a similar end result (there are 4 people currently in charge of this type of reporting, with a conservative estimate of 16 hours savings times 4 people gives 64 hours or about one and a half week worth of one person’s time each month). With the time saved and greater data analysis capability, the quality engineers would be able to do a more in-depth analysis of Consumer Complaints or use the extra free time to tend to other priorities. This project would benefit all of the facilities that work with consumer complaint data based on the CRS system reports. The scope of this project was limited to the North American division and mainly the USA only given the relatively low number of complaints received in Canada. In all, the project is based on the needs of the 4 main North American plants. However, it is likely that other sites overseas will also benefits since the use of CRS for complaint data collection is the corporate standard. In summary, the project will consist of managing the development of an MS Access application that can meet the needs stated above as well as a plan for deployment and maintenance (or Quality terms, change/revision control). The majority of the actual software programming will be bided out to a consultant.

EMGT 835 – Field Project Improving Consumer Complaint Reporting A. Martinez
Consumer Complaint Application Page 11 of 36
1.3) Project Conceptual Description
The inputs for creating monthly consumer complaint reports consist of consumer complaint data captured in CRS by the Consumer Affairs Department and production data from the plants.
The different plants may house different product categories (bar soap, underarm products, toothpaste, detergents, shaving products, etc.). Within the category there are different product formulas and each formula can have different packaging or units of sale. For example: Product A is sold as a 3oz, 6oz and 8oz package. When dealing with consumer complaints ALL Product A will be put in the same group so that the numbers presented are for the aggregate of all complaints and production for that formula. In other words, complaint data will be formula specific and size/package independent. Currently there is no standard report used for production reporting and each plant has its own way of extracting the data. For the purpose of this project it can be assumed that there will be a simple, standardized report in csv format that will be used for the importing production data into the application. The first column will contain the production and the second column the number of unit sales.
The consumer complaint data is provided to the Quality Engineers at the plants on a monthly basis by the New York office. The engineers receive a file for each product category produced at the plant. The file has columns for 13 months of data. The numbers provided in this file correspond to the number of calls or complaints of a specific type filed against a product formula. Each type of complaint received in the rolling 13 months against a particular formula is listed. Each type of complaint has a specific complaint code.
The complaint code is a text field composed of a complaint category code,
a space, and then a short detail to the specific of the complaint. I.e. “CPK Leaking” stands for packaging problems and the detail is “leaking”; under packaging problems you could also have “Broken Cap”.
The product formula names used in the consumer complaint data are not
the same as those used for production reporting so the application must be able to match both names (with user input).
Once the application has imported all the required data, both historical and current, it must be able to provide the users with a way of readily retrieve the data in whichever way the user so desires. For example, broken out by product by date, or total rate over a period of time.
Of course, the application must have error trapping features that will prevent to the best extent possible from making mistakes that would damage the integrity of the data.

EMGT 835 – Field Project Improving Consumer Complaint Reporting A. Martinez
Consumer Complaint Application Page 12 of 36
1.4) Project Viability The company culture is very conservative and not technologically oriented hence it was very important to be able to demonstrate to management what a relational database could do for the whole process. So, the starting point in this project was to prove that the idea could work and was worth pursuing. In order to achieve this two simple MS Access files were created, one that showed how data can be filtered using simple selection of options in a Graphical User Interface and the other that demonstrated how the CRS output files could be successfully imported into a second application. This achieved two things:
1) It proved that this idea could be done 2) Quickly convinced management that funding this application could be a
worthwhile investment

EMGT 835 – Field Project Improving Consumer Complaint Reporting A. Martinez
Consumer Complaint Application Page 13 of 36
1.5) Project Bidding After demonstrating the viability of the project, management requested to obtain quotes for the development of the complete application. In order to bid out the project, it first had to be defined. A project description was drafted and submitted for review to the Quality engineers who would use the software. Since the project was being developed and managed from Kansas City it was determined that it could prove advantageous to work with a local company. After inquiry with the local IT department it was found that the local site had not used outside developing services in many years and hence could not provide any recommendations for a developer. The next logical place to look was the yellow pages using the biggest add approach (find the largest adds, read to see if they offer the desired services and call). A larger add costs more money and so it usually correlates well with bigger, well established companies. The first three companies contacted were interested and appointments were made for site visit to discuss the project needs. Below is a summary of the three developing companies: Developer A Pros: Well established IT company with solid credentials. Knowledgeable sales person. Seem focused on project management. Cons: Expensive Unwilling to bid for a finished project. Their contracts are per hour worked and if budget is running short functionality may be cut to meet budget. Developer B Pros: Competitive price, willing to commit to a finished application Cons: They contract their work to a developer for hire. That means that once the project is done the individual who did the work may no longer be available to do updates or corrections should bugs be found later.

EMGT 835 – Field Project Improving Consumer Complaint Reporting A. Martinez
Consumer Complaint Application Page 14 of 36
Developer C Pros The owners came to the meeting (small company). Both are programmers themselves so quickly understood the technical needs. Competitive price. Committed to a finished project Even though they may contract part of the work, the permanent staff is ultimately accountable for the finished product. Cons Somewhat lacking project management experience. Hard to judge overall performance for the project. Ultimately Developer C was chosen to do the work. Their bid was the same as Developer B and about 30% less that Developer A. An additional factor in the selection of Developer C was that they seemed to be the most flexible of the three. Developer A’s contracts are such that give them more leverage. Developer B would contract out and disband so it would be hard to push for any changes. Developer C is a small business interested in making a good impression and obtaining the job hence being more likely to go the extra mile. The risk being that a lack of project management could hurt the project.
EMGT 835 – Field Project Improving Consumer Complaint Reporting A. Martinez
Consumer Complaint Application Page 15 of 36
2.0) Literature Review TO BE FINISHED “Special Edition Using Microsoft Access 2000”; Roger Jennings; 2000. This is a good intro book to MS Access concepts. It has many step by step examples and is a good starting point. “Mastering Microsoft Access 2002 Desktop Development”; Allison Balter; 2001. This book starts from the basics but picks up pace rather quickly and teaches the reader higher level concepts that are not usually covered in introductory books. It does a great job of showing how to use the built in Visual Basic development environment to fully utilize the capabilities of the software. “Development of a Relational Database Application Prototype for a Mail-Order Auction“; Ross Schaller; 2003. This EMGT field project is about the development and design of a database application. The similarity in the goal of the project made it a good reference on how to structure the field project report. From the web: “General Principles of Software Validation; Final Guidance for Industry and FDA Staff”; US Food and Drug Administration, 2002. This document is a guide for validating software to be used in medical devices or their manufacture. The company does not have any such products but does have some that do fall under FDA regulations. However, even though none of those products come close to requiring the level detail of medical devices, they do have to conform to fairly strict regulations. The FDA does not have a guidance for “less strict” products so it is really up to each company to come up with a compliance strategy. Internal Company Documents: “Validation Master Plan Template”; 2004. This document outlines the general validation strategy for IT projects for the North American Division. It is a fairly new document and this field project is only the 5th to make use of this template. The risk assessment worksheet is an attachment to this document and can be found on the appendix. “XXXX Calibration Module Implementation”; 2004. This document is the final validation report for the implementation of the calibration component part of an enterprise system. The “screenshot” approach is widely used in this report. Other principles of the company’s validation strategy are also used here (although for the purposes of this field project the validation is not as stringent). (The XXXX protects the name of the software package in use)

EMGT 835 – Field Project Improving Consumer Complaint Reporting A. Martinez
Consumer Complaint Application Page 16 of 36
3.0) Main Functions and Implementation Summary Complaint data import function Requirements:
1) The application must be able to import from the consumer complaint data file for any given timeframe.
a. The user will specify the start and end date b. The application will check that no previous data exists for that
timeframe and alarm the user. c. The application will check that the number of months specified
by the user match the number of months in the data file.
Implementation: The user will select the file and open it in the application in a manner that is ready for import. The user can then select which months will be imported. While importing the application will check that the data being imported does not already exist in the database. In other words, old data that may not be overwritten but new may be appended. There is no need to check for a given number of months due to the way the application imports the data.
2) The application will be able to determine new products and complaints
from the imported data and add it to its database. a. The application will set a 12 month flag for this data (see
Reporting Requirements) b. The application will prompt the user to enter the corresponding
production name for that product. Not entering a name will stop/reset the import.
c. For complaint codes the application will ask whether the complaint is to be a) shown in menus b) displayed in the standard report.
Implementation: The “New Product” designation was changed to be 6 months from first complaint or 9 months from the first production month. While doing the import of the consumer complaint data, the application will prompt the user to match any new or unmatched consumer complaints with the available SPC names. However, if there are complaint codes that are not matched the application will allow the user to continue. The reason for this is that there are some complaint codes that may not be used in the calculations. An example of this would be when a site gets information about a product that is contracted out but the site is not responsible for tracking that product.
EMGT 835 – Field Project Improving Consumer Complaint Reporting A. Martinez
Consumer Complaint Application Page 17 of 36
Part c. was implemented through the use of user-defined parameters for reports so this is done on the reporting end rather than during import.
3) The imported data must have a way of being reviewed prior to a final
import. Implementation: The user will see the data about to be imported and can select which months he/she wants to import.
4) An “Undo Import”/”Step Back” type of function must be implemented for a worst case scenario where the wrong data was put in (including any new products or information that may have been added).
Implementation: Through the administrative functions the user is able to select the data for a particular month or months (complaint or production data) and delete it; ALL data for the month(s) will be erased. After that the user can re-import any data. Any data product matching will remain in place and will not be affected. The “new product” designation will be re-calculated and corrected if needed.
Production data import function Production data will consist of a simple CSV file with 1 month worth of data. Requirements:
1) The user will specify the time period. 2) The application will check to see whether data already exists. 3) The application must be able to determine new products and provide a
means to matching them with the corresponding complaint data name. 4) The imported data must have a way of being reviewed prior to a final
import. 5) An “Undo Import”/”Step Back” type of function must be implemented
for a worst case scenario where the wrong data was put in (including any new products or information that may have been added).
Implementation: The application was designed to import only one month of production data at a time so there is no need to specify timeframe or check time span. The application will check to see whether the

EMGT 835 – Field Project Improving Consumer Complaint Reporting A. Martinez
Consumer Complaint Application Page 18 of 36
production data exist and if there is new data it will append it. Else, it will not overwrite the data (Same approach as for the consumer complaints). Likewise, while doing the import the user will be able to see the data about to be imported. Then in the same manner as for consumer complaint data, the user can select a month(s) for deletion and start again.
Data filtering, reviewing, editing & exporting Requirements:
All data must be searchable by time, product, complaint type, etc. The user should also be able to edit the data should there be a need to do so.
A function that exports the result of a data query to a csv file is also required. The csv file has to have a format that will facilitate its analysis in Excel.
At minimum these options must be made available to the user: - Ability to select a product or combination of products - Ability to select a complaint type or combination of complaints - Ability to group complaints by complaint category - Ability to chose the time frame - Chose between an average or monthly data - Group individual complaints or show them broken out - Show top 10 highest by rates of complaints based on the options
above. - Show top 10 highest by absolute number of complaints based on the
options above. - For any grouping or averaging, for any “new products” (that is products
for which the first complaint received is less than one year old) there must be an option to include or exclude them from the report or calculation.
Implementation: This functionality was implemented through a very simple user interface that allows the data to be grouped together or separated depending on the functions chosen. The approach taken maximizes the flexibility of the application. An option to export to excel was provided.
EMGT 835 – Field Project Improving Consumer Complaint Reporting A. Martinez
Consumer Complaint Application Page 19 of 36
Reporting Requirements:
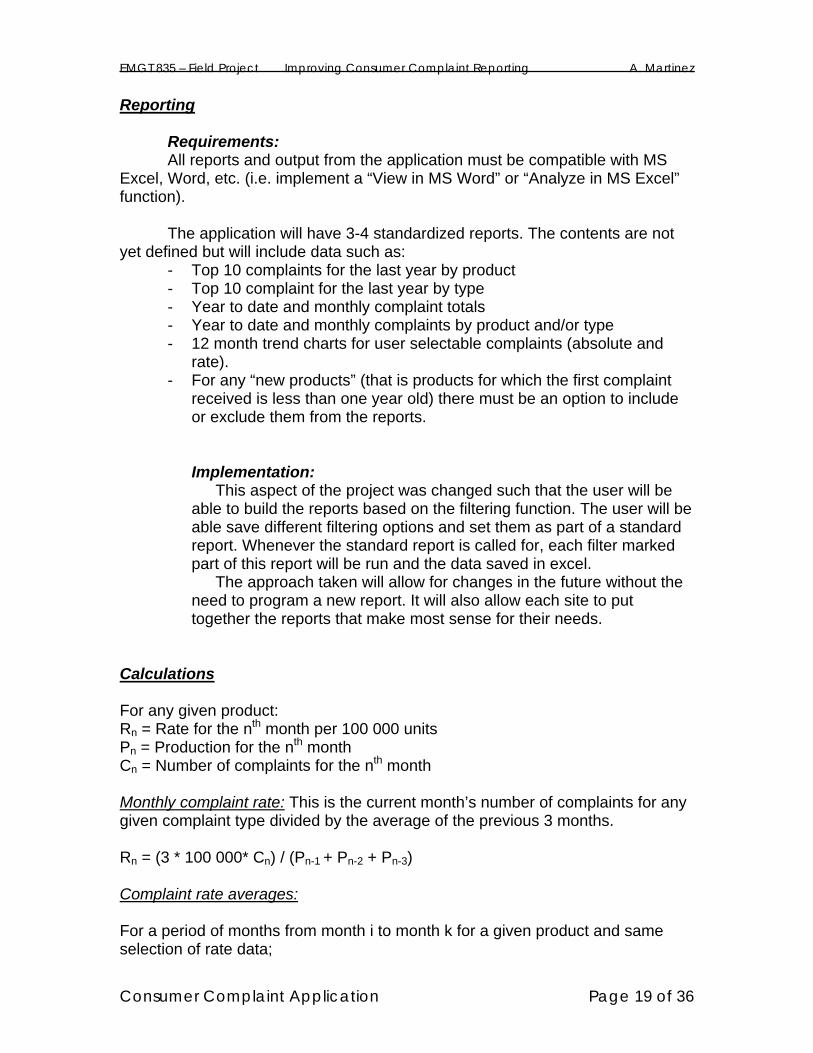
All reports and output from the application must be compatible with MS Excel, Word, etc. (i.e. implement a “View in MS Word” or “Analyze in MS Excel” function). The application will have 3-4 standardized reports. The contents are not yet defined but will include data such as:
- Top 10 complaints for the last year by product - Top 10 complaint for the last year by type - Year to date and monthly complaint totals - Year to date and monthly complaints by product and/or type - 12 month trend charts for user selectable complaints (absolute and
rate). - For any “new products” (that is products for which the first complaint
received is less than one year old) there must be an option to include or exclude them from the reports.
Implementation: This aspect of the project was changed such that the user will be able to build the reports based on the filtering function. The user will be able save different filtering options and set them as part of a standard report. Whenever the standard report is called for, each filter marked part of this report will be run and the data saved in excel. The approach taken will allow for changes in the future without the need to program a new report. It will also allow each site to put together the reports that make most sense for their needs.
Calculations For any given product: Rn = Rate for the nth month per 100 000 units Pn = Production for the nth month Cn = Number of complaints for the nth month Monthly complaint rate: This is the current month’s number of complaints for any given complaint type divided by the average of the previous 3 months. Rn = (3 * 100 000* Cn) / (Pn-1 + Pn-2 + Pn-3) Complaint rate averages: For a period of months from month i to month k for a given product and same selection of rate data;

EMGT 835 – Field Project Improving Consumer Complaint Reporting A. Martinez
Consumer Complaint Application Page 20 of 36
Average rate: 100 000*(Ci + … + Ck-2 + Ck-1 + Ck) / (Pi + … + Pk-2 + Pk-1 + Pk). NOTE: ANY calculation that uses “All Products” will exclude products marked as new (i.e. new product launches will not be included for one year since the time the first complaint was received.) Implementation:
ALL the calculations throughout the application use the 3 month average data. At import time the 3 month averages are calculated and stored separately from the raw data. That 3 month data is then used for the calculations. In that way the reporting calculation is both simplified and handled at a noticeable faster speed.
Rates are never averaged or used for subsequent calculations, production and complaint data are always used. The application will add the production and complaint data for each group (the data would be grouped according to how the user selects the options. I.e. by Focus Factory, by product, YTD by category, etc.).
Technology The application was developed entirely in MS Access and is compatible with Access 2000 onwards. Change Control Definitions: Source code: This is the actual text of the programming language and the means by which changes to the program can be made. A copy of the application that has not been compiled has the source code available for changes. Compiled code/copy: When the source code is translated to machine language all access to the source code is lost. It is impossible to make modifications to an application that has been compiled. The source code is owned by the Company, as such the company will be able to make changes and improve the application in the future. The application will be distributed as a compiled application. In this manner the source code is not accessible, visible, or modifiable. This will prevent any changes from happening outside the proper change control. Initially, the responsibility to archive the original non-compiled copy of the software will rest between the Divisional Documentation Specialist and the Kansas City Documentation Specialist. Over time, a new person may be identified as the best suited to be the owner of the application. In order for a change to be made to the application these are the steps that should be followed:
EMGT 835 – Field Project Improving Consumer Complaint Reporting A. Martinez
Consumer Complaint Application Page 21 of 36
1) The site requesting the change will consult with the division as well as the
other sites. If the change is agreed upon, the proper change control procedures will be followed detailing the change, the purpose, scope, resources.
2) Once the change control documentation is approved and the resources are allocated for making the change, the person responsible for the source code will provide a copy of it to the person responsible for making the changes.
3) After the changes are made, they will have to undergo a validation process to ensure that they a) work as designed and b) do not interfere with the existing validated functions. That documentation will be appended to this document.
4) When the changes to the application have been validated, a compiled copy of the program as well as the source code copy will be given to the person in-charge of keeping the files. At this point, the compiled version of the software will be distributed along with a list of the changes made and their impact.
Security The security strategy will consist of two access levels: Developer and User. In the Developer level the source code will be available for changes and modifications to the program. This will be controlled by physically limiting the access to the source code copy (i.e. distributing only compiled copies) of the application. Access to this copy will be granted only through the change control process outlined above. The User level access will in essence be implemented by the distribution of a compiled version of the application. In this way the users will have the ability to use the full array of tools the application provides but will not be able to make any changes to the program itself. This will ensure that the application will only be used as intended without the risk of a user purposely or not making a change to the inner workings of the program. Given that each copy of the application will only be used by only one or two individuals it was recommended by the developer that site-level security be implemented by either physically limiting access to the application or by using file-level security in the network drive. If the application resides in an individual’s computer hard drive the file is inherently secured by the access to the machine itself. If stored on a network drive, a separate folder would be set up by IT and read-write permission be given ONLY to the person in-charge of consumer complaint reporting. The benefits of this approach is that it avoids having to tailor a copy of the program for each individual site (some sites have different methods for working with MS Access databases). If this application were to be used by a large number of users then the strategy followed above would not be practical but in this case it is the most cost effective way to ensure an acceptable level of security and integrity to the application.
EMGT 835 – Field Project Improving Consumer Complaint Reporting A. Martinez
Consumer Complaint Application Page 22 of 36
4.0) Appendix:
4.1) Validation Justification & Approach
4.2) Risk assessment worksheet 4.3) Verification of calculations:
Part 1 – 3 Month Average Calculation Part 2 – Simple rate calculation Part 3 – Aggregate data rate calculation Part 4 – Method Comparison

EMGT 835 – Field Project Improving Consumer Complaint Reporting A. Martinez
Consumer Complaint Application Page 23 of 36
4.1) Justification & Approach This application was determined to have a low regulatory risk and low business risk hence the validations strategy was limited to a verification of functionality. See the next section for details. The main drivers and most important components of this application are the ability to import data and then calculate consumer complaint rates based on that data.
The approach taken to validate those functions was two-fold. The first part involved verifying the calculations against internal data (data that had already been uploaded and available for use by the application). In order to do this, the data contained in the database was retrieved and used in MS Excel to calculate rates and totals. Those results were then compared to the reporting output from the application. With this first step the different steps that lead up to a final result can be methodically tested and any the root cause of any inconsistencies can be quickly identified.
The calculations can be broken up in the following way: Step 1) Calculation of the 3 month average production. After importing the
production data the application creates a secondary table with the 3 month averages. This table is then used for all subsequent calculations so it is vital that the data is correct. See Part 3 of the Appendix, Calculation Verification part 1.
Step 2) Simple rate calculation. This is the next logical step where the
application must retrieve data from the different tables, link the products correctly as per the settings specified by the user and then calculate a rate based on simple, one to one data (not an aggregate number like for various months or products combined). See Part 3 of the Appendix, Calculation Verification part 2.
Step 3) Aggregate data calculation. This step verifies that the application
is capable of correctly grouping products and calculating a rate based on a multiple months or products combined.
The second part of the validation involved a method comparison. The
application was required to replicate the results for PADD consumer complaint data that had been reported since the beginning of 2005 (January – May).
Step 4) Method comparison. This final step will implicitly serve as a
second verification of the steps above as well as demonstrate that the application is capable to accurately importing data. Any failure of the application to replicate the data already calculated with the old method can only be attributed to one of four things: An error in the original calculation, an error in the application’s calculation, a data entry error in the old method or an import error in the application.

EMGT 835 – Field Project Improving Consumer Complaint Reporting A. Martinez
Consumer Complaint Application Page 24 of 36
Results: The application passed all internal calculation checks. Only a few rounding errors of +/- 0.33 units were seen in the 3 month production averages. This error did not have an effect in the rates when calculated to 2 decimal places. The application passed the method comparison. There were two instances where the rates reported by the application did not match the old reported numbers. Quickly those errors were traced back to using different consumer complaint data in the calculations. The application’s dataset was compared to the original 13 month consumer complaint data files and were in agreement. The old calculation used slightly different numbers from those in the original data. When both scenarios were calculated using the correct numbers the rates matched perfectly. Conclusion: The Consumer Complaint Application can accurately upload data and calculate rates based on single product and month selections as well as multiple groupings.

EMGT 835 – Field Project Improving Consumer Complaint Reporting A. Martinez
Consumer Complaint Application Page 25 of 36
Appendix 2) Risk Assessment
Identification/Owner Process: Calculation of Consumer Complaint Rates Assigned Business - CP: Assigned IT Resource: Not Applicable QA: Amadeo Martinez (Owner) Assessment Date: 6/28/2005
Question - GXP Relevance Yes/No
Does the process impact the control of raw materials, labeling or packaging materials, including goods receipt, identification, traceability, quarantine, storage, handling, sampling, or testing throughout the production processes? No
Does the process impact the control of master production and control records such as material masters, bills of materials, or formulas? No
Does the process impact the picking, goods issue, or delivery of products? No
Does the process impact the transfer of finished goods to customer or remote distribution sites with regard quarantine or stock rotation? No
Does the process impact the quality status of raw materials, packaging materials or finished goods lots including the quarantine, release, hold, rejection, and recall? No
Does the process create, modify, maintain, archive, retrieve or transmit GxP-related information in electronic format that is required by regulatory agencies in an audit scenario? No
Does the process create, modify, maintain, archive, retrieve or transmit records used in regulatory submissions for new products? (i.e.. Experimental Manufacturing Orders, etc.) No
Does the process impact to management and assignment of security authorization profiles that assure processes in master production and control records or other records are instituted by authorized personnel? No

EMGT 835 – Field Project Improving Consumer Complaint Reporting A. Martinez
Consumer Complaint Application Page 26 of 36
Risk Assessment Yes/No
If a system failure or upset were to occur, where there is a lack of a documented back up process or procedure, would there be a significant impact on the company's ability to operate? No
Could a system failure or upset result in significant monetary loss either as a direct result of the failure or as a result of decisions based on inaccurate data as a result of the system failure or upset? No
Has the process been implicated or deficient by any regulatory authorities? No
Could a system failure result in an inappropriate decision or action relative to product quality or consumer safety such as release or shipment decisions? No
Summary GxP Relevance: No Risk: Low
EMGT 835 – Field Project Improving Consumer Complaint Reporting A. Martinez
Consumer Complaint Application Page 27 of 36
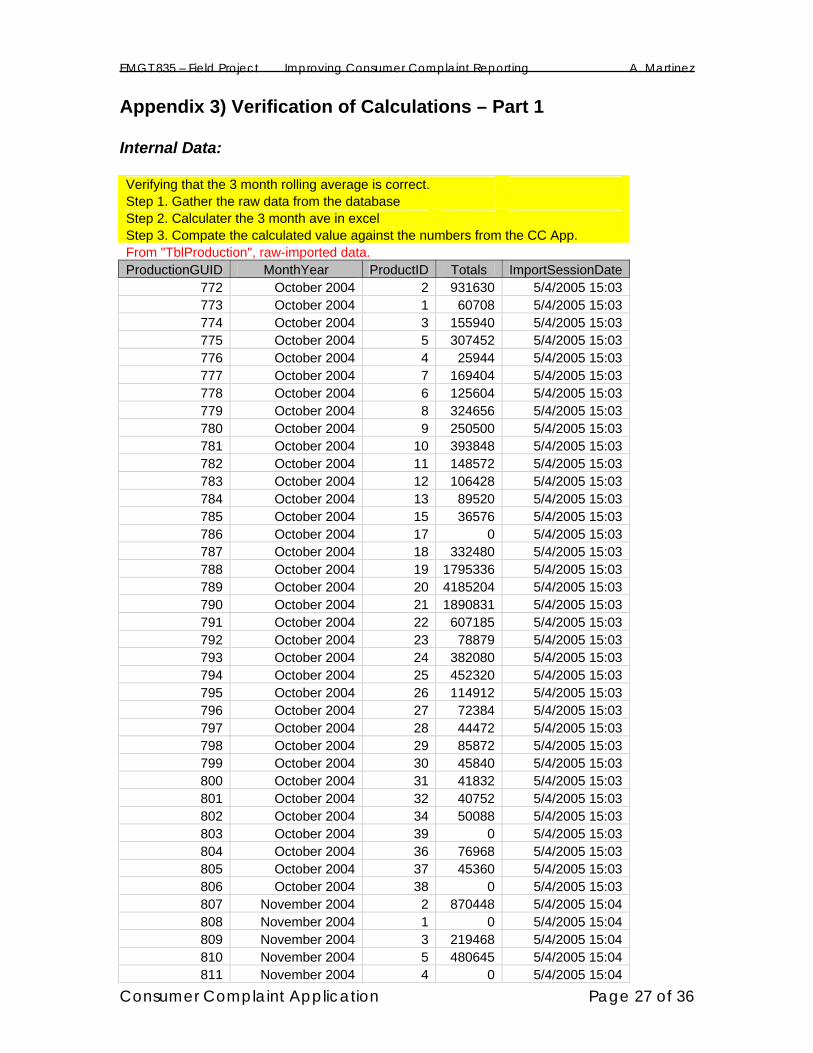
Appendix 3) Verification of Calculations – Part 1 Internal Data: Verifying that the 3 month rolling average is correct. Step 1. Gather the raw data from the database Step 2. Calculater the 3 month ave in excel Step 3. Compate the calculated value against the numbers from the CC App. From "TblProduction", raw-imported data. ProductionGUID MonthYear ProductID Totals ImportSessionDate
772 October 2004 2 931630 5/4/2005 15:03 773 October 2004 1 60708 5/4/2005 15:03 774 October 2004 3 155940 5/4/2005 15:03 775 October 2004 5 307452 5/4/2005 15:03 776 October 2004 4 25944 5/4/2005 15:03 777 October 2004 7 169404 5/4/2005 15:03 778 October 2004 6 125604 5/4/2005 15:03 779 October 2004 8 324656 5/4/2005 15:03 780 October 2004 9 250500 5/4/2005 15:03 781 October 2004 10 393848 5/4/2005 15:03 782 October 2004 11 148572 5/4/2005 15:03 783 October 2004 12 106428 5/4/2005 15:03 784 October 2004 13 89520 5/4/2005 15:03 785 October 2004 15 36576 5/4/2005 15:03 786 October 2004 17 0 5/4/2005 15:03 787 October 2004 18 332480 5/4/2005 15:03 788 October 2004 19 1795336 5/4/2005 15:03 789 October 2004 20 4185204 5/4/2005 15:03 790 October 2004 21 1890831 5/4/2005 15:03 791 October 2004 22 607185 5/4/2005 15:03 792 October 2004 23 78879 5/4/2005 15:03 793 October 2004 24 382080 5/4/2005 15:03 794 October 2004 25 452320 5/4/2005 15:03 795 October 2004 26 114912 5/4/2005 15:03 796 October 2004 27 72384 5/4/2005 15:03 797 October 2004 28 44472 5/4/2005 15:03 798 October 2004 29 85872 5/4/2005 15:03 799 October 2004 30 45840 5/4/2005 15:03 800 October 2004 31 41832 5/4/2005 15:03 801 October 2004 32 40752 5/4/2005 15:03 802 October 2004 34 50088 5/4/2005 15:03 803 October 2004 39 0 5/4/2005 15:03 804 October 2004 36 76968 5/4/2005 15:03 805 October 2004 37 45360 5/4/2005 15:03 806 October 2004 38 0 5/4/2005 15:03 807 November 2004 2 870448 5/4/2005 15:04 808 November 2004 1 0 5/4/2005 15:04 809 November 2004 3 219468 5/4/2005 15:04 810 November 2004 5 480645 5/4/2005 15:04 811 November 2004 4 0 5/4/2005 15:04

EMGT 835 – Field Project Improving Consumer Complaint Reporting A. Martinez
Consumer Complaint Application Page 28 of 36
812 November 2004 7 210618 5/4/2005 15:04 813 November 2004 6 0 5/4/2005 15:04 814 November 2004 8 306112 5/4/2005 15:04 815 November 2004 9 210360 5/4/2005 15:04 816 November 2004 10 359492 5/4/2005 15:04 817 November 2004 11 137796 5/4/2005 15:04 818 November 2004 12 63792 5/4/2005 15:04 819 November 2004 13 59244 5/4/2005 15:04 820 November 2004 15 78912 5/4/2005 15:04 821 November 2004 17 0 5/4/2005 15:04 822 November 2004 18 128336 5/4/2005 15:04 823 November 2004 19 1538322 5/4/2005 15:04 824 November 2004 20 3063364 5/4/2005 15:04 825 November 2004 21 1618692 5/4/2005 15:04 826 November 2004 22 541407 5/4/2005 15:04 827 November 2004 23 195021 5/4/2005 15:04 828 November 2004 24 473655 5/4/2005 15:04 829 November 2004 25 674432 5/4/2005 15:04 830 November 2004 26 172899 5/4/2005 15:04 831 November 2004 27 100320 5/4/2005 15:04 832 November 2004 28 173040 5/4/2005 15:04 833 November 2004 29 104928 5/4/2005 15:04 834 November 2004 30 156576 5/4/2005 15:04 835 November 2004 31 97752 5/4/2005 15:04 836 November 2004 32 74520 5/4/2005 15:04 837 November 2004 34 10080 5/4/2005 15:04 838 November 2004 39 0 5/4/2005 15:04 839 November 2004 36 0 5/4/2005 15:04 840 November 2004 37 0 5/4/2005 15:04 841 November 2004 38 60792 5/4/2005 15:04 842 December 2004 2 1211653 5/4/2005 15:04 843 December 2004 1 47202 5/4/2005 15:04 844 December 2004 3 238764 5/4/2005 15:04 845 December 2004 5 388806 5/4/2005 15:04 846 December 2004 4 29760 5/4/2005 15:04 847 December 2004 7 126372 5/4/2005 15:04 848 December 2004 6 6456 5/4/2005 15:04 849 December 2004 8 65136 5/4/2005 15:04 850 December 2004 9 0 5/4/2005 15:04 851 December 2004 10 42084 5/4/2005 15:04 852 December 2004 11 65856 5/4/2005 15:04 853 December 2004 12 46752 5/4/2005 15:04 854 December 2004 13 19992 5/4/2005 15:04 855 December 2004 15 0 5/4/2005 15:04 856 December 2004 17 38016 5/4/2005 15:04 857 December 2004 18 184512 5/4/2005 15:04 858 December 2004 19 951661 5/4/2005 15:04 859 December 2004 20 1977831 5/4/2005 15:04 860 December 2004 21 1309380 5/4/2005 15:04 861 December 2004 22 239094 5/4/2005 15:04

EMGT 835 – Field Project Improving Consumer Complaint Reporting A. Martinez
Consumer Complaint Application Page 29 of 36
862 December 2004 23 0 5/4/2005 15:04 863 December 2004 24 80880 5/4/2005 15:04 864 December 2004 25 127296 5/4/2005 15:04 865 December 2004 26 62472 5/4/2005 15:04 866 December 2004 27 40392 5/4/2005 15:04 867 December 2004 28 0 5/4/2005 15:04 868 December 2004 29 0 5/4/2005 15:04 869 December 2004 30 0 5/4/2005 15:04 870 December 2004 31 0 5/4/2005 15:04 871 December 2004 32 0 5/4/2005 15:04 872 December 2004 34 30240 5/4/2005 15:04 873 December 2004 39 84216 5/4/2005 15:04 874 December 2004 36 130680 5/4/2005 15:04 875 December 2004 37 59472 5/4/2005 15:04 876 December 2004 38 0 5/4/2005 15:04
Verification
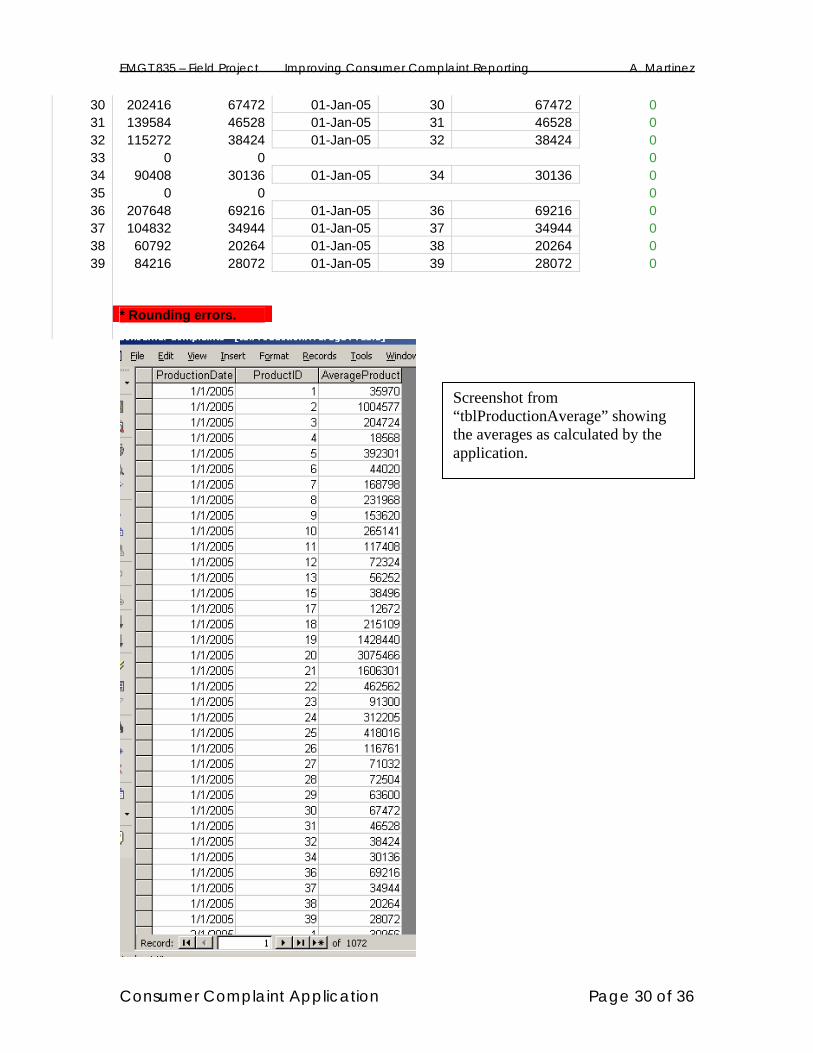
From "TblProductionAverage" for month of January Product
# sum Ave ProductionDate ProductID AverageProduction difference between methods
1 107910 35970 01-Jan-05 1 35970 0 2 3013731 1004577 01-Jan-05 2 1004577 0 3 614172 204724 01-Jan-05 3 204724 0 4 55704 18568 01-Jan-05 4 18568 0 5 1176903 392301 01-Jan-05 5 392301 0 6 132060 44020 01-Jan-05 6 44020 0 7 506394 168798 01-Jan-05 7 168798 0 8 695904 231968 01-Jan-05 8 231968 0 9 460860 153620 01-Jan-05 9 153620 0
10 795424 265141.3333 01-Jan-05 10 265141 -0.33333 * 11 352224 117408 01-Jan-05 11 117408 0 12 216972 72324 01-Jan-05 12 72324 0 13 168756 56252 01-Jan-05 13 56252 0 14 0 0 0 15 115488 38496 01-Jan-05 15 38496 0 16 0 0 0 17 38016 12672 01-Jan-05 17 12672 0 18 645328 215109.3333 01-Jan-05 18 215109 -0.33333 * 19 4285319 1428439.667 01-Jan-05 19 1428440 0.333333 * 20 9226399 3075466.333 01-Jan-05 20 3075466 -0.33333 * 21 4818903 1606301 01-Jan-05 21 1606301 0 22 1387686 462562 01-Jan-05 22 462562 0 23 273900 91300 01-Jan-05 23 91300 0 24 936615 312205 01-Jan-05 24 312205 0 25 1254048 418016 01-Jan-05 25 418016 0 26 350283 116761 01-Jan-05 26 116761 0 27 213096 71032 01-Jan-05 27 71032 0 28 217512 72504 01-Jan-05 28 72504 0 29 190800 63600 01-Jan-05 29 63600 0
EMGT 835 – Field Project Improving Consumer Complaint Reporting A. Martinez
30 202416 67472 01-Jan-05 30 67472 0 31 139584 46528 01-Jan-05 31 46528 0 32 115272 38424 01-Jan-05 32 38424 0 33 0 0 0 34 90408 30136 01-Jan-05 34 30136 0 35 0 0 0 36 207648 69216 01-Jan-05 36 69216 0 37 104832 34944 01-Jan-05 37 34944 0 38 60792 20264 01-Jan-05 38 20264 0 39 84216 28072 01-Jan-05 39 28072 0
* Rounding errors.
Screenshot from “tblProductionAverage” showing the averages as calculated by the application.
Consumer Complaint Application Page 30 of 36

EMGT 835 – Field Project Improving Consumer Complaint Reporting A. Martinez
Consumer Complaint Application Page 31 of 36
Verification of Calculations – Part 2
Verifyng that the application is pulling the correct produciton data and then calculating the rates correctly. Step 1. Get the 3 month averages for the products from the databse Step 2. Run a report for the same dataset and get the production, # complaints, rate as calculated by the app. Step 3. Compare the production data Step 4. Calculate the rate in excel and compare the results. The data below (in gray) is the data as calculated by the reporting function.
ProdID
Production from "TblProductionAverage"
difference in production Complaint Date
Product Code CSR
Complaint Total
Production Total
Complaint Rate
calculated rate
difference
8 231968 0 January 2005 CB 2 231968 0.862187888 0.862188 0 20 3075466 0 January 2005 IS 85 3075466 2.763808802 2.763809 0 19 1428440 0 January 2005 ISA 56 1428440 3.920360673 3.920361 0 21 1606301 0 January 2005 ISIB 102 1606301 6.349992934 6.349993 0 22 462562 0 January 2005 ISS 7 462562 1.513310648 1.513311 0 24 312205 0 January 2005 ISWC 5 312205 1.601511827 1.601512 0
7 168798 0 January 2005 PAGBSF 62 168798 36.73029301 36.73029 0 2 1004577 0 January 2005 PAGL 79 1004577 7.864006443 7.864006 0 3 204724 0 January 2005 PAGMF 27 204724 13.18848792 13.18849 0 5 392301 0 January 2005 PAGSB 31 392301 7.902095585 7.902096 0
18 215109 0 January 2005 POG 0 215109 0 0 0 25 418016 0 January 2005 POS 4 418016 0.956901171 0.956901 0 26 116761 0 January 2005 PPTX 0 116761 0 0 0 38 20264 0 January 2005 VEL 61 20264 301.0264508 301.0265 0

EMGT 835 – Field Project Improving Consumer Complaint Reporting A. Martinez
Selection criteria to retrieve data.
Screenshot of application output used for the calculations in this section.
Consumer Complaint Application Page 32 of 36

EMGT 835 – Field Project Improving Consumer Complaint Reporting A. Martinez
Verification of Calculations – Part 3
Testing that when selecting multiple months the agregate calculation is correct. Step 1. Run a querry for one month for a few products Step 2. Run a querry for the next month for the same products Step 3. Run a querry for both months together Step 4. Calculate the expected rate for 2 month together based on the data from individual months Step 5. Compare both results. Step 6. Calculate the overall rate for the two months and all products selected Step 7. Run a querry for the Focus Factory to see the total rate for the products selected Step 8. Compare the data
Complaint Date Product Code CSR Complaint Total Production Total Complaint Rate January 2005 IS 85 3075466 2.763808802 January 2005 ISA 56 1428440 3.920360673 January 2005 ISS 7 462562 1.513310648 Complaint Date Product Code CSR Complaint Total Production Total Complaint Rate February 2005 IS 80 2715768 2.945759726 February 2005 ISA 62 1352156 4.585269747 February 2005 ISS 15 460192 3.259509074 No date selected so it adds up the raw data and then calculates the rate. Product Code CSR Complaint Total Production Total Complaint Rate IS 165 5791234 2.849133708 ISA 118 2780596 4.243694517 ISS 22 922754 2.384167395 Adding up the individual data and calculating in excel: difference
IS 165 5791234 2.849133708 0 ISA 118 2780596 4.243694517 0 ISS 22 922754 2.384167395 0 Total sums for the three products together 305 9494584 3.212357698
Complaint Rate Factory Name
3.212357698 Bar Soap Difference in rates 0
Consumer Complaint Application Page 33 of 36

EMGT 835 – Field Project Improving Consumer Complaint Reporting A. Martinez
January 2005 data.
February 2005 data.
Aggregate result for both January and February 2005.
Consumer Complaint Application Page 34 of 36

EMGT 835 – Field Project Improving Consumer Complaint Reporting A. Martinez
Verification of Calculations – Part 4 Method comparison to validate import of data and calculation methods Step 1. Obtain data from monthly KPI reporting Step 2. Run a querry in the application to retrieve a the same information Step 3. Compare the results/data from diferent systems
Screenshot form application output.
Data from Monthly KPI (old method)
Data from application report
Consumer Complaint Application Page 35 of 36
PRODUCT Jan-05 Feb-05 Mar-05 Apr-05 May-05 LEMON 7.86 7.26 14.42 11.92 10.75 SPRNG BLSSM 7.90 5.75 8.69 10.71 9.50 BAK SODA FSH 36.73 31.01 21.84 22.02 12.78 MTN FRSH 13.19 10.60 9.78 9.86 7.72
Complaint Date Product
Code CSR Complaint
Rate January 2005 PAGBSF 36.73029301January 2005 PAGL 7.864006443January 2005 PAGMF 13.18848792January 2005 PAGSB 7.902095585
February 2005 PAGBSF 31.00897569February 2005 PAGL 7.257123611February 2005 PAGMF 10.60160311February 2005 PAGSB 5.749346874
March 2005 PAGBSF 21.8430385March 2005 PAGL 14.32458209March 2005 PAGMF 10.14320025March 2005 PAGSB 8.694847321
April 2005 PAGBSF 22.0157229April 2005 PAGL 11.9246363April 2005 PAGMF 9.860352754April 2005 PAGSB 10.71498149May 2005 PAGBSF 12.7781046May 2005 PAGL 10.74664726May 2005 PAGMF 7.723200494May 2005 PAGSB 9.500176703

EMGT 835 – Field Project Improving Consumer Complaint Reporting A. Martinez
Consumer Complaint Application Page 36 of 36
Side by side comparison
Jan-05 From CC app Difference
LEMON 7.86 PAGL 7.86400644 0.00
SPRNG BLSSM 7.90 PAGSB 7.90209558 0.00
BAK SODA FSH 36.73 PAGBSF 36.730293 0.00
MTN FRSH 13.19 PAGMF 13.1884879 0.00
Feb-05 From CC app Difference
LEMON 7.26 PAGL 7.26 0.00
SPRNG BLSSM 5.75 PAGSB 5.75 0.00
BAK SODA FSH 31.01 PAGBSF 31.01 0.00
MTN FRSH 10.60 PAGMF 10.60 0.00 Mar-05
LEMON 14.42 PAGL 14.32 0.09 see explanation below (1)
SPRNG BLSSM 8.69 PAGSB 8.69 0.00 BAK SODA FSH 21.84 PAGBSF 21.84 0.00
MTN FRSH 9.78 PAGMF 10.14 -0.36 see explanation below (2)
Apr-05
LEMON 11.92 PAGL 11.92 0.00
SPRNG BLSSM 10.71 PAGSB 10.71 0.00 BAK SODA FSH 22.02 PAGBSF 22.02 0.00 MTN FRSH 9.86 PAGMF 9.86 0.00
May-05
LEMON 10.75 PAGL 10.75 0.00
SPRNG BLSSM 9.50 PAGSB 9.50 0.00 BAK SODA FSH 12.78 PAGBSF 12.78 0.00 MTN FRSH 7.72 PAGMF 7.72 0.00 (1) The discrepancy is in the numbe of complaints. The original data file and the application report 155 complaints. The KPI data reports 156. This may be due to a data entry error or manual adjustment in the KPI data. See the next note for an example.
(2) The discrepancy is due to using different data. The monthly KPI reported 27 complaints whereas the database has 28 complaints, the same number as in the original CRS data. Due to a judgement call the data had to be adjusted in the monthly KPI. The table below show the calcuation based on both numbers. Based on 28 complaints the CC Application is correct.
# of complaints
production 27 28
276047 9.78 10.14