Embed Size (px)
Citation preview
1 1 1 1
Consumer and Market Insights: Ice Cream Market in South Africa
CS1959MF July 2015
Sample pages
Single User Price: US$1272
2 2 2
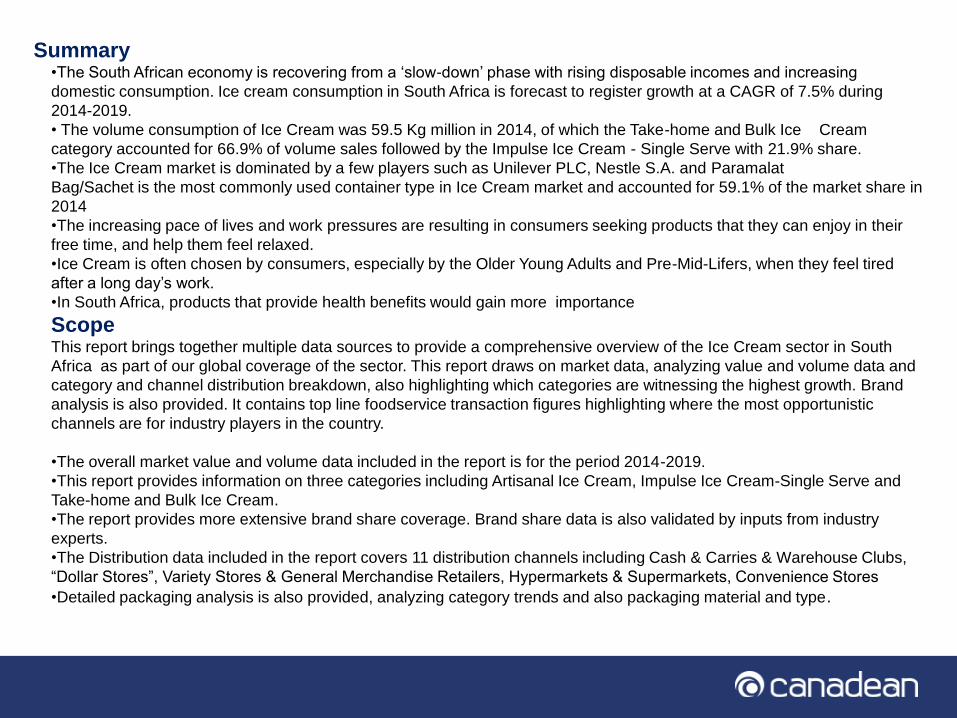
Summary •The South African economy is recovering from a ‘slow-down’ phase with rising disposable incomes and increasing
domestic consumption. Ice cream consumption in South Africa is forecast to register growth at a CAGR of 7.5% during
2014-2019.
• The volume consumption of Ice Cream was 59.5 Kg million in 2014, of which the Take-home and Bulk Ice Cream
category accounted for 66.9% of volume sales followed by the Impulse Ice Cream - Single Serve with 21.9% share.
•The Ice Cream market is dominated by a few players such as Unilever PLC, Nestle S.A. and Paramalat
Bag/Sachet is the most commonly used container type in Ice Cream market and accounted for 59.1% of the market share in
2014
•The increasing pace of lives and work pressures are resulting in consumers seeking products that they can enjoy in their
free time, and help them feel relaxed.
•Ice Cream is often chosen by consumers, especially by the Older Young Adults and Pre-Mid-Lifers, when they feel tired
after a long day’s work.
•In South Africa, products that provide health benefits would gain more importance
Scope This report brings together multiple data sources to provide a comprehensive overview of the Ice Cream sector in South
Africa as part of our global coverage of the sector. This report draws on market data, analyzing value and volume data and
category and channel distribution breakdown, also highlighting which categories are witnessing the highest growth. Brand
analysis is also provided. It contains top line foodservice transaction figures highlighting where the most opportunistic
channels are for industry players in the country.
•The overall market value and volume data included in the report is for the period 2014-2019.
•This report provides information on three categories including Artisanal Ice Cream, Impulse Ice Cream-Single Serve and
Take-home and Bulk Ice Cream.
•The report provides more extensive brand share coverage. Brand share data is also validated by inputs from industry
experts.
•The Distribution data included in the report covers 11 distribution channels including Cash & Carries & Warehouse Clubs,
“Dollar Stores”, Variety Stores & General Merchandise Retailers, Hypermarkets & Supermarkets, Convenience Stores
•Detailed packaging analysis is also provided, analyzing category trends and also packaging material and type.
3 3 3
This report provides thorough, fact based analysis of the Ice Cream Market in South Africa. The findings
are supported by Canadean data collected using extensive secondary and primary research methodologies.
Reasons to buy this report
Country Context Analysis is provided on key macro
economic indicators including GDP per
capita, consumer price index and population
for 2009-2014
Market Overview Helps identify high potential categories and
explore further market opportunities based
on detailed value and volume analysis
Retail Landscape and Key
Distribution Channels Existing and new players can analyse key
distribution channels to identify and
evaluate trends and opportunities
Packaging Includes analysis on packaging materials,
containers, closures and outers. Also
provides forecast growth in usage of the
same for 2014-2019
Brand and Private label Share Gain an understanding of the total
competitive landscape based on detailed
brand share analysis to plan effective
market positioning
Consumer Trends Provides access to the key and most
influential consumer trends driving prepared
meals consumption, and how they influence
consumer behavior in the market which will
help determine the best audiences to target
4 4 4
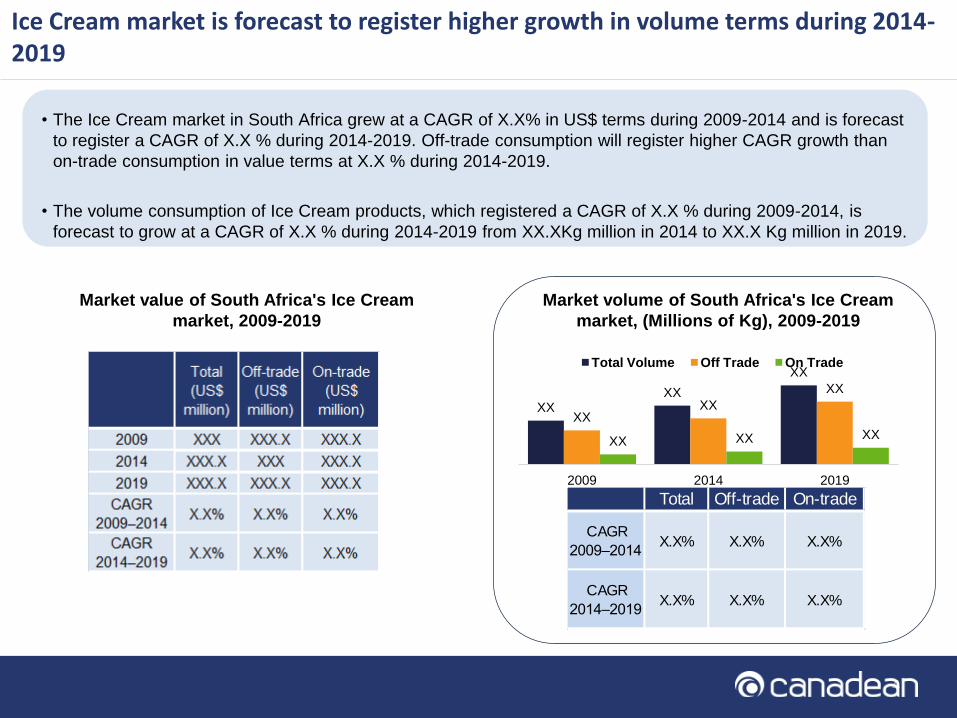
Ice Cream market is forecast to register higher growth in volume terms during 2014-2019
Market value of South Africa's Ice Cream
market, 2009-2019
Market volume of South Africa's Ice Cream
market, (Millions of Kg), 2009-2019
• The Ice Cream market in South Africa grew at a CAGR of X.X% in US$ terms during 2009-2014 and is forecast
to register a CAGR of X.X % during 2014-2019. Off-trade consumption will register higher CAGR growth than
on-trade consumption in value terms at X.X % during 2014-2019.
• The volume consumption of Ice Cream products, which registered a CAGR of X.X % during 2009-2014, is
forecast to grow at a CAGR of X.X % during 2014-2019 from XX.XKg million in 2014 to XX.X Kg million in 2019.
XX XX
XX
XX XX
XX
XX XX XX
2009 2014 2019
Total Volume Off Trade On Trade
Total Off-trade On-trade
CAGR
2009–2014 X.X% X.X% X.X%
CAGR
2014–2019 X.X% X.X% X.X%
5 5 5
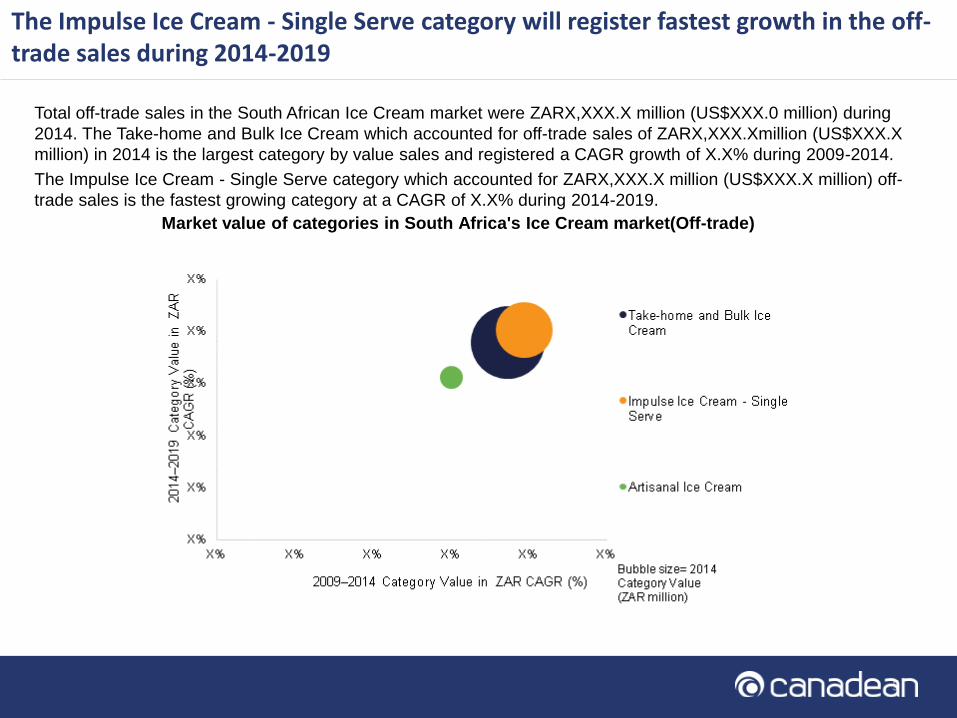
The Impulse Ice Cream - Single Serve category will register fastest growth in the off-trade sales during 2014-2019
Market value of categories in South Africa's Ice Cream market(Off-trade)
Total off-trade sales in the South African Ice Cream market were ZARX,XXX.X million (US$XXX.0 million) during
2014. The Take-home and Bulk Ice Cream which accounted for off-trade sales of ZARX,XXX.Xmillion (US$XXX.X
million) in 2014 is the largest category by value sales and registered a CAGR growth of X.X% during 2009-2014.
The Impulse Ice Cream - Single Serve category which accounted for ZARX,XXX.X million (US$XXX.X million) off-
trade sales is the fastest growing category at a CAGR of X.X% during 2014-2019.
6 6 6
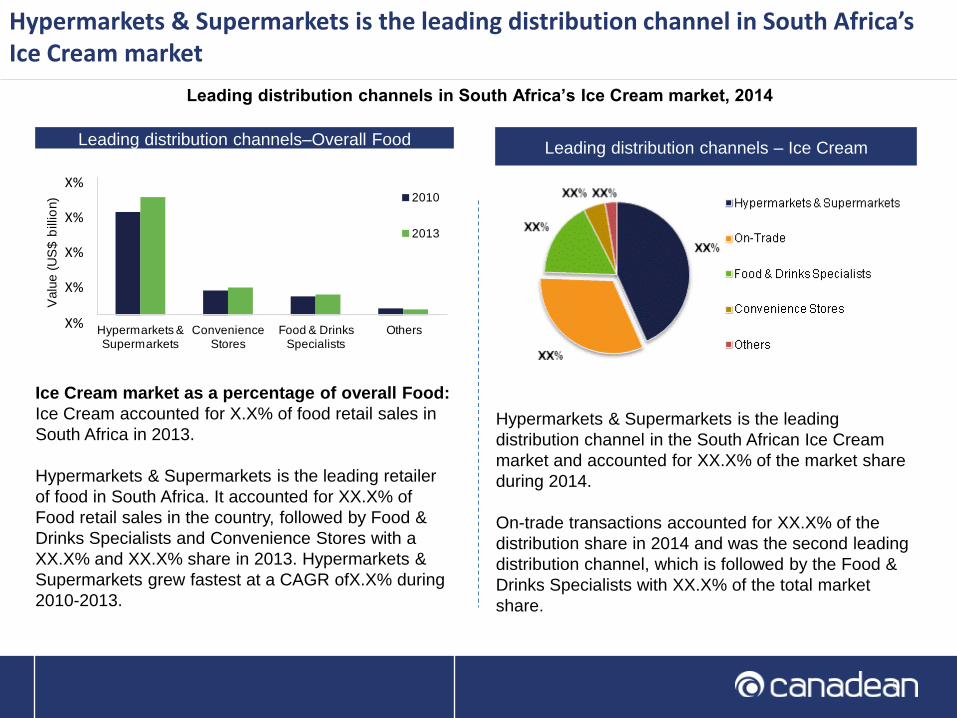
Leading distribution channels–Overall Food
Ice Cream market as a percentage of overall Food:
Ice Cream accounted for X.X% of food retail sales in
South Africa in 2013.
Hypermarkets & Supermarkets is the leading retailer
of food in South Africa. It accounted for XX.X% of
Food retail sales in the country, followed by Food &
Drinks Specialists and Convenience Stores with a
XX.X% and XX.X% share in 2013. Hypermarkets &
Supermarkets grew fastest at a CAGR ofX.X% during
2010-2013.
Hypermarkets & Supermarkets is the leading distribution channel in South Africa’s Ice Cream market
Leading distribution channels in South Africa’s Ice Cream market, 2014
Leading distribution channels – Ice Cream
Hypermarkets & Supermarkets is the leading
distribution channel in the South African Ice Cream
market and accounted for XX.X% of the market share
during 2014.
On-trade transactions accounted for XX.X% of the
distribution share in 2014 and was the second leading
distribution channel, which is followed by the Food &
Drinks Specialists with XX.X% of the total market
share.
0
10
20
30
40
Hypermarkets & Supermarkets
Convenience Stores
Food & Drinks Specialists
Others
Valu
e (
US
$ b
illio
n) 2010
2013
X%
X%
X%
X%
X%
7 7 7
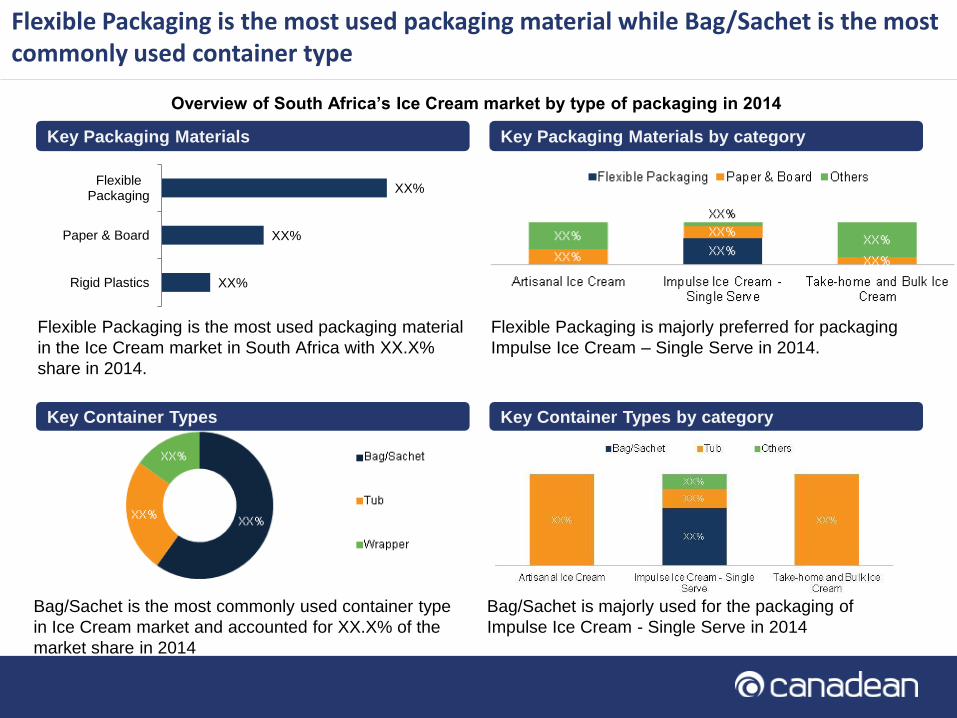
Flexible Packaging is the most used packaging material while Bag/Sachet is the most commonly used container type
Bag/Sachet is the most commonly used container type
in Ice Cream market and accounted for XX.X% of the
market share in 2014
Flexible Packaging is majorly preferred for packaging
Impulse Ice Cream – Single Serve in 2014.
Bag/Sachet is majorly used for the packaging of
Impulse Ice Cream - Single Serve in 2014
Key Packaging Materials Key Packaging Materials by category
Key Container Types Key Container Types by category
Flexible Packaging is the most used packaging material
in the Ice Cream market in South Africa with XX.X%
share in 2014.
Overview of South Africa’s Ice Cream market by type of packaging in 2014
XX%
XX%
XX%
Flexible Packaging
Paper & Board
Rigid Plastics
8 8 8
This report features data derived from market data.
Market Data
In order to create the data for all reports in this series and ensure their robustness, a comprehensive and empirically robust research
methodology has been adopted. This combines both a large-scale program of industry research with the results of extensive primary
industry interviewing and calling. Furthermore, all definitions are standardized across products and countries to ensure comparability.
The two main research methods, secondary research and primary research (the program of interviewing industry contacts), are brought
together and because both sets of research processes have been designed in conjunction with each other they can be combined and
consolidated into the final, integrated data sets.
The secondary research process involves covering publicly available sources, trade associations, specialist databases, company annual
reports, and industry publications. Primary research involves a major program of interviewing leading industry executives for each category
covered in each country – all with local country experts; typically brand, product and marketing managers for major brands within each
country. These processes help analysts in capturing both qualitative and quantitative information about the market.
The final stage of the process is the triangulation of inputs obtained from all the research methods with the analyst’s own understanding of
the market in order to finalize the data. Once the data is finalized, it goes through various top level quality checks prior to publishing.
Methodology
9 9 9 17/07/2015 9 7/17/2015 9 7/17/2015 9 7/17/2015 9
Related Reports
•Consumer and Market Insights: Ice Cream Market in Poland
•Consumer and Market Insights: Ice Cream Market in Sweden
•Consumer and Market Insights: Ice Cream Market in Netherlands
•Consumer and Market Insights: Ice Cream Market in Canada
•Consumer and Market Insights: Ice Cream Market in Japan
•Consumer and Market Insights: Ice Cream Market in the Phillipines
10 10 10 17/07/2015 10 7/17/2015 10 7/17/2015 10 7/17/2015 10
Table of Contents
Introduction
• Report introduction and definitions
Market Overview
• Macroeconomic indicators – Population and age structure, GDP and Consumer Price Index
• National retail and foodservice figures – Key Takeouts
• Market value and volume for the South African Ice Cream market
• Historical and projected consumption in the South African Ice Cream market
• Degree of trade up/down-trade in the South African Ice Cream market
• Volume of South African Ice Cream by market category
• Historical and forecast value of South African Ice Cream by market category
• Winners and losers in the South African Ice Cream market
• Segment share of the category and change in market share in the South African Ice Cream market
• Category level pricing in the South African Ice Cream market
Retailer and packaging
• Leading retailers in the South African Ice Cream
• Leading distribution channels in the South African Ice Cream market
• Leading distribution channels by category in the South African Ice Cream market
• South African Ice Cream market by type of packaging material/container
• South African Ice Cream by type of packaging closure/outer
• South African Ice Cream by type of packaging, forecasted
• Leading brands in the South African Ice Cream market by category
11 11 11 17/07/2015 11 7/17/2015 11 7/17/2015 11 7/17/2015 11
Table of Contents
Consumer trend analysis
• Canadean’s consumer trend framework and explanation of the sub-trends
• For key trends in the South African Ice Cream market
• How the trend is influencing consumption in the South African Ice Cream market
• How to target the trend in the South African Ice Cream market
• How the trend will evolve in the South African Ice Cream market
• Key target demographic and the rate and which the trend will evolve
• Key drivers in the market that will increasingly influence consumption
Innovation examples
• New product examples launched in the South African Ice Cream market
Appendix
• Country context
• Sector overview
• Category data
• Segment data
• Packaging data
• Category definitions
• Segment definitions
• Channel definitions
• Methodology
• About Canadean
12 12 12
List of Figures
Figure 1: Macro economic analysis: GDP per capita, Population , CPI(2009-2014), Age Profile (2014)
Figure 2: Foodservice transactions by sectors, profit and cost, 2014
Figure 3: Market value (ZAR, USD) and volume analysis, 2009-2019
Figure 4: Consumers purchase behavior - Trading up/down, 2014
Figure 5: Market volume share analysis by categories, 2014
Figure 6: Growth analysis by category, 2009-2019
Figure 7: Change in market share by category, 2014-2019
Figure 8: Leading distribution channels, overall food, 2010-2013
Figure 9: Leading distribution channels by category, 2014
Figure 10: Packaging analysis – key packaging material, type, closure and outer, 2014
Figure 11: Growth in key packaging material, type, closure and outer, 2014-2019
Figure 12: Brand share growth, 2011-2014
Figure 13: Brand share analysis by categories, 2014
Figure 14: Examples - new product development
Table of Contents
13 13 13
List of tables
Table 1: Country indicators – overall food value and volume, 2014
Table 2: Market value analysis in ZAR and USD, 2009-2019
Table 3: Market volume growth analysis, 2014-2019
Table 4: Average prices (ZAR)by category, 2014
Table 5: Segment level analysis by category, 2014
Table 6: Leading retailers and store count
Table 7: Leading brands by category, 2014
Table of Contents