Embed Size (px)
Citation preview
7/29/2019 construction waste
http://slidepdf.com/reader/full/construction-waste 1/22
developing a strategic approach to construction waste
20 year strategy draft for comment
7/29/2019 construction waste
http://slidepdf.com/reader/full/construction-waste 2/22
developing a strategic approach to construction waste
2
Contents
Contact details for consultation responses:Gilli HobbsBRE, Garston, Watford WD25 9XXT: +44 (0) 1923 664856E: [email protected]
www.bre.co.uk
Developing a strategic approach to construction waste – 20 year strategy 3
Background 3
Approach to developing a strategy 3
Forward look at construction and impacts in relation to resource efficiency 4
Key issues moving forward relating to material resource efficiency 7
Developing long term targets for construction resource efficiency 8
Overview 8
1 Construction waste: Housing 9
2 Refurbishment waste: Housing 12
3 Demolition waste: All sectors 14
4 Modelling the way to achieving the strategy and targets – actions 17
Glossary 22
7/29/2019 construction waste
http://slidepdf.com/reader/full/construction-waste 3/22
developing a strategic approach to construction waste
Developing a strategic approach to construction waste – 20 year strategy
Background
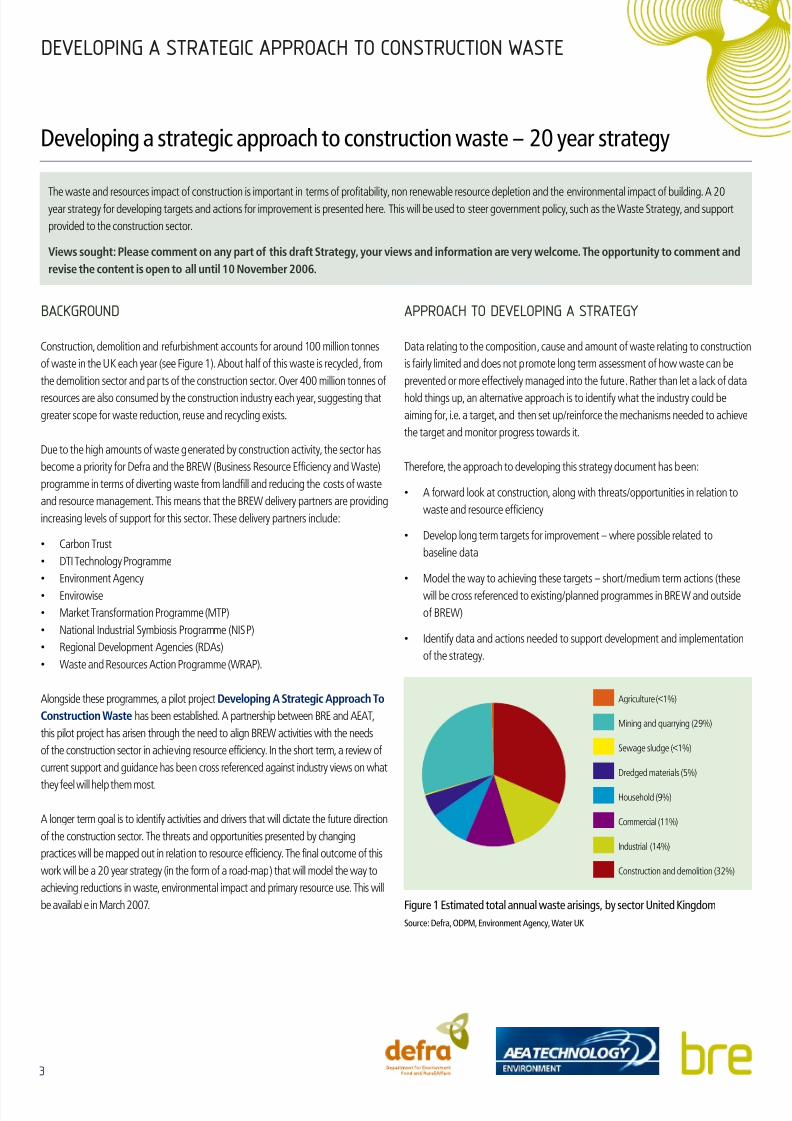
Construction, demolition and refurbishment accounts for around 100 million tonnes
of waste in the UK each year (see Figure 1). About half of this waste is recycled, from
the demolition sector and par ts of the construction sector. Over 400 million tonnes of
resources are also consumed by the construction industry each year, suggesting that
greater scope for waste reduction, reuse and recycling exists.
Due to the high amounts of waste generated by construction activity, the sector has
become a priority for Defra and the BREW (Business Resource Efficiency and Waste)
programme in terms of diverting waste from landfill and reducing the costs of waste
and resource management. This means that the BREW delivery partners are providing
increasing levels of support for this sector. These delivery partners include:
Carbon Trust
DTI Technology Programme
Environment Agency
Envirowise
Market Transformation Programme (MTP)
National Industrial Symbiosis Programme (NISP)
Regional Development Agencies (RDAs)
Waste and Resources Action Programme (WRAP).
Alongside these programmes, a pilot project Dvlpng A Statgc Appach T
Cnstctn Wast has been established. A partnership between BRE and AEAT,
this pilot project has arisen through the need to align BREW activities with the needs
of the construction sector in achieving resource efficiency. In the short term, a review of
current support and guidance has been cross referenced against industry views on what
they feel will help them most.
A longer term goal is to identify activities and drivers that will dictate the future direction
of the construction sector. The threats and opportunities presented by changing
practices will be mapped out in relation to resource efficiency. The final outcome of this
work will be a 20 year strategy (in the form of a road-map) that will model the way to
achieving reductions in waste, environmental impact and primary resource use. This will
be available in March 2007.
•
•
•
•
•
•
•
•
approach to developing a strategy
Data relating to the composition , cause and amount of waste relating to construction
is fairly limited and does not promote long term assessment of how waste can be
prevented or more effectively managed into the future . Rather than let a lack of data
hold things up, an alternative approach is to identify what the industry could be
aiming for, i.e. a target, and then set up/reinforce the mechanisms needed to achieve
the target and monitor progress towards it.
Therefore, the approach to developing this strategy document has been:
A forward look at construction, along with threats/opportunities in relation to
waste and resource efficiency
Develop long term targets for improvement – where possible related to
baseline data
Model the way to achieving these targets – short/medium term actions (these
will be cross referenced to existing/planned programmes in BREW and outside
of BREW)
Identify data and actions needed to support development and implementation
of the strategy.
•
•
•
•
The waste and resources impact of construction is important in terms of profitability, non renewable resource depletion and the environmental impact of building. A 20year strategy for developing targets and actions for improvement is presented here. This will be used to steer government policy, such as the Waste Strategy, and support
provided to the construction sector.
Vws sght: Plas cmmnt n any pat f ths daft Statgy, y vws and nfmatn a vy wlcm. Th pptnty t cmmnt and
vs th cntnt s pn t all ntl 10 Nvmb 2006.
Agriculture (<1%)
Mining and quarrying (29%)
Sewage sludge (<1%)
Dredged materials (5%)
Household (9%)
Commercial (11%)
Industrial (14%)
Construction and demolition (32%)
Figure 1 Estimated total annual waste arisings, by sector United Kingdom
Source: Defra, ODPM, Environment Agency, Water UK

7/29/2019 construction waste
http://slidepdf.com/reader/full/construction-waste 4/22
developing a strategic approach to construction waste
forward look at construction and impacts in relation to resource efficiency
The way in which construction might change, or continue unchanged, into the future is likely to be very relevant to achieving waste reduction, and greater reuse and recycling.
This question was posed at a recent industry workshop to get a view of construction in the future and impacts in relation to resource efficiency. Table 1 below summarises the
responses and other widely expressed views.
Table 1 Future construction and potential impacts and resource efficiency
Scna f ft cnstctn
(t ya 2025 )
Ptntal mpact n cnstctn sc ffcncy
Clmat chang
Low carbon buildings required at new build The design of new building types (probably off site fabricated) offers opportunities to embed resource efficiency intotheir life cycle. However, waste reduction, reuse and recycling becomes less important unless clearly aligned to the lowcarbon agenda. This requires construction material flows and options to be fully quantified and evaluated.
Retrofitting of existing buildings to lower carbonemissions – incentives to reward/offset costs
Greater amounts of waste arising from refurbishment and the provision of replacement products/materials. Unlessaligned to low carbon, as detailed above, this will be considered an acceptable consequence of achieving reducedcarbon emissions from the operational phase of buildings .
Increased demolition of buildings, especially thosenot able/viable for energy efficiency upgrade
This is a likely consequence, especially in the drive to fit more homes on existing built land. Currently the bulk of C&Dwaste is related to demolition (though we don’t know what the proportion is ). Demolition rates are around 20,000homes/year today. Estimates of 4 times this amount to meet the 60% carbon emission reduction have been suggested.This would significantly increase the amount of C&D waste from 100 MT/year to anything between 200 – 300 MT/year.Unless reprocessing facilities/markets are developed at a similar rate, resources will be lost/devalued and the percentagelandfilled will increase.
For example, opportunities need to be provided for planned re-use of demolition products at local plan level, such asuse of masonry components for internal thermal mass in lightweight buildings.
Glbal/Clmat Chang
Rapidly changing climate, both in physical andpolitical sense.
This could make it difficult to st ick to targets and systematic approaches to resource efficiency i.e . crisis managementrather than agreed, long term solutions . It is also difficult for industry to invest in new technologies and infrastructure if there is uncertainty into the future e.g. the long running debate over energy from waste v. recycling.
As above, potential for ‘inside-out’ buildings of lightweight insulated frames with interior thermal mass. Potential fit withcarbon/climate agenda and resource efficiency, but needs evaluation.
Adaptable and flexible buildings The effects of climate change and unpredictable demographics could lead to a generation of buildings that are betterequipped to change e.g. heating to cooling, home to office space. This would be beneficial in terms of waste reduction.The absence of adaptable buildings wi ll increase construction activity to provide change of use/per formance. This would
in turn increase waste.
Lgslatn/plcy
Price of wasted products/materials, labour anddisposal/recycling increases higher than inflationlevels
Cost of waste and potential to reduce costs through waste reduction should increase accordingly. More transparencycould be derived through whole li fe costing techniques that correctly value this element . Environmental crime willincrease unless producers are complying with their Duty of Care obligations .
Subject to EU legislation below, might provide financial drivers towards local economies in construction materials:
High value materials with ‘inherent’ reclamation value
Natural materials with low embodied carbon (minimal transport & processing) with zero waste options at end of
life.
1�
2�

7/29/2019 construction waste
http://slidepdf.com/reader/full/construction-waste 5/22
developing a strategic approach to construction waste
Scna f ft cnstctn
(t ya 2025 )
Ptntal mpact n cnstctn sc ffcncy
Increased levels of construction, especially in thehousing sector, within affordability constraints.Overhaul of planning, supply chain and skil ls issuesto facilitate this.
Could lead to further waste if less time available to reduce, reuse, recycle. Incentives to retain and recruit good peoplecould reduce waste. Planning could be used to greater effect in achieving better levels of environmental performance.Supply chain integration should reduce waste and promote continuous improvement. H & S requirements may precludesome types of reclamation or recycling. More integrated services required for collection/segregation/consolidation of construction waste.
Further legislation from EU on:
Construction products
Producer responsibility
Life cycle impacts/integrated product policy
1�
2�
3�
May restrict recycled content or the use of reclaimed products/materials on grounds of performance or local
emissions e.g. indoor air quality materials and the accumulation of hazardous materials.
Greater take back of offcuts, packaging, end of life waste.
Greater reliance on life cycle data and verification, with further improvements in design, distribution and end-of- life
recycling.
1�
2�
3�
Bsnss
Bsnss – cst dctnPerformance based contracting – procuring onfunction rather than labour, plant and materials
Design, build and management of buildings should bring about improvements in terms of resource efficiency i.e. vestedinterest to keep whole life costs, which includes cost of products/materials, construction, refurbishment and demolitionwaste. Important that these elements are costed correctly in whole life costing techniques.
Bsnss – qalty and spdGrowing market share of off-site fabricatedbuildings and components
High levels of water and energy efficiency designed in. Reduction in traditional site waste with increase in packagingwaste. Shorter lifespan buildings – increase in demolition waste, especially by volume. Changing composition of demolition waste from highly recyclable to difficult to recycle.
Bsnss – qalty and spd
Growing standardisation of building types andproducts
For planned building programmes, such as schools and prisons, there is great scope to produce a optimum design basedupon standardised components. This improves predictability of the construction programme and should reduce costs.Ideally, standardisation will have additional objectives of reduced waste and improved durability.
Bsnss – lw nnng csts
Zero/low maintenance buildings
This could be beneficial if it means that buildings last longer i.e . less chance of failure through neglect. Alternative couldbe that actual service life of building elements is reduced leading to greater levels of refurbishment/demolition waste.
Bsnss – ncas pfts
Investment requires better returns on built assetwith lower financial risk
New technologies, products and materials that increase recycled content and/or reduce waste are considered higherrisk until they have been proven. Demonstration, testing and third party approval will need to be accompanied bydemonstrable and financial benefits to developers. Increasingly stringent planning conditions will only work if thefinancial returns are worth it.
Bsnss – cmpttn
Global competition increases and/or local supplybecomes more important
Around 40% of construction is procured by government, which is bound by procurement rules that promote globalcompetition. Sustainable procurement will become increasingly important, both private and public, with haulage of resources in and waste out becoming less acceptable. Reuse of on-site resources will be a possible way of satisfyingboth procurement rules and proximity principles.
See above comments on local material economy – predictions needed on future world energy scenarios and how this
might affect composition of construction materials sector.
Bsnss – capacty
Keeping up with new build requirements
The current rate of housing replacement is around 0.1% of the stock. At that rate, houses will have to last for a 1000years. Although this is not likely to be the case, it is obvious that the buildings around in 20 years time will be mostlythose here today i.e . the building of the future is already built. In terms of resource efficiency, the main implications arethose of dealing with the current building legacy, for example hazardous materials.
7/29/2019 construction waste
http://slidepdf.com/reader/full/construction-waste 6/22
developing a strategic approach to construction waste
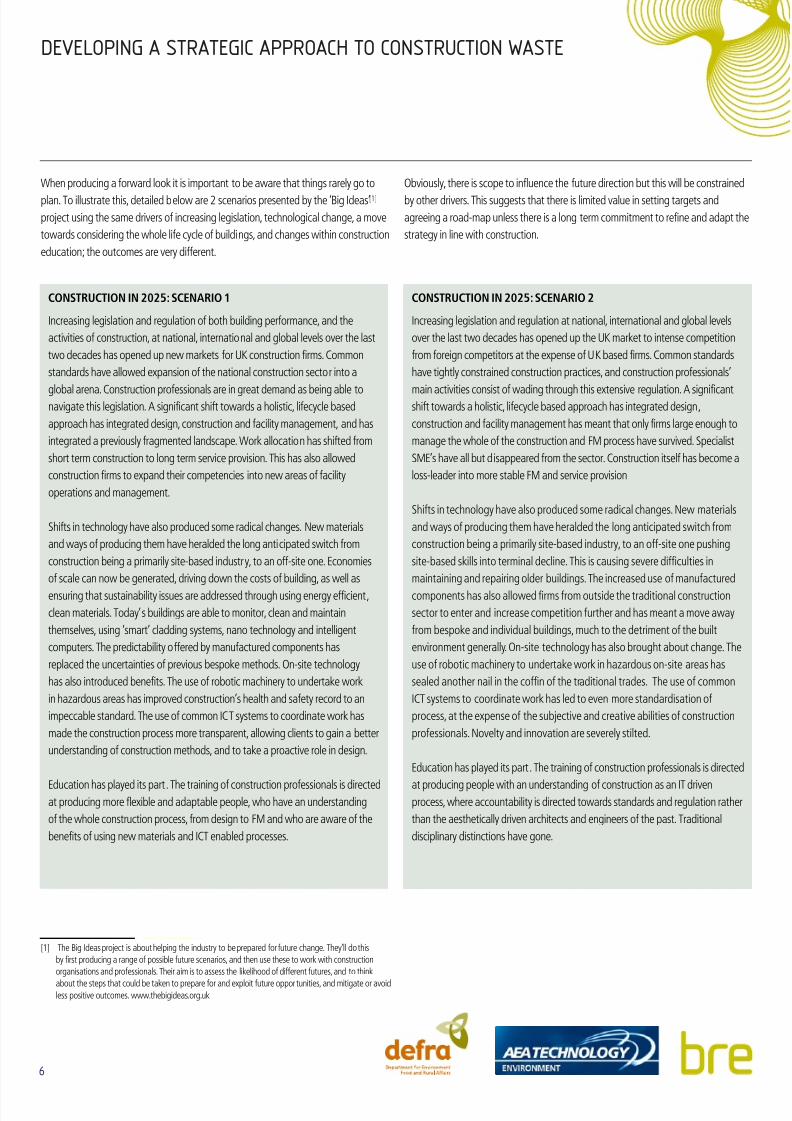
When producing a forward look it is important to be aware that things rarely go to
plan. To illustrate this, detailed below are 2 scenarios presented by the ‘Big Ideas’[1]
project using the same drivers of increasing legislation, technological change, a move
towards considering the whole life cycle of buildings, and changes within construction
education; the outcomes are very different.
[1] The Big Ideas project is about helping the industry to be prepared for future change. They’ll do this
by first producing a range of possible future scenarios, and then use these to work with construction
organisations and professionals. Their aim is to assess the likelihood of different futures, and to think
about the steps that could be taken to prepare for and exploit future oppor tunities, and mitigate or avoidless positive outcomes. www.thebigideas.org.uk
Obviously, there is scope to influence the future direction but this will be constrained
by other drivers. This suggests that there is limited value in setting targets and
agreeing a road-map unless there is a long term commitment to refine and adapt the
strategy in line with construction.
CoNSTruCTioN iN 2025: SCeNArio 1
Increasing legislation and regulation of both building performance, and the
activities of construction, at national, international and global levels over the last
two decades has opened up new markets for UK construction firms. Common
standards have allowed expansion of the national construction sector into a
global arena. Construction professionals are in great demand as being able tonavigate this legislation. A significant shift towards a holistic, lifecycle based
approach has integrated design, construction and facility management, and has
integrated a previously fragmented landscape. Work allocation has shifted from
short term construction to long term service provision. This has also allowed
construction firms to expand their competencies into new areas of facility
operations and management.
Shifts in technology have also produced some radical changes. New materials
and ways of producing them have heralded the long anticipated switch from
construction being a primarily site-based industr y, to an off-site one. Economies
of scale can now be generated, driving down the costs of building, as well as
ensuring that sustainability issues are addressed through using energy efficient ,
clean materials. Today’s buildings are able to monitor, clean and maintain
themselves, using ‘smart’ cladding systems, nano technology and intelligent
computers. The predictability offered by manufactured components has
replaced the uncertainties of previous bespoke methods. On-site technology
has also introduced benefits. The use of robotic machinery to undertake work
in hazardous areas has improved construction’s health and safety record to an
impeccable standard. The use of common ICT systems to coordinate work has
made the construction process more transparent, allowing clients to gain a better
understanding of construction methods, and to take a proactive role in design.
Education has played its part . The training of construction professionals is directedat producing more flexible and adaptable people, who have an understanding
of the whole construction process, from design to FM and who are aware of the
benefits of using new materials and ICT enabled processes.
CoNSTruCTioN iN 2025: SCeNArio 2
Increasing legislation and regulation at national, international and global levels
over the last two decades has opened up the UK market to intense competition
from foreign competitors at the expense of UK based firms. Common standards
have tightly constrained construction practices, and construction professionals’
main activities consist of wading through this extensive regulation. A significantshift towards a holistic, lifecycle based approach has integrated design ,
construction and facility management has meant that only firms large enough to
manage the whole of the construction and FM process have survived. Specialist
SME’s have all but d isappeared from the sector. Construction itself has become a
loss-leader into more stable FM and service provision
Shifts in technology have also produced some radical changes. New materials
and ways of producing them have heralded the long anticipated switch from
construction being a primarily site-based industry, to an off-site one pushing
site-based skills into terminal decline. This is causing severe difficulties in
maintaining and repairing older buildings. The increased use of manufactured
components has also allowed firms from outside the traditional construction
sector to enter and increase competition further and has meant a move away
from bespoke and individual buildings, much to the detriment of the built
environment generally. On-site technology has also brought about change. The
use of robotic machinery to undertake work in hazardous on-site areas has
sealed another nail in the coffin of the traditional trades. The use of common
ICT systems to coordinate work has led to even more standardisation of
process, at the expense of the subjective and creative abilities of construction
professionals. Novelty and innovation are severely stilted.
Education has played its part . The training of construction professionals is directed
at producing people with an understanding of construction as an IT drivenprocess, where accountability is directed towards standards and regulation rather
than the aesthetically driven architects and engineers of the past. Traditional
disciplinary distinctions have gone.
7/29/2019 construction waste
http://slidepdf.com/reader/full/construction-waste 7/22
developing a strategic approach to construction waste
key issues moving forward relating to material
resource efficiency
climate change
Climate change, and hence carbon emissions , will be a key driving force in changing
construction over the next 20 years. This has a major impact on waste reduction,
reuse and recycling in terms of prioritisation of building type, materials, products and
new technologies. There is little suggestion that this step change to reduce carbon
will have an equal reduction in material resource use. In fact it could have an adverse
effect if material resources are considered far less important than energy resources.
Two key points with regard to material efficiency/embodied carbon and the low-
carbon-operation are:
The more energy-efficient a building is, then the greater the proportional carbon
significance of its materials. Very typical figures for a conventional building with
a 100 year life would be that embodied C emissions from materials are about
10% of total emissions over building lifespan, or 10 years’ worth . In a building
with 40% of the operational energy requirements of a conventional building (the
40% House), assuming absolute embodied C is similar, then embodied C will be
more like 22% of total lifetime emissions. By the time you get to the 20% House,
embodied C is more like 36% of total emissions.
If building lifespans are reducing. On a 50-year lifespan, the proportions of
embodied C to overall C emissions are as follows:
100% House – embodied C 22% of total
40% House – embodied C 36% of total
20% House – embodied C 53% of total.
These are rough estimates, but it is entirely plausible that material impacts will equal
or outweigh operational impacts in the future. Therefore material resource efficiency
should be integrated into the energy-efficiency agenda on a proper (carbon) basis.
This will have wide-ranging impacts on material selection and end-of- life solutions.
new products/Building systems/ways of working
Partly to respond to climate change, but mainly to deliver affordable buildings that
can be quickly constructed, traditional construction will be replaced by standardised
and factory produced buildings and elements . This may result in lower amounts of site
based construction waste but off-site waste, lifespan and recyclability of demolition
waste need to be factored in to give a whole life view of waste and resource use.
Standardisation will enable a more focussed approach to waste reduction and resource
efficiency to be developed, i.e. target the resource use of a few standardised products/
elements and the impact will be far greater than trying to influence several thousand.
This could be linked to sustainable procurement, in that better performing products/
elements become the standard, e.g. A rated in the Green Guide to Specification.
1�
2�
legislation/policy
Producer Responsibility could be extended to all products and Integrated Product
Policy along the lines of the Energy Using Products Directive. The result of this would
be two fold – firstly, the l ife cycle impacts of products will need to be evaluated
and possibly rated; secondly, that manufacturers will have to consider the resource
implications of their products across the whole life cycle . This should have a very
positive effect on waste production, and will also promote reuse and recycling where
they offer improved life cycle impact. Construction products are already assessing
their life cycle impact through Environmental Profiles[2], making improvements based
upon the results is the next step.
conclusions
To be aligned with low carbon building – material use, waste, reuse and recycling
should be quantifiable in terms of carbon. Improvements should result in carbon
savings.
Demolition and refurbishment waste are likely to increase. Traditional markets for
these materials are likely to decline. This will mean that current levels of reuse and
recycling will be hard to sustain.
Modern methods of construction (MMC) will become more widespread.
Resource use and waste over a fixed period, e.g. 100 years, should be compared
for traditional versus MMC as part of the drive to reduce environmental impacts.
Systems and products that give the best overall environmental performance and
whole life cost should be promoted.
Standardisation could promote large scale improvements in environmental
performance. It is important that material resource efficiency is developed
alongside other environmental criteria.
Life cycle assessment is the basis for making robust decisions on improving the
environmental performance of products, elements and buildings. Although
adopted by some product manufacturers, this has not been applied across the
sector and default information has to be used for wastage rates and proportion
of waste that is reused/recycled. Impacts relating to material resource efficiency
should be accessible for a particular product within overall LCA, e.g. the net
environmental gain of making certain improvements could be move from one
rating to a higher one.
Vws sght: Plas cmmnt n ths fwad lk. Wh y hav
dffng addtnal pnts, spptng data/ nfmatn s vy
wlcm.
[2] Life Cycle Assessment methodology for construction products – www.bre.co.uk
•
•
•
•
•
7/29/2019 construction waste
http://slidepdf.com/reader/full/construction-waste 8/22
developing a strategic approach to construction waste
Developing long term targets for construction resource efficiency
With little baseline data, targets and related action plans are not going to be entirely
robust and will require further development. However, this strategy proposes a route
to defining how this could be derived with industry and policy makers. It also tries to
illustrate the scale of impact of adopting one target/approach over another. Long term
targets for waste reduction, reuse and recycling are the best way to define what can be
achieved and focus our combined efforts within the framework of a combined target.
This is not easy to do for a wastestream that is fragmented in the following ways:
Waste is being produced and sent to landfill by the actions of the whole
supply chain – manufacture, distribution, design , construction, maintenance,
refurbishment, demolition, (resource management).
Waste from manufacture, construction, refurbishment and demolition are
lumped together for reporting purposes but are different in terms of amounts,composition, causes, levels of integration and separation.
However, different targets for each part of the supply chain or activity would be less
meaningful unless set against overarching, global targets i .e. each will have a role
to play in reaching the target but the actions and relative contribution may differ in
accordance with their ability to del iver. An example of this could be waste reduction
and demolition waste, whereby the only realistic way to prevent demolition waste
would be to have a longer lasting building – this is not something the demolition
sector can achieve. It is more the design, durability of products/materials and
maintenance of the building that can achieve waste reduction in this instance.
•
•
overview
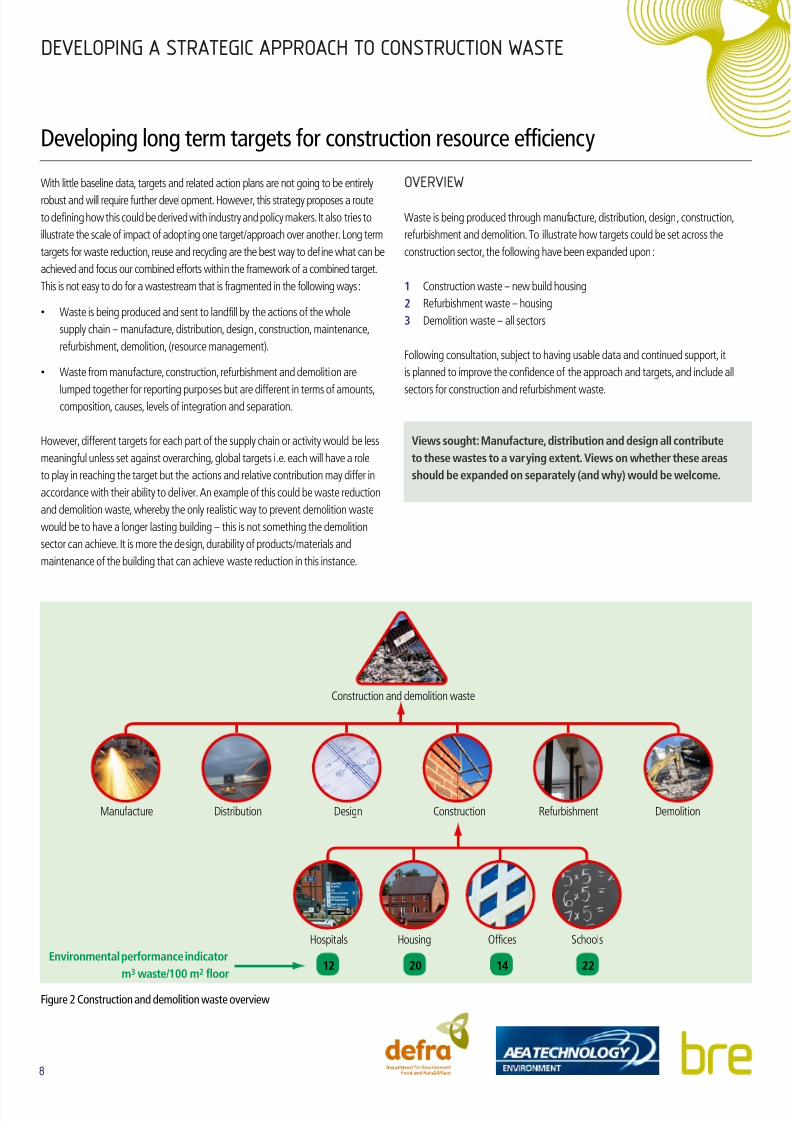
Waste is being produced through manufacture, distribution, design , construction,
refurbishment and demolition. To illustrate how targets could be set across the
construction sector, the following have been expanded upon:
Construction waste – new build housing
Refurbishment waste – housing
Demolition waste – all sectors
Following consultation, subject to having usable data and continued support, it
is planned to improve the confidence of the approach and targets, and include all
sectors for construction and refurbishment waste.
Vws sght: Manfact, dstbtn and dsgn all cntbt
t ths wasts t a vayng xtnt. Vws n whth ths aas
shld b xpandd n spaatly (and why) wld b wlcm.
1�
2�
3�
Figure 2 Construction and demolition waste overview
envnmntal pfmanc ndcat
m3 wast/100 m2 fl12 20 14 22
Construction and demolition waste
Manufacture Distribution Design Construction Refurbishment Demolition
Hospitals Housing Offices Schools
7/29/2019 construction waste
http://slidepdf.com/reader/full/construction-waste 9/22
developing a strategic approach to construction waste
1 Construction waste: Housing
Amounts of waste produced from different types of construction are starting to be
developed[3] and improved upon. Some initial Environmental Performance Indicators
are given below – these are given as m3 waste per 100 m2 floor area, which allows
for like for like comparison; and m3/£100,000 which can be greatly influenced by the
regional, design and material costs, see Table 2.
Table 2 Environmental Performance Indicators
D = Dmltn
e = excavatnG = Gndwks
M = Manfam
S = Svcs
P = Pattns
F = Ft-t
C i v i l
n g i n i n g
L i s u
H a l t h C a /
H s p i t a l s
r s i d n t i a l
o f f i c
e d u c a t i n /
S c h l s
Bnchmaks e,G, M G, M,S, P, F
G, M,S, P, F
G, M,S, P, F
G, M,S, P, F
G, M,S, P, F
Key PerformanceIndicator (KPI)= m3/£100,000project value
52.3 6.1 7.9 17.3 8.4 13.2
Environmentalperformance Indicator(EPI) = m3/100m2
61.7 3.7 11.7 19.2 14.1 22.2
[3] Environmental Performance Indicators and other waste benchmarking in construction is subject to
development through the National Benchmarking Project – contact [email protected]
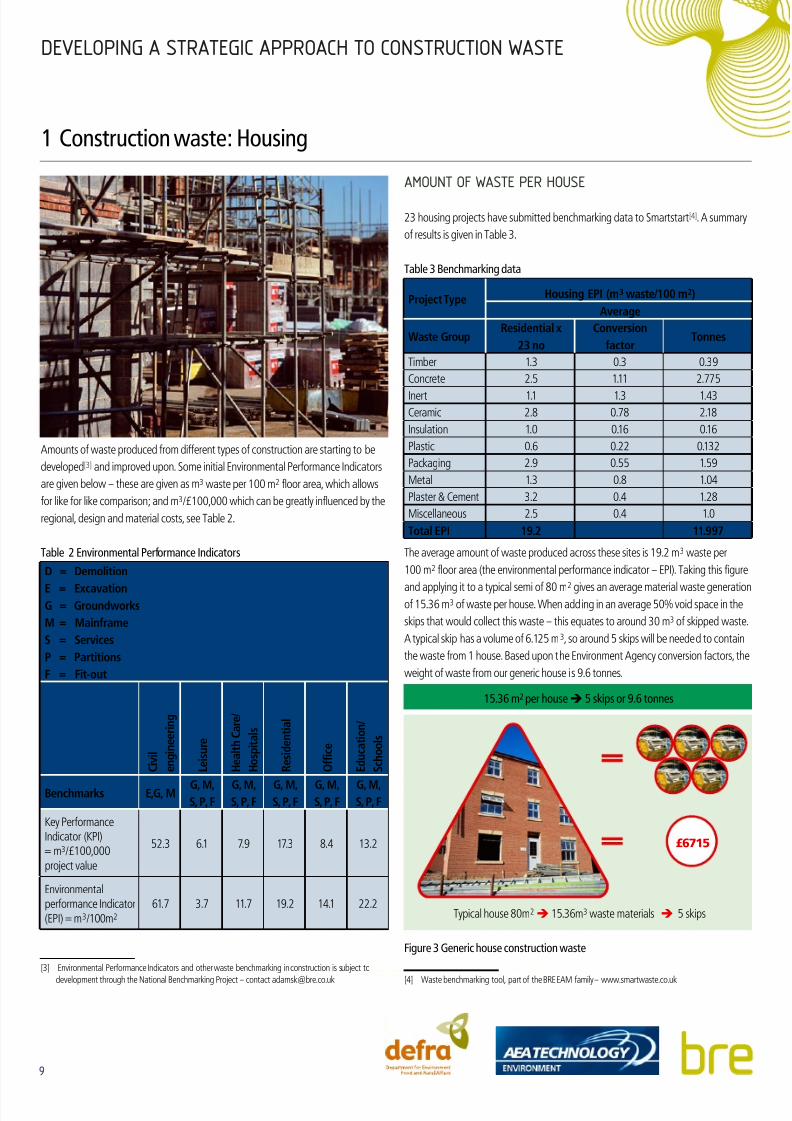
amount of waste per house
23 housing projects have submitted benchmarking data to Smartstart[4]. A summary
of results is given in Table 3.
Table 3 Benchmarking data
Pjct Typ Hsng ePi (m3 wast/100 m2)
Avag
Wast Gprsdntal x
23 n
Cnvsn
factTnns
Timber 1.3 0.3 0.39
Concrete 2.5 1.11 2.775
Inert 1.1 1.3 1.43Ceramic 2.8 0.78 2.18
Insulation 1.0 0.16 0.16
Plastic 0.6 0.22 0.132
Packaging 2.9 0.55 1.59
Metal 1.3 0.8 1.04
Plaster & Cement 3.2 0.4 1.28
Miscellaneous 2.5 0.4 1.0
Ttal ePi 19.2 11.997
The average amount of waste produced across these sites is 19.2 m3 waste per
100 m2 floor area (the environmental performance indicator – EPI). Taking this figure
and applying it to a typical semi of 80 m2 gives an average material waste generationof 15.36 m3 of waste per house. When adding in an average 50% void space in the
skips that would collect this waste – this equates to around 30 m3 of skipped waste.
A typical skip has a volume of 6.125 m3, so around 5 skips will be needed to contain
the waste from 1 house. Based upon the Environment Agency conversion factors, the
weight of waste from our generic house is 9.6 tonnes.
[4] Waste benchmarking tool, part of the BREEAM family – www.smartwaste.co.uk
Typical house 80m2 Ë 15.36m3 waste materials Ë 5 skips
£6715
15.36 m2 per houseË 5 skips or 9.6 tonnes
Figure 3 Generic house construction waste
7/29/2019 construction waste
http://slidepdf.com/reader/full/construction-waste 10/22
developing a strategic approach to construction waste
10
cost of waste per house
Studies[5] have shown that a typical construction skip costs around £1343 when you
add the cost of the skip to the cost of labour and materials that fill it. The breakdown
of this is:
Skip hire £85 (quite low compared to current prices) – 6.4% of cost
Labour to fill it £163 – 12.1% of cost
Cost of materials in skip £1095 – 81.5% of cost
Therefore, the financial cost of waste for our generic house is for 5 skips, around
£6715, and rising.
£6715 per houseË
£5439 cost of materials, £812 labour, £430 skip cost
carBon dioxide equivalent/emBodied energy of waste product
per house
The products and materials that are wasted during the construction process have life
cycle impacts associated with their material extraction, production and distribution.
It is even more difficult to make estimates here due to the lack of data in both the
material composition of this wastestream and the l ife cycle impacts associated with
the production, distribution and installation of the associated wasted products.
A possible approach could be as follows:
Convert the 9.6 tonnes of materials in each category to number of ecopoints[6]
Combine all the ecopoints and then convert these to an equivalent tonnes of
carbon dioxide
We have gone through this process with the limited data we have and made various
assumptions. The end result is that the 9.6 tonnes of waste produced by our generic
house has a carbon dioxide equivalent of around 5.44 tonnes.[7]
[5] Amec – Darlington study
[6] Ecopoints are a combination of 13 impacts that feed into the BRE environmental profile of products and
materials i.e. a life cycle assessment.
[7] Minimising CO2 emissions from new homes 2nd edition – AECB 2006
•
•
•
1�
2�
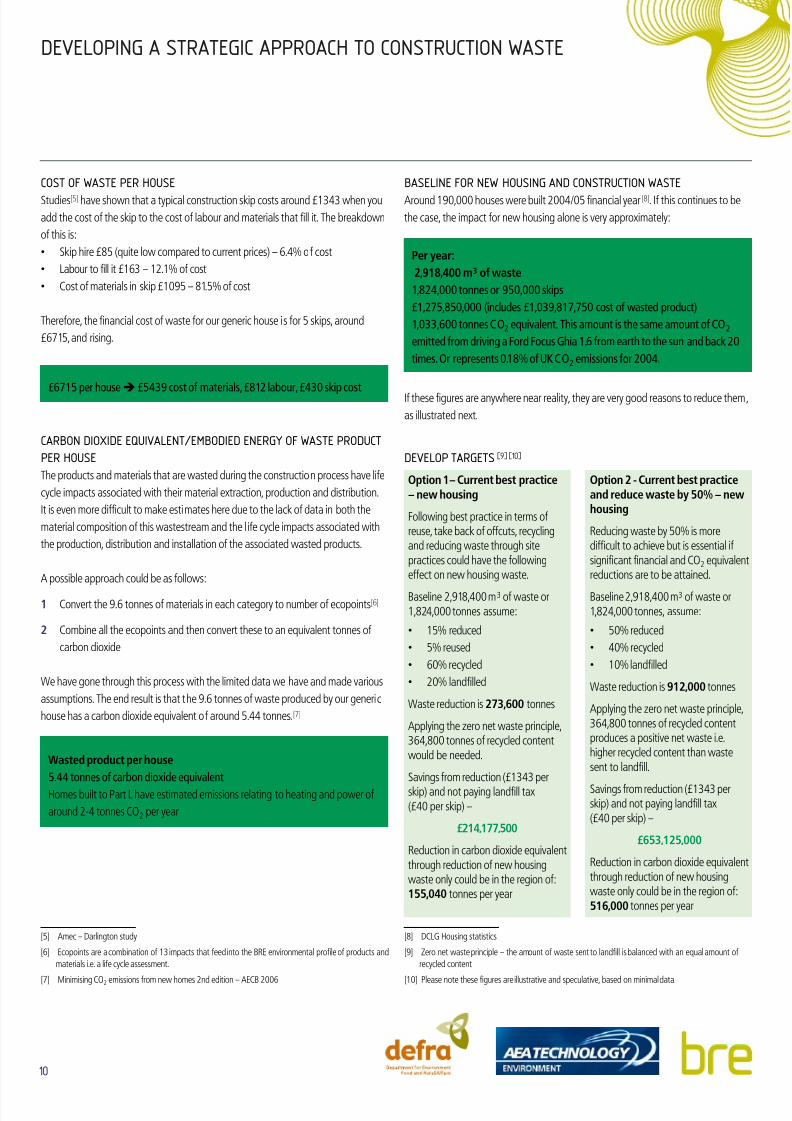
Baseline for new housing and construction waste
Around 190,000 houses were built 2004/05 financial year [8]. If this continues to be
the case, the impact for new housing alone is very approximately:
If these figures are anywhere near reality, they are very good reasons to reduce them,
as illustrated next.
develop targets [] [10]
[8] DCLG Housing statistics
[9] Zero net waste principle – the amount of waste sent to landfill is balanced with an equal amount of
recycled content
[10] Please note these figures are illustrative and speculative, based on minimal data.
Wastd pdct p hs
5.44 tonnes of carbon dioxide equivalent
Homes built to Part L have estimated emissions relating to heating and power of
around 2-4 tonnes CO2 per year
P ya:
2,918,400 m3 f wast
1,824,000 tonnes or 950,000 skips
£1,275,850,000 (includes £1,039,817,750 cost of wasted product)
1,033,600 tonnes CO2 equivalent. This amount is the same amount of CO2
emitted from driving a Ford Focus Ghia 1.6 from earth to the sun and back 20
times. Or represents 0.18% of UK CO2 emissions for 2004.
optn 1– Cnt bst pactc– nw hsng
Following best practice in terms of reuse, take back of offcuts, recyclingand reducing waste through sitepractices could have the followingeffect on new housing waste.
Baseline 2,918,400 m3 of waste or1,824,000 tonnes assume:
15% reduced
5% reused
60% recycled
20% landfilled
Waste reduction is 273,600 tonnes
Applying the zero net waste principle,364,800 tonnes of recycled contentwould be needed.
Savings from reduction (£1343 perskip) and not paying landfill tax(£40 per skip) –
£214,177,500
Reduction in carbon dioxide equivalentthrough reduction of new housingwaste only could be in the region of:155,040 tonnes per year
•
•
•
•
optn 2 - Cnt bst pactcand dc wast by 50% – nwhsng
Reducing waste by 50% is moredifficult to achieve but is essential if significant financial and CO2 equivalentreductions are to be attained.
Baseline 2,918,400 m3 of waste or1,824,000 tonnes, assume:
50% reduced
40% recycled
10% landfilled
Waste reduction is 912,000 tonnes
Applying the zero net waste principle,364,800 tonnes of recycled contentproduces a positive net waste i.e.higher recycled content than wastesent to landfill.
Savings from reduction (£1343 perskip) and not paying landfill tax(£40 per skip) –
£653,125,000
Reduction in carbon dioxide equivalentthrough reduction of new housingwaste only could be in the region of:
516,000 tonnes per year
•
•
•
7/29/2019 construction waste
http://slidepdf.com/reader/full/construction-waste 11/22
developing a strategic approach to construction waste
11
rsng csts f sc managmnt
Resource management costs are rising each year, it was not possible to predict by
how much. Discussions with industry experts suggest that resource management
costs will approximately double over the next ten years, from around £55 per tonne
to £120 per tonne[11]. Therefore, it is important to note that savings estimated
from the 2 options should be set against these rises to determine when they will be
overtaken these rising costs . Some factoring in of corresponding increased savings
(e.g. not paying higher landfill tax on recycled waste) would also provide a better
model of when this might happen.
[11] Peter Jones, Biffa
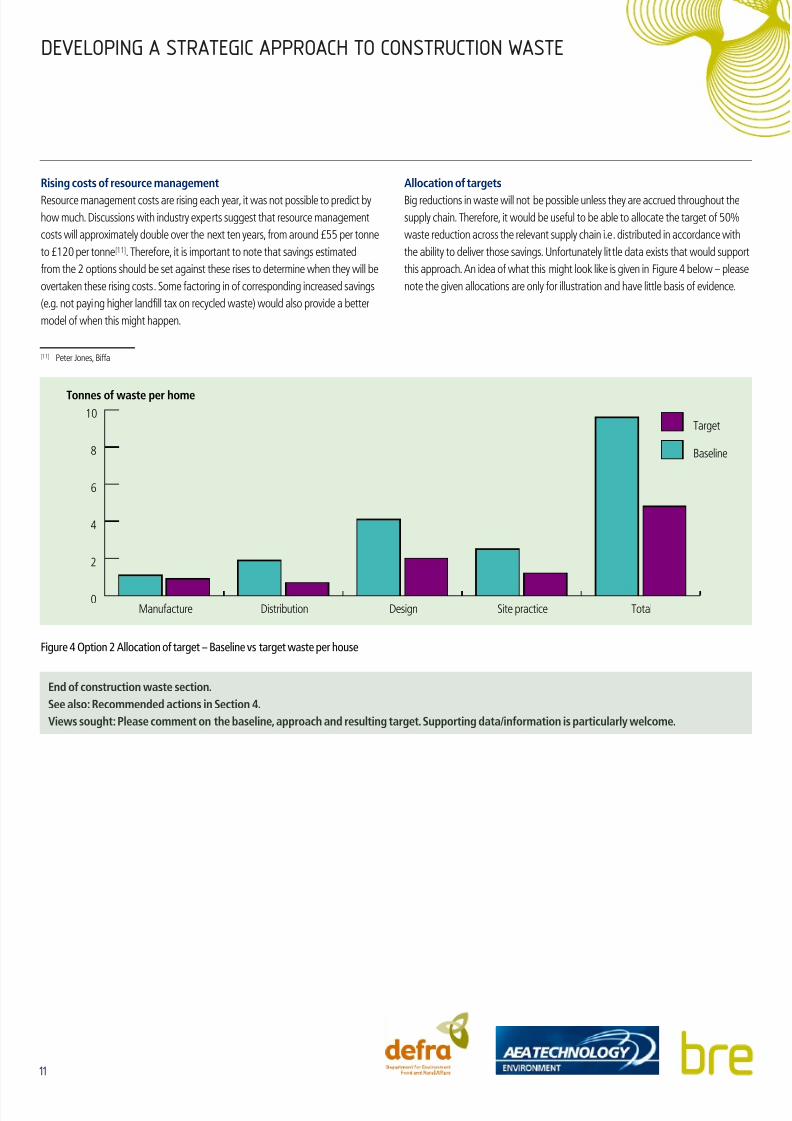
Allcatn f tagts
Big reductions in waste will not be possible unless they are accrued throughout the
supply chain. Therefore, it would be useful to be able to allocate the target of 50%
waste reduction across the relevant supply chain i.e . distributed in accordance with
the ability to deliver those savings. Unfortunately lit tle data exists that would support
this approach. An idea of what this might look like is given in Figure 4 below – please
note the given allocations are only for illustration and have little basis of evidence.
0
2
4
6
8
10Target
Baseline
TotalSite practiceDesignDistributionManufacture
Tonnes of waste per home
Figure 4 Option 2 Allocation of target – Baseline vs target waste per house
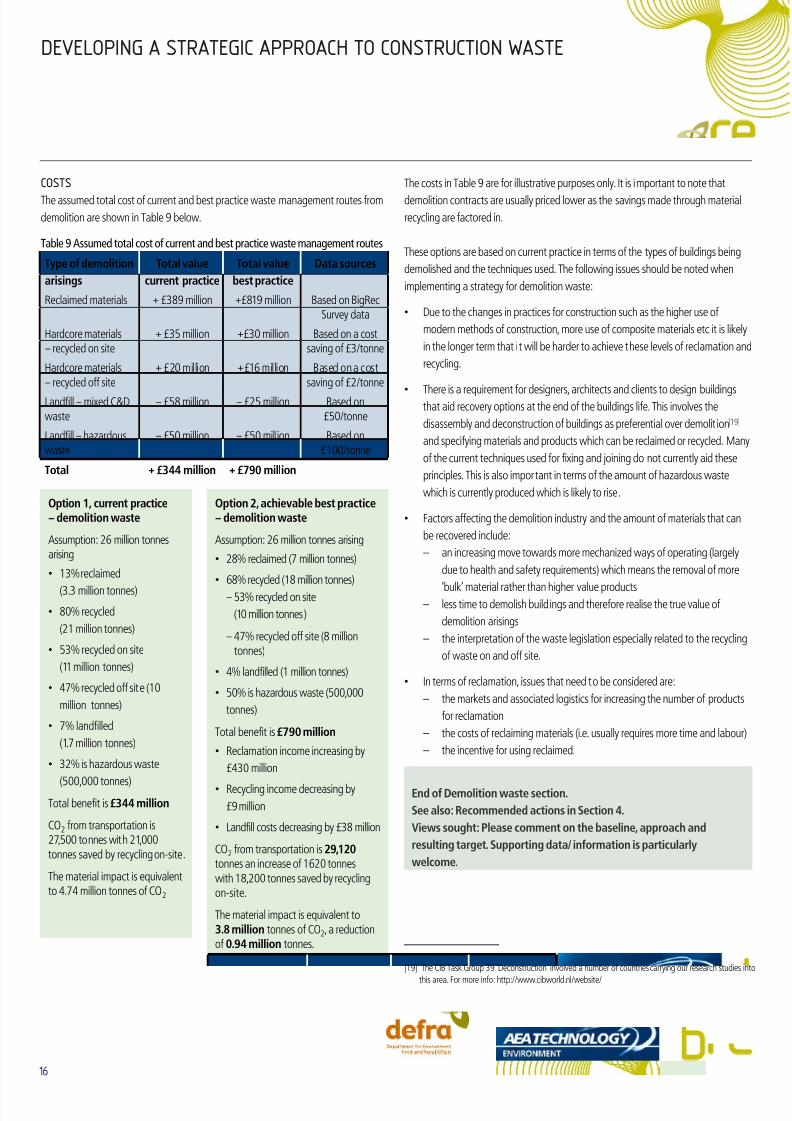
end f cnstctn wast sctn.
S als: rcmmndd actns n Sctn 4.
Vws sght: Plas cmmnt n th basln, appach and sltng tagt. Spptng data/nfmatn s patclaly wlcm.
7/29/2019 construction waste
http://slidepdf.com/reader/full/construction-waste 12/22
developing a strategic approach to construction waste
12
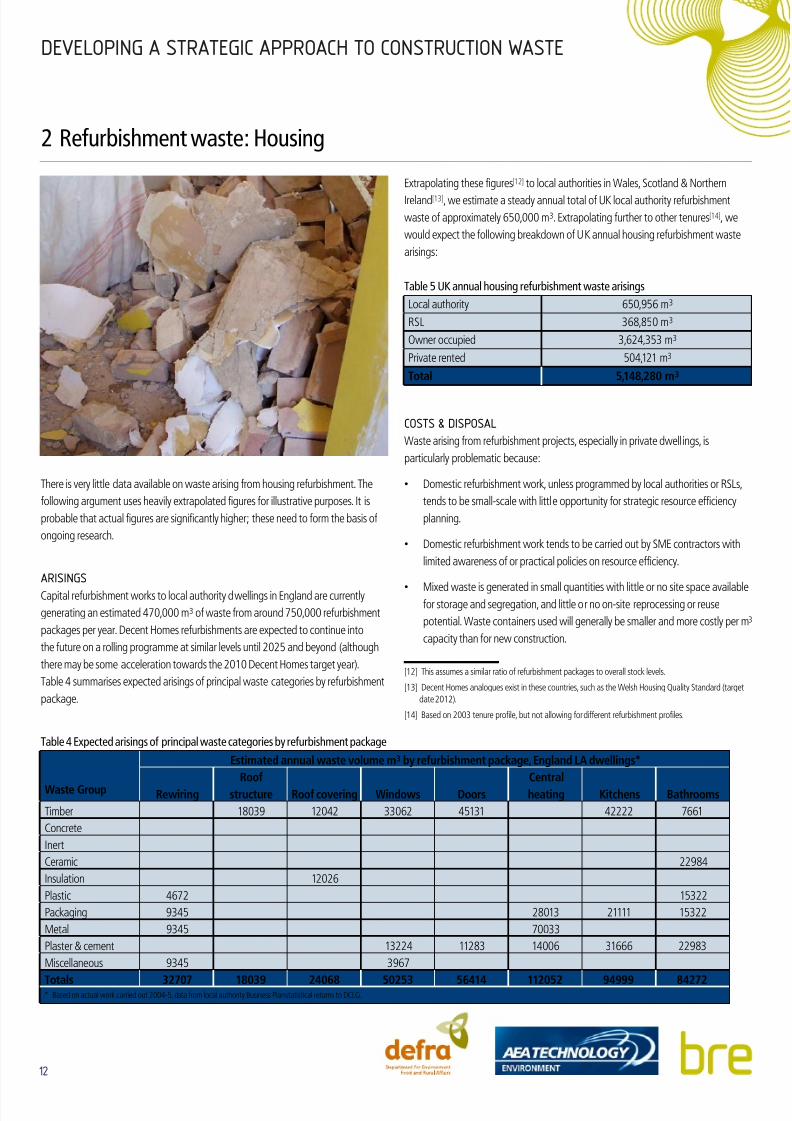
There is very little data available on waste arising from housing refurbishment. The
following argument uses heavily extrapolated figures for illustrative purposes. It is
probable that actual figures are significantly higher; these need to form the basis of
ongoing research.
arisings
Capital refurbishment works to local authority dwellings in England are currently
generating an estimated 470,000 m3 of waste from around 750,000 refurbishment
packages per year. Decent Homes refurbishments are expected to continue into
the future on a rolling programme at similar levels until 2025 and beyond (although
there may be some acceleration towards the 2010 Decent Homes target year).
Table 4 summarises expected arisings of principal waste categories by refurbishment
package.
Extrapolating these figures[12] to local authorities in Wales, Scotland & Northern
Ireland[13], we estimate a steady annual total of UK local authority refurbishment
waste of approximately 650,000 m3. Extrapolating further to other tenures[14], we
would expect the following breakdown of UK annual housing refurbishment waste
arisings:
Table 5 UK annual housing refurbishment waste arisings
Local authority 650,956 m3
RSL 368,850 m3
Owner occupied 3,624,353 m3
Private rented 504,121 m3
Ttal 5,148,280 m3
costs & disposal
Waste arising from refurbishment projects, especially in private dwell ings, is
particularly problematic because:
Domestic refurbishment work, unless programmed by local authorities or RSLs,
tends to be small-scale with little opportunity for strategic resource efficiency
planning.
Domestic refurbishment work tends to be carried out by SME contractors with
limited awareness of or practical policies on resource efficiency.
Mixed waste is generated in small quantities with little or no site space availablefor storage and segregation, and little or no on-site reprocessing or reuse
potential. Waste containers used will generally be smaller and more costly per m3
capacity than for new construction.
[12] This assumes a similar ratio of refurbishment packages to overall stock levels.
[13] Decent Homes analogues exist in these countries, such as the Welsh Housing Quality Standard (target
date 2012).
[14] Based on 2003 tenure profile, but not allowing for different refurbishment profiles.
•
•
•
2 Refurbishment waste: Housing
Table 4 Expected arisings of principal waste categories by refurbishment package
Wast Gp
estmatd annal wast vlm m3 by fbshmnt packag, england LA dwllngs*
rwng
rf
stct rf cvng Wndws Ds
Cntal
hatng Ktchns Bathms
Timber 18039 12042 33062 45131 42222 7661
Concrete
Inert
Ceramic 22984
Insulation 12026
Plastic 4672 15322
Packaging 9345 28013 21111 15322
Metal 9345 70033
Plaster & cement 13224 11283 14006 31666 22983
Miscellaneous 9345 3967
Ttals 32707 18039 24068 50253 56414 112052 94999 84272* Based on actual work carried out 2004-5, data from local authority Business Plan statistical returns to DCLG.

7/29/2019 construction waste
http://slidepdf.com/reader/full/construction-waste 13/22
developing a strategic approach to construction waste
1
A high proportion of waste is believed to consist of composite products with
little or no reclamation value and limited recycling potential. Small volumes
of recyclable materials may be segregated off-site and recycled, but with no
associated financial reward to the contractor.
Skip void space is likely to be higher than for construction waste, given both
the nature of the waste (which will include removed items and assemblies with
built-in voids) and logistics (different waste materials generated at same time, no
intermediate storage available).
These factors will tend to increase the direct costs of waste disposal from
refurbishment compared to that from new construction, and at the same time to limit
towards zero opportunities for on-site segregation. At the same time, the financial
value of materials skipped will be lower than for construction, assuming that 80%
of these are end-of-life materials whose costs have already been apportioned over
their purchase and use. Factoring in the above inefficiencies and material values, we
propose a ‘true cost ’ of £562 per 6.125 m3 skip, broken down as:
Skip hire £150 plus added 20% for increased voids = £180
Labour to fill £163
Cost of new materials in skip (20% by volume) £219
Given the small scale of many refurbishment projects, this figure of £562 may
represent a minimum waste disposal cost. This needs to be established empirically.
carBon dioxide equivalent/emBodied energy
Based on the waste profile for the Decent Homes refurbishment packages above,
it is possible to put a tentative figure on the carbon dioxide impacts represented by
the embodied energy of the waste materials[15]. Each m3 of refurbishment waste
matching this profile is associated with emissions of approximately 750 kg CO2.
Average CO2 impact per refurbishment package is approximately 500 kg.
[15] Figures derived from the BRE Environmental Profiles database
•
•
•
•
•
Baseline for housing refurBishment
Based on the projected refurbishment scenario outlined above, the total annual UK
impacts for domestic refurbishment alone are certain to exceed :
5,148,280 m3 of waste, equivalent to 367,685 tonnes[16] or 840,000 skips
Emissions of 4 million tonnes CO2
Disposal costs of £472 million
A major caveat is that refurbishment drivers in the owner-occupied and private rented
sectors are very different, and the profiles of refurbishment work and waste arisings
will also differ. Extension and renovation works by owner-occupiers will produce
significant quantities of inert, concrete , ceramic, cement and plaster waste not
predicted by the Decent Homes refurbishment pattern. This will affect overall waste
volumes and composition of relative material masses and carbon impacts . This needs
further investigation.
There is a lack of data concerning the recycling and disposal routes for refurbishment
waste; the situation being further complicated by the fact that a significant but
unverifiable proportion of segregation currently takes place off site.
At present, there is insufficient confidence in the baseline data to consider future
options and targets.
end f fbshmnt wast sctn.
S als: rcmmndd actns n Sctn 4.
Vws sght: Plas cmmnt n th assmptns and appach.
Th was nt ngh data t attmpt t st baslns tagts, s
any spptng data/ nfmatn wld b vy wlcm.
[16] Based on the Decent Homes refurbishment profile, and not taking conversion/extension works into
account
•
•
•
7/29/2019 construction waste
http://slidepdf.com/reader/full/construction-waste 14/22
developing a strategic approach to construction waste
1
An estimated 26 million tonnes of demolition materials are produced each year
– please note this is based on best data available and should be used for guidance
only. This is broken down in Table 6 below.
Table 6 Demolition materials
TypAmnt asngs
(tnns)Pcntag Data sc
Hardcore 21 million tonnes 81%NFDC Annual
Returns 20052
Mixed C&D waste 1.7 million tonnes 6.5%NFDC AnnualReturns 2005
Reclaimedmaterials 3.3 million tonnes 12%
BigRec Survey19983
The hardcore material represents materials such as concrete, aggregates, glass,
bricks and blocks. The mixed C&D waste includes materials such as plastics, timber,
composites and will originate largely from soft-strip activities (i .e. the removal
of interior fixtures and fittings ). The reclaimed materials include items such as
architectural and ornamental antiques, reclaimed materials (timber beams andflooring, bricks, tiles, paving and stone walling), salvaged materials (iron and steel
and timber) and antique bathrooms. It should be noted that an update of the BigRec
survey is currently being replicated as part of the this project as anecdotal evidence
suggests that there has been a fall in the amount of materials being reclaimed. No
figures are included for metals as these were unavailable at the time of writing.
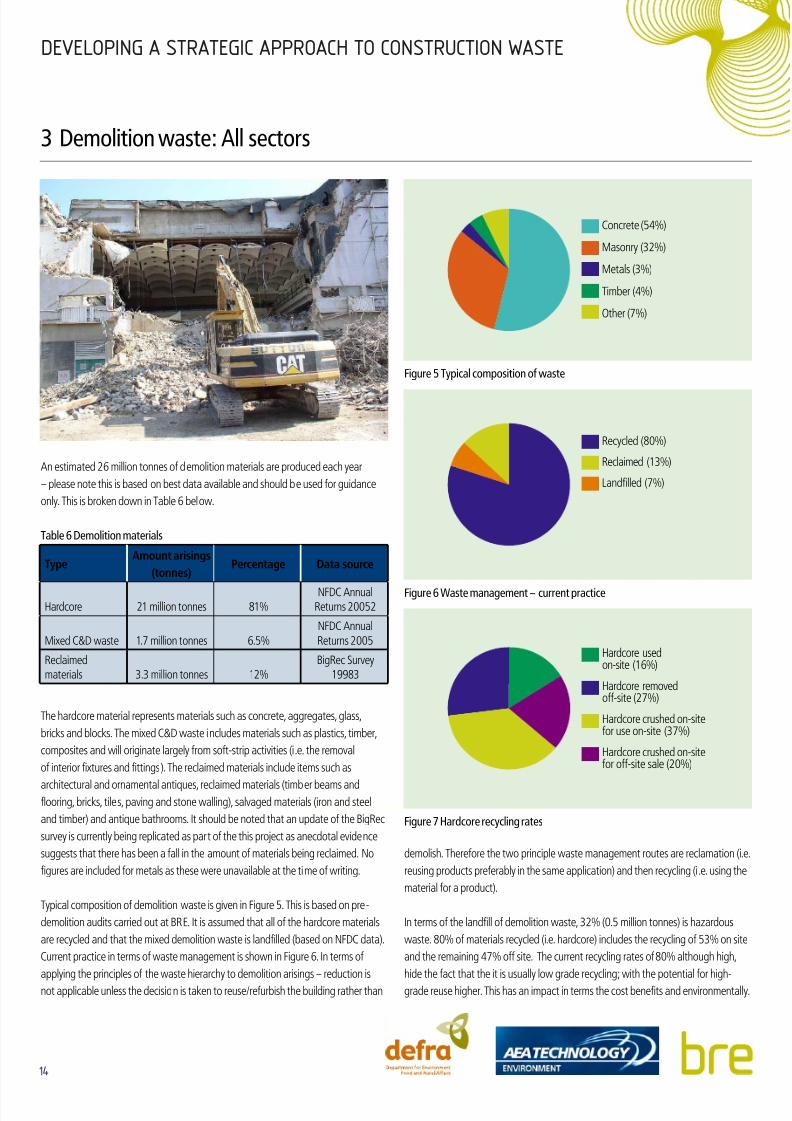
Typical composition of demolition waste is given in Figure 5. This is based on pre-
demolition audits carried out at BRE. It is assumed that all of the hardcore materials
are recycled and that the mixed demolition waste is landfilled (based on NFDC data).
Current practice in terms of waste management is shown in Figure 6. In terms of
applying the principles of the waste hierarchy to demolition arisings – reduction is
not applicable unless the decision is taken to reuse/refurbish the building rather than
demolish. Therefore the two principle waste management routes are reclamation (i.e.
reusing products preferably in the same application) and then recycling (i .e. using the
material for a product).
In terms of the landfill of demolition waste, 32% (0.5 million tonnes) is hazardous
waste. 80% of materials recycled (i.e. hardcore) includes the recycling of 53% on site
and the remaining 47% off site. The current recycling rates of 80% although high,
hide the fact that the it is usually low grade recycling; with the potential for high-
grade reuse higher. This has an impact in terms the cost benefits and environmentally.
3 Demolition waste: All sectors
Other (7%)
Timber (4%)
Metals (3%)
Masonry (32%)
Concrete (54%)
Recycled (80%)
Reclaimed (13%)
Landfilled (7%)
Hardcore usedon-site (16%)
Hardcore removedoff-site (27%)
Hardcore crushed on-sitefor use on-site (37%)
Hardcore crushed on-sitefor off-site sale (20%)
Figure 5 Typical composition of waste
Figure 6 Waste management – current practice
Figure 7 Hardcore recycling rates
7/29/2019 construction waste
http://slidepdf.com/reader/full/construction-waste 15/22
developing a strategic approach to construction waste
1
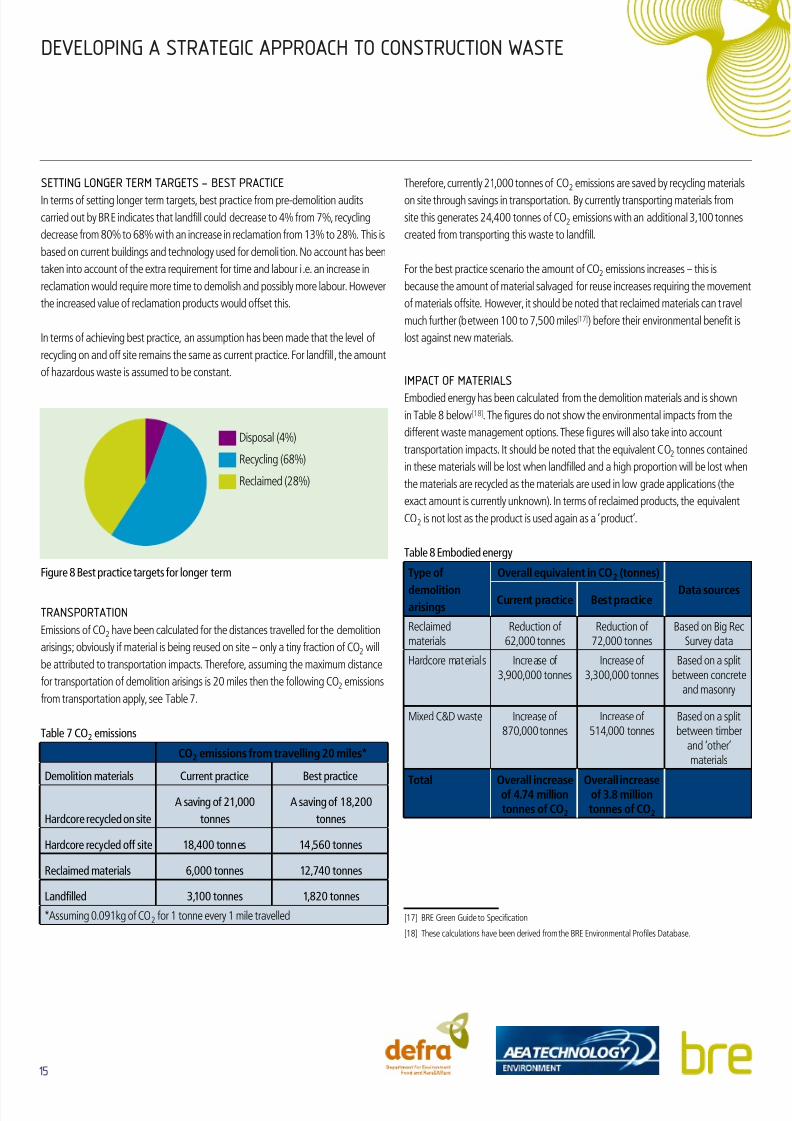
setting longer term targets - Best practice
In terms of setting longer term targets, best practice from pre-demolition audits
carried out by BRE indicates that landfill could decrease to 4% from 7%, recycling
decrease from 80% to 68% with an increase in reclamation from 13% to 28%. This is
based on current buildings and technology used for demoli tion. No account has been
taken into account of the extra requirement for time and labour i .e. an increase in
reclamation would require more time to demolish and possibly more labour. However
the increased value of reclamation products would offset this.
In terms of achieving best practice, an assumption has been made that the level of
recycling on and off site remains the same as current practice. For landfill , the amount
of hazardous waste is assumed to be constant.
transportation
Emissions of CO2 have been calculated for the distances travelled for the demolition
arisings; obviously if material is being reused on site – only a tiny fraction of CO2 will
be attributed to transportation impacts. Therefore, assuming the maximum distance
for transportation of demolition arisings is 20 miles then the following CO2 emissions
from transportation apply, see Table 7.
Table 7 CO2 emissions
Co2 mssns fm tavllng 20 mls*
Demolition materials Current practice Best practice
Hardcore recycled on site
A saving of 21,000
tonnes
A saving of 18,200
tonnes
Hardcore recycled off site 18,400 tonnes 14,560 tonnes
Reclaimed materials 6,000 tonnes 12,740 tonnes
Landfilled 3,100 tonnes 1,820 tonnes
*Assuming 0.091kg of CO2 for 1 tonne every 1 mile travelled
Therefore, currently 21,000 tonnes of CO2 emissions are saved by recycling materials
on site through savings in transportation. By currently transporting materials from
site this generates 24,400 tonnes of CO2 emissions with an additional 3,100 tonnes
created from transporting this waste to landfill.
For the best practice scenario the amount of CO2 emissions increases – this is
because the amount of material salvaged for reuse increases requiring the movement
of materials offsite. However, it should be noted that reclaimed materials can travel
much further (between 100 to 7,500 miles[17]) before their environmental benefit is
lost against new materials.
impact of materials
Embodied energy has been calculated from the demolition materials and is shown
in Table 8 below[18]. The figures do not show the environmental impacts from the
different waste management options. These figures will also take into account
transportation impacts. It should be noted that the equivalent CO2 tonnes contained
in these materials will be lost when landfilled and a high proportion will be lost when
the materials are recycled as the materials are used in low grade applications (the
exact amount is currently unknown). In terms of reclaimed products, the equivalent
CO2 is not lost as the product is used again as a ’product’.
Table 8 Embodied energy
Typ f
dmltnasngs
ovall qvalnt n Co2 (tnns)
Data scsCnt pactc Bst pactc
Reclaimedmaterials
Reduction of 62,000 tonnes
Reduction of 72,000 tonnes
Based on Big RecSurvey data
Hardcore materials Increase of 3,900,000 tonnes
Increase of 3,300,000 tonnes
Based on a splitbetween concrete
and masonry
Mixed C&D waste Increase of 870,000 tonnes
Increase of 514,000 tonnes
Based on a splitbetween timber
and ‘other’materials
Ttal ovall ncasf 4.74 mllntnns f Co2
ovall ncasf 3.8 mllntnns f Co2
[17] BRE Green Guide to Specification
[18] These calculations have been derived from the BRE Environmental Profiles Database.
Disposal (4%)
Recycling (68%)
Reclaimed (28%)
Figure 8 Best practice targets for longer term
7/29/2019 construction waste
http://slidepdf.com/reader/full/construction-waste 16/22

7/29/2019 construction waste
http://slidepdf.com/reader/full/construction-waste 17/22
developing a strategic approach to construction waste
1
Table 10 summarises the immediate actions needed to develop this strategy and associated targets. Table 12 captures actions that could be taken across and within the supply
chain to improve resource efficiency in the short to medium term.
Table 10 Actions to develop strategy
Actns ndd t btt dfn th tagt – CoNSTruCTioN
Generate better Environmental Performance Indicators across the range of construction sectors and building types: amount, composition – volumes and tonnes (some
of this is being developed in the National Benchmarking project). Allocate across the supply chain if possible.
Develop wastage rates for commonly used construction products (actual rather than Laxton approach) and allocate across the supply chain. (Modelling of future waste
impacts for construction products being carried out by MTP)
Annual statistics on the flow of construction products and materials used in the UK (currently being explored in Strategic Approach to Construction Waste project)
Establish a common methodology for true waste costing for construction waste which is compatible with cost methods for refurbishment and demoli tion.
Predictions/modelling of the future costs of resource management related to specific waste types and regional differences e.g. inert , timber recycled, mixed landfill,
hazardous waste.
Establish a common methodology to derive the benefits of resource efficiency, allocate across the supply chain.
Establish robust methodology for predicting waste generation (some of this is being developed in the National Benchmarking project)
Establishing site, company, regional and national waste prevention targets (being explored in Strategic Approach to Construction Waste project)
Quantifying the waste impact of modern methods of construction and/or standardisation across the whole life of the building (being explored in DTI Be Aware Project;
by MTP, BRE – Design for Manufacture & SmartLIFE, WRAP and Envirowise)
Establish a method of carbon accounting for typical construction wastes and work packages, including a methodology for crediting/debiting offsite impacts in addition
to embodied energy impacts, including recycling pathways and disposal impacts
1�
2�
3�
4�
5�
6�
7�
8�
9�
10�
Actns ndd t btt dfn th tagt – reFurBiSHMeNT
Generate better data on housing refurbishment and waste profiles by tenure, and on public and commercial refurbishment by type e.g. shopfit ting, schools, hotels,
offices etc. (some of this is being developed in the National Benchmarking project)
In particular, identify rates and waste impacts of owner-occupier refurbishment and extension/conversion work (some of this will be explored in the DTI TZERO project).
Establish baseline figures for non-capital renewal works including decorating, replacement of guttering etc.
Identify priority patterns of refurbishment waste by work package, type and disposal issues, in order to produce specific guidance for clients, specifiers and contractors.
Establish a common methodology for true waste costing for refurbishment waste which is compatible with cost methods for construction and demoli tion.
Research whole life costing of refurbishment options (currently being explored in Strategic Approach to Construction Waste project)
Establish a method of carbon accounting for typical refurbishment wastes and work packages, including a methodology for crediting/debiting offsite impacts in addition
to embodied energy impacts, including recycling pathways and disposal impacts.
1�
2�
3�
4�
5�
6�
7�
Actns ndd t btt dfn th tagt – DeMoLiTioN
Generate and collect data on the rates of demolition for different sectors and building type enabling future scenario modelling and prediction
Define sector, building and material type Environmental Performance Indicators for demolition to establish baseline figures and set appropriate targets (some of this is
being developed in the National Benchmarking project)
Gain a better understanding of the composition of demolition waste for products and materials by establishing a common data methodology and collection process
(some of this is being developed in the National Benchmarking project)
Collect data on the types of materials that arise from different demolition processes i.e. bulk materials versus actual products
Establish a better data set for routes for demolition waste and the associated costs including revenue versus cost of different options (especially relevant for
deconstruction versus demolition); include transportation costs
Establish a mechanism/tool for calculating the whole life costs for demoli tion waste and prediction of future costs
Collect data on the actual environmental impacts of the demolition process and subsequent waste management routes (including transportation) to establish a life cycle
assessment tool to help with the decision making process.
Use the data identified above to establish a method for carbon accounting for demolition waste including a methodology for crediting/debiting offsite impacts in
addition to embodied energy impacts, including recycling pathways and disposal impacts
1�
2�
3�
4�
5�
6�
7�
8�
4 Modelling the way to achieving the strategy and targets – actions

7/29/2019 construction waste
http://slidepdf.com/reader/full/construction-waste 18/22
developing a strategic approach to construction waste
1
Table 12 Actions that could be taken across and within the supply chain to improve resource efficiency in the short to medium term.
Actns ndd acss th spply chan – CoNSTruCTioN
Designing out waste manual that relates to product selection and wastage, whole life costing, optimal use of MMC & standardisation, and design for deconstruction
(links to work areas of Envirowise, WRAP, MTP and DTI Be Aware project).
Case studies and guidance that clearly and consistent ly define the business case and oppor tunities for resource efficiency (links to work areas of Envirowise, WRAP and
RDAs)
Site waste management plans to include waste prevention targets and a system of collecting data from them (links to work areas of Envirowise, WRAP, RDAs, EA and
BRE’s SMARTWaste)
Explore use of enhanced capital allowances to promote construction resource efficiency
Quantifying the effects of different types of contracts and procurement on resource efficiency, also exploring the use of incentives and penalties to reach targets (links to
work areas of Envirowise and WRAP)
Greater use of consolidation centres to maximise resource use, minimise over-ordering and surplus materials (links to work areas of Envirowise and WRAP)
Producer responsibility – voluntary agreements with manufacturers and other stakeholders that are based upon reducing the life cycle resource impacts of products (links
to work areas of MTP and DTI Be Aware project)
Promote compliance with Duty of Care – certification of resource management sites (possibly leading to a BREEAM type system for transfer stations), provision of
recycling facilities for SMEs at Household Waste Recycling Centres (links to work areas of BRE Certification , EA, WRAP and RDAs)
Local collections or milk rounds for surplus products and materials, with resulting local supplies of small/part packages of products/low impact materials – possibly with
community sector but health and safety risks would need to be mitigated.
Changing culture and raising awareness – develop consistent and linked training packages, from on-site induction to various professions, from school through to relevant
vocational and higher educational courses (links to DfES programme, CITB, BRE, CIRIA, RDA, WRAP and Envirowise activities)
Quantification of material resource efficiency potential through adopting lean construction techniques (links to CLIP and Envirowise)
1�
2�
3�
4�
5�
6�
7�
8�
9�
10�
11�
7/29/2019 construction waste
http://slidepdf.com/reader/full/construction-waste 19/22
developing a strategic approach to construction waste
1
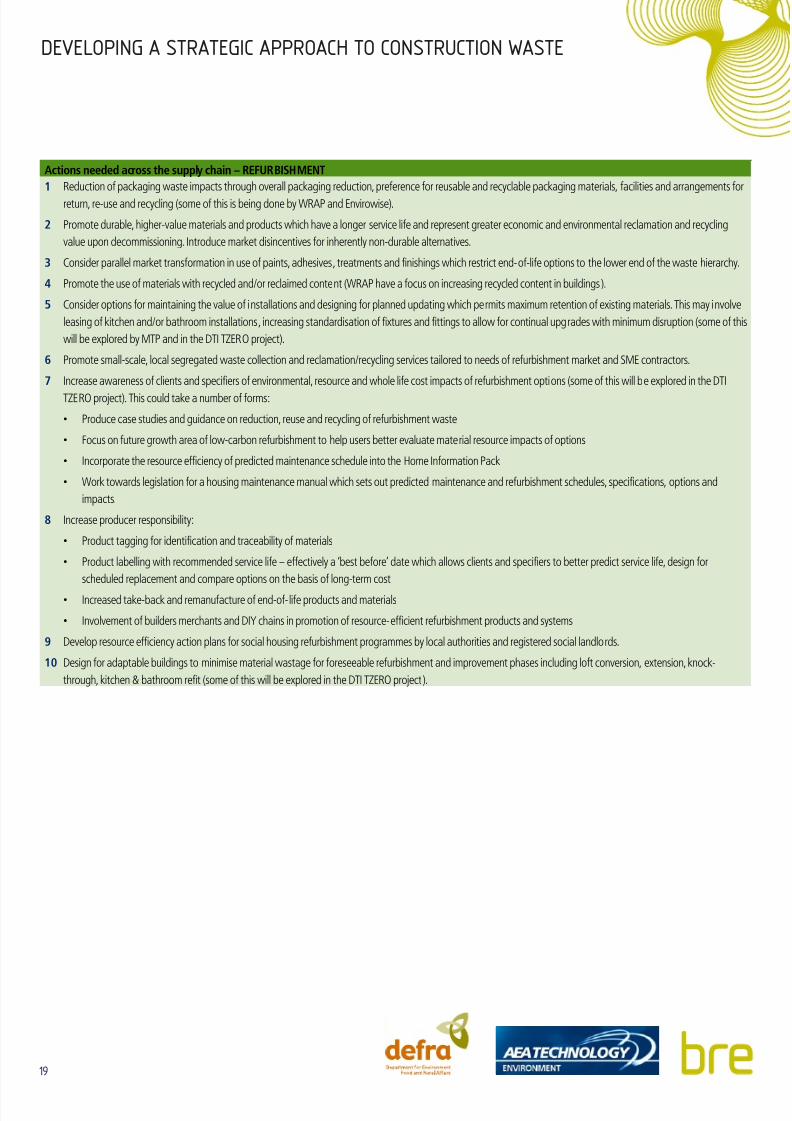
Actns ndd acss th spply chan – reFurBiSHMeNT
Reduction of packaging waste impacts through overall packaging reduction, preference for reusable and recyclable packaging materials, facilities and arrangements for
return, re-use and recycling (some of this is being done by WRAP and Envirowise).
Promote durable, higher-value materials and products which have a longer service life and represent greater economic and environmental reclamation and recycling
value upon decommissioning. Introduce market disincentives for inherently non-durable alternatives.
Consider parallel market transformation in use of paints, adhesives , treatments and finishings which restrict end-of-life options to the lower end of the waste hierarchy.
Promote the use of materials with recycled and/or reclaimed content (WRAP have a focus on increasing recycled content in buildings ).
Consider options for maintaining the value of installations and designing for planned updating which permits maximum retention of existing materials. This may involve
leasing of kitchen and/or bathroom installations , increasing standardisation of fixtures and fittings to allow for continual upgrades with minimum disruption (some of this
will be explored by MTP and in the DTI TZERO project).
Promote small-scale, local segregated waste collection and reclamation/recycling services tailored to needs of refurbishment market and SME contractors.
Increase awareness of clients and specifiers of environmental, resource and whole life cost impacts of refurbishment options (some of this will be explored in the DTI
TZERO project). This could take a number of forms:
Produce case studies and guidance on reduction, reuse and recycling of refurbishment waste
Focus on future growth area of low-carbon refurbishment to help users better evaluate material resource impacts of options
Incorporate the resource efficiency of predicted maintenance schedule into the Home Information Pack
Work towards legislation for a housing maintenance manual which sets out predicted maintenance and refurbishment schedules, specifications, options and
impacts.
Increase producer responsibility:
Product tagging for identification and traceability of materials
Product labelling with recommended service life – effectively a ‘best before’ date which allows clients and specifiers to better predict service life, design for
scheduled replacement and compare options on the basis of long-term cost
Increased take-back and remanufacture of end-of- life products and materials
Involvement of builders merchants and DIY chains in promotion of resource-efficient refurbishment products and systems
Develop resource efficiency action plans for social housing refurbishment programmes by local authorities and registered social landlords.
Design for adaptable buildings to minimise material wastage for foreseeable refurbishment and improvement phases including loft conversion, extension, knock-
through, kitchen & bathroom refit (some of this will be explored in the DTI TZERO project).
1�
2�
3�
4�
5�
6�
7�
•
•
•
•
8�
•
•
•
•
9�
10�

7/29/2019 construction waste
http://slidepdf.com/reader/full/construction-waste 20/22
developing a strategic approach to construction waste
20
Actns ndd acss th spply chan – DeMoLiTioN
Ensure the usage of Site Waste Management Plans for demolition projects including the setting of appropriate targets for recovery ; include a mechanism for analysis of
these datasets (some of this work is being done by WRAP and Envirowise)
Requirement of pre-demolition audits to ensure the potential for the reclamation and recycling of products/materials is identified and then realised.
Mapping of demolition activities in relation to new build activities and waste management facilities (including reclamation) to enable a resource planning tool to be
implemented e.g. through the use of BREMAP (a geographical information system which currently maps waste facilities)
Increased linkage to the community sector through reuse and recycling schemes (links to Community Recycling Network and RDAs)
More emphasis on the disassembly and deconstruction of buildings to achieve higher levels of reclamation including:
Research and development into technologies that aid deconstruction and the associated increased value of materials e.g. the use of remote controlled robotics,
microwave technology, laser technology and other suitable technologies
Design buildings for future reuse and recycling by using techniques that aid deconstruction .e.g . lime mortar, simplified fixing systems and use products/materials
which aid this with the avoidance of hazardous materials
Provide information including ‘as build’ drawings and maintenance logs including identification of components and materials and associated points for disassemblyDevelop the skill base for deconstruction and ensure adequate training
Work with designers and architects to encourage the flexib le use and adaptation of property at a minimal future cost and maximise the lifespan of buildings .
In terms of supporting higher levels of reclamation the following actions are recommended:
Stimulate the reclamation market through increased access to products which are cost effective, available , aesthetically pleasing and perform technically.
Assess the potential for incentives the use of reclaimed materials e.g . lower VAT
Recognised training and accreditation programmes for the reclamation sector to ensure access on demolition sites (l inks to, CITB, NFDC and SALVO)
Provide certification, building codes and specifications for reclaimed materials
Provision of localised storage centres for reclaimed materials for the short term and possibly longer term i.e. storage of key demoli tion products to aid procurement
options and logistical requirement
Develop alternative markets for demoli tion arisings – particularly related to products that are being used currently which may prove difficult to recover ( some of this work
is being done by WRAP)
Investigate new treatment technologies for hazardous waste arising from demolition activities (some of this work is being done by DEFRA)
Provide a better linkage between the demolition and new build phases of the project through planning requirements and project management i .e. through the use of
tools such as pre-demolition audits, ICE demolition protocol and SWMPs (links to work being carried out by WRAP)
Promote the positive image of both the demolition and the reclamation sectors (links to NFDC, IDE and SALVO)
Provision of guidance, best practice case studies to inform the supply chain in terms of the cost and environmental benefits and technical requirements for using
reclaimed and recycled materials from demolition (some of this work is being done by WRAP).
1�
2�
3�
4�
5�
•
•
••
6�
7�
•
•
•
•
•
8�
9�
10�
11�
12�
Industry and other stakeholder views are very important to developing the strategy. As detailed at the beginning of this document, please send inyour views and comments by 10 Nvmb 2006. We will also be organising several workshops to capture industry views, please email or phoneif you would like to attend one of these workshops.
Vws sght: Ths actns wll b fnd and fth actns addd thgh ths cnsltatn and asscatd wkshps. it s als lkly that
lnks t xstng wk hav bn mssd. Any cmmnts n th actns lstd, addtnal actns mssd lnks wll b vy wlcm.
Contact details for consultation responses:Gilli HobbsBRE, Garston, Watford WD25 9XXT: +44 (0) 1923 664856E: [email protected]
7/29/2019 construction waste
http://slidepdf.com/reader/full/construction-waste 21/22
developing a strategic approach to construction waste
21
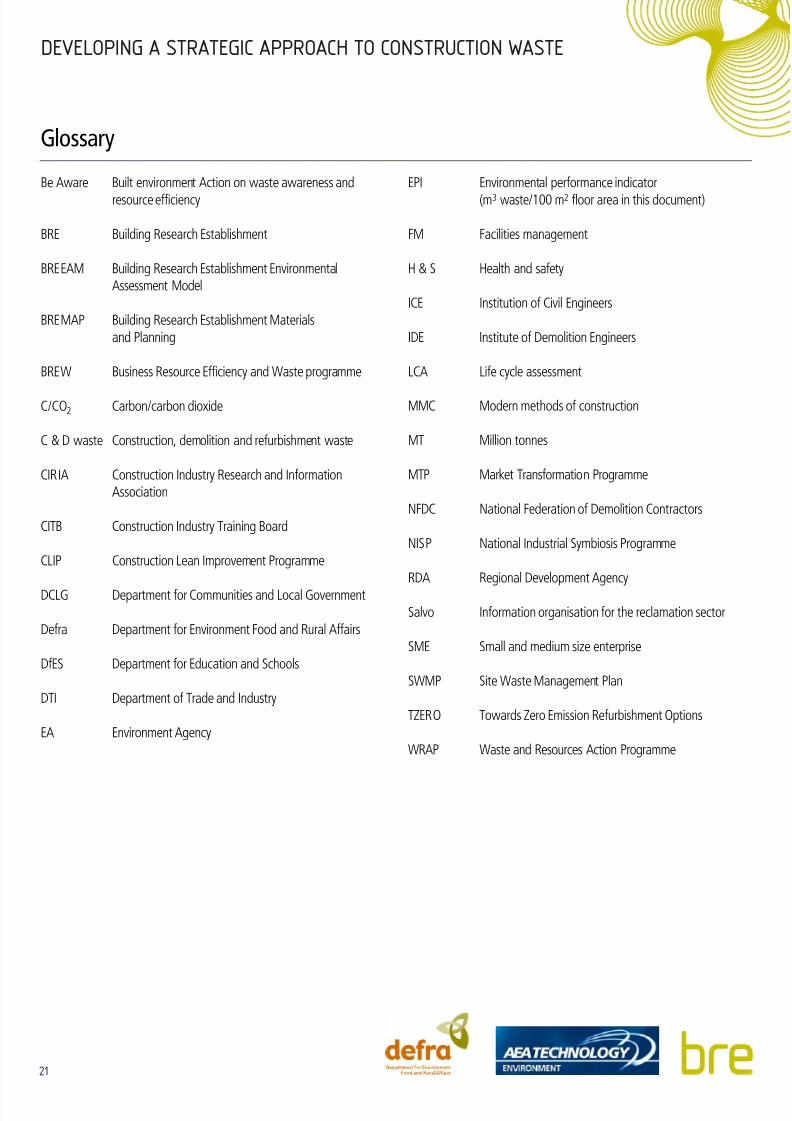
Glossary
Be Aware Built environment Action on waste awareness and
resource efficiency
BRE Building Research Establishment
BREEAM Building Research Establishment EnvironmentalAssessment Model
BREMAP Building Research Establishment Materialsand Planning
BREW Business Resource Efficiency and Waste programme
C/CO2 Carbon/carbon dioxide
C & D waste Construction, demolition and refurbishment waste
CIR IA Construction Industry Research and InformationAssociation
CITB Construction Industry Training Board
CLIP Construction Lean Improvement Programme
DCLG Department for Communities and Local Government
Defra Department for Environment Food and Rural Affairs
DfES Department for Education and Schools
DTI Department of Trade and Industry
EA Environment Agency
EPI Environmental performance indicator
(m3 waste/100 m2 floor area in this document)
FM Facilities management
H & S Health and safety
ICE Institution of Civil Engineers
IDE Institute of Demolition Engineers
LCA Life cycle assessment
MMC Modern methods of construction
MT Million tonnes
MTP Market Transformation Programme
NFDC National Federation of Demolition Contractors
NISP National Industrial Symbiosis Programme
RDA Regional Development Agency
Salvo Information organisation for the reclamation sector
SME Small and medium size enterprise
SWMP Site Waste Management Plan
TZERO Towards Zero Emission Refurbishment Options
WRAP Waste and Resources Action Programme

7/29/2019 construction waste
http://slidepdf.com/reader/full/construction-waste 22/22
Contact details for consultation responses:Gilli HobbsBRE, Garston, Watford WD25 9XX
T: +44 (0) 1923 664856E: [email protected]