Embed Size (px)
Citation preview
Sether, Berkas, and Vecchia–Constituent Loads and Flow-W
eighted Average Concentrations for M
ajor Subbasins of the U
pper Red River of the North B
asin, 1997-99–Scientific Investigations Report 2004–5200
In cooperation with the North Dakota Department of Health, Minnesota Pollution Control Agency, Red River Joint Water Resource Board, and Red River Watershed Management Board
Constituent Loads and Flow-Weighted Average Concentrations for Major Subbasins of the Upper Red River of the North Basin, 1997-99
Scientific Investigations Report 2004–5200
U.S. Department of the InteriorU.S. Geological SurveyPrinted on recycled paper
97˚00' 96˚30'
46˚30'
47˚00'
75
81
81
1010
75
59
94
94
29
29
210
108
18
46
18
18
27
11 11 55
13
9
9
9
32
113
Creek
Creek
Creek
Creek
Whiskey
Creek
Stony
Deerhorn
Creek
Wolverton
Whiskey
Antelope
Wild
Rice
River
River
River River
Riv
erP
elic
an
R.
Rabbit
Otter TailBois D
e Sioux
River
River
River
LowerRush
R.
Br.
River River
RiverR
ED
RIV
ER
OF
THE
NORTH
RiverBuffalo
Buffalo
Wild
Wild
SouthBranch
Rice
Rice
Elm
South Elm R.
Rush
Maple
Sheyenne
SouthB
ranch
Mapleton
FARGO MoorheadWestFargo
Harwood
HoraceWild Rice
Hickson
Abercrombie
Wahpeton Breckenridge
Barnesville
Doran
FergusFalls
Georgetown
Perley
CASS CO.
CASS CO.
RICHLAND CO.
RANSOM CO.
RANSOM CO.
CLAY CO.
CLAY CO. BECKER CO.NORMAN CO.
WILKIN CO.
WIL
KIN
CO
.
OT
TE
R T
AIL
CO
.
OTTER TAIL CO.
GRANT CO.
SARGENT CO.
TRAILL CO.
11
10
98
7
6
5
4
1
3
2

Constituent Loads and Flow-Weighted Average Concentrations for Major Subbasins of the Upper Red River of the North Basin, 1997-99
By Bradley A. Sether, W. R. Berkas, and A. V. Vecchia
U.S. Department of the Interior U.S. Geological Survey
In cooperation with the North Dakota Department of Health, Minnesota Pollution Control Agency, Red River Joint Water Resource Board, and Red River Watershed Management Board
Scientific Investigations Report 2004–5200

U.S. Department of the InteriorGale A. Norton, Secretary
U.S. Geological SurveyCharles G. Groat, Director
U.S. Geological Survey, Reston, Virginia: 2004
For sale by U.S. Geological Survey, Information Services Box 25286, Denver Federal Center Denver, CO 80225
For more information about the USGS and its products: Telephone: 1-888-ASK-USGS World Wide Web: http://www.usgs.gov/
Any use of trade, product, or firm names in this publication is for descriptive purposes only and does not imply endorsement by the U.S. Government.
Although this report is in the public domain, permission must be secured from the individual copyright owners to reproduce any copyrighted materials contained within this report.

iii
Contents
Abstract. . . . . . . . . . . . . . . . . . . . . . . . . . . . . . . . . . . . . . . . . . . . . . . . . . . . . . . . . . . . . . . . . . . . . . . . . . . . . . . . . . . . . . . . . . . . . . . . . . . . . 1Introduction . . . . . . . . . . . . . . . . . . . . . . . . . . . . . . . . . . . . . . . . . . . . . . . . . . . . . . . . . . . . . . . . . . . . . . . . . . . . . . . . . . . . . . . . . . . . . . . . . 2
Purpose and scope . . . . . . . . . . . . . . . . . . . . . . . . . . . . . . . . . . . . . . . . . . . . . . . . . . . . . . . . . . . . . . . . . . . . . . . . . . . . . . . . . . . 2Description of Red River of the North Basin. . . . . . . . . . . . . . . . . . . . . . . . . . . . . . . . . . . . . . . . . . . . . . . . . . . . . . . . . . . . 2Study design . . . . . . . . . . . . . . . . . . . . . . . . . . . . . . . . . . . . . . . . . . . . . . . . . . . . . . . . . . . . . . . . . . . . . . . . . . . . . . . . . . . . . . . . . . 6Methods. . . . . . . . . . . . . . . . . . . . . . . . . . . . . . . . . . . . . . . . . . . . . . . . . . . . . . . . . . . . . . . . . . . . . . . . . . . . . . . . . . . . . . . . . . . . . . 6
Sample collection and analysis . . . . . . . . . . . . . . . . . . . . . . . . . . . . . . . . . . . . . . . . . . . . . . . . . . . . . . . . . . . . . . . . . . 6Load computation . . . . . . . . . . . . . . . . . . . . . . . . . . . . . . . . . . . . . . . . . . . . . . . . . . . . . . . . . . . . . . . . . . . . . . . . . . . . . . . 9
Water-quality characteristics. . . . . . . . . . . . . . . . . . . . . . . . . . . . . . . . . . . . . . . . . . . . . . . . . . . . . . . . . . . . . . . . . . . . . . . . . . . . . . . 10Biochemical oxygen demand . . . . . . . . . . . . . . . . . . . . . . . . . . . . . . . . . . . . . . . . . . . . . . . . . . . . . . . . . . . . . . . . . . . . . . . . 10Bacteria . . . . . . . . . . . . . . . . . . . . . . . . . . . . . . . . . . . . . . . . . . . . . . . . . . . . . . . . . . . . . . . . . . . . . . . . . . . . . . . . . . . . . . . . . . . . . 10Dissolved solids. . . . . . . . . . . . . . . . . . . . . . . . . . . . . . . . . . . . . . . . . . . . . . . . . . . . . . . . . . . . . . . . . . . . . . . . . . . . . . . . . . . . . . 11Nutrients. . . . . . . . . . . . . . . . . . . . . . . . . . . . . . . . . . . . . . . . . . . . . . . . . . . . . . . . . . . . . . . . . . . . . . . . . . . . . . . . . . . . . . . . . . . . . 12
Nitrogen. . . . . . . . . . . . . . . . . . . . . . . . . . . . . . . . . . . . . . . . . . . . . . . . . . . . . . . . . . . . . . . . . . . . . . . . . . . . . . . . . . . . . . . . 13Phosphorus . . . . . . . . . . . . . . . . . . . . . . . . . . . . . . . . . . . . . . . . . . . . . . . . . . . . . . . . . . . . . . . . . . . . . . . . . . . . . . . . . . . . 17
Suspended sediment. . . . . . . . . . . . . . . . . . . . . . . . . . . . . . . . . . . . . . . . . . . . . . . . . . . . . . . . . . . . . . . . . . . . . . . . . . . . . . . . . 18Constituent loads and flow-weighted average concentrations. . . . . . . . . . . . . . . . . . . . . . . . . . . . . . . . . . . . . . . . . . . . . . 19
Dissolved solids. . . . . . . . . . . . . . . . . . . . . . . . . . . . . . . . . . . . . . . . . . . . . . . . . . . . . . . . . . . . . . . . . . . . . . . . . . . . . . . . . . . . . . 28Nutrients. . . . . . . . . . . . . . . . . . . . . . . . . . . . . . . . . . . . . . . . . . . . . . . . . . . . . . . . . . . . . . . . . . . . . . . . . . . . . . . . . . . . . . . . . . . . . 29
Nitrogen. . . . . . . . . . . . . . . . . . . . . . . . . . . . . . . . . . . . . . . . . . . . . . . . . . . . . . . . . . . . . . . . . . . . . . . . . . . . . . . . . . . . . . . . 29Total nitrite plus nitrate . . . . . . . . . . . . . . . . . . . . . . . . . . . . . . . . . . . . . . . . . . . . . . . . . . . . . . . . . . . . . . . . . . . . 29Total ammonia . . . . . . . . . . . . . . . . . . . . . . . . . . . . . . . . . . . . . . . . . . . . . . . . . . . . . . . . . . . . . . . . . . . . . . . . . . . . 30Total organic nitrogen. . . . . . . . . . . . . . . . . . . . . . . . . . . . . . . . . . . . . . . . . . . . . . . . . . . . . . . . . . . . . . . . . . . . . 31Total nitrogen . . . . . . . . . . . . . . . . . . . . . . . . . . . . . . . . . . . . . . . . . . . . . . . . . . . . . . . . . . . . . . . . . . . . . . . . . . . . . 31
Phosphorus . . . . . . . . . . . . . . . . . . . . . . . . . . . . . . . . . . . . . . . . . . . . . . . . . . . . . . . . . . . . . . . . . . . . . . . . . . . . . . . . . . . . 33Total phosphorus. . . . . . . . . . . . . . . . . . . . . . . . . . . . . . . . . . . . . . . . . . . . . . . . . . . . . . . . . . . . . . . . . . . . . . . . . . 33Dissolved phosphorus . . . . . . . . . . . . . . . . . . . . . . . . . . . . . . . . . . . . . . . . . . . . . . . . . . . . . . . . . . . . . . . . . . . . 34
Suspended sediment. . . . . . . . . . . . . . . . . . . . . . . . . . . . . . . . . . . . . . . . . . . . . . . . . . . . . . . . . . . . . . . . . . . . . . . . . . . . . . . . . 35Summary. . . . . . . . . . . . . . . . . . . . . . . . . . . . . . . . . . . . . . . . . . . . . . . . . . . . . . . . . . . . . . . . . . . . . . . . . . . . . . . . . . . . . . . . . . . . . . . . . . . 36References. . . . . . . . . . . . . . . . . . . . . . . . . . . . . . . . . . . . . . . . . . . . . . . . . . . . . . . . . . . . . . . . . . . . . . . . . . . . . . . . . . . . . . . . . . . . . . . . . 38Appendix 1. Regression models for daily concentration and uncertainty in estimated annual
loads. . . . . . . . . . . . . . . . . . . . . . . . . . . . . . . . . . . . . . . . . . . . . . . . . . . . . . . . . . . . . . . . . . . . . . . . . . . . . . . . . . . . . . . . . . . . . . 41Table 1-1. Results of regression analysis for historical constituent concentrations
and daily loads. . . . . . . . . . . . . . . . . . . . . . . . . . . . . . . . . . . . . . . . . . . . . . . . . . . . . . . . . . . . . . . . . . . . . . . . . . . . . . . 43Table 1-2. Estimated annual dissolved-solids loads and flow-weighted average
concentrations for the upper Red River of the North Basin . . . . . . . . . . . . . . . . . . . . . . . . . . . . . . . . . . . 47Table 1-3. Estimated annual total nitrite plus nitrate loads and flow-weighted average
concentrations for the upper Red River of the North Basin . . . . . . . . . . . . . . . . . . . . . . . . . . . . . . . . . . . 49Table 1-4. Estimated annual total ammonia loads and flow-weighted average
concentrations for the upper Red River of the North Basin . . . . . . . . . . . . . . . . . . . . . . . . . . . . . . . . . . . 51Table 1-5. Estimated annual total organic nitrogen loads and flow-weighted average
concentrations for the upper Red River of the North Basin . . . . . . . . . . . . . . . . . . . . . . . . . . . . . . . . . . . 53

iv
Contents, Continued
Table 1-6. Estimated annual total nitrogen loads and flow-weighted average concentrations for the upper Red River of the North Basin . . . . . . . . . . . . . . . . . . . . . . . . . . . . . . . . . . . 55
Table 1-7. Estimated annual total phosphorus loads and flow-weighted average concentrations for the upper Red River of the North Basin . . . . . . . . . . . . . . . . . . . . . . . . . . . . . . . . . . . 57
Table 1-8. Estimated annual dissolved phosphorus loads and flow-weighted average concentrations for the upper Red River of the North Basin . . . . . . . . . . . . . . . . . . . . . . . . . . 59
Table 1-9. Estimated annual suspended-sediment loads and flow-weighted average concentrations for the upper Red River of the North Basin . . . . . . . . . . . . . . . . . . . . . . . . . . 61
Figures
1. Map showing location of study area, locations of water-quality sampling sites, land use and land cover, and physiographic areas in the Red River of the North Basin. . . . . . . . . . . . . . . . . . . . . . . . . . . . . . . . . . . . . . . . . . . . . . . . . . . . . . . . . . . . . . . . . . . . . . . . . . . . . . . . . . . . . . . . . . . . . . .3
2. Map showing mean annual precipitation and streamflow in the Red River of the North Basin. . . . . . . . . . . . . . . . . . . . . . . . . . . . . . . . . . . . . . . . . . . . . . . . . . . . . . . . . . . . . . . . . . . . . . . . . . . . . . . . . . . . .5
3. Diagram showing sample-collection timelines for water-quality sampling sites used in study . . . . . . . . . . . . . . . . . . . . . . . . . . . . . . . . . . . . . . . . . . . . . . . . . . . . . . . . . . . . . . . . . . . . . . . . . . . . . . . . . . . . . . .8
4. Graph showing distribution of 5-day biochemical oxygen demand in the upper Red River of the North Basin during May 1997 through September 1999. . . . . . . . . . . . . . . . . . . . . . . . . . . 10
5. Graph showing distribution of fecal coliform in the upper Red River of the North Basin during May 1997 through September 1999. . . . . . . . . . . . . . . . . . . . . . . . . . . . . . . . . . . . . . . . . . . . . . . . . . 11
6. Graph showing distribution of fecal streptococci in the upper Red River of the North Basin during May 1997 through September 1999 . . . . . . . . . . . . . . . . . . . . . . . . . . . . . . . . . . . . . . . . . . . 12
7. Graph showing distribution of dissolved solids in the upper Red River of the North Basin during May 1997 through September 1999. . . . . . . . . . . . . . . . . . . . . . . . . . . . . . . . . . . . . . . . . . . . . . . . . . 13
8. Diagram showing movement of nutrients from subbasins of the Red River of the North Basin . . . . . . . . . . . . . . . . . . . . . . . . . . . . . . . . . . . . . . . . . . . . . . . . . . . . . . . . . . . . . . . . . . . . . . . . . . . . . . . . . . . . . . 14
9. Map showing nitrogen fertilizer applications by county in North Dakota, Minnesota, and South Dakota during 1991 . . . . . . . . . . . . . . . . . . . . . . . . . . . . . . . . . . . . . . . . . . . . . . . . . . . . . . . . . . . . . . . . . . . . 15
10. Graph showing distribution of total nitrite plus nitrate in the upper Red River of the North Basin during May 1997 through September 1999 . . . . . . . . . . . . . . . . . . . . . . . . . . . . . . . . . . . . . . . . . . . 16
11. Graph showing distribution of total ammonia in the upper Red River of the North Basin during May 1997 through September 1999. . . . . . . . . . . . . . . . . . . . . . . . . . . . . . . . . . . . . . . . . . . . . . . . . . 17
12. Graph showing distribution of total organic nitrogen in the upper Red River of the North Basin during May 1997 through September 1999 . . . . . . . . . . . . . . . . . . . . . . . . . . . . . . . . . . . . . . . . . . . 18
13. Graph showing distribution of total nitrogen in the upper Red River of the North Basin during May 1997 through September 1999. . . . . . . . . . . . . . . . . . . . . . . . . . . . . . . . . . . . . . . . . . . . . . . . . . 19
14. Graph showing distribution of total phosphorus in the upper Red River of the North Basin during May 1997 through September 1999. . . . . . . . . . . . . . . . . . . . . . . . . . . . . . . . . . . . . . . . . . . . . . . . . . 20
15. Graph showing distribution of dissolved phosphorus in the upper Red River of the North Basin during May 1997 through September 1999 . . . . . . . . . . . . . . . . . . . . . . . . . . . . . . . . . . . . . . . . . . . 21
16. Graph showing distribution of suspended sediment in the upper Red River of the North Basin during May 1994 through September 1999 . . . . . . . . . . . . . . . . . . . . . . . . . . . . . . . . . . . . . . . . . . . 22
17. Map showing disjoint subbasins used to compute estimated annual loads. . . . . . . . . . . . . . . . . . . . . . . . 2318. Graph showing mean daily streamflow for the Red River of the North at Fargo,
North Dakota, streamflow-gaging station for water years 1997, 1998, and 1999 . . . . . . . . . . . . . . . . . . . . 24

v
Figures, Continued
19. Graph showing mean daily streamflow for the Sheyenne River at West Fargo, North Dakota, streamflow-gaging station for water years 1997, 1998, and 1999 . . . . . . . . . . . . . . . . . . . . 25
20. Graphs showing estimated annual dissolved-solids loads and flow-weighted average concentrations for 1998-99 (loads not shown for main-stem sites). . . . . . . . . . . . . . . . . . . . . . . . 28
21. Graphs showing estimated annual total nitrite plus nitrate loads and flow-weighted average concentrations for 1998-99 (loads not shown for main-stem sites). . . . . . . . . . . . . . . . . . . . . . . . 29
22. Graphs showing estimated annual total ammonia loads and flow-weighted average concentrations for 1998-99 (loads not shown for main-stem sites). . . . . . . . . . . . . . . . . . . . . . . . . . . . . . . . . 30
23. Graphs showing estimated annual total organic nitrogen loads and flow-weighted average concentrations for 1998-99 (loads not shown for main-stem sites). . . . . . . . . . . . . . . . . . . . . . . . 31
24. Graphs showing estimated annual total nitrogen loads and flow-weighted average concentrations for 1998-99 (loads not shown for main-stem sites). . . . . . . . . . . . . . . . . . . . . . . . . . . . . . . . . 32
25. Graphs showing estimated annual total phosphorus loads and flow-weighted average concentrations for 1998-99 (loads not shown for main-stem sites). . . . . . . . . . . . . . . . . . . . . . . . 33
26. Graphs showing estimated annual dissolved phosphorus loads and flow-weighted average concentrations for 1998-99 (loads not shown for main-stem sites). . . . . . . . . . . . . . . . . . . . . . . . 34
27. Graphs showing estimated annual suspended-sediment loads and flow-weighted average concentrations for 1998-99 (loads not shown for main-stem sites). . . . . . . . . . . . . . . . . . . . . . . . 35
Tables
1. Water-quality sampling sites used in study . . . . . . . . . . . . . . . . . . . . . . . . . . . . . . . . . . . . . . . . . . . . . . . . . . . . . . . . .42. Water-quality properties and constituents for which water samples were
analyzed . . . . . . . . . . . . . . . . . . . . . . . . . . . . . . . . . . . . . . . . . . . . . . . . . . . . . . . . . . . . . . . . . . . . . . . . . . . . . . . . . . . . . . . . . . .73. Annual streamflows and yields in the upper Red River of the North Basin for
water years 1998 and 1999. . . . . . . . . . . . . . . . . . . . . . . . . . . . . . . . . . . . . . . . . . . . . . . . . . . . . . . . . . . . . . . . . . . . . . . . 26

Constituent Loads and Flow-Weighted Average Concentrations for Major Subbasins of the Upper Red River of the North Basin, 1997-99
By Bradley A. Sether, W. R. Berkas, and A. V. Vecchia
Abstract
Data were collected at 11 water-quality sampling sites in the upper Red River of the North (Red River) Basin from May 1997 through September 1999 to describe the water-quality characteristics of the upper Red River and to estimate constitu-ent loads and flow-weighted average concentrations for major tributaries of the Red River upstream from the bridge crossing the Red River at Perley, Minn. Samples collected from the sites were analyzed for 5-day biochemical oxygen demand, bacteria, dissolved solids, nutrients, and suspended sediment.
Concentration data indicated the median concentrations for most constituents and sampling sites during the study period were less than existing North Dakota and Minnesota standards or guidelines. However, more than 25 percent of the samples for the Red River at Perley, Minn., site had fecal coliform concen-trations that were greater than 200 colonies per 100 milliliters, indicating an abundance of pathogens in the upper Red River Basin. Although total nitrite plus nitrate concentrations gener-ally increased in a downstream direction, the median concentra-tions for all sites were less than the North Dakota suggested guideline of 1.0 milligram per liter. Total and dissolved phos-phorus concentrations also generally increased in a downstream direction, but, for those constituents, the median concentrations for most sampling sites exceeded the North Dakota suggested guideline of 0.1 milligram per liter.
For dissolved solids, nutrients, and suspended sediments, a relation between constituent concentration and streamflow was determined using the data collected during the study period. The relation was determined by a multiple regression model in which concentration was the dependent variable and stream-flow was the primary explanatory variable. The regression model was used to compute unbiased estimates of annual loads for each constituent and for each of eight primary water-quality sampling sites and to compute the degree of uncertainty associ-ated with each estimated annual load. The estimated annual loads for the eight primary sites then were used to estimate annual loads for five intervening reaches in the study area.
Results were used as a screening tool to identify which subba-sins contributed a disproportionate amount of pollutants to the Red River. To compare the relative water quality of the differ-ent subbasins, an estimated flow-weighted average (FWA) con-centration was computed from the estimated average annual load and the average annual streamflow for each subbasin.
The 5-day biochemical oxygen demands in the upper Red River Basin were fairly small, and medians ranged from 1 to 3 milligrams per liter. The largest estimated FWA concentra-tion for dissolved solids (about 630 milligrams per liter) was for the Bois de Sioux River near Doran, Minn., site. The Otter Tail River above Breckenridge, Minn., site had the smallest esti-mated FWA concentration (about 240 milligrams per liter). The estimated FWA concentrations for dissolved solids for the main-stem sites ranged from about 300 to 500 milligrams per liter and generally increased in a downstream direction.
The estimated FWA concentrations for total nitrite plus nitrate for the main-stem sites increased from about 0.2 milli-gram per liter for the Red River below Wahpeton, N. Dak., site to about 0.9 milligram per liter for the Red River at Perley, Minn., site. Much of the increase probably resulted from flows from the tributary sites and intervening reaches, excluding the Otter Tail River above Breckenridge, Minn., site. However, uncertainty in the estimated concentrations prevented any reli-able conclusions regarding which sites or reaches contributed most to the increase.
The estimated FWA concentrations for total ammonia for the main-stem sites increased from about 0.05 milligram per liter for the Red River above Fargo, N. Dak., site to about 0.15 milligram per liter for the Red River near Harwood, N. Dak., site. The increase resulted from a decrease in flows in the Red River above Fargo, N. Dak., to the Red River near Harwood, N. Dak., intervening reach and the large load for that reach.
The estimated FWA concentrations for total organic nitro-gen for the main-stem sites were relatively constant and ranged from about 0.5 to 0.7 milligram per liter. The relatively constant concentrations were in sharp contrast to the total nitrite plus

2 Constituent Loads and Flow-Weighted Average Concentrations for the Upper Red River of the North Basin, 1997-99
nitrate concentrations, which increased about fivefold between the Red River below Wahpeton, N. Dak., site and the Red River at Perley, Minn., site.
The Red River near Harwood, N. Dak., to the Red River at Perley, Minn., intervening reach had the largest estimated FWA concentration for total nitrogen (about 2.9 milligrams per liter), but the estimate was highly uncertain. The Otter Tail River above Breckenridge, Minn., site had the smallest concentration (about 0.6 milligram per liter). The estimated FWA concentra-tions for total nitrogen for the main-stem sites increased from about 0.9 milligram per liter for the Red River at Hickson, N. Dak., site to about 1.6 milligrams per liter for the Red River at Perley, Minn., site.
The Sheyenne River at Harwood, N. Dak., site had the largest estimated FWA concentration for total phosphorus (about 0.5 milligram per liter). The Otter Tail River above Breckenridge, Minn., site had the smallest concentration (about 0.1 milligram per liter). The estimated FWA concentrations for total phosphorus for the main-stem sites increased from about 0.15 milligram per liter for the Red River below Wahpeton, N. Dak., site to about 0.35 milligram per liter for the Red River at Perley, Minn., site.
The estimated FWA concentrations for suspended sedi-ment for the main-stem sites increased from about 50 milli-grams per liter for the Red River below Wahpeton, N. Dak., site to about 300 milligrams per liter for the Red River at Perley, Minn., site. Much of the increase occurred as a result of the large yield of suspended sediment from the Red River below Wahpeton, N. Dak., to the Red River at Hickson, N. Dak., inter-vening reach.
Introduction
The Red River of the North (hereinafter referred to as the Red River) (fig. 1) meanders northward for 394 miles, nearly double the straight-line distance, from its origin to the United States-Canada border. The river has been identified by North Dakota and Minnesota environmental officials as a river for which instream water-quality problems related to properties and constituents such as dissolved oxygen, dissolved solids, nutri-ents, ammonia, and sediment need to be assessed. The Red River Basin encompasses areas of rich agricultural land, wet-lands, prairies, and forests, and nutrients from both point and nonpoint sources have been determined to cause excessive algae growth in the river.
Point-source pollutant loading to the Red River usually is identified and controlled easily because the pollutants often enter the river through a pipe. The point-source pollutants usu-ally enter the river from urban areas along the river and along its larger tributaries. Nonpoint-source pollutant loading to the
river is more difficult to identify because the pollutants may enter the river anywhere along its length. The nonpoint-source pollutants enter the river as dissolved constituents in ground water that is discharged to the river and as dissolved or sus-pended material in surface runoff (Tornes and others, 1997).
To control point- and nonpoint-source pollution in the Red River, the subbasins that contribute a disproportionate amount of pollutants to the river needed to be identified. Therefore, the U.S. Geological Survey (USGS), in cooperation with the North Dakota Department of Health, the Minnesota Pollution Control Agency, the Red River Joint Water Resource Board, and the Red River Watershed Management Board, began a study to col-lect and analyze water-quality data for the Red River. The data were used to determine the water-quality characteristics of the Red River and to determine which subbasins contribute the largest constituent loads to the river. Results of the study can be used by water-resource management agencies to establish sound water-quality standards.
Purpose and Scope
The purpose of this report is to describe the water-quality characteristics of the upper Red River and to present estimated constituent loads and flow-weighted average (FWA) concentra-tions for the major subbasins of the upper Red River Basin. For this report, the upper Red River Basin is defined as the drainage area upstream from the bridge crossing the Red River at Perley, Minn. (fig. 1). Data collected from May 1997 through Septem-ber 1999 at 11 water-quality sampling sites in the upper Red River Basin (fig. 1) were used to describe the water-quality characteristics and to estimate constituent loads and FWA con-centrations for major tributaries of the Red River. The estimated constituent loads then were used to determine which subbasins contributed the largest loads to the river during the study period. About 20 samples were collected from each of 8 sites during the study period, and about 6 samples were collected from each of 3 additional sites (table 1). The samples were analyzed for 5-day biochemical oxygen demand, bacteria, dissolved solids, nutrients, and suspended sediment. All values given in the USGS database for May 1997 through September 1999 were used in the analysis. Therefore, the number of values used var-ied among sites and among constituents. For example, for site 4, the number of values used ranged from 20 for dissolved solids to 22 for total nitrite plus nitrate and total nitrogen (table 1–1 in appendix 1).
Description of Red River of the North Basin
The general physical, hydrological, and ecological setting of the Red River Basin is diverse in ways that could have a sig-nificant effect on the distribution and flow of water in the basin and, therefore, the distribution and concentration of constituents that affect water quality (Stoner and others, 1993). Continental

Figu
re 1
.
Loca
tion
of s
tudy
are
a, lo
catio
ns o
f wat
er-q
ualit
y sa
mpl
ing
site
s, la
nd u
se a
nd la
nd c
over
, and
phy
siog
raph
ic a
reas
in th
e Re
d Ri
ver o
f the
Nor
th B
asin
. [M
odifi
edfro
m T
orne
s an
d ot
hers
, 199
7.]
CA
NA
DA
UN
ITE
D S
TA
TE
S
0
1
0
2
0
3
0
4
0 M
ILES
MIN
NE
SOT
AN
OR
TH
DA
KO
TA
SOU
TH
DA
KO
TA
MA
NIT
OB
A98
˚ 98˚
47˚
46˚
49˚
97˚
47˚
48˚
48˚
97˚
96˚
99˚
100˚
95˚ 95
˚
96˚
46˚
49˚
99˚
100˚
INDE
X M
AP
A
B
C
D
RED RIVER
OFTHE
NORTH
RED
RIVE
R OF
THE
NOR
TH B
ASIN
FA
RG
OM
oorh
ead
Eas
tG
rand
For
ksG
rand
For
ks
DEVI
LS L
AKE
BASI
NN
OT U
SED
IN S
TUDY
STU
DY
ARE
A
1
234
5678
91011 Wah
peto
n
Hic
kson
Wild
Ric
e
Har
woo
d
Wes
t F
argo
Geo
rget
own
Per
ley
Bre
cken
ridg
e
Dor
an
Thi
efR
iver
Fal
ls
Det
roit
Lak
es
Whi
te R
ock
Fer
gus
Fal
ls
Val
ley
Cit
y
Cro
okst
on
NO
RT
H D
AK
OT
A
SOU
TH
DA
KO
TA
MIN
NE
SOT
A
Cr.
Elm
Riv
er
Rush
Riv
erRiv
er
R.
Maple
Baldh
ill
Riv
er
Wild
Ric
e
Sheyenne
Riv
er
Goose
Antelope
Cr.
Lak
eA
shta
bula
Turtle
River
Shey
enne
Riv
er
Rive
r
Riv
erP
embi
na
Tong
ue
Par
kR
iver River
Fore
st
Cr.
Mowbray
SnowflakeCr.
Cyp
ress
Cre
ekH
idde
nIs
land
Cou
lee
Roc
kL
ake
San
dH
ill R
iver
Mar
sh R
iver B
uffa
lo
River
Rive
r
Tai
l
River
Wild
Ric
e
Buffa
lo
S. Br.
Riv
er
Rab
bit
Riv
er
Mus
tinka
River
Otte
r
Sioux R.Bois de
Two
Riv
ers Gra
ndM
arai
sR
iver
Upp
er R
ed L
ake
Low
er R
ed L
ake
Red
Riv
er
Lak
e
Mid
dle Rive
r
Snak
e
Riv
erRiv
er
Tam
arac
Nor
th
Br.So
uth
River
Ros
eau
River
Cle
arw
ater
River
Los
t
R.
Hill
Ruffy Br.
Br.
Bur
nham
Cr.
Mud
Riv
er
River
Thief
Mud
Lak
e Lak
eT
rave
rse
Spri
ng C
r.St
ony
Cr.
Whi
skey
Cr.
Base
from
U.S
. Geo
logi
cal S
urve
y1:
2,00
0,00
0, 1
972
E
XP
LA
NA
TIO
N
Lan
d us
e an
d la
nd c
over
M
ostly
cro
plan
d
C
ropl
and
and
past
urel
and
C
ropl
and
and
woo
dlan
d
W
oodl
and
and
crop
land
Fo
rest
and
woo
dlan
d
G
rass
land
and
pas
ture
land
W
etla
nd
W
ater
U
rban
Phy
siog
raph
ic a
reas
D
rift
Pra
irie
R
ed R
iver
Val
ley
Lak
e Pl
ain
L
ake-
Was
hed
Till
Pla
in
M
orai
ne
Phy
siog
raph
ic b
ound
ary
Red
Riv
er o
f th
e N
orth
Bas
in b
ound
ary
Dev
ils L
ake
Bas
in b
ound
ary
Stud
y ar
ea b
ound
ary
Wat
er-q
ualit
y sa
mpl
ing
site
and
num
ber
Stre
amfl
ow-g
agin
g st
atio
n an
d nu
mbe
r
A B C D 2
0505
9500
0505
9500
Shey
enne
Riv
er a
tW
est F
argo
, N. D
ak.
0505
4000
Red
Rive
r of t
he N
orth
at F
argo
, N. D
ak.
Introduction 3
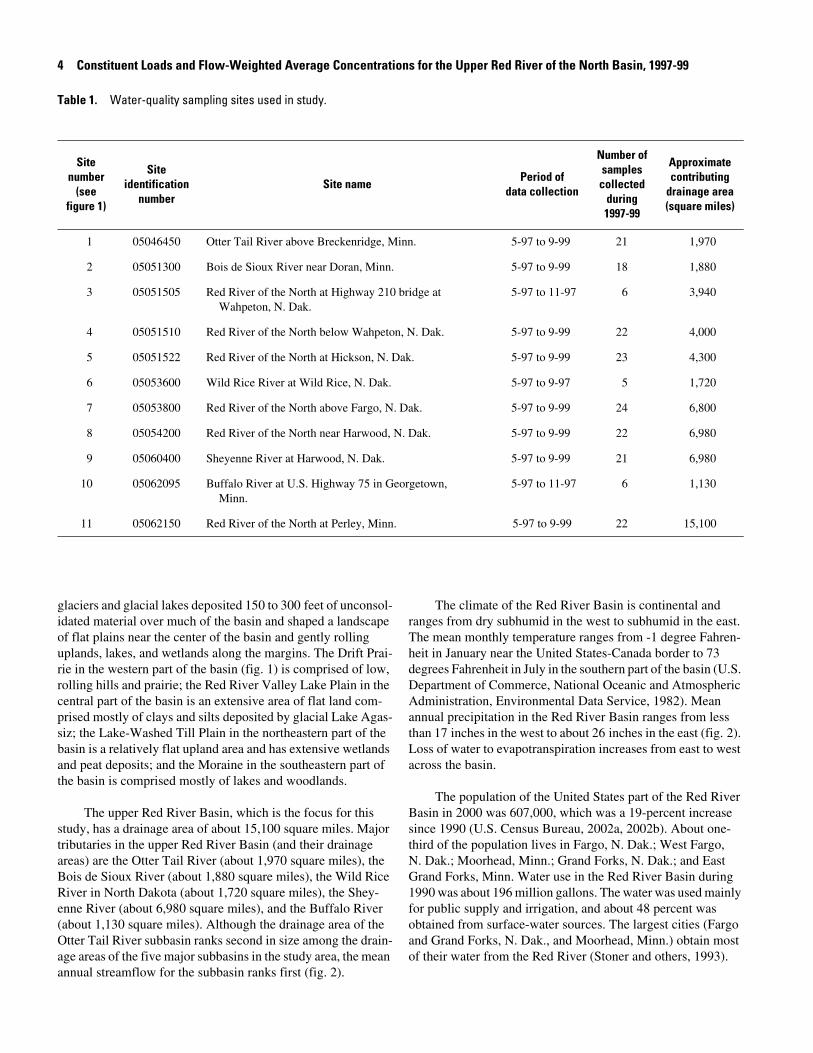
Table 1. Water-quality sampling sites used in study.
Sitenumber
(seefigure 1)
Siteidentification
numberSite name
Period ofdata collection
Number ofsamples
collectedduring1997-99
Approximatecontributing
drainage area(square miles)
1 05046450 Otter Tail River above Breckenridge, Minn. 5-97 to 9-99 21 1,970
2 05051300 Bois de Sioux River near Doran, Minn. 5-97 to 9-99 18 1,880
3 05051505 Red River of the North at Highway 210 bridge at Wahpeton, N. Dak.
5-97 to 11-97 6 3,940
4 05051510 Red River of the North below Wahpeton, N. Dak. 5-97 to 9-99 22 4,000
5 05051522 Red River of the North at Hickson, N. Dak. 5-97 to 9-99 23 4,300
6 05053600 Wild Rice River at Wild Rice, N. Dak. 5-97 to 9-97 5 1,720
7 05053800 Red River of the North above Fargo, N. Dak. 5-97 to 9-99 24 6,800
8 05054200 Red River of the North near Harwood, N. Dak. 5-97 to 9-99 22 6,980
9 05060400 Sheyenne River at Harwood, N. Dak. 5-97 to 9-99 21 6,980
10 05062095 Buffalo River at U.S. Highway 75 in Georgetown, Minn.
5-97 to 11-97 6 1,130
11 05062150 Red River of the North at Perley, Minn. 5-97 to 9-99 22 15,100
4 Constituent Loads and Flow-Weighted Average Concentrations for the Upper Red River of the North Basin, 1997-99
glaciers and glacial lakes deposited 150 to 300 feet of unconsol-idated material over much of the basin and shaped a landscape of flat plains near the center of the basin and gently rolling uplands, lakes, and wetlands along the margins. The Drift Prai-rie in the western part of the basin (fig. 1) is comprised of low, rolling hills and prairie; the Red River Valley Lake Plain in the central part of the basin is an extensive area of flat land com-prised mostly of clays and silts deposited by glacial Lake Agas-siz; the Lake-Washed Till Plain in the northeastern part of the basin is a relatively flat upland area and has extensive wetlands and peat deposits; and the Moraine in the southeastern part of the basin is comprised mostly of lakes and woodlands.
The upper Red River Basin, which is the focus for this study, has a drainage area of about 15,100 square miles. Major tributaries in the upper Red River Basin (and their drainage areas) are the Otter Tail River (about 1,970 square miles), the Bois de Sioux River (about 1,880 square miles), the Wild Rice River in North Dakota (about 1,720 square miles), the Shey-enne River (about 6,980 square miles), and the Buffalo River (about 1,130 square miles). Although the drainage area of the Otter Tail River subbasin ranks second in size among the drain-age areas of the five major subbasins in the study area, the mean annual streamflow for the subbasin ranks first (fig. 2).
The climate of the Red River Basin is continental and ranges from dry subhumid in the west to subhumid in the east. The mean monthly temperature ranges from -1 degree Fahren-heit in January near the United States-Canada border to 73 degrees Fahrenheit in July in the southern part of the basin (U.S. Department of Commerce, National Oceanic and Atmospheric Administration, Environmental Data Service, 1982). Mean annual precipitation in the Red River Basin ranges from less than 17 inches in the west to about 26 inches in the east (fig. 2). Loss of water to evapotranspiration increases from east to west across the basin.
The population of the United States part of the Red River Basin in 2000 was 607,000, which was a 19-percent increase since 1990 (U.S. Census Bureau, 2002a, 2002b). About one-third of the population lives in Fargo, N. Dak.; West Fargo, N. Dak.; Moorhead, Minn.; Grand Forks, N. Dak.; and East Grand Forks, Minn. Water use in the Red River Basin during 1990 was about 196 million gallons. The water was used mainly for public supply and irrigation, and about 48 percent was obtained from surface-water sources. The largest cities (Fargo and Grand Forks, N. Dak., and Moorhead, Minn.) obtain most of their water from the Red River (Stoner and others, 1993).

EX
PL
AN
AT
ION
Stud
y ar
ea
Mea
n an
nual
str
eam
flow
, in
cubi
c fe
etpe
r se
cond
Lin
e of
equ
al m
ean
annu
al p
reci
pita
tion
,in
inch
es
Red
Riv
er o
f th
e N
orth
Bas
in b
ound
ary
Dev
ils L
ake
Bas
in b
ound
ary
Stud
y ar
ea b
ound
ary
0 2,00
0
4,00
0
20
Figu
re 2
.
Mea
n an
nual
pre
cipi
tatio
n an
d st
ream
flow
in th
e Re
d Ri
ver o
f the
Nor
th B
asin
. [M
odifi
ed fr
om T
orne
s an
d ot
hers
, 199
7.]
CA
NA
DA
UN
ITE
D S
TA
TE
S
0
1
0
2
0
3
0
4
0 M
ILES
MIN
NE
SOT
AN
OR
TH
DA
KO
TA
SOU
TH
DA
KO
TA
MA
NIT
OB
A98
˚ 98˚
47˚
46˚
49˚
97˚
47˚
48˚
48˚
97˚
96˚
99˚
100˚
95˚ 95
˚
96˚
46˚
49˚
99˚
100˚
RED RIVER
OFTHE
NORTH
FA
RG
OM
oorh
ead
Eas
tG
rand
For
ksG
rand
For
ks
DEVI
LS L
AKE
BASI
NN
OT U
SED
IN S
TUDY
Wah
peto
n
Hic
kson
Wild
Ric
e
Har
woo
d
Wes
t F
argo
Geo
rget
own
Per
ley
Bre
cken
ridg
e
Dor
an
Thi
efR
iver
Fal
ls
Det
roit
Lak
es
Whi
te R
ock
Fer
gus
Fal
ls
Val
ley
Cit
y
Cro
okst
on
Cr.
Elm
Riv
er
Rush
Riv
erRiv
er
River
Maple
Baldh
ill
Riv
er
Wild
Ric
e
Sheyenne
Riv
er
Goose
Antelope
Cr.
Lak
eA
shta
bula
Turtle
River
Shey
enne
Riv
er
Rive
r
Riv
erP
embi
na
Tong
ue
Par
kR
iver River
Fore
st
Cr.
Mowbray
SnowflakeCr.
Cyp
ress
Cre
ekH
idde
nIs
land
Cou
lee
Roc
kL
ake
San
dH
ill R
iver
Mar
sh R
iver B
uffa
lo
River
Rive
r
Tai
l
River
Wild
Ric
e
Buffa
lo
S. Br.
Riv
er
Rab
bit
Riv
er
Mus
tinka
River
Otte
r
Sioux R.Bois de
Two
Riv
ers Gra
ndM
arai
sR
iver
Upp
er R
ed L
ake
Low
er R
ed L
ake
Red
Riv
er
Lak
e
Mid
dle Rive
r
Snak
e
Riv
erRiv
er
Tam
arac
Nor
th
Br.So
uth
River
Ros
eau
River
Cle
arw
ater
River
Los
t
R.
Hill
Ruffy Br.
Br.
Bur
nham
Cr.
Mud
Riv
er
River
Thief
Mud
Lak
e Lak
eT
rave
rse
Spri
ng C
r.St
ony
Cr.
Whi
skey
Cr.
Base
from
U.S
. Geo
logi
cal S
urve
y1:
2,00
0,00
0, 1
972
20
22
24
24
26
24
22
20
20
18
Introduction 5

6 Constituent Loads and Flow-Weighted Average Concentrations for the Upper Red River of the North Basin, 1997-99
Streamflow in the Red River Basin varies greatly through-out the year. The largest streamflows usually occur in spring and early summer as a result of rain falling on melting snow or heavy rain falling on saturated soils. Flooding is a major prob-lem and is aggravated by the gentle slope of the Red River and the flatness of the overbank areas. To facilitate agricultural pro-duction, an extensive system of drainage ditches has been con-structed in parts of the Red River Valley Lake Plain and the Lake-Washed Till Plain to promote rapid surface drainage of clay-rich soils.
Ground water in the Red River Basin is primarily in sand and gravel aquifers near land surface or in buried glacial depos-its throughout the basin. Ground water also moves toward the Red River through a regional system of bedrock and glacial-drift aquifers. Many of these bedrock and glacial-drift aquifers are connected hydraulically to streams in the basin and, there-fore, affect the flow and water quality of the streams. During dry periods, ground water, in addition to water from lakes and reservoirs, is an important source of flow in many of the streams.
The fertile, black, fine-grained soils in the Red River Basin are conducive to cropland agriculture, which is the dominant land use in the basin. About 64 percent of the basin is comprised of cropland, and about 16 percent is comprised of pastureland, farmland, and local roads (data interpreted from U.S. Geologi-cal Survey, 1986; Minnesota Agricultural Statistics Service, 1991; North Dakota Agricultural Statistics Service, 1992). The remainder of the basin is comprised of grassland, forest, open water, and wetlands. Cropland is most extensive in the Red River Valley Lake Plain.
Small grains, including wheat, oats, rye, and barley, are grown throughout most of the Red River Basin. These grains often are rotated with other crops in regional patterns that are based on differences in soils, topography, and climate. Corn is grown primarily in the southern part of the basin. However, small fields in other parts of the basin also are planted in corn. Sunflowers, hay, and small grains are grown predominantly in the Drift Prairie, and sugar beets, potatoes, small grains, and soybeans are grown predominantly in the Red River Valley Lake Plain.
Study Design
Water-quality sampling sites used in this study were selected to represent major subbasins in the upper Red River Basin. Where possible, the sites were located at existing USGS streamflow-gaging stations where water-quality data previously had been collected. For this study, specific conductance, pH, air temperature, water temperature, dissolved oxygen, barometric pressure, fecal coliform, and fecal streptococci were measured in the field. Water samples were collected from each site and sent to the North Dakota Department of Health Laboratory in
Bismarck, N. Dak., to be analyzed for biochemical oxygen demand, major ions, nutrients, and trace elements. An addi-tional water sample was collected from each site and sent to the USGS Sediment Laboratory in Iowa City, Iowa, to be analyzed for suspended-sediment concentration and particle-size distri-bution. Initially, water samples also were collected from two sites and sent to the North Dakota Department of Health Labo-ratory to be analyzed for pesticides. However, after the first year of the study, the pesticide sampling schedule was re-evaluated and, because of the large number of pesticide concentrations that were less than method detection limits, the sampling fre-quency for pesticides was reduced. The water-quality properties and constituents analyzed for in the study described in this report are given in table 2.
Water-quality data initially were collected at 11 sites (table 1, fig. 1), but, because of changes in resources available for the study, sampling was discontinued at one tributary site [site 6 (the Wild Rice River at Wild Rice, N. Dak.)] in Septem-ber 1997 and at one main-stem site [site 3 (the Red River at Highway 210 bridge at Wahpeton, N. Dak.)] and one tributary site [site 10 (the Buffalo River at U.S. Highway 75 in George-town, Minn.)] in November 1997 (field measurements were continued at site 3). Sample-collection timelines for the 11 sites are shown in figure 3. The three discontinued sites were chosen because loads for those sites could be estimated using loads for existing main-stem sites. Therefore, the data for the three dis-continued sites were not used to estimate loads for this study and are not included in the discussion of water-quality charac-teristics.
Methods
Sample Collection and Analysis
Samples for August and September 1998 were collected by the North Dakota Department of Health. All other samples were collected by the USGS. All samples were collected using the equal-width increment (EWI) sampling method described by Wilde and others (1999). The EWI sampling method involves the collection of water from equally spaced widths in the stream channel using an isokinetic sampler such as a US-D77 sampler. With an isokinetic sampler, water samples are collected proportional to stream velocity. Therefore, the EWI method results in the collection of discharge-weighted samples. For this study, water samples collected with the isokinetic sam-pler were composited into a churn splitter. Then, aliquots of water were drawn from the churn splitter, put into bottles, and sent to the appropriate laboratory for analysis. Sediment sam-ples were collected concurrently with the water samples but were not composited; rather, the whole-water samples were sent to the laboratory for analysis. Fecal coliform and fecal strepto-cocci samples were collected from the river surface at the cen-troid of flow using a sterile bottle. A US-DH81 sampler (a hand-

Table 2. Water-quality properties and constituents for which water samples were analyzed.
Measured attime of sample
collection
Determined at North DakotaDepartment of Health Laboratory,
Bismarck, North Dakota
Determined at U.S. GeologicalSurvey Sediment Laboratory,
Iowa City, Iowa
Specific conductance Specific conductance Arsenic, total Suspended-sediment concentration
pH pH Barium, total Suspended sediment particle size
Air temperature Biochemical oxygen demand, 5-day Beryllium, total recoverable
Water temperature Calcium, dissolved Boron, total recoverable
Dissolved oxygen Magnesium, dissolved Cadmium, total recoverable
Barometric pressure Sodium, dissolved Chromium, total recoverable
Fecal coliform Potassium, dissolved Copper, total recoverable
Fecal streptococci Alkalinity Iron, total recoverable
Sulfate, dissolved Lead, total recoverable
Chloride, dissolved Manganese, total recoverable
Nitrite plus nitrate, total Nickel, total recoverable
Ammonia, total Selenium, total
Ammonia plus organic nitrogen, total Silver, total recoverable
Nitrogen, organic, total Thallium, total recoverable
Nitrogen, total Zinc, total recoverable
Phosphorus, total
Phosphorus, dissolved
Chlorophyll a
Chlorophyll b
Aluminum, total recoverable
Antimony, total
Introduction 7
held isokinetic sampler) or a glass bottle in a weighted basket sampler was used when samples were collected under ice and velocities were slow.
Samples were processed within 1 to 2 hours of collection. Raw water used for total analysis was drawn from the churn first. Water used for dissolved analysis was drawn last using a peristaltic pump and a 0.45-micron capsule filter. Water sam-ples to be analyzed for biochemical oxygen demand were put into bottles and chilled. Water samples to be analyzed for total nutrients were put into bottles, preserved with sulfuric acid, and chilled, and water samples to be analyzed for dissolved nutrients were put into bottles, filtered, and chilled. Water
samples to be analyzed for trace elements were put into bottles and preserved with nitric acid to a pH of 2 or less. The fecal coliform and fecal streptococci samples were processed and analyzed in the field by the USGS using the membrane-filtra-tion procedure described by Myers and Sylvester (1997). The sediment samples were sent to the USGS Sediment Laboratory after completion of the sampling trip.
Samples analyzed by the North Dakota Department of Health Laboratory were shipped to the laboratory using next-day services. The North Dakota Department of Health Labora-tory uses U.S. Environmental Protection Agency (USEPA) methods and procedures. The USGS Sediment Laboratory

8 Constituent Loads and Flow-Weighted Average Concentrations for the Upper Red River of the North Basin, 1997-99
uses methods given by Guy (1969) and participates in a USGS quality-assurance program. External agencies and customer organizations audit the North Dakota Department of Health Laboratory to assess the laboratory analytical methods and quality-assurance/quality-control procedures. The USEPA reviews the laboratory procedures about every third year, and the Branch of Systems of the USGS reviews the laboratory pro-cedures periodically.
Site 1, Otter Tail River above Breckenridge, Minnesota
Site 2, Bois de Sioux River near Doran, Minnesota
Site 3, Red River at Highway 210 bridge at Wahpeton, North Dakota
Site 4, Red River below Wahpeton, North Dakota
Site 5, Red River at Hickson, North Dakota
Site 6, Wild Rice River at Wild Rice, North Dakota
Site 7, Red River above Fargo, North Dakota
Site 8, Red River near Harwood, North Dakota
Site 9, Sheyenne River at Harwood, North Dakota
Site 10, Buffalo River at U.S. Highway 75 in Georgetown, Minnesota
M J J A S O N D J F M A M J J A S O N D J F M A M J J A S
1997 1998 1999
Site 11, Red River at Perley, Minnesota
Figure 3. Sample-collection timelines for water-quality sampling sites used in study.
A total of six replicate samples (three splits and three duplicates) were collected during the study. The quality-assur-ance samples were used to evaluate the precision and accuracy of the analysis of the samples collected for the study. Because of the limited resources available for the study, results from the North Dakota Department of Health laboratory and results from the USGS laboratory were not compared. Results from both lab-oratories may be obtained by contacting the USGS office in Bis-marck, N. Dak.

Introduction 9
Load Computation
The actual annual load for a given river cross section, con-
stituent, and water year1 is defined as the total mass of the con-stituent that is transported past the river cross section during the year. The actual annual load cannot be determined unless con-centration is monitored continuously. Therefore, because con-centration data were collected intermittently during this study, gaps in the data needed to be filled before the annual loads could be estimated. To fill the gaps, a relation between constituent concentration and streamflow was determined using the data collected during the study period (May 1997 through Septem-ber 1999). Although constituent-concentration data were avail-able before May 1997 for some sites, a common period of record was used for all sites to facilitate comparison of the loads. The relation was determined by a multiple regression model in which concentration was the dependent variable and streamflow was the primary explanatory variable. The regres-sion model was determined using a program called Estimator (Cohn, Caulder, Gilroy, Zynjuk, and Summers, 1992; Cohn, Gilroy, and Baier, 1992). A seasonal factor was included in the regression model when needed.
After estimates of daily concentration were computed for each day of the year, the concentration was multiplied by daily streamflow to obtain an estimated daily load. The estimated daily loads then were summed to obtain the estimated annual load for a given water year. The difference between the esti-mated annual load and the actual annual load is known as the estimation error. The statistical properties of the estimation error depend on the number of concentrations used to fit the regression model, the degree of censoring of the concentrations, and the streamflow conditions during which the concentration data were collected. For this study, the estimation error was quantified by using Estimator to produce, in addition to an esti-mated annual load, a confidence interval within which the actual annual load was likely to plot. A more detailed descrip-tion of uncertainty in the estimated annual loads is given in appendix 1.
Seasonality can have a significant effect on constituent concentrations because changing climatic conditions and human activities can affect the availability of some constituents to the aquatic environment. For example, nitrate concentrations tend to be small and ammonia concentrations tend to be large during the winter because cold conditions in the soil and the
water reduce nitrifying bacteria activities. Also, nitrogen and phosphorus concentrations may be larger during the summer than during other times of the year because of rainfall runoff from fields where fertilizers have been applied. Therefore, the ability to incorporate seasonality into the regression model was an important feature of Estimator.
The ability to include censored concentrations (that is, concentrations that are less than the laboratory method detec-tion limit) in the regression model was another important fea-ture of Estimator. If all concentrations used to fit the regression model were greater than the detection limit, minimum-variance unbiased estimates of daily concentration were computed using the fitted model described previously. However, if some con-centrations were less than the detection limit, estimates of daily concentration were computed using an adjusted maximum like-lihood estimation (AMLE) procedure (Cohn, Gilroy, and Baier, 1992). The AMLE procedure produced essentially unbiased estimates even when a large percentage (as much as 80 percent) of the concentrations used to fit the regression model were cen-sored.
The instructions for using Estimator (G. Baier, T. Cohn, and E. Gilroy, U.S. Geological Survey, written commun., 1995) state that, for efficient load estimation, at least 25 samples should be collected per year for 2 years. However, the method-ology also is valid for small sample sizes provided extra care is used to fit the regression model and to verify the assumptions of the model (Tim Cohn, U.S. Geological Survey, oral commun., 2003). A small sample size, in effect, increases the standard error of the estimated annual load and, therefore, reduces the accuracy of the estimated annual load. For this study, fewer than 25 samples were collected from each site during 1997-99. How-ever, the approximate constituent load contributed from each subbasin to the Red River could be identified for many of the constituents and sites. Therefore, the results from Estimator were used as a screening tool to identify which subbasins con-tributed a disproportionate amount of pollutants to the Red River. In some cases, particularly for nutrient loads for the small subbasins, the standard errors of the estimated annual loads were too large to discern differences in loads among the subba-sins. However, because the Estimator program computes unbi-ased estimates of annual loads with the smallest possible stan-dard error, regardless of sample size, more accurate estimates can be obtained only by increasing the sample size.
1In U.S. Geological Survey reports, a water year is defined as the 12-month period from October 1 through September 30. The water year is designated by the calendar year in which it ends; therefore, the water year ending September 30, 1999, is called “water year 1999.”

10 Constituent Loads and Flow-Weighted Average Concentrations for the Upper Red River of the North Basin, 1997-99
Water-Quality Characteristics
Biochemical Oxygen Demand
A sufficient amount of dissolved oxygen is critical for maintaining the aquatic life and aesthetic quality of streams and lakes. Therefore, the determination of how organic matter affects the dissolved-oxygen concentration in a stream or lake is integral to water-quality management. The decay of organic matter in water is measured by the biochemical or chemical oxygen demand. The oxygen demand is a measure of the amount of oxygen removed from water by the metabolic requirements of oxidizable substances (Nemerow, 1974; Tchobanoglous and Schroeder, 1985).
The distribution of 5-day biochemical oxygen demand in the upper Red River Basin is shown in figure 4
Figure 4. Distribution of 5-day biochemical oxygen demand in the upper Red River of the North Basin during May 1997 throughSeptember 1999.
1
19(0)
2
16(0)
3
6(0)
4
20(0)
5
21(0)
6
5(0)
7
19(0)
8
21(0)
9
20(0)
10
6(0)
11
20(0)
0
1
2
3
4
5
6
7
SITE
DEM
AND,
IN M
ILLI
GRAM
S PE
R LI
TER
20
(0)
EXPLANATION
Site number given in table 1
Number of values
Number of values at or belowdetection limit
Percentile--Percentage of analysesequal to or less than indicatedvalues. Sites 3, 6, and 10 are notincluded in data comparisons.
Maximum
75th percentile
Median
25th percentile
Minimum
. The oxygen demands were fairly small, and medians ranged from 1 to 3 milligrams per liter. Site 2 (the Bois de Sioux River near Doran, Minn.) had the largest median oxygen demand.
Bacteria
Fecal indicator bacteria are used to assess the presence of waterborne disease-causing pathogens (pathogens). Indicator bacteria are used because they typically are not disease causing and they correlate well with several pathogens (Myers and Sylvester, 1997). The fecal indicator bacteria used in this study were fecal coliform and fecal streptococci. Both types of bacte-ria thrive in the intestines of warm-blooded animals and are present in waste from the animals. Therefore, the bacteria can

Water-Quality Characteristics 11
be used to indicate if warm-blooded animals contribute to the contamination of a water body. The North Dakota and Minne-sota water-quality standards for fecal coliform state that, for the recreational season of May 1 through September 30, the geo-metric mean of fecal coliform shall not exceed 200 colonies per 100 milliliters based on a minimum of five samples within a 30-day period (North Dakota Department of Health, 1991; Minne-sota Pollution Control Agency, accessed July 17, 2002).
The distribution of fecal coliform in the upper Red River Basin is shown in figure 5
Figure 5. Distribution of fecal coliform in the upper Red River of the North Basin during May 1997 through September 1999.
1
20(0)
2
16(0)
3
6(0)
4
19(0)
5
19(0)
6
4(0)
7
19(0)
8
17(0)
9
20(0)
10
4(0)
11
17(0)
5
1
10
50
500
100
1,000
10,000
5,000
SITE
COLO
NIE
S PE
R 10
0 M
ILLI
LITE
RS
17
(0)
EXPLANATION
Site number given in table 1
Number of values
Number of values at or belowdetection limit
Percentile--Percentage of analysesequal to or less than indicatedvalues. Sites 3, 6, and 10 are notincluded in data comparisons.
Maximum
75th percentile
Median
25th percentile
Minimum
, and the distribution of fecal strepto-cocci is shown in figure 6. The fecal coliform and fecal strepto-cocci concentrations varied greatly from site to site. The largest median fecal coliform concentration was for site 9 (the Shey-enne River at Harwood, N. Dak.). Site 8 (the Red River near Harwood, N. Dak.), site 9, and site 11 (the Red River at Perley, Minn.) had the largest median fecal streptococci concentrations.
Fecal coliform samples were not collected with sufficient frequency to determine if the water-quality standards were met. However, more than 50 percent of the samples for site 9 and more than 25 percent of the samples for site 2 (the Bois de Sioux River near Doran, Minn.) and site 11 had fecal coliform concentrations that were greater than 200 colonies per 100 milliliters (fig. 5). Although a few of the samples that had large concentrations were not collected during the recreational sea-son, the concentrations that were greater than 200 colonies per 100 milliliters indicate an abundance of pathogens in the upper Red River Basin.
Dissolved Solids
Dissolved-solids concentrations in river water depend on the solubility of the rocks, the type of soil, and the amount of rainfall within a drainage basin. Large dissolved-solids concen-

Figure 6. Distribution of fecal streptococci in the upper Red River of the North Basin during May 1997 through September 1999.
1
20(0)
2
15(0)
3
6(0)
4
19(0)
5
19(0)
6
4(0)
7
19(0)
8
17(0)
9
20(0)
10
3(0)
11
17(0)
5
1
10
50
500
100
1,000
100,000
10,000
50,000
5,000
SITE
COLO
NIE
S PE
R 10
0 M
ILLI
LITE
RS
20
(0)
EXPLANATION
Site number given in table 1
Number of values
Number of values at or belowdetection limit
Percentile--Percentage of analysesequal to or less than indicatedvalues. Sites 3, 6, and 10 are notincluded in data comparisons.
Maximum
75th percentile
Median
25th percentile
Minimum
12 Constituent Loads and Flow-Weighted Average Concentrations for the Upper Red River of the North Basin, 1997-99
trations can be detrimental for some uses of the water. The USEPA secondary water-quality standard for dissolved solids in drinking water is 500 milligrams per liter. North Dakota has no standard for dissolved solids. The Minnesota standard for the Red River is 500 milligrams per liter (Minnesota Pollution Con-trol Agency, accessed July 17, 2002). This standard is a nonen-forceable guideline regarding cosmetic effects and aesthetic effects of drinking water.
The distribution of dissolved solids in the upper Red River Basin is shown in figure 7. The median concentrations for site 2 (the Bois de Sioux River near Doran, Minn.) and site 9 (the Sheyenne River at Harwood, N. Dak.) exceeded the USEPA secondary water-quality standard of 500 milligrams per liter. Sites 2 and 9 also had the largest dissolved-solids concentra-tions. No main-stem Red River sites had median concentrations that exceeded the standard. Generally, the dissolved-solids con-
centrations in the main stem Red River increased in a down-stream direction.
Nutrients
Nutrients in streams are derived from natural sources and from many human uses of land and water resources (fig. 8). The nutrients are transported to the streams by ground-water inflow and surface runoff. Sources of nutrients include atmospheric deposition, decaying plants, animal wastes, fertilizers, septic systems, detergents, municipal and industrial wastewater, and minerals in rocks and soil. Substantially less phosphorus than nitrogen is contributed by atmospheric deposition.
In urban drainage areas, as in other drainage areas, snow-melt and a few major storms transport a large part of the annual

Figure 7. Distribution of dissolved solids in the upper Red River of the North Basin during May 1997 through September 1999.
1
20(0)
2
17(0)
3
6(0)
4
20(0)
5
23(0)
6
4(0)
7
22(0)
8
21(0)
9
20(0)
10
5(0)
11
20(0)
0
800
600
400
200
1,200
1,000
SITE
CON
CEN
TRAT
ION
, IN
MIL
LIGR
AMS
PER
LITE
R
20
(0)
EXPLANATION
Site number given in table 1
Number of values
Number of values at or belowdetection limit
Percentile--Percentage of analysesequal to or less than indicatedvalues. Sites 3, 6, and 10 are notincluded in data comparisons.
Maximum
75th percentile
Median
25th percentile
Minimum
Water-Quality Characteristics 13
nonpoint-source nutrient load to the Red River. Surface runoff is affected by the total amount of rainfall during the storm, the total contributing drainage area, the peak discharge, the runoff volume and duration, the rainfall rate, and the percentage of impervious land surface in the drainage area. Most nutrients that reach the impervious surfaces are transported to storm drains and eventually to streams by the surface runoff. Although the relative proportions of nutrients contributed from ground-water discharge and from surface runoff are not known, the contribu-tion from surface runoff is dominant.
In agricultural areas, nutrients are contributed primarily from nonpoint sources, including animal wastes (fig. 8) and crop fertilizers (fig. 9). High flows generally contribute most of the nutrients to streams through surface runoff, erosion, trans-port of organic and inorganic particulates, and resuspension of streambed sediments. Low flows possibly can carry nutrients
that have infiltrated to the water table and entered the ground-water-flow system. The relative proportions of nutrients con-tributed from ground-water discharge and from surface runoff vary depending on the local soils and geology and on the loca-tion of the agricultural area relative to the ground-water and sur-face-water systems.
Nitrogen
The most common forms of nitrogen are nitrate, nitrite, ammonia, and organic nitrogen. In the presence of oxygen, nitrifying bacteria will oxidize all forms of nitrogen to nitrate. The amount of ammonia and organic nitrogen in water is depen-dent on the population of nitrifying bacteria and the length of time the compound has been in the water. Nitrite is easily oxi-

Figure 8. Movement of nutrients from subbasins of the Red River of the North Basin. [Modified from Antweiler and others, 1995.]
White Rock DamLake Traverse
Rive
r
Rive
r
Wild
R
ice
River
OtterTail
Bois d
e Sio
ux
Rabbit R.
RE
D
RIVER
TH
E
OF
NO
RT
H
Low-head dam
FARGOMoorhead
WahpetonBreckenridge
NH4 NO3
DONNH4 NIT
NO3
GROUNDWATER
FPON DON
LPON NO3 POP
COPFPON
NO3PO4
WETLANDN2
NO3DEN
NH4
NH4NO3PO4FPONBPP
P
LPONBiotic uptakeof N and P
Sorption of Nand P to soils
Erosion and dissolutionof rocks and soil
PIPCIPPO4
NO3PO4
Resuspension ofnutrients fromstreambed sediments
SUBURBAN AREASeptic systemsLawn fertilizersNonpoint sources
FPONPOPCOPNO3PO4
NO3PO4BPPFPONLPPCOPPOPDENNP
V
AGRICULTUREFertilizerAnimal and plant wasteSoil erosion
FPONPOPCOP
NH4NO3PO4NITFPONLPPDEN
URBAN AREAPoint sourcesNonpoint sources
ATMOSPHERE
V
EXPLANATION
Nutrients
Nitrogen
Phosphorus
Large particulate organic N
Fine particulate organic N
Dissolved organic N
Ammonia
Nitrate
Nitrogen gas
Particulate inorganic P
Particulate organic P
Complex inorganic P
Complex organic P
Phosphate
Processes
Nitrification (oxidationof ammonia to nitratein aerobic water)
Denitrification (reductionof nitrate to nitrogen gasor nitrous oxide gas inanoxic water)
Volatilization of ammonia
Benthic primary production(by bottom-dwelling algaeand plants)
Lentic primary production(by floating and suspendedalgae)
N
P
LPON
FPON
DON
NH4
NO3
N2
PIP
POP
CIP
PO4
COP
NIT
DEN
V
BPP
LPP
N O R T H D A K O T AM I N N E S O T A
S O U T H D A K O T AN O R T H D A K O T A
NO3NIT
DONFPON
N
14 Constituent Loads and Flow-Weighted Average Concentrations for the Upper Red River of the North Basin, 1997-99

Figure 9. Nitrogen fertilizer applications by county in North Dakota, Minnesota, and South Dakota during 1991. [Modified fromAntweiler and others, 1995.]
EXPLANATION
Fertilizer application, in tons per square mile per year
Zero or data missing Less than 1.0 1.0 to 3.3 3.4 to 8.1 8.2 to 20 More than 20
Red River of the North Basin boundary
Study area boundary
0 40 80 120 MILESBase from U.S. Geological Survey1:2,000,000, 1972
103˚ 101˚ 99˚ 97˚
95˚
93˚
91˚
49˚
47˚
45˚
43˚43˚
45˚
47˚
49˚
91˚
93˚95˚
97˚
99˚101˚103˚
92˚
92˚
48˚90˚
90˚
94˚
96˚98˚100˚102˚104˚
48˚
46˚
44˚
104˚ 102˚ 100˚98˚
96˚ 94˚ 92˚
46˚
44˚
N O R T H D A K O T A
M I N N E S O T A
S O U T H D A K O T A
Lakeof theWoods
Upper RedLake
Devils Lake
MilleLacsLake
Sakakawea
Lake
Oahe
Lower RedLake
Lake
Red
River
ofthe
North
Minnesota River
River
Mississippi
Missouri
River
River
Missouri
James
River
Big
SiouxR
iver
Water-Quality Characteristics 15
dized to nitrate, so nitrite concentrations in water generally are small.
The Red River is used by Fargo and Moorhead as a source of drinking water. The North Dakota water-quality standard for nitrate in drinking water is 10 milligrams per liter as N (North Dakota Department of Health, 1994). The Minnesota water-quality standard for nitrate in drinking water also is 10 milli-grams per liter as N (Minnesota Pollution Control Agency, accessed July 17, 2002). North Dakota also has a suggested guideline for nitrate of 1.0 milligram per liter as N (North Dakota Department of Health, 1991) to reduce the potential for nuisance algal growth.
The distribution of total nitrite plus nitrate in the upper Red River Basin is shown in figure 10. The median concentrations for all sites were less than the suggested guideline for nuisance algal growth, and all concentrations were less than the standards for drinking water. The largest median concentration was for site 11 (the Red River at Perley, Minn.). The median concentra-tion for site 8 (the Red River near Harwood, N. Dak.) was more than twice as large as the median concentration for site 7 (the Red River above Fargo, N. Dak.). The increase between the two sites probably was a result of wastewater discharges and urban runoff. The concentrations for site 9 (the Sheyenne River at Harwood, N. Dak.) were comparable to the concentrations for site 8.

Figure 10. Distribution of total nitrite plus nitrate in the upper Red River of the North Basin during May 1997 through September 1999.
1
20(5)
2
17(7)
3
6(1)
4
22(5)
5
21(4)
6
5(1)
7
21(2)
8
22(1)
9
21(1)
10
6(1)
11
Detection limit
21(0)
0.5
0.1
0.05
0.01
10
5
1
SITE
CON
CEN
TRAT
ION
, IN
MIL
LIGR
AMS
PER
LITE
R
21
(0)
EXPLANATION
Site number given in table 1
Number of values
Number of values at or belowdetection limit
Percentile--Percentage of analysesequal to or less than indicatedvalues. Sites 3, 6, and 10 are notincluded in data comparisons.
Maximum
75th percentile
Median
25th percentile
Minimum
16 Constituent Loads and Flow-Weighted Average Concentrations for the Upper Red River of the North Basin, 1997-99
The distribution of total ammonia in the upper Red River Basin is shown in figure 11. A small fraction of the nitrogen in the upper Red River Basin was in the ammonia form. This was expected because, in the presence of oxygen and nitrifying bac-teria, ammonia will be oxidized to nitrate. The largest median total ammonia concentration was for site 8. Among the tribu-tary sites, site 2 (the Bois de Sioux River near Doran, Minn.) and site 9 had the largest median concentrations. The concen-trations appeared to decrease slightly from site 4 (the Red River below Wahpeton, N. Dak.) to site 7 but then increased in a downstream direction from site 7 to site 8. The increase from site 7 to site 8 probably was a result of wastewater discharges from urban areas. Typically, wastewater discharge has large ammonia concentrations.
The distribution of total organic nitrogen in the upper Red River Basin is shown in figure 12. Much of the nitrogen com-
prising the total nitrogen was in the organic form. The median total organic nitrogen concentrations for all sites were greater than 0.5 milligram per liter as N. Among the tributary sites, site 2 had the largest median concentration. However, the median concentrations for the main-stem Red River sites were relatively constant, possibly indicating that much of the organic nitrogen from the tributary sites was being converted to nitrate in the main stem.
The distribution of total nitrogen in the upper Red River Basin is shown in figure 13. The smallest median concentration was for site 1 (the Otter Tail River above Breckenridge, Minn.), and the largest median concentration was for site 2. The median concentration increased substantially between site 7 and site 8. As indicated previously, the increase between the two sites probably was a result of ammonia and nitrate contributions from wastewater discharges. Generally, the total nitrogen con-

Figure 11. Distribution of total ammonia in the upper Red River of the North Basin during May 1997 through September 1999.
1
20(15)
2
17(7)
3
6(3)
4
21(6)
5
21(12)
6
5(4)
7
22(11)
8
22(2)
9
21(6)
10
6(3)
11
Detection limit
21(3)
0.5
0.1
0.05
0.01
0.005
0.001
1
SITE
CON
CEN
TRAT
ION
, IN
MIL
LIGR
AMS
PER
LITE
R
21
(3)
EXPLANATION
Site number given in table 1
Number of values
Number of values at or belowdetection limit
Percentile--Percentage of analysesequal to or less than indicatedvalues. Sites 3, 6, and 10 are notincluded in data comparisons.
Maximum
75th percentile
Median
25th percentile
Minimum
Water-Quality Characteristics 17
centrations and the median concentrations in the main stem Red River increased in a downstream direction.
Phosphorus
Phosphorus is required for plant growth and is essential for plant life. In the Red River, phosphorus is the limiting nutrient for algal growth. North Dakota has a suggested guideline for phosphorus of less than 0.1 milligram per liter as P (North Dakota Department of Health, 1991) to reduce the potential for nuisance algal growth.
The distribution of total phosphorus in the upper Red River Basin is shown in figure 14. Nearly all median concentrations exceeded the North Dakota suggested guideline of 0.1 milli-gram per liter. The largest median concentrations were for site 2
(the Bois de Sioux River near Doran, Minn.), site 9 (the Shey-enne River at Harwood, N. Dak.), and site 11 (the Red River at Perley, Minn.). The large concentrations for those sites may have been a result of runoff of phosphorus fertilizers from crop-land. The concentrations increased from site 7 (the Red River above Fargo, N. Dak.) to site 8 (the Red River near Harwood, N. Dak.), possibly as a result of wastewater discharges and urban runoff. Wastewater discharge has large phosphorus con-centrations and tends to increase phosphorus concentrations downstream from the outfall site. Generally, the total phospho-rus concentrations in the Red River increased in a downstream direction.
The distribution of dissolved phosphorus in the upper Red River Basin is shown in figure 15. The largest median concen-tration was for site 2. The increase from site 7 to site 8 may have been a result of wastewater discharges and urban runoff.

Figure 12. Distribution of total organic nitrogen in the upper Red River of the North Basin during May 1997 through September 1999.
1
20(0)
2
17(0)
3
6(0)
4
21(0)
5
21(0)
6
4(0)
7
21(0)
8
21(0)
9
21(0)
10
5(0)
11
21(0)
0
0.2
0.4
0.6
0.8
1.2
1.4
1.6
1.8
1
SITE
CON
CEN
TRAT
ION
, IN
MIL
LIGR
AMS
PER
LITE
R
21
(0)
EXPLANATION
Site number given in table 1
Number of values
Number of values at or belowdetection limit
Percentile--Percentage of analysesequal to or less than indicatedvalues. Sites 3, 6, and 10 are notincluded in data comparisons.
Maximum
75th percentile
Median
25th percentile
Minimum
18 Constituent Loads and Flow-Weighted Average Concentrations for the Upper Red River of the North Basin, 1997-99
The concentrations for site 9 were similar to the concentrations for site 8. Generally, the dissolved phosphorus concentrations increased in a downstream direction.
Dissolved phosphorus usually is considered to be that part of phosphorus that is available to plants, such as algae. There-fore, to control nuisance algal growth in streams, dissolved phosphorus concentrations should be less than 0.1 milligram per liter as P. The dissolved phosphorus concentrations for this study generally were greater than 0.1 milligram per liter as P except for site 1 (the Otter Tail River above Breckenridge, Minn.) and site 4 (the Red River below Wahpeton, N. Dak.). The fact that most of the dissolved phosphorus concentrations were greater than 0.1 milligram per liter indicates an abundant natural source of phosphorus in the basin and/or significant nonpoint sources of phosphorus from human activities.
Suspended Sediment
Sediment in surface waters may occur naturally from bank and upland soil erosion, especially during major rains and floods, or as a result of soil disturbances caused by construction and some agricultural practices. Channel modifications also can increase streambank erosion.
An increase in the amount of sediment in a stream can have adverse effects on the water quality of the stream. The sediment can carry nutrients and other constituents and, therefore, act as a transport mechanism that otherwise might not exist. Sediment transported by streams also can adversely affect aquatic ecosys-tems. Turbidity that results from increased suspended-sediment concentrations can reduce light penetration and, therefore, affect aquatic plants and algae, and deposition of the sediments

Figure 13. Distribution of total nitrogen in the upper Red River of the North Basin during May 1997 through September 1999.
1
20(0)
2
17(0)
3
6(0)
4
22(0)
5
21(0)
6
4(0)
7
21(0)
8
22(0)
9
21(0)
10
5(0)
11
21(0)
0.1
0.5
5
10
1
SITE
CON
CEN
TRAT
ION
, IN
MIL
LIGR
AMS
PER
LITE
R
21
(0)
EXPLANATION
Site number given in table 1
Number of values
Number of values at or belowdetection limit
Percentile--Percentage of analysesequal to or less than indicatedvalues. Sites 3, 6, and 10 are notincluded in data comparisons.
Maximum
75th percentile
Median
25th percentile
Minimum
Constituent Loads and Flow-Weighted Average Concentrations 19
possibly can change entire habitats. Nutrients, especially phos-phorus, transported on sediment and deposited in the stream-beds can be released and augment plant growth (Tornes and Brigham, 1994).
For this report, suspended sediment was divided into two classes, sand size (greater than 0.062 millimeter) and silt and clay size (less than 0.062 millimeter). Except for site 1 (the Otter Tail River above Breckenridge, Minn.), more than 95 per-cent of the suspended sediment in the streams was silt and clay.
The distribution of suspended sediment in the upper Red River Basin is shown in figure 16. The concentrations were rel-atively small for the upstream sites and gradually increased in a downstream direction. Site 9 (the Sheyenne River at Harwood, N. Dak.) had the largest median concentration.
Constituent Loads and Flow-Weighted Average Concentrations
Estimated annual loads were computed for eight primary water-quality sampling sites (sites 1, 2, 4, 5, 7, 8, 9, and 11) that had more than 2 years of data. The estimated annual loads for those sites then were used to compute estimated annual loads for five intervening reaches in the study area. The general meth-odology for computing estimated annual loads is described in the Methods section. Of the eight primary water-quality sam-pling sites, three [site 1 (the Otter Tail River above Brecken-ridge, Minn.); site 2 (the Bois de Sioux River near Doran, Minn.); and site 9 (the Sheyenne River at Harwood, N. Dak.)] are located on major tributaries of the Red River, and five [site 4 (the Red River below Wahpeton, N. Dak.); site 5 (the Red River at Hickson, N. Dak.); site 7 (the Red River above Fargo,

Figure 14. Distribution of total phosphorus in the upper Red River of the North Basin during May 1997 through September 1999.
1
20(0)
2
17(0)
3
6(0)
4
21(0)
5
20(0)
6
5(0)
7
23(0)
8
22(0)
9
21(0)
10
6(0)
11
21(0)
0
0.2
0.3
0.4
0.1
-0.1
0.5
0.6
0.7
SITE
CON
CEN
TRAT
ION
, IN
MIL
LIGR
AMS
PER
LITE
R
Detection limit
21
(0)
EXPLANATION
Site number given in table 1
Number of values
Number of values at or belowdetection limit
Percentile--Percentage of analysesequal to or less than indicatedvalues. Sites 3, 6, and 10 are notincluded in data comparisons.
Maximum
75th percentile
Median
25th percentile
Minimum
20 Constituent Loads and Flow-Weighted Average Concentrations for the Upper Red River of the North Basin, 1997-99
N. Dak.); site 8 (the Red River near Harwood, N. Dak.); and site 11 (the Red River at Perley, Minn.)] are located on the main stem of the Red River. The subbasins for the three major tribu-taries and the subbasins for the five intervening reaches parti-tioned the study area into eight disjoint subbasins (fig. 17). Each subbasin for the intervening reaches was defined as that part of the study area that contributed runoff and/or point-source dis-charge to a particular intervening reach of the Red River. The first intervening reach (R1) consisted of the reach downstream from sites 1 and 2 and upstream from site 4 and included Wah-peton. The second intervening reach (R2) consisted of the reach downstream from site 4 and upstream from site 5. The third intervening reach (R3) consisted of the reach downstream from site 5 and upstream from site 7 and included the Wild Rice River. The fourth intervening reach (R4) consisted of the reach downstream from site 7 and upstream from site 8 and included Fargo. The fifth intervening reach (R5) consisted of the reach
downstream from sites 8 and 9 and upstream from site 11 and included the Buffalo and Rush Rivers.
Because annual loads are largely dependent on stream-flow, the streamflows for the periods of record for the Red River at Fargo, N. Dak., streamflow-gaging station [05054000; 2 miles downstream from site 7; fig. 1] and the Sheyenne River at West Fargo, N. Dak., streamflow-gaging station [05059500; 11 miles upstream from site 9; fig. 1] were used to evaluate streamflow conditions for the study period (1997-99). Stream-flows for those two stations represent most of the flow for the study area. The streamflows for the two stations were much higher than normal during the study period. The annual mean streamflow for the Red River at Fargo station for the period of record (1901-99) was 657 cubic feet per second. The annual mean streamflows for water years 1997, 1998, and 1999 for that station were 2,655, 1,581, and 1,906 cubic feet per second,

Figure 15. Distribution of dissolved phosphorus in the upper Red River of the North Basin during May 1997 through September 1999.
1
20(5)
2
17(1)
3
6(1)
4
21(2)
5
21(4)
6
5(0)
7
22(1)
8
21(1)
9
21(0)
10
6(0)
11
21(1)
0
0.2
0.25
0.3
0.35
0.4
0.45
0.1
0.15
0.05
-0.05
SITE
CON
CEN
TRAT
ION
, IN
MIL
LIGR
AMS
PER
LITE
R
Detection limit
21
(1)
EXPLANATION
Site number given in table 1
Number of values
Number of values at or belowdetection limit
Percentile--Percentage of analysesequal to or less than indicatedvalues. Sites 3, 6, and 10 are notincluded in data comparisons.
Maximum
75th percentile
Median
25th percentile
Minimum
Constituent Loads and Flow-Weighted Average Concentrations 21
respectively, and were ranked as the 1st, 7th, and 4th highest streamflows on record. The annual mean streamflow for the Sheyenne River at West Fargo station for the period of record (1903-99) was 219 cubic feet per second. The annual mean streamflows for water years 1997, 1998, and 1999 for that sta-tion were 804, 478, and 787 cubic feet per second, respectively, and were ranked as the 1st, 8th, and 2nd highest streamflows on record.
The mean daily streamflows for water years 1997, 1998, and 1999 and the 25th and 75th percentiles of the historical mean daily streamflows are given in figure 18 for the Red River at Fargo station and in figure 19 for the Sheyenne River at West Fargo station. Generally, the mean daily streamflows for both stations were greater than the 75th percentiles of the historical mean daily streamflows. Therefore, the annual loads computed for this study may not be an accurate reflection of the loads for
normal or dry climatic conditions. For example, those parts of the basin that had the largest loads of some constituents during 1997-99 may not necessarily have the largest loads during nor-mal climatic conditions because the relative contribution of point sources and ground-water sources in relation to the contri-bution of nonpoint sources would be greater during normal climatic conditions than during the climatic conditions for 1997-99.
The annual streamflows and yields (streamflows divided by drainage areas) for each subbasin for water years 1998 and 1999 are given in table 3. Site 1 and reach R5 had the largest yields for those years, and site 2 and site 9 had the smallest yields. Reach R1 had a negative yield because of permitted water withdrawals from the Red River and natural channel losses or errors in streamflow values, and reach R4 had a nega-tive yield because of water withdrawals for Fargo and Moor-

Figure 16. Distribution of suspended sediment in the upper Red River of the North Basin during May 1994 through September 1999.[Because of the small number of samples collected during the sampling period, all data given in the U.S. Geological Survey NationalWater Information System database for 1994-99 were used.]
1
21(0)
2
29(0)
3
6(0)
4
21(0)
5
21(0)
6
5(0)
7
22(0)
8
21(0)
9
21(0)
10
6(0)
11
22(0)
0
100
500
50
10
5
1,000
SITE
CON
CEN
TRAT
ION
, IN
MIL
LIGR
AMS
PER
LITE
R
22
(0)
EXPLANATION
Site number given in table 1
Number of values
Number of values at or belowdetection limit
Percentile--Percentage of analysesequal to or less than indicatedvalues. Sites 3, 6, and 10 are notincluded in data comparisons.
Maximum
75th percentile
Median
25th percentile
Minimum
22 Constituent Loads and Flow-Weighted Average Concentrations for the Upper Red River of the North Basin, 1997-99
head public water supplies and natural channel losses or errors in streamflow values.
The streamflows given in table 3 for reaches R1, R2, and R4 are estimates that were obtained by subtracting a large upstream value from a large downstream value. For example, the 1998 streamflow (1,300,000 acre-feet) for site 7 was sub-tracted from the 1998 streamflow (1,260,000 acre-feet) for site 8 to obtain the 1998 streamflow (-40,000 acre-feet) for reach R4. If the actual streamflow for site 8 for 1998 was 2 percent greater than the reported streamflow (1,285,000 acre-feet instead of 1,260,000 acre-feet) and the actual streamflow for site 7 was 2 percent less than the reported streamflow (1,274,000 acre-feet instead of 1,300,000 acre-feet), the esti-mated streamflow for reach R4 would be 11,000 acre-feet
rather than -40,000 acre-feet. Therefore, because the estimated streamflows for reaches R1, R2, and R4 may be highly uncer-tain, flow-weighted average concentrations (defined later) for those reaches were not computed.
The results of the regression analysis for historical constit-uent concentrations and daily loads are given in table 1–1 in appendix 1, and the estimated annual loads for water years 1998 and 1999 are given in tables 1–2 through 1–9 in appendix 1. Estimator was used to compute the unbiased estimates of annual loads for each constituent and each primary water-quality sam-pling site and to compute the degree of uncertainty associated with each estimated annual load. The estimated annual loads for the upstream primary sites then were subtracted from the esti-

Figure 17. Disjoint subbasins used to compute estimated annual loads.
97˚00'
97˚00'
96˚30'
96˚30'
46˚30'46˚30'
47˚00'47˚00'
75
81
81
1010
75
59
94
94
29
29
210
108
18
46
18
18
27
11 11 55
13
9
9
9
32
113
Creek
Creek
Creek
Creek
Whiskey
Creek
Stony
Deerhorn
Creek
Wolverton
Whiskey
Antelope
Wild
Rice
River
River
River River
Riv
erP
elic
an
R.
Rabbit
Otter TailBois D
e Sioux
River
River
River
LowerRush
R.
Br.
River River
River
RE
DR
IVE
R
OF
THE
NORTHRiverBuffalo
Buffalo
Wild
Wild
SouthBranch
Rice
Rice
Elm
South Elm R.
Rush
Maple
Sheyenne
SouthB
ranchMapleton
FARGO MoorheadWestFargo
Harwood
HoraceWild Rice
Hickson
Abercrombie
Wahpeton Breckenridge
Barnesville
Doran
FergusFalls
Georgetown
Perley
CASS CO.
CASS CO.
RICHLAND CO.
RANSOM CO.
RANSOM CO.
CLAY CO.
CLAY CO. BECKER CO.NORMAN CO.
WILKIN CO.
WIL
KIN
CO
.
OT
TE
R T
AIL
CO
.
OTTER TAIL CO.
GRANT CO.
SARGENT CO.
TRAILL CO.
11
10
9 8
7
6
5
4
1
1
3
2
0 10 20 30 40 MILESBase from U.S. Geological Survey digital data, Universal Transverse Mercator Projection, North American Datum 1983
EXPLANATION
Subbasin boundary Water-quality sampling site and number
ReachR3
subbasin
Reach R5 subbasin
Reach R5 subbasinReach R4 subbasin
Site 9 subbasin
Site 1 subbasin
Reach R3 subbasin ReachR1
subbasin
Site2
subbasin
Reach R2 subbasin
Constituent Loads and Flow-Weighted Average Concentrations 23

1997
1998
1999
102050100
200
500
1,00
0
2,00
0
5,00
0
10,0
00
20,0
00
50,0
00
100,
000
Mea
n da
ily s
tream
flow
75th
per
cent
ile o
f his
toric
al m
ean
daily
stre
amflo
w
25th
per
cent
ile o
f his
toric
al m
ean
daily
stre
amflo
w
Wat
er-q
ualit
y sa
mpl
e
STREAMFLOW, IN CUBIC FEET PER SECOND
NO
DJ
FM
MJ
JA
SO
ND
AJ
FM
MJ
JA
SO
ND
AJ
FM
MJ
JA
SA
Figu
re 1
8.
Mea
n da
ily s
tream
flow
for t
he R
ed R
iver
of t
he N
orth
at F
argo
, Nor
th D
akot
a, s
tream
flow
-gag
ing
stat
ion
for w
ater
yea
rs 1
997,
199
8, a
nd 1
999.
24 Constituent Loads and Flow-Weighted Average Concentrations for the Upper Red River of the North Basin, 1997-99

1997
1998
1999
Mea
n da
ily s
tream
flow
75th
per
cent
ile o
f his
toric
al m
ean
daily
stre
amflo
w
25th
per
cent
ile o
f his
toric
al m
ean
daily
stre
amflo
w
Wat
er-q
ualit
y sa
mpl
e
STREAMFLOW, IN CUBIC FEET PER SECOND
NO
DJ
FM
MJ
JA
SO
ND
AJ
FM
MJ
JA
SO
ND
AJ
FM
MJ
JA
SA
Figu
re 1
9.
Mea
n da
ily s
tream
flow
for t
he S
heye
nne
Rive
r at W
est F
argo
, Nor
th D
akot
a, s
tream
flow
-gag
ing
stat
ion
for w
ater
yea
rs 1
997,
199
8, a
nd 1
999.
102050100
200
500
1,00
0
2,00
0
5,00
0
10,0
00
Constituent Loads and Flow-Weighted Average Concentrations 25

Table 3. Annual streamflows and yields in the upper Red River of the North Basin for water years 1998 and 1999.
[--, indicates negative yield]
Site number orintervening reach
designation(see figure 17)
Site name and reach description Water yearStreamflow(acre-feet)
Approximatecontributing
drainage area(square miles)
Yield(inches)
1 Otter Tail River above Breckenridge, Minn. 19981999
545,000661,000
1,970 5.26.3
2 Bois de Sioux River near Doran, Minn. 19981999
147,000165,000
1,880 1.51.6
R1 Intervening reach downstream from the Otter Tail River above Breckenridge, Minn., and the Bois de Sioux River near Doran, Minn., and upstream from the Red River of the North below Wahpeton, N. Dak.
19981999
- 26,000- 23,000
150 ----
4 Red River of the North below Wahpeton, N. Dak. 19981999
666,000803,000
4,000 3.13.8
R2 Intervening reach downstream from the Red River of the North below Wahpeton, N. Dak., and upstream from the Red River of the North at Hickson, N. Dak.
19981999
92,00024,000
300 5.81.5
5 Red River of the North at Hickson, N. Dak. 19981999
758,000827,000
4,300 3.33.6
R3 Intervening reach downstream from the Red River of the North at Hickson, N. Dak., and upstream from the Red River of the North above Fargo, N. Dak. (includes the Wild Rice River)
19981999
542,000313,000
2,500 4.12.3
7 Red River of the North above Fargo, N. Dak. 19981999
1,300,0001,140,000
6,800 3.43.1
R4 Intervening reach downstream from the Red River of the North above Fargo, N. Dak., and upstream from the Red River of the North near Harwood, N. Dak.
19981999
- 40,000- 40,000
180 ----
8 Red River of the North near Harwood, N. Dak. 19981999
1,260,0001,100,000
6,980 3.43.0
9 Sheyenne River at Harwood, N. Dak. 19981999
571,000936,000
6,980 1.52.5
R5 Intervening reach downstream from the Red River of the North near Harwood, N. Dak., and the Sheyenne River at Harwood, N. Dak., and upstream from the Red River of the North at Perley, Minn. (includes the Buffalo and Rush Rivers)
19981999
403,000280,000
1,140 6.64.6
11 Red River of the North at Perley, Minn. 19981999
2,230,0002,320,000
15,100 2.82.9
26 Constituent Loads and Flow-Weighted Average Concentrations for the Upper Red River of the North Basin, 1997-99

Constituent Loads and Flow-Weighted Average Concentrations 27
mated annual loads for the downstream primary sites to com-pute the estimated annual loads for the intervening reaches.
The degree of uncertainty in the estimated annual loads depends on the variability of the concentration data, the number of samples collected, and the ability of the multiple regression model to explain the variability of the concentration data given daily streamflow and seasonality. As indicated in tables 1–2 through 1–9, the estimated annual loads for some constituent-site combinations are highly uncertain. For example, the esti-mation error (the difference between the estimated and actual annual loads) for total nitrite plus nitrate and ammonia may have exceeded 100 percent of the estimated annual load at most sites. The estimated annual loads for the intervening reaches are even more uncertain than the estimated annual loads for the pri-mary sites because estimation errors for both the upstream and downstream primary sites contributed to the estimation errors for the intervening reaches. Therefore, to reduce uncertainty in the estimated annual loads, the loads for 1998 and 1999 were combined to obtain an estimated average annual load for 1998-99. The estimated average annual loads rather than the loads for the individual water years are given in tables 1–2 through 1–9 and discussed in this section.
Uncertainty is quantified in terms of the upper and lower 90-percent confidence limits for the actual annual load. The confidence limits were computed as described in appendix 1 and were interpreted using equation 1,
Prob L Lu≤[ ] 0.90 Prob L Ll≥[ ]; 0.90,= = (1)
where
Prob denotes probability;
L is the actual annual load, in tons per year;
Lu is the upper 90-percent confidence limit; and
Ll is the lower 90-percent confidence limit.
The upper confidence limit is useful for determining which subbasins may have contributed a large load to the Red River although the estimated annual load for the subbasin may be small. For example, if the estimated annual load of a particular constituent is 10 tons per year but the upper confidence limit is 100 tons per year, the actual annual load may be much larger than the estimated annual load. The upper confidence limit also is useful for determining which subbasins probably did not con-tribute a large load. For example, if the estimated annual load is 10 tons per year and the upper confidence limit is 12 tons per year, the chance that the actual annual load is less than 12 tons per year is 90 percent. In both examples, the estimated annual load is 10 tons per year but the upper confidence limit provides more information on how large the actual annual load may be.
The lower confidence limit is useful for determining which subbasins probably contributed a large load to the Red River.
For example, if the estimated annual load is 100 tons per year and the lower confidence limit is 90 tons per year, the actual annual load probably is large. However, if the estimated annual load is 100 tons per year but the lower confidence limit is 10 tons per year, the actual annual load may be small. Because the confidence limits for the primary sites could not be used to directly compute confidence limits for the intervening reaches, the confidence limits for the reaches were computed as described in appendix 1.
Basins that have large loads do not necessarily have poor water quality (as indicated by large constituent concentrations). Given two basins that have similar loads but different stream-flows, the basin that has the higher streamflows will have more dilution and, therefore, smaller constituent concentrations than the basin that has the lower streamflows. Therefore, to compare the relative water quality of different subbasins, an estimated FWA concentration was computed by dividing the estimated average annual load for the subbasin by the average annual streamflow and then multiplying the quotient by an appropriate conversion factor. The estimated FWA concentration was com-puted using equation 2,
C LQ----⎝ ⎠
⎛ ⎞ 735.3,= (2)
where
C is the estimated FWA concentration, in milligrams per liter;
L is the estimated average annual load, in tons per year; and
Q is the average annual streamflow, in acre-feet per year.
The FWA concentration is an overall measure of water quality in a basin and is a weighted average of daily concentrations in which the weight assigned to a given day is proportional to daily streamflow. If streamflow was constant day after day, the FWA concentration would equal the average annual concentration. However, because streamflow is not constant, the FWA con-centration may not equal the average annual concentration. If concentrations tend to be larger during high flow than during low flow, the FWA concentration will be larger than the aver-age annual concentration. If concentrations tend to be smaller during high flow than during low flow, the FWA concentration will be smaller than the average annual concentration.
Estimated annual loads and FWA concentrations for dis-solved solids, nutrients, and suspended sediment are shown in figures 20 through 27 along with the 90-percent upper and lower confidence limits for the constituents. The confidence limits for the annual loads (eq. 1) were computed as described in appendix 1, and the confidence limits for the FWA concen-trations were obtained by substituting the confidence limits for the loads in equation 2. Constituent loads for the main-stem

Figure 20. Estimated annual dissolved-solids loads and flow-weighted average concentrations for 1998-99 (loads not shown formain-stem sites).
EXPLANATION
Not available because of high uncertainty
Main-stem site
Upper 90-percent confidence limit
Estimated value
Lower 90-percent confidence limit
Tributary site or intervening reach
Upper 90-percent confidence limit
Estimated value
Lower 90-percent confidence limit
-100
0
100
200
300
400
500
600LO
AD, I
N T
HOUS
AND
TON
S PE
R YE
AR
SITE NUMBER OR INTERVENING REACH DESIGNATION
FLOW
-WEI
GHTE
D AV
ERAG
E CO
NCE
NTR
ATIO
N,
IN M
ILLI
GRAM
S PE
R LI
TER
01 2 R1 4 R2 5 R3 7 R4 8 9 R5 11
100
200
300
400
500
600
700
NA
NA NANA
28 Constituent Loads and Flow-Weighted Average Concentrations for the Upper Red River of the North Basin, 1997-99
sites were expected to increase in a downstream direction because the loads for the tributary sites are being accumulated. Therefore, constituent loads for the main-stem sites (sites 4, 5, 7, 8, and 11) are not shown in figures 20 through 27. Also, the FWA concentrations for reaches R1, R2, and R4 were not com-puted because high uncertainty in streamflows and loads for those reaches made it difficult to interpret the FWA concentra-tions.
Dissolved Solids
Among the tributary sites and intervening reaches, site 9 (the Sheyenne River at Harwood, N. Dak.) had the largest esti-mated annual dissolved-solids load (about 570,000 tons per year) (fig. 20). The load for site 9 was followed by the load (about 340,000 tons per year) for reach R3. Site 1 (the Otter Tail River above Breckenridge, Minn.), site 2 (the Bois de Sioux River near Doran, Minn.), and reach R5 also had substan-tial loads (between about 100,000 and 200,000 tons per year).
The largest estimated FWA concentration for dissolved solids (about 630 milligrams per liter) for the tributary sites and intervening reaches was for site 2 (fig. 20). The concentration for that site was followed by the concentration (about 580
milligrams per liter) for reach R3 and the concentration (about 560 milligrams per liter) for site 9. Site 1 had the smallest con-centration (about 240 milligrams per liter). The estimated con-centration for reach R5 was highly uncertain; confidence limits for that reach ranged from about 170 to 440 milligrams per liter. Although the concentrations for reaches R1 and R4 were not computed, the yields (loads per acre of drainage area) for those reaches were large compared to the yields for the tributary sites. The estimated load for reach R1 was about 30 percent of the estimated load for site 2, but the drainage area for reach R1 is only about 8 percent of the drainage area for site 2 (table 3).
The estimated FWA concentrations for dissolved solids for the main-stem sites ranged from about 300 to 500 milligrams per liter and generally increased in a downstream direction (fig. 20). Most of the increase resulted from the large concentra-tions for sites 2 and 9. The concentration increased substantially between site 5 (the Red River at Hickson, N. Dak.) and site 7 (the Red River above Fargo, N. Dak.) as a result of flow from reach R3 and also increased between site 7 and site 8 (the Red River near Harwood, N. Dak.). The increase in concentration between site 7 and site 8 resulted from a decrease in flow in reach R4 (table 3) and the large yield of dissolved solids from that reach. The concentration remained relatively constant from site 8 to site 11 (the Red River at Perley, Minn.) because the

LOAD
, IN
TON
S PE
R YE
ARFL
OW-W
EIGH
TED
AVER
AGE
CON
CEN
TRAT
ION
,IN
MIL
LIGR
AMS
PER
LITE
R
Figure 21. Estimated annual total nitrite plus nitrate loads and flow-weighted average concentrations for 1998-99 (loads notshown for main-stem sites).
-400
0
400
800
1,200
1,600
2,000
2,400
SITE NUMBER OR INTERVENING REACH DESIGNATION
01 2 R1 4 R2 5 R3 7 R4 8 9 R5 11
0.4
0.8
1.2
1.6
2
2.4
2.8
NA NANA
EXPLANATION
Not available because of high uncertainty
Main-stem site
Upper 90-percent confidence limit
Estimated value
Lower 90-percent confidence limit
Tributary site or intervening reach
Upper 90-percent confidence limit
Estimated value
Lower 90-percent confidence limit
NA
Constituent Loads and Flow-Weighted Average Concentrations 29
large concentration for site 9 was offset by the small concentra-tion for reach R5.
Nutrients
Nitrogen
Total Nitrite Plus Nitrate
The estimated annual total nitrite plus nitrate loads for the tributary sites and intervening reaches were highly uncertain (fig. 21). Among the tributary sites and intervening reaches, site 9 (the Sheyenne River at Harwood, N. Dak.) had the largest estimated load (about 1,400 tons per year). However, the confi-dence limits for that site ranged from less than 800 to more than 2,000 tons per year. The estimated load for site 9 was followed by the estimated loads (more than 500 tons per year) for reaches R3 and R5. However, the confidence limits for those reaches ranged from near zero to about 1,200 tons per year. Estimated loads for the remaining tributary sites and interven-ing reaches were less than 200 tons per year, and the upper con-fidence limits were less than 400 tons per year. The estimate (about 60 tons per year) for site 1 (the Otter Tail River above
Breckenridge, Minn.) was the most precise estimate; confi-dence limits for that site ranged from about 40 to 80 tons per year.
The estimated FWA concentrations for total nitrite plus nitrate for the tributary sites and intervening reaches also were highly uncertain (fig. 21). Site 2 (the Bois de Sioux River near Doran, Minn.), reach R3, site 9, and reach R5 had the largest estimated concentrations (between about 0.8 and 1.4 milligrams per liter), and the upper confidence limits for those sites and reaches were greater than 1.9 milligrams per liter. However, the lower confidence limits for site 2, reach R3, and reach R5 indi-cated the actual FWA concentrations for that site and those reaches may be small (less than 0.2 milligram per liter). Site 1 had the smallest, and most precise, estimated FWA concentra-tion (about 0.07 milligram per liter). Although the concentra-tions for reaches R2 and R4 were not computed, the yields for those reaches may have been large compared to the yields for the tributary sites; the upper confidence limits for the estimated loads for both reaches were greater than 200 tons per year. Therefore, a significant localized source of nitrate may exist in those reaches.
The estimated FWA concentrations for total nitrite plus nitrate for the main-stem sites increased from about 0.2 milli-
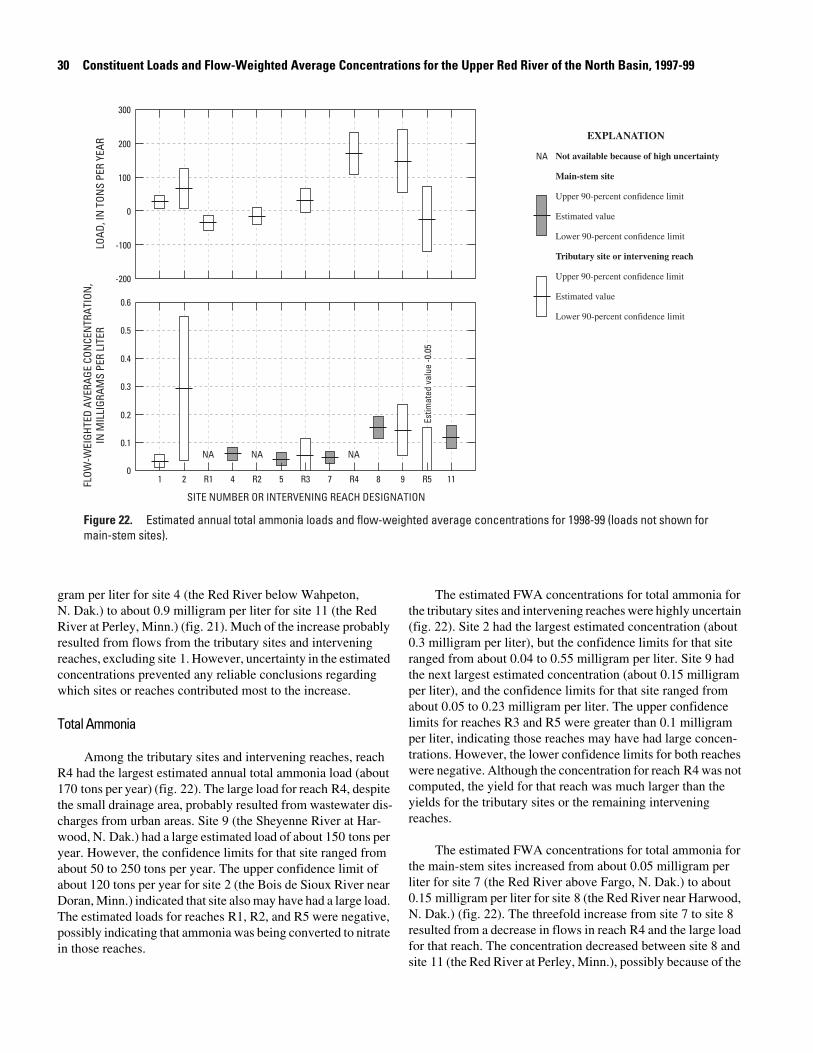
Figure 22. Estimated annual total ammonia loads and flow-weighted average concentrations for 1998-99 (loads not shown formain-stem sites).
-100
-200
0
100
200
300LO
AD, I
N T
ONS
PER
YEAR
SITE NUMBER OR INTERVENING REACH DESIGNATION
FLOW
-WEI
GHTE
D AV
ERAG
E CO
NCE
NTR
ATIO
N,
IN M
ILLI
GRAM
S PE
R LI
TER
01 2 R1 4 R2 5 R3 7 R4 8 9 R5 11
0.1
0.2
0.3
0.4
0.5
0.6
NA NANA
EXPLANATION
Not available because of high uncertainty
Main-stem site
Upper 90-percent confidence limit
Estimated value
Lower 90-percent confidence limit
Tributary site or intervening reach
Upper 90-percent confidence limit
Estimated value
Lower 90-percent confidence limit
NA
Estim
ated
val
ue -0
.05
30 Constituent Loads and Flow-Weighted Average Concentrations for the Upper Red River of the North Basin, 1997-99
gram per liter for site 4 (the Red River below Wahpeton, N. Dak.) to about 0.9 milligram per liter for site 11 (the Red River at Perley, Minn.) (fig. 21). Much of the increase probably resulted from flows from the tributary sites and intervening reaches, excluding site 1. However, uncertainty in the estimated concentrations prevented any reliable conclusions regarding which sites or reaches contributed most to the increase.
Total Ammonia
Among the tributary sites and intervening reaches, reach R4 had the largest estimated annual total ammonia load (about 170 tons per year) (fig. 22). The large load for reach R4, despite the small drainage area, probably resulted from wastewater dis-charges from urban areas. Site 9 (the Sheyenne River at Har-wood, N. Dak.) had a large estimated load of about 150 tons per year. However, the confidence limits for that site ranged from about 50 to 250 tons per year. The upper confidence limit of about 120 tons per year for site 2 (the Bois de Sioux River near Doran, Minn.) indicated that site also may have had a large load. The estimated loads for reaches R1, R2, and R5 were negative, possibly indicating that ammonia was being converted to nitrate in those reaches.
The estimated FWA concentrations for total ammonia for the tributary sites and intervening reaches were highly uncertain (fig. 22). Site 2 had the largest estimated concentration (about 0.3 milligram per liter), but the confidence limits for that site ranged from about 0.04 to 0.55 milligram per liter. Site 9 had the next largest estimated concentration (about 0.15 milligram per liter), and the confidence limits for that site ranged from about 0.05 to 0.23 milligram per liter. The upper confidence limits for reaches R3 and R5 were greater than 0.1 milligram per liter, indicating those reaches may have had large concen-trations. However, the lower confidence limits for both reaches were negative. Although the concentration for reach R4 was not computed, the yield for that reach was much larger than the yields for the tributary sites or the remaining intervening reaches.
The estimated FWA concentrations for total ammonia for the main-stem sites increased from about 0.05 milligram per liter for site 7 (the Red River above Fargo, N. Dak.) to about 0.15 milligram per liter for site 8 (the Red River near Harwood, N. Dak.) (fig. 22). The threefold increase from site 7 to site 8 resulted from a decrease in flows in reach R4 and the large load for that reach. The concentration decreased between site 8 and site 11 (the Red River at Perley, Minn.), possibly because of the

LOAD
, IN
TON
S PE
R YE
ARFL
OW-W
EIGH
TED
AVER
AGE
CON
CEN
TRAT
ION
,IN
MIL
LIGR
AMS
PER
LITE
R
Figure 23. Estimated annual total organic nitrogen loads and flow-weighted average concentrations for 1998-99 (loads notshown for main-stem sites).
-200
0
400
800
600
200
SITE NUMBER OR INTERVENING REACH DESIGNATION
01 2 R1 4 R2 5 R3 7 R4 8 9 R5 11
0.4
0.2
0.8
0.6
1.2
1
NA NANA
EXPLANATION
Not available because of high uncertainty
Main-stem site
Upper 90-percent confidence limit
Estimated value
Lower 90-percent confidence limit
Tributary site or intervening reach
Upper 90-percent confidence limit
Estimated value
Lower 90-percent confidence limit
NA
Constituent Loads and Flow-Weighted Average Concentrations 31
small concentration for reach R5 or because ammonia was being converted to nitrate in that reach.
Total Organic Nitrogen
Among the tributary sites and intervening reaches, reach R3 and site 9 (the Sheyenne River at Harwood, N. Dak.) had the largest estimated annual total organic nitrogen loads (about 600 tons per year) (fig. 23). Site 1 (the Otter Tail River above Breckenridge, Minn.), site 2 (the Bois de Sioux River near Doran, Minn.), and reach R5 also had substantial loads (between about 200 and 400 tons per year). Reach R1 had a load of about 50 tons per year despite its small drainage area. Reaches R2 and R4 had negative estimated loads, possibly indi-cating organic nitrogen was being converted to nitrate in those reaches.
The largest estimated FWA concentration for total organic nitrogen (about 1 milligram per liter) for the tributary sites and intervening reaches was for reach R3 (fig. 23). The concentra-tion for that reach was followed by the concentration (about 0.9 milligram per liter) for site 2. The concentrations for sites 1 and 9 (about 0.5 and 0.6 milligram per liter, respectively) were relatively small despite the large loads for those sites. The esti-mated concentration for reach R5 was the most uncertain; con-
fidence limits for that reach ranged from about 0.45 to 0.9 milligram per liter. Although the concentration for reach R1 was not computed, the yield for that reach may have been large compared to the yields for the tributary sites. Therefore, a sig-nificant localized source of organic nitrogen may exist in that reach.
The estimated FWA concentrations for total organic nitro-gen for the main-stem sites were relatively constant and ranged from about 0.5 to 0.7 milligram per liter (fig. 23). The relatively constant concentrations were in sharp contrast to the total nitrite plus nitrate concentrations (fig. 21), which increased about fivefold between site 4 (the Red River below Wahpeton, N. Dak.) and site 11 (the Red River at Perley, Minn.). The con-centration for total organic nitrogen increased between site 5 (the Red River at Hickson, N. Dak.) and site 7 (the Red River above Fargo, N. Dak.) as a result of flow from reach R3. How-ever, the concentration decreased slightly from site 7 to site 11.
Total Nitrogen
Among the tributary sites and intervening reaches, site 9 (the Sheyenne River at Harwood, N. Dak.) had the largest esti-mated annual total nitrogen load (about 1,600 tons per year) (fig. 24). The load for site 9 was followed by the load (about

Figure 24. Estimated annual total nitrogen loads and flow-weighted average concentrations for 1998-99 (loads not shown formain-stem sites).
-400
0
400
800
1,200
1,600
2,000LO
AD, I
N T
ONS
PER
YEAR
SITE NUMBER OR INTERVENING REACH DESIGNATION
FLOW
-WEI
GHTE
D AV
ERAG
E CO
NCE
NTR
ATIO
N,
IN M
ILLI
GRAM
S PE
R LI
TER
0
1
2
3
4
1 2 R1 4 R2 5 R3 7 R4 8 9 R5 11
NA NANA
EXPLANATION
Not available because of high uncertainty
Main-stem site
Upper 90-percent confidence limit
Estimated value
Lower 90-percent confidence limit
Tributary site or intervening reach
Upper 90-percent confidence limit
Estimated value
Lower 90-percent confidence limit
NA
32 Constituent Loads and Flow-Weighted Average Concentrations for the Upper Red River of the North Basin, 1997-99
1,400 tons per year) for reach R5 and the load (about 900 tons per year) for reach R3. Site 1 (the Otter Tail River above Breck-enridge, Minn.) and site 2 (the Bois de Sioux River near Doran, Minn.) had loads of about 500 and 300 tons per year, respec-tively. Reaches R1, R2, and R4 may have had substantial loads despite the small drainage areas for those reaches. For example, the upper confidence limit of about 300 tons per year for reach R4 was comparable to the estimated load for site 2.
The largest estimated FWA concentration for total nitro-gen (about 2.9 milligrams per liter) was for reach R5 (fig. 24). The lower confidence limit for that reach was about 2 milli-grams per liter. The estimated concentrations for site 2, reach R3, and site 9 were similar; confidence limits for those sites and that reach ranged from about 1.3 to 1.8 milligrams per liter. Site 1 had the smallest concentration (about 0.6 milligram per liter).
The estimated FWA concentrations for total nitrogen for the main-stem sites increased from about 0.9 milligram per liter for site 5 (the Red River at Hickson, N. Dak.) to about 1.6 milligrams per liter for site 11 (the Red River at Perley, Minn.) (fig. 24). Much of the increase probably resulted from the large concentrations for reach R3, site 9, and reach R5. However, the concentration also increased slightly between site 7 (the Red
River above Fargo, N. Dak.) and site 8 (the Red River near Har-wood, N. Dak.), indicating a large yield of total nitrogen from reach R4 also may have contributed to the increase between site 5 and site 11.
The actual load for total nitrogen consists of the sum of the actual loads for total nitrite plus nitrate, total ammonia, and total organic nitrogen. Therefore, the results for total nitrogen should be consistent with the results for those constituents. However, the sum of the estimated loads for total nitrite plus nitrate, total ammonia, and total organic nitrogen does not equal the esti-mated load for total nitrogen. Therefore, uncertainty in the esti-mated loads must be considered when determining the consis-tency of the results. Considering uncertainty, most (about 0.8 milligram per liter) of the approximately 1-milligram-per-liter increase in the FWA concentration for total nitrogen (from about 0.6 milligram per liter for site 1 to about 1.6 milligrams per liter for site 11) (fig. 24) probably resulted from large total nitrite plus nitrate concentrations in tributary inflows (inflows from the Bois de Sioux, Wild Rice, Sheyenne, Buffalo, and Rush Rivers) and/or localized sources of nitrate in one or more of reaches R2, R3, R4, and R5 (fig. 21). Part of the increase (about 0.1 milligram per liter) probably resulted from point sources of ammonia in reach R4 (fig. 22), and the remainder of the increase (about 0.1 milligram per liter) probably resulted

LOAD
, IN
TON
S PE
R YE
ARFL
OW-W
EIGH
TED
AVER
AGE
CON
CEN
TRAT
ION
,IN
MIL
LIGR
AMS
PER
LITE
R
Figure 25. Estimated annual total phosphorus loads and flow-weighted average concentrations for 1998-99 (loads not shown formain-stem sites).
-100
0
100
200
300
400
600
500
SITE NUMBER OR INTERVENING REACH DESIGNATION
01 2 R1 4 R2 5 R3 7 R4 8 9 R5 11
0.4
0.2
0.8
0.6
1
NA NANA
EXPLANATION
Not available because of high uncertainty
Main-stem site
Upper 90-percent confidence limit
Estimated value
Lower 90-percent confidence limit
Tributary site or intervening reach
Upper 90-percent confidence limit
Estimated value
Lower 90-percent confidence limit
NA
Constituent Loads and Flow-Weighted Average Concentrations 33
from large organic nitrogen concentrations in tributary inflows (primarily inflows from the Bois de Sioux and Wild Rice Rivers) and/or localized sources of organic nitrogen in reaches R1, R3, and R5 (fig. 23).
Phosphorus
Total Phosphorus
Among the tributary sites and intervening reaches, site 9 (the Sheyenne River at Harwood, N. Dak.) had the largest esti-mated annual total phosphorus load (about 500 tons per year) (fig. 25). Reach R5 had the next largest estimated load (about 200 tons per year), but the confidence limits for that reach ranged from near zero to more than 400 tons per year. Site 1 (the Otter Tail River above Breckenridge, Minn.), site 2 (the Bois de Sioux River near Doran, Minn.), and reach R3 also had substantial loads (between about 50 and 160 tons per year). Reach R2 had a load of about 80 tons per year, and reach R4 had a load of about 30 tons per year despite the small drainage areas for those reaches. The estimated load for reach R2 was larger than the estimated load for site 2 and comparable to the estimated load for site 1.
The largest estimated FWA concentration for total phos-phorus (about 0.5 milligram per liter) for the tributary sites and intervening reaches was for site 9 (fig. 25). The estimated con-centration for reach R5 was highly uncertain; confidence limits for that reach ranged from less than zero to about 0.9 milligram per liter. Site 2 and reach R3 had large concentrations of about 0.2 and 0.3 milligram per liter, respectively. Site 1 had the smallest concentration (about 0.1 milligram per liter). Although the concentrations for reaches R2 and R4 were not computed, the yields for those reaches were large compared to the yields for the tributary sites.
The estimated FWA concentrations for total phosphorus for the main-stem sites increased from about 0.15 milligram per liter for site 4 (the Red River below Wahpeton, N. Dak.) to about 0.35 milligram per liter for site 11 (the Red River at Per-ley, Minn.) (fig. 25). Most of the increase probably resulted from the large yield of total phosphorus from reach R2 [as indi-cated by the increase in concentration between site 4 and site 5 (the Red River at Hickson, N. Dak.)] and the large concentra-tions for site 9 and possibly reach R5 [as indicated by the increase in concentration between site 8 (the Red River near Harwood, N. Dak.) and site 11].

Figure 26. Estimated annual dissolved phosphorus loads and flow-weighted average concentrations for 1998-99 (loads notshown for main-stem sites).
-100
0
100
200
300
400LO
AD, I
N T
ONS
PER
YEAR
SITE NUMBER OR INTERVENING REACH DESIGNATION
FLOW
-WEI
GHTE
D AV
ERAG
E CO
NCE
NTR
ATIO
N,
IN M
ILLI
GRAM
S PE
R LI
TER
01 2 R1 4 R2 5 R3 7 R4 8 9 R5 11
0.1
0.2
0.3
0.4
0.5
0.6
0.7
NA NANA
EXPLANATION
Not available because of high uncertainty
Main-stem site
Upper 90-percent confidence limit
Estimated value
Lower 90-percent confidence limit
Tributary site or intervening reach
Upper 90-percent confidence limit
Estimated value
Lower 90-percent confidence limit
NA
34 Constituent Loads and Flow-Weighted Average Concentrations for the Upper Red River of the North Basin, 1997-99
Dissolved Phosphorus
Among the tributary sites and intervening reaches, site 9 (the Sheyenne River at Harwood, N. Dak.) had the largest esti-mated annual dissolved phosphorus load (about 200 tons per year) (fig. 26). The estimated load for site 9 was followed by the estimated load (about 180 tons per year) for reach R5. How-ever, the confidence limits for reach R5 ranged from about 40 to more than 300 tons per year. The estimated load for reach R3 was about 170 tons per year. Site 1 (the Otter Tail River above Breckenridge, Minn.), site 2 (the Bois de Sioux River near Doran, Minn.), reach R1, and reach R2 also had substantial esti-mated loads (between about 25 and 50 tons per year). Although the lower confidence limits for reaches R1 and R2 were near zero, the loads for those reaches may have been large despite the small drainage areas.
The largest estimated FWA concentration for dissolved phosphorus (about 0.4 milligram per liter) for the tributary sites and intervening reaches was for reach R5 (fig. 26). However, the confidence limits for that reach ranged from less than 0.1 to about 0.7 milligram per liter. Site 2, reach R3, and site 9 also had large estimated concentrations (between about 0.2 and 0.3 milligram per liter). The lower confidence limits for those sites and that reach were greater than 0.16 milligram per liter.
The smallest concentration (about 0.03 milligram per liter) was for site 1. Although the concentrations for reaches R1 and R2 were not computed, the yields for those reaches may have been large compared to the yields for the tributary sites.
The estimated FWA concentrations for dissolved phos-phorus for the main-stem sites increased from about 0.1 milli-gram per liter for site 4 (the Red River below Wahpeton, N. Dak.) to about 0.2 milligram per liter for site 11 (the Red River at Perley, Minn.) (fig. 26). Most of the increase probably resulted from the large concentrations for reach R3, site 9, and possibly reach R5. A large yield from reach R2 also may have contributed to the increase, but uncertainty in the yield for that reach prevented any reliable conclusion. Reach R4 had a nega-tive yield that may have resulted from water withdrawals from the reach or that may indicate dissolved phosphorus became attached to particulate matter and was filtered out of the sample before the dissolved phosphorus concentration was determined.
The total phosphorus load should be greater than the dis-solved phosphorus load because the total phosphorus concen-tration is determined from whole-water samples and the dis-solved phosphorus concentration is determined from filtered water samples. However, as indicated previously for total nitro-gen, the estimated loads need not satisfy the same constraints as

LOAD
, IN
THO
USAN
D TO
NS
PER
YEAR
FLOW
-WEI
GHTE
D AV
ERAG
E CO
NCE
NTR
ATIO
N,
IN M
ILLI
GRAM
S PE
R LI
TER
Figure 27. Estimated annual suspended-sediment loads and flow-weighted average concentrations for 1998-99 (loads notshown for main-stem sites).
-100
0
400
300
100
200
300
400
500
600
700
200
100
SITE NUMBER OR INTERVENING REACH DESIGNATION
01 2 R1 4 R2 5 R3 7 R4 8 9 R5 11
NA NANA
EXPLANATION
Not available because of high uncertainty
Main-stem site
Upper 90-percent confidence limit
Estimated value
Lower 90-percent confidence limit
Tributary site or intervening reach
Upper 90-percent confidence limit
Estimated value
Lower 90-percent confidence limit
NA
Constituent Loads and Flow-Weighted Average Concentrations 35
the actual loads. Considering uncertainty in the estimated loads and comparing the total phosphorus loads (fig. 25) and the dis-solved phosphorus loads (fig. 26), most of the total phosphorus load for site 2, reach R3, and reach R5 appears to have been in the dissolved form. However, most of the total phosphorus load for site 1, reach R4, site 9, and possibly reach R2 appears to have been in the particulate form. For reach R1, the estimated total phosphorus load was negative but the estimated dissolved phosphorus load was positive. Therefore, the results for that reach are anomalous. The apparent anomaly may reflect uncer-tainty because the actual loads for reach R1 were small. For reach R4, the negative estimated dissolved phosphorus load and the positive estimated total phosphorus load may indicate a large yield of phosphorus-bearing particulate matter or sus-pended sediment occurred in this reach and, in turn, adsorbed some of the dissolved phosphorus.
For the tributary sites and intervening reaches, the ratio of the dissolved phosphorus load to the total phosphorus load (and, therefore, the corresponding ratio of the FWA concentrations) varied considerably. Moreover, phosphorus may have been changing back and forth between the dissolved and particulate forms. For the main-stem sites, the estimated FWA concentra-tion for dissolved phosphorus, as a percentage of the estimated FWA concentration for total phosphorus, was relatively con-
stant at about 65 percent (the concentrations ranged from about 60 to 70 percent). Although the relatively constant ratio between dissolved and total phosphorus concentrations for the main-stem sites may have been coincidental, it also may indi-cate that the ratio of dissolved to total phosphorus in the main stem reached an equilibrium value of about 65 percent.
Suspended Sediment
Among the tributary sites and intervening reaches, site 9 (the Sheyenne River at Harwood, N. Dak.) had the largest esti-mated annual suspended-sediment load (about 320,000 tons per year) (fig. 27). Reach R3 had a large estimated load of about 160,000 tons per year, and the confidence limits for that reach ranged from about 100,000 to 200,000 tons per year. Reach R5 also had a large estimated load of about 160,000 tons per year, but the confidence limits for that reach ranged from near zero to about 300,000 tons per year. Reach R2 had a large load despite its small drainage area; the lower confidence limit of about 90,000 tons per year for that reach was larger than the estimated load for either site 1 (the Otter Tail River above Breckenridge, Minn.) or site 2 (the Bois de Sioux River near Doran, Minn.). Reach R4 had a large estimated load of about 60,000 tons per

36 Constituent Loads and Flow-Weighted Average Concentrations for the Upper Red River of the North Basin, 1997-99
year despite its small drainage area, but the estimate for that reach was highly uncertain.
The largest estimated FWA concentration for suspended sediment (about 340 milligrams per liter) for the tributary sites and intervening reaches was for reach R5 (fig. 27). Reach R3 and site 9 had large estimated concentrations of about 280 and 320 milligrams per liter, respectively. The estimated concentra-tion for reach R5 was highly uncertain; confidence limits for that reach ranged from about 20 to 650 milligrams per liter. Sites 1 and 2 had small concentrations (less than 100 milligrams per liter). Although the concentration for reach R2 was not computed, the yield for that reach was much larger than the yields for the tributary sites. Therefore, a significant localized source of suspended sediment probably exists in reach R2. Sim-ilarly, the yield for reach R4 may have been much larger than the yields for the tributary sites.
The estimated FWA concentrations for suspended sedi-ment for the main-stem sites increased from about 50 milli-grams per liter for site 4 (the Red River below Wahpeton, N. Dak.) to about 300 milligrams per liter for site 11 (the Red River at Perley, Minn.) (fig. 27). Much of the increase occurred between site 4 and site 5 (the Red River at Hickson, N. Dak.) as a result of the large yield of suspended sediment from reach R2. The concentration between sites 4 and 5 increased from about 50 milligrams per liter for site 4 to about 160 milligrams per liter for site 5. The concentrations continued to increase down-stream from site 5 as a result of the large suspended-sediment concentrations in the tributary flows and possibly a large yield of suspended sediment from reach R4.
The patterns in the estimated loads (or FWA concentra-tions) for total phosphorus (fig. 25) and suspended sediment (fig. 27) were similar. Because phosphorus typically is trans-ported with suspended sediment, the large yield of total phos-phorus from reach R2 may have resulted, in part, from a large yield of suspended sediment from that reach.
Summary
Data were collected at 11 water-quality sampling sites in the upper Red River of the North (Red River) Basin from May 1997 through September 1999 to describe the water-quality characteristics of the upper Red River and to estimate constitu-ent loads and flow-weighted average concentrations for major tributaries of the Red River. For this report, the upper Red River Basin is defined as the drainage area upstream from the bridge crossing the Red River at Perley, Minn. About 20 samples were collected from each of 8 sites during the study period, and about 6 samples were collected from each of 3 additional sites. The samples were analyzed for 5-day biochemical oxygen demand, bacteria, dissolved solids, nutrients, and suspended sediment.
For dissolved solids, nutrients, and suspended sediment, a relation between constituent concentration and streamflow was determined using the data collected during the study period. The relation was determined by a multiple regression model in which concentration was the dependent variable and stream-flow was the primary explanatory variable. The regression model was determined using a program called Estimator. Esti-mator was used to compute unbiased estimates of annual loads for each constituent and for each of eight primary water-quality sampling sites and to compute the degree of uncertainty associ-ated with each estimated annual load. The estimated annual loads for the eight primary sites then were used to estimate annual loads for five intervening reaches in the study area. Results from Estimator were used as a screening tool to identify which subbasins contributed a disproportionate amount of pol-lutants to the Red River. To compare the relative water quality of the different subbasins, an estimated flow-weighted average (FWA) concentration was computed from the estimated aver-age annual load and the average annual streamflow for each subbasin.
The 5-day biochemical oxygen demands in the upper Red River Basin were fairly small, and medians ranged from 1 to 3 milligrams per liter. The Bois de Sioux River near Doran, Minn., site had the largest median oxygen demand.
Fecal coliform samples were not collected with sufficient frequency to determine if the North Dakota and Minnesota water-quality standards were met. However, more than 50 per-cent of the samples for the Sheyenne River at Harwood, N. Dak., site and more than 25 percent of the samples for the Bois de Sioux River near Doran, Minn., site and the Red River at Perley, Minn., site had fecal coliform concentrations that were greater than 200 colonies per 100 milliliters. The large concentrations indicate an abundance of pathogens in the upper Red River Basin.
The Bois de Sioux River near Doran, Minn., site and the Sheyenne River at Harwood, N. Dak., site had median dis-solved-solids concentrations that exceeded the U.S. Environ-mental Protection Agency secondary water-quality standard of 500 milligrams per liter. However, none of the main-stem sites had median concentrations that were greater than 500 milli-grams per liter. Generally, the dissolved-solids concentrations in the main stem Red River increased in a downstream direc-tion.
Although total nitrite plus nitrate concentrations generally increased in a downstream direction, the median concentrations for all sites were less than the North Dakota suggested guideline of 1.0 milligram per liter for nuisance algal growth and all con-centrations were less than the North Dakota and Minnesota water-quality standard of 10 milligrams per liter for nitrate in drinking water. The median total nitrite plus nitrate concentra-tion for the Red River near Harwood, N. Dak., site was more than twice as large as the median concentration for the Red

Summary 37
River above Fargo, N. Dak., site. A small fraction of the nitro-gen in the upper Red River Basin was in the ammonia form. The largest median total ammonia concentration was for the Red River near Harwood, N. Dak., site. The total ammonia concen-tration increased in a downstream direction from the Red River above Fargo, N. Dak., site to the Red River near Harwood, N. Dak., site, probably as a result of wastewater discharges from urban areas. The largest median total organic nitrogen concentration was for the Bois de Sioux River near Doran, Minn., site. The largest median total nitrogen concentration also was for the Bois de Sioux River near Doran, Minn., site. Gener-ally, the median total nitrogen concentrations in the main stem Red River increased in a downstream direction.
Total and dissolved phosphorus concentrations also gener-ally increased in a downstream direction. Nearly all median total phosphorus concentrations exceeded the North Dakota suggested guideline of 0.1 milligram per liter. The largest median total phosphorus concentrations were for the Bois de Sioux River near Doran, Minn., site, the Sheyenne River at Har-wood, N. Dak., site, and the Red River at Perley, Minn., site. The largest median dissolved phosphorus concentration was for the Bois de Sioux River near Doran, Minn., site. Most of the dis-solved phosphorus concentrations were greater than 0.1 milli-gram per liter, indicating an abundant natural source of phos-phorus in the basin and/or significant nonpoint sources of phosphorus from human activities.
Except for the Otter Tail River above Breckenridge, Minn., site, more than 95 percent of the suspended sediment in streams in the upper Red River Basin was silt and clay size (less than 0.062 millimeter). Suspended-sediment concentrations were relatively small for the upstream sites and gradually increased in a downstream direction.
The Sheyenne River at Harwood, N. Dak., site and the Red River at Hickson, N. Dak., to the Red River above Fargo, N. Dak., intervening reach had the largest estimated annual dis-solved-solids loads. Those subbasins also had FWA concentra-tions that were greater than 500 milligrams per liter. The largest estimated FWA concentration for dissolved solids (about 630 milligrams per liter) was for the Bois de Sioux River near Doran, Minn., site. The Otter Tail River above Breckenridge, Minn., site had the smallest estimated FWA concentration (about 240 milligrams per liter). The estimated FWA concen-trations for dissolved solids for the main-stem sites ranged from about 300 to 500 milligrams per liter and generally increased in a downstream direction. Most of the increase resulted from the large concentrations for the Bois de Sioux River near Doran, Minn., site and the Sheyenne River at Harwood, N. Dak., site.
The estimated annual total nitrite plus nitrate loads for the tributary sites and intervening reaches were highly uncertain. The Sheyenne River at Harwood, N. Dak., site had the largest estimated load. The estimated load for that site was followed by the estimated load for the Red River at Hickson, N. Dak., to the
Red River above Fargo, N. Dak., intervening reach and the Red River near Harwood, N. Dak., to the Red River at Perley, Minn., intervening reach. The estimated FWA concentrations for total nitrite plus nitrate for the main-stem sites increased from about 0.2 milligram per liter for the Red River below Wahpeton, N. Dak., site to about 0.9 milligram per liter for the Red River at Perley, Minn., site. Much of the increase probably resulted from flows from the tributary sites and intervening reaches, excluding the Otter Tail River above Breckenridge, Minn., site. However, uncertainty in the estimated concentrations prevented any reliable conclusions regarding which sites or reaches con-tributed most to the increase.
The Red River above Fargo, N. Dak., to the Red River near Harwood, N. Dak., intervening reach had the largest estimated annual total ammonia load. The Sheyenne River at Harwood, N. Dak., site and the Bois de Sioux River near Doran, Minn., site also had large estimated loads. The estimated FWA concen-trations for total ammonia for the main-stem sites increased from about 0.05 milligram per liter for the Red River above Fargo, N. Dak., site to about 0.15 milligram per liter for the Red River near Harwood, N. Dak., site. The increase resulted from a decrease in flows in the Red River above Fargo, N. Dak., to the Red River near Harwood, N. Dak., intervening reach and the large load for that reach. The FWA concentration decreased between the Red River near Harwood, N. Dak., site and the Red River at Perley, Minn., site, possibly because of the small con-centration for the Red River near Harwood, N. Dak., to the Red River at Perley, Minn., intervening reach or because ammonia was being converted to nitrate in that reach.
The Red River at Hickson, N. Dak., to the Red River above Fargo, N. Dak., intervening reach and the Sheyenne River at Harwood, N. Dak., site had the largest estimated annual total organic nitrogen loads. The Otter Tail River above Brecken-ridge, Minn., site, the Bois de Sioux River near Doran, Minn., site, and the Red River near Harwood, N. Dak., to the Red River at Perley, Minn., intervening reach also had substantial loads. The largest estimated FWA concentrations for total organic nitrogen were for the Red River at Hickson, N. Dak., to the Red River above Fargo, N. Dak., intervening reach and the Bois de Sioux River near Doran, Minn., site. The concentrations for the Otter Tail River above Breckenridge, Minn., site and the Shey-enne River at Harwood, N. Dak., site were relatively small. The estimated FWA concentrations for total organic nitrogen for the main-stem sites were relatively constant and ranged from about 0.5 to 0.7 milligram per liter. The relatively constant concentra-tions were in sharp contrast to the total nitrite plus nitrate con-centrations, which increased about fivefold between the Red River below Wahpeton, N. Dak., site and the Red River at Per-ley, Minn., site.
The Sheyenne River at Harwood, N. Dak., site had the largest estimated annual total nitrogen load. The load for that site was followed by the load for the Red River near Harwood, N. Dak., to the Red River at Perley, Minn., intervening reach.

38 Constituent Loads and Flow-Weighted Average Concentrations for the Upper Red River of the North Basin, 1997-99
That reach also had the largest estimated FWA concentration for total nitrogen (about 2.9 milligrams per liter), but the esti-mate was highly uncertain. The Otter Tail River above Breck-enridge, Minn., site had the smallest concentration (about 0.6 milligram per liter). The estimated FWA concentrations for total nitrogen for the main-stem sites increased from about 0.9 milligram per liter for the Red River at Hickson, N. Dak., site to about 1.6 milligrams per liter for the Red River at Perley, Minn., site. Much of the increase probably resulted from the large concentrations for the Red River at Hickson, N. Dak., to the Red River above Fargo, N. Dak., intervening reach, the Sheyenne River at Harwood, N. Dak., site, and the Red River near Harwood, N. Dak., to the Red River at Perley, Minn., inter-vening reach.
The Sheyenne River at Harwood, N. Dak., site had the largest estimated annual total phosphorus load and the largest estimated FWA concentration (about 0.5 milligram per liter). The Otter Tail River above Breckenridge, Minn., site had the smallest estimated FWA concentration (about 0.1 milligram per liter). The Red River below Wahpeton, N. Dak., to the Red River at Hickson, N. Dak., intervening reach had a total phos-phorus load of about 80 tons per year despite the small drainage area for that reach. The estimated FWA concentrations for total phosphorus for the main-stem sites increased from about 0.15 milligram per liter for the Red River below Wahpeton, N. Dak., site to about 0.35 milligram per liter for the Red River at Perley, Minn., site. Most of the increase probably resulted from the large yield of total phosphorus from the Red River below Wah-peton, N. Dak., to the Red River at Hickson, N. Dak., interven-ing reach and the large concentrations for the Sheyenne River at Harwood, N. Dak., site.
The Sheyenne River at Harwood, N. Dak., site had the largest estimated annual dissolved phosphorus load. The Red River near Harwood, N. Dak., to the Red River at Perley, Minn., intervening reach and the Red River at Hickson, N. Dak., to the Red River above Fargo, N. Dak., intervening reach also had substantial estimated loads. Although the lower confidence lim-its for the Bois de Sioux River near Doran, Minn., to the Red River below Wahpeton, N. Dak., intervening reach and the Red River below Wahpeton, N. Dak., to the Red River at Hickson, N. Dak., intervening reach were near zero, the loads for those reaches may have been large despite the small drainage areas.
The Sheyenne River at Harwood, N. Dak., site had the largest estimated annual suspended-sediment load. The esti-mated FWA concentrations for suspended sediment for the main-stem sites increased from about 50 milligrams per liter for the Red River below Wahpeton, N. Dak., site to about 300 milligrams per liter for the Red River at Perley, Minn., site. Much of the increase occurred as a result of the large yield of suspended sediment from the Red River below Wahpeton, N. Dak., to the Red River at Hickson, N. Dak., intervening reach. Suspended-sediment concentrations continued to increase downstream from the Red River at Hickson, N. Dak.,
site as a result of the large suspended-sediment concentrations in the tributary flows and possibly a large yield of suspended sediment from the Red River above Fargo, N. Dak., to the Red River near Harwood, N. Dak., intervening reach.
References
Antweiler, R.C., Goolsby, D.A., and Taylor, H.E., 1995, Nutri-ents in the Mississippi River, in Meade, R.H., ed., Contami-nants in the Mississippi River, 1987-92: U.S. Geological Survey Circular 1133, p. 73-86.
Cohn, T., Caulder, D.L., Gilroy, E.J., Zynjuk, L.D., and Sum-mers, R.M., 1992, The validity of a simple statistical model for estimating fluvial constituent loads--An empirical study involving nutrient loads entering Chesapeake Bay: Water Resources Research, v. 28, no. 9, p. 2353-2364.
Cohn, T., Gilroy, E.J., and Baier, W.G., 1992, Estimating flu-vial transport of trace constituents using a regression model with data subject to censoring, in Proceedings of the Section on Statistics and the Environment: American Statistical Association, Boston, Mass., August 9-13, 1992, p. 142-151.
Guy, H.P., 1969, Laboratory theory and methods for sediment analysis: United States Geological Survey Techniques of Water-Resources Investigations, book 5, chap. C1, 58 p.
Minnesota Agricultural Statistics Service, 1991, Minnesota agriculture statistics 1991: St. Paul, Minn., 99 p.
Minnesota Pollution Control Agency, Minnesota rules: Chapter 7050, accessed July 17, 2002, at URL http://www.revi-sor.leg.state.mn.us/arule/7050/.
Myers, D.N., and Sylvester, M.A., 1997, Fecal indicator bacte-ria: U.S. Geological Survey Techniques of Water-Resources Investigations, book 9, chap. A7, p. 3-38.
Nemerow, N.L., 1974, Scientific stream pollution analysis: New York, McGraw-Hill, p. 69-116.
North Dakota Agricultural Statistics Service, 1992, North Dakota agricultural statistics 1992: Fargo, N. Dak., 112 p.
North Dakota Department of Health, 1991, Standards of water quality for State of North Dakota, chapter 33-16-02: North Dakota Department of Health, 29 p.
North Dakota Department of Health, 1994, Public water supply systems in North Dakota, chapter 33-17-01: Bismarck, North Dakota, 43 p.
Stoner, J.D., Lorenz, D.L., Wiche, G.J., and Goldstein, R.M., 1993, Red River of the North Basin, Minnesota, North Dakota, and South Dakota: Water Resources Bulletin, v. 29, no. 4, p. 575-615.

References 39
Tchobanoglous, G., and Schroeder, E.D., 1985, Water quality characteristics, modeling, modification: Menlo Park, Calif., Addison-Wesley Publishing Company, p. 107-121.
Tornes, L.H., and Brigham, M.E., 1994, Nutrients, suspended sediment, and pesticides in waters of the Red River of the North Basin, Minnesota, North Dakota, and South Dakota, 1970-90: U.S. Geological Survey Water-Resources Investi-gations Report 93-4231, 62 p.
Tornes, L.H., Brigham, M.E., and Lorenz, D.L., 1997, Nutri-ents, suspended sediment, and pesticides in streams in the Red River of the North Basin, Minnesota, North Dakota, and South Dakota, 1993-95: U.S. Geological Survey Water-Resources Investigations Report 97-4053, 70 p.
U.S. Census Bureau, 2002a, Census '90: accessed May 9, 2002, at URL http://www.census.gov/main/www/cen1990.html
U.S. Census Bureau, 2002b, United States census 2000: accessed May 9, 2002, at URL http://www.census.gov/main/www/cen2000.html
U.S. Department of Commerce, National Oceanic and Atmo-spheric Administration, Environmental Data Service, 1982, Monthly normals of temperature, precipitation, and heating and cooling degree days 1941-70 (Minnesota, North Dakota, and South Dakota): Asheville, North Carolina, Climatogra-phy of the United States, No. 81.
U.S. Geological Survey, 1986, Land use and land cover digital data from 1:250,000- and 1:100,000-scale maps: National Mapping Program Technical Instructions Data Users Guide 4, 36 p.
Wilde, F.D., Radtke, D.B., Gibs, J., and Iwatsubo, R.T., 1999, Collection of water samples: U.S. Geological Survey Tech-niques of Water-Resources Investigations, book 9, chap. A4, p. 7-103.

40 Constituent Loads and Flow-Weighted Average Concentrations for the Upper Red River of the North Basin, 1997-99

Appendix 1. Regression Models for Daily Concentration and Uncertainty in Estimated Annual Loads 41
Appendix 1. Regression Models for Daily Concentration and Uncertainty in Estimated Annual Loads
Results of the regression analysis for historical constituent concentrations and daily loads for eight water-quality sampling sites used in this study are given in table 1–1. The estimated annual loads computed for this study depended on the relation between concentration and streamflow and on seasonality in concentration. The more variability in concentration that could be explained by streamflow and seasonality, the more accurate the estimated annual load. The natural logarithm of concentra-tion was the dependent variable in the regression model, and the natural logarithm of daily streamflow was the explanatory vari-able. The explanatory variable was included whether or not the coefficient for streamflow was statistically significant. The sea-sonal terms (the sine and cosine variables) for 6 months and for 1 year were included only if one of the terms was significant at the 10-percent level or higher. Significant seasonality in con-centration occurred for most variables and most sites.
Estimated annual loads for each constituent for water years 1998 and 1999 are given in tables 1–2 through 1–9. The Estima-tor program was used to compute unbiased estimates of the annual loads based on the fitted regression models for concen-tration and to compute the degree of uncertainty in the estimated annual loads. An adjusted maximum likelihood estimation pro-cedure was used to account for concentrations that were cen-sored (that is, less than the method detection limit). The degree of uncertainty in the estimated annual loads was related to the standard error of the regression for concentration and to the
coefficient of variation (R2 ) for daily load. For example, the standard errors of the regressions for dissolved solids and total organic nitrogen tended to be smaller than the standard errors of the regressions for the remaining constituents, and the coeffi-cients of variation for daily loads for those constituents tended to be larger than the coefficients of variation for daily loads for the remaining constituents (table 1–1). Therefore, the degree of uncertainty for the estimated annual loads for dissolved solids and total organic nitrogen should be less than the degree of uncertainty for the estimated annual load for the remaining con-stituents. In contrast, the standard errors of the regressions for total nitrite plus nitrate and total ammonia tended to be larger than the standard errors of the regressions for the remaining constituents, and the coefficients of variation for daily loads for those constituents tended to be smaller than the coefficients of variation for daily loads for the remaining constituents. There-fore, the degree of uncertainty in the estimated annual loads for total nitrite plus nitrate and total ammonia should be greater than the degree of uncertainty for the estimated annual loads for the remaining constituents.
The standard errors of the estimated annual loads for each water year were computed with the Estimator program. The standard errors then were used to compute approximate confi-dence limits for the actual annual loads using equation 1–1:
Prob L L ZPSE L( )–>[ ]
Prob L L ZPSE L( )+<[ ] P= =
(1–1)
where
Prob denotes probability;
L is the actual annual load, in tons per year;
L is the estimated annual load, in tons per year;
ZP is the pth percentile of a standard normal distribution;
SE L( ) is the standard error of the estimated annual load; and
P is a specified confidence limit.
Therefore, because the 90th-percentile Z0.90 1.285=( ) was
used to report uncertainty for this study, the lower and upper 90-percent confidence limits for the actual annual loads were given by equation 1–2:
Prob L L 1 1.285SE L( )
L-----------------------------–⎝ ⎠
⎛ ⎞>
Prob L L 1 1.285SE L( )
L-----------------------------+⎝ ⎠
⎛ ⎞< 0.90.= =
(1–2)
The percents of uncertainty given in tables 1–2 through 1–9 for the estimated annual loads were used in equation 1–2 to compute the lower and upper confidence limits for the actual annual loads. The percentages given in the tables were com-puted using equation 1–3:
U L( ) 1.285SE L( )
L----------------------------- x 100= (1–3)
where
U L( ) is the uncertainty of the estimated annual load, in percent.
To reduce uncertainty in the estimated annual loads, equation 1–4,

L1998-9912--- L1998 L1999+( )=
42 Constituent Loads and Flow-Weighted Average Concentrations for the Upper Red River of the North Basin, 1997-99
(1–4)
where
L1998-99 is the estimated average annual load, in tons per year, for 1998-99;
L1998 is the estimated annual load, in tons per year, for 1998; and
L1999 is the estimated annual load, in tons per year, for 1999;
was used to obtain an estimated average annual load for 1998-99. Assuming the estimated annual loads for water years 1998 and 1999 were statistically independent, the standard error of the estimated average annual load was defined by equation 1–5:
SE L1998-99( ) 12--- SE L1998( )[ ]
2 SE L1999( )[ ]2
+ .= (1–5)
Therefore, in accordance with equation 1–3, the uncertainty of the estimated average annual load was given by equation 1–6:
U L1998-99( )1.285SE L1998-99( )
L1998-99
------------------------------------------- x 100.= (1–6)
Estimated annual loads for intervening reaches were obtained by subtracting estimated annual load(s) for upstream site(s) from estimated annual load(s) for downstream site(s). The approximate standard errors and the associated uncertain-ties in the loads for the intervening reaches therefore needed to be computed using the standard errors in the estimated annual loads for the upstream and downstream sites. To compute the standard errors and the uncertainties, assumptions needed to be made about the relation between the estimated annual loads for the upstream and downstream sites. The estimated load for an intervening reach was given by equation 1–7,
LR LDS LUS–= (1–7)
where
LR is the estimated load, in tons per year, for the intervening reach;
LDS is the estimated load, in tons per year, for the downstream site; and
LUS is the estimated load, in tons per year; for the upstream site;
and the variance (the squared standard error) of the estimated annual load for the intervening reach was given by equation 1–8,
Var LR( )
Var LDS( ) Var LUS( ) 2Cov LDS LUS,( )–+=
(1–8)
where
Var X( ) denotes the variance of the random variable X , and
Cov X Y,( ) denotes the covariance of the random variables X and Y .
The variance could not be computed without the covariance term. However, the variance could be bounded by two extreme cases. Because the estimated annual loads for the upstream and downstream sites probably would not have a negative covari-ance, the largest variance was obtained by assuming the
Cov LDS LUS,( ) was equal to zero. Therefore, the upper bound
was given by equation 1–9:
Var LR( ) Var LDS( ) Var LUS( ).+≤ (1–9)
The lower bound for the variance was obtained by assuming the estimated annual load for the downstream site was equal to the estimated annual load for the upstream site plus an independent
incremental load, LDS LUS X+=( ) where the Cov LUS , X( )
was equal to zero. Therefore, the lower bound was given by equation 1–10:
Var LR( ) Var LDS( ) Var LUS( ).–≥ (1–10)
The uncertainty of the estimated annual load for the intervening reach was obtained by averaging equations 1–8 and 1–9; that is,
with Var LR( ) Var LDS( )= . Therefore, the standard error of
the estimated annual load for the intervening reach was assumed to equal the standard error of the estimated annual load for the downstream site as given in equation 1–11:
SE LR( ) SE LDS( ).= (1–11)
Equation 1–10 then was substituted in equation 1–3 to obtain the uncertainty of the estimated annual load for the intervening reach as given by equation 1–12:
U LR( )1.285SE LDS( )
LR
----------------------------------- x 100.= (1–12)

Appendix 1. Regression Models for Daily Concentration and Uncertainty in Estimated Annual Loads 43
Table 1–1. Results of regression analysis for historical constituent concentrations and daily loads.
[LF, natural logarithm of daily streamflow; S1, sine function with a period of 1 year; C1, cosine function with a period of 1 year; S2, sine function with a period of 6 months; C2, cosine function with a period of 6 months]
Sitenumber
Site name
Number of valuesused in
analysis
Explanatory variablesincluded in regression
model for naturallogarithm of
concentrationand daily load
Standarderror of
regression
Coefficient ofvariation (R2)
for naturallogarithm of
concentration(percent)
Coefficient ofvariation (R2)
for naturallogarithm ofdaily load(percent)
Dissolved solids
1 Otter Tail River above Breckenridge, Minn.
20 LF 0.11 4 82
2 Bois de Sioux River near Doran, Minn.
17 LF, S2, C2 .22 53 99
4 Red River of the North below Wahpeton, N. Dak.
20 LF, S1, C1 .26 35 86
5 Red River of the North at Hickson, N. Dak.
23 LF .23 1 91
7 Red River of the North above Fargo, N. Dak.
22 LF, S2, C2 .24 10 94
8 Red River of the North near Harwood, N. Dak.
21 LF, S2, C2 .16 34 96
9 Sheyenne River at Harwood, N. Dak.
20 LF .16 56 97
11 Red River of the North at Perley, Minn.
20 LF, S2, C2 .19 14 96
Nitrite plus nitrate, total
1 Otter Tail River above Breckenridge, Minn.
20 LF, S1, C1 0.95 20 15
2 Bois de Sioux River near Doran, Minn.
17 LF 2.01 31 76
4 Red River of the North below Wahpeton, N. Dak.
22 LF, S1, C1, S2, C2 1.34 17 35
5 Red River of the North at Hickson, N. Dak.
21 LF, S1, C1, S2, C2 1.54 26 41
7 Red River of the North above Fargo, N. Dak.
21 LF, S1, C1, S2, C2 1.12 43 68
8 Red River of the North near Harwood, N. Dak.
22 LF, S1, C1 .85 32 48
9 Sheyenne River at Harwood, N. Dak.
21 LF, S1, C1 1.22 32 67
11 Red River of the North at Perley, Minn.
21 LF, S1, C1 .79 16 69

44 Constituent Loads and Flow-Weighted Average Concentrations for the Upper Red River of the North Basin, 1997-99
Ammonia, total
1 Otter Tail River above Breckenridge, Minn.
20 LF, S1, C1, S2, C2 1.39 56 56
2 Bois de Sioux River near Doran, Minn.
17 LF 1.81 42 81
4 Red River of the North below Wahpeton, N. Dak.
21 LF, S1, C1 1.30 13 20
5 Red River of the North at Hickson, N. Dak.
21 LF, S1, C1, S2, C2 1.54 33 44
7 Red River of the North above Fargo, N. Dak.
22 LF, S1, C1 1.25 37 58
8 Red River of the North near Harwood, N. Dak.
22 LF, S1, C1 .89 29 42
9 Sheyenne River at Harwood, N. Dak.
21 LF, S1, C1 1.43 24 58
11 Red River of the North at Perley, Minn.
21 LF 1.02 3 63
Nitrogen, organic, total
1 Otter Tail River above Breckenridge, Minn.
20 LF, S1, C1 0.29 8 43
2 Bois de Sioux River near Doran, Minn.
17 LF, S1, C1, S2, C2 .24 44 99
4 Red River of the North below Wahpeton, N. Dak.
21 LF .30 9 81
5 Red River of the North at Hickson, N. Dak.
21 LF, S1, C1 .59 5 59
7 Red River of the North above Fargo, N. Dak.
21 LF, S1, C1 .27 48 96
8 Red River of the North near Harwood, N. Dak.
21 LF, S2, C2 .26 16 90
9 Sheyenne River at Harwood, N. Dak.
21 LF, S2, C2 .32 22 93
11 Red River of the North at Perley, Minn.
21 LF, S1, C1 .21 6 96
Table 1–1. Results of regression analysis for historical constituent concentrations and daily loads.—Continued
[LF, natural logarithm of daily streamflow; S1, sine function with a period of 1 year; C1, cosine function with a period of 1 year; S2, sine function with a period of 6 months; C2, cosine function with a period of 6 months]
Sitenumber
Site name
Number of valuesused in
analysis
Explanatory variablesincluded in regression
model for naturallogarithm of
concentrationand daily load
Standarderror of
regression
Coefficient ofvariation (R2)
for naturallogarithm of
concentration(percent)
Coefficient ofvariation (R2)
for naturallogarithm ofdaily load(percent)

Appendix 1. Regression Models for Daily Concentration and Uncertainty in Estimated Annual Loads 45
Nitrogen, total
1 Otter Tail River above Breckenridge, Minn.
20 LF, S1, C1, S2, C2 0.30 29 52
2 Bois de Sioux River near Doran, Minn.
17 LF, S2, C2 .56 1 95
4 Red River of the North below Wahpeton, N. Dak.
22 LF, S2, C2 .42 13 71
5 Red River of the North at Hickson, N. Dak.
21 LF, S2, C2 .55 12 68
7 Red River of the North above Fargo, N. Dak.
21 LF, S1, C1 .33 63 95
8 Red River of the North near Harwood, N. Dak.
22 LF, S2, C2 .32 2 82
9 Sheyenne River at Harwood, N. Dak.
21 LF, S2, C2 .57 12 84
11 Red River of the North at Perley, Minn.
21 LF, S2, C2 .47 9 85
Phosphorus, total
1 Otter Tail River above Breckenridge, Minn.
20 LF, S2, C2 1.01 48 38
2 Bois de Sioux River near Doran, Minn.
17 LF, S1, C1 .62 26 93
4 Red River of the North below Wahpeton, N. Dak.
21 LF, S1, C1 .40 18 62
5 Red River of the North at Hickson, N. Dak.
20 LF, S1, C1 .65 10 59
7 Red River of the North above Fargo, N. Dak.
23 LF, S1, C1, S2, C2 .39 54 94
8 Red River of the North near Harwood, N. Dak.
22 LF, S1, C1 .27 25 87
9 Sheyenne River at Harwood, N. Dak.
21 LF, S2, C2 .43 37 92
11 Red River of the North at Perley, Minn.
21 LF, S1, C1 .73 14 68
Table 1–1. Results of regression analysis for historical constituent concentrations and daily loads.—Continued
[LF, natural logarithm of daily streamflow; S1, sine function with a period of 1 year; C1, cosine function with a period of 1 year; S2, sine function with a period of 6 months; C2, cosine function with a period of 6 months]
Sitenumber
Site name
Number of valuesused in
analysis
Explanatory variablesincluded in regression
model for naturallogarithm of
concentrationand daily load
Standarderror of
regression
Coefficient ofvariation (R2)
for naturallogarithm of
concentration(percent)
Coefficient ofvariation (R2)
for naturallogarithm ofdaily load(percent)

46 Constituent Loads and Flow-Weighted Average Concentrations for the Upper Red River of the North Basin, 1997-99
Phosphorus, dissolved
1 Otter Tail River above Breckenridge, Minn.
20 LF, S1, C1, S2, C2 0.71 49 46
2 Bois de Sioux River near Doran, Minn.
17 LF, S2, C2 .92 36 87
4 Red River of the North below Wahpeton, N. Dak.
21 LF, S2, C2 .84 14 26
5 Red River of the North at Hickson, N. Dak.
21 LF, S1, C1 1.25 2 22
7 Red River of the North above Fargo, N. Dak.
22 LF, S1, C1, S2, C2 .88 43 81
8 Red River of the North near Harwood, N. Dak.
21 LF, S1, C1 .71 19 46
9 Sheyenne River at Harwood, N. Dak.
21 LF .45 22 89
11 Red River of the North at Perley, Minn.
21 LF, S1, C1 .74 22 66
Suspended sediment
1 Otter Tail River above Breckenridge, Minn.
21 LF, S1, C1, S2, C2 0.37 58 68
2 Bois de Sioux River near Doran, Minn.
129 LF, S1, C1 .69 38 92
4 Red River of the North below Wahpeton, N. Dak.
21 LF, S1, C1, S2, C2 .47 81 90
5 Red River of the North at Hickson, N. Dak.
21 LF, S1, C1, S2, C2 .61 83 90
7 Red River of the North above Fargo, N. Dak.
22 LF, S1, C1, S2, C2 .49 84 94
8 Red River of the North near Harwood, N. Dak.
21 LF, S1, C1 .66 70 85
9 Sheyenne River at Harwood, N. Dak.
21 LF, S1, C1, S1, S2 .50 81 95
11 Red River of the North at Perley, Minn.
22 LF, S1, C1 .60 72 90
1Because of the small number of samples collected during the sampling period, all data given in the database for 1994-99 were used.
Table 1–1. Results of regression analysis for historical constituent concentrations and daily loads.—Continued
[LF, natural logarithm of daily streamflow; S1, sine function with a period of 1 year; C1, cosine function with a period of 1 year; S2, sine function with a period of 6 months; C2, cosine function with a period of 6 months]
Sitenumber
Site name
Number of valuesused in
analysis
Explanatory variablesincluded in regression
model for naturallogarithm of
concentrationand daily load
Standarderror of
regression
Coefficient ofvariation (R2)
for naturallogarithm of
concentration(percent)
Coefficient ofvariation (R2)
for naturallogarithm ofdaily load(percent)

Appendix 1. Regression Models for Daily Concentration and Uncertainty in Estimated Annual Loads 47
Table 1–2. Estimated annual dissolved-solids loads and flow-weighted average concentrations for the upper Red River of the North Basin.
Site number orintervening
reachdesignation
Site name or interveningreach designation
Wateryear
Load(thousandtons peryear)1
Uncertainty(percent)1
Flow-weightedaverage
concentration(milligrams
per liter)
1 Otter Tail River above Breckenridge, Minn. 19981999
1998-99
177212195
10107
239235237
2 Bois de Sioux River near Doran, Minn. 19981999
1998-99
123143133
141310
612639626
R1 Intervening reach downstream from the Otter Tail River above Breckenridge, Minn., and the Bois de Sioux River near Doran, Minn., and upstream from the Red River of the North below Wahpeton, N. Dak.
19981999
1998-99
175737
----89
------
4 Red River of the North below Wahpeton, N. Dak. 19981999
1998-99
316412364
12139
349378365
R2 Intervening reach downstream from the Red River of the North below Wahpeton, N. Dak., and upstream from the Red River of the North at Hickson, N. Dak.
19981999
1998-99
9- 57- 24
----99
------
5 Red River of the North at Hickson, N. Dak. 19981999
1998-99
325355340
10107
315316316
R3 Intervening reach downstream from the Red River of the North at Hickson, N. Dak., and upstream from the Red River of the North above Fargo, N. Dak. (includes the Wild Rice River)
19981999
1998-99
384285335
----14
520671575
7 Red River of the North above Fargo, N. Dak. 19981999
1998-99
709640675
11107
401413407
R4 Intervening reach downstream from the Red River of the North above Fargo, N. Dak., and upstream from the Red River of the North near Harwood, N. Dak.
19981999
1998-99
532539
----
110
------
8 Red River of the North near Harwood, N. Dak. 19981999
1998-99
762666714
1076
445445445
9 Sheyenne River at Harwood, N. Dak. 19981999
1998-99
456686571
896
588539557
R5 Intervening reach downstream from the Red River of the North near Harwood, N. Dak., and the Sheyenne River at Harwood, N. Dak., and upstream from the Red River of the North at Perley, Minn. (includes the Buffalo and Rush Rivers)
19981999
1998-99
171109140
----71
311287301

48 Constituent Loads and Flow-Weighted Average Concentrations for the Upper Red River of the North Basin, 1997-99
11 Red River of the North at Perley, Minn. 19981999
1998-99
1,3891,4611,425
1097
458463461
1Because of rounding, the numbers given for 1998-99 may not equal the average of the numbers given for water years 1998 and 1999.
Table 1–2. Estimated annual dissolved-solids loads and flow-weighted average concentrations for the upper Red River of the North Basin.—Continued
Site number orintervening
reachdesignation
Site name or interveningreach designation
Wateryear
Load(thousandtons peryear)1
Uncertainty(percent)1
Flow-weightedaverage
concentration(milligrams
per liter)

Appendix 1. Regression Models for Daily Concentration and Uncertainty in Estimated Annual Loads 49
Table 1–3. Estimated annual total nitrite plus nitrate loads and flow-weighted average concentrations for the upper Red River of the North Basin.
Site number orintervening
reachdesignation
Site name or interveningreach designation
Wateryear
Load(tons per
year)1Uncertainty(percent)1
Flow-weightedaverage
concentration(milligrams
per liter)
1 Otter Tail River above Breckenridge, Minn. 19981999
1998-99
526458
635541
0.07.07.07
2 Bois de Sioux River near Doran, Minn. 19981999
1998-99
179176178
283274196
.89
.79
.84
R1 Intervening reach downstream from the Otter Tail River above Breckenridge, Minn., and the Bois de Sioux River near Doran, Minn., and upstream from the Red River of the North below Wahpeton, N. Dak.
19981999
1998-99
- 61- 35- 48
----238
------
4 Red River of the North below Wahpeton, N. Dak. 19981999
1998-99
170205187
928261
.19
.19
.19
R2 Intervening reach downstream from the Red River of the North below Wahpeton, N. Dak., and upstream from the Red River of the North at Hickson, N. Dak.
19981999
1998-99
112109111
----196
------
5 Red River of the North at Hickson, N. Dak. 19981999
1998-99
282314298
10610073
.27
.28
.28
R3 Intervening reach downstream from the Red River of the North at Hickson, N. Dak., and upstream from the Red River of the North above Fargo, N. Dak. (includes the Wild Rice River)
19981999
1998-99
997221609
----139
1.35.52
1.05
7 Red River of the North above Fargo, N. Dak. 19981999
1998-99
1,278535907
12972
- 93
.72
.34
.55
R4 Intervening reach downstream from the Red River of the North above Fargo, N. Dak., and upstream from the Red River of the North near Harwood, N. Dak.
19981999
1998-99
- 30036935
----
1,050
------
8 Red River of the North near Harwood, N. Dak. 19981999
1998-99
979904942
614939
.57
.60
.59
9 Sheyenne River at Harwood, N. Dak. 19981999
1998-99
1,1251,6871,406
10210977
1.451.331.37
R5 Intervening reach downstream from the Red River of the North near Harwood, N. Dak., and the Sheyenne River at Harwood, N. Dak., and upstream from the Red River of the North at Perley, Minn. (includes the Buffalo and Rush Rivers)
19981999
1998-99
752321537
----193
1.37.84
1.15

50 Constituent Loads and Flow-Weighted Average Concentrations for the Upper Red River of the North Basin, 1997-99
11 Red River of the North at Perley, Minn. 19981999
1998-99
2,8552,9122,884
534836
0.94.92.93
1Because of rounding, the numbers given for 1998-99 may not equal the average of the numbers given for water years 1998 and 1999.
Table 1–3. Estimated annual total nitrite plus nitrate loads and flow-weighted average concentrations for the upper Red River of the North Basin.—Continued
Site number orintervening
reachdesignation
Site name or interveningreach designation
Wateryear
Load(tons per
year)1Uncertainty(percent)1
Flow-weightedaverage
concentration(milligrams
per liter)
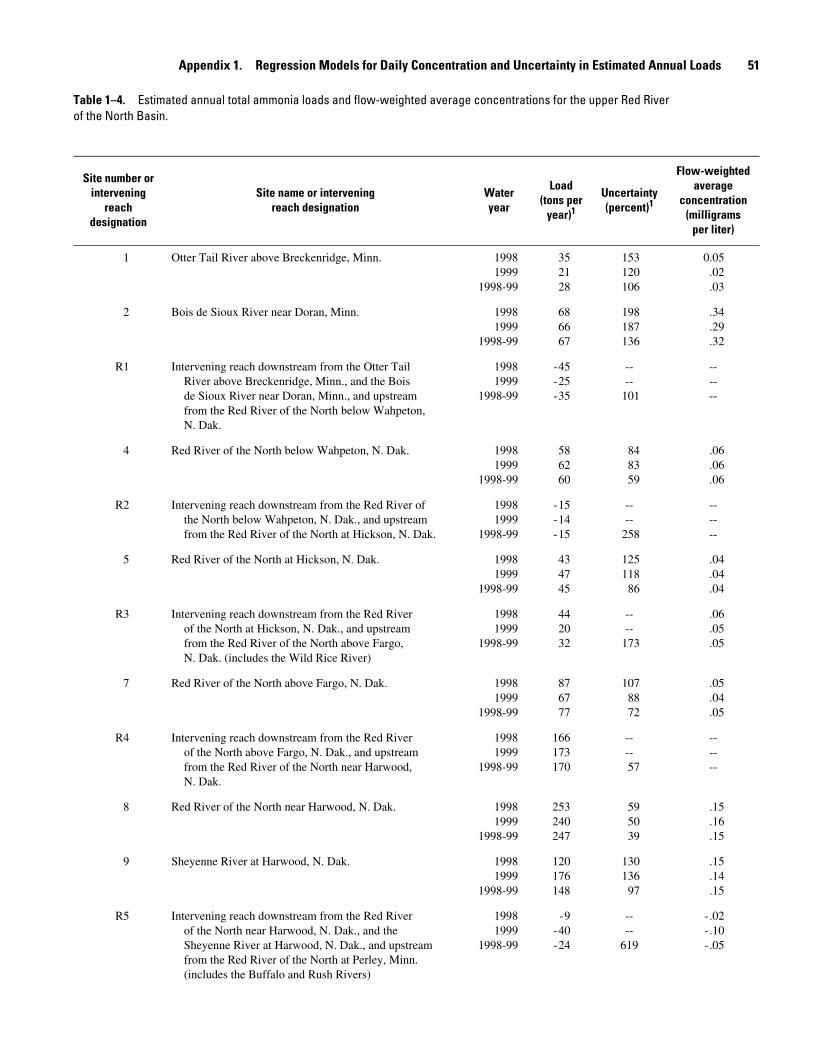
Appendix 1. Regression Models for Daily Concentration and Uncertainty in Estimated Annual Loads 51
Table 1–4. Estimated annual total ammonia loads and flow-weighted average concentrations for the upper Red River of the North Basin.
Site number orintervening
reachdesignation
Site name or interveningreach designation
Wateryear
Load(tons per
year)1Uncertainty(percent)1
Flow-weightedaverage
concentration(milligrams
per liter)
1 Otter Tail River above Breckenridge, Minn. 19981999
1998-99
352128
153120106
0.05.02.03
2 Bois de Sioux River near Doran, Minn. 19981999
1998-99
686667
198187136
.34
.29
.32
R1 Intervening reach downstream from the Otter Tail River above Breckenridge, Minn., and the Bois de Sioux River near Doran, Minn., and upstream from the Red River of the North below Wahpeton, N. Dak.
19981999
1998-99
- 45- 25- 35
----
101
------
4 Red River of the North below Wahpeton, N. Dak. 19981999
1998-99
586260
848359
.06
.06
.06
R2 Intervening reach downstream from the Red River of the North below Wahpeton, N. Dak., and upstream from the Red River of the North at Hickson, N. Dak.
19981999
1998-99
- 15- 14- 15
----
258
------
5 Red River of the North at Hickson, N. Dak. 19981999
1998-99
434745
12511886
.04
.04
.04
R3 Intervening reach downstream from the Red River of the North at Hickson, N. Dak., and upstream from the Red River of the North above Fargo, N. Dak. (includes the Wild Rice River)
19981999
1998-99
442032
----
173
.06
.05
.05
7 Red River of the North above Fargo, N. Dak. 19981999
1998-99
876777
1078872
.05
.04
.05
R4 Intervening reach downstream from the Red River of the North above Fargo, N. Dak., and upstream from the Red River of the North near Harwood, N. Dak.
19981999
1998-99
166173170
----57
------
8 Red River of the North near Harwood, N. Dak. 19981999
1998-99
253240247
595039
.15
.16
.15
9 Sheyenne River at Harwood, N. Dak. 19981999
1998-99
120176148
13013697
.15
.14
.15
R5 Intervening reach downstream from the Red River of the North near Harwood, N. Dak., and the Sheyenne River at Harwood, N. Dak., and upstream from the Red River of the North at Perley, Minn. (includes the Buffalo and Rush Rivers)
19981999
1998-99
- 9- 40- 24
----
619
- .02- .10- .05

52 Constituent Loads and Flow-Weighted Average Concentrations for the Upper Red River of the North Basin, 1997-99
11 Red River of the North at Perley, Minn. 19981999
1998-99
364377371
787253
0.12.12.12
1Because of rounding, the numbers given for 1998-99 may not equal the average of the numbers given for water years 1998 and 1999.
Table 1–4. Estimated annual total ammonia loads and flow-weighted average concentrations for the upper Red River of the North Basin.—Continued
Site number orintervening
reachdesignation
Site name or interveningreach designation
Wateryear
Load(tons per
year)1Uncertainty(percent)1
Flow-weightedaverage
concentration(milligrams
per liter)
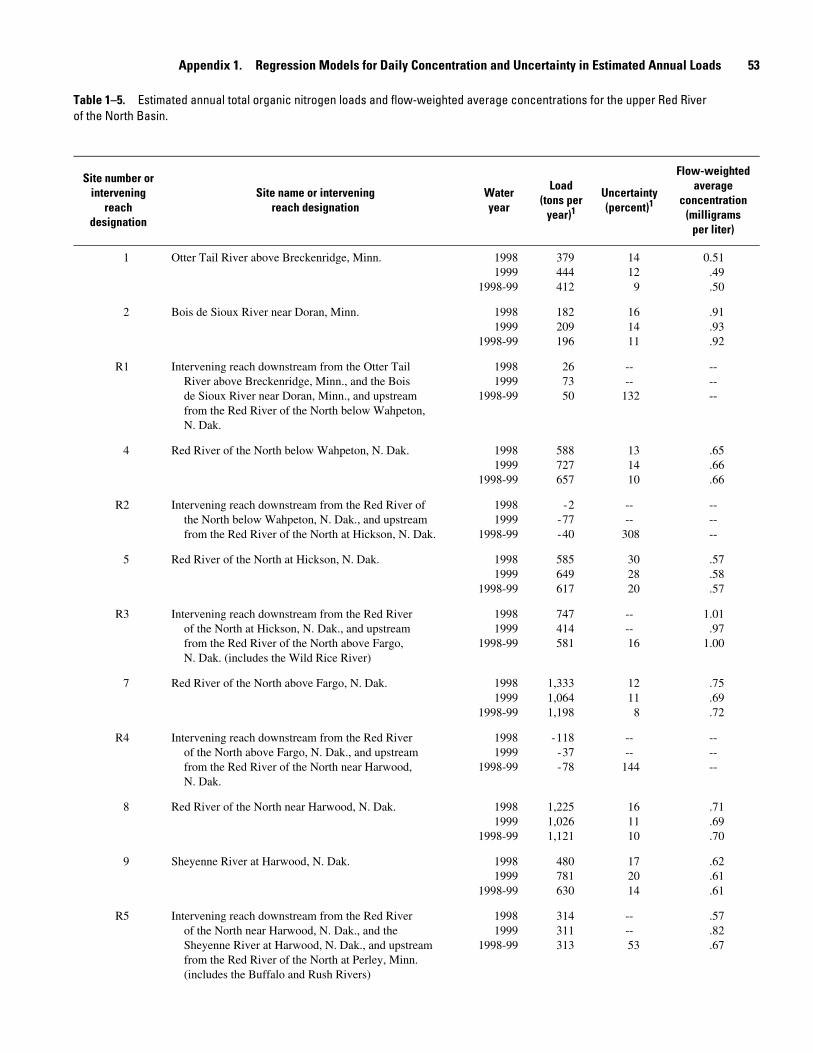
Appendix 1. Regression Models for Daily Concentration and Uncertainty in Estimated Annual Loads 53
Table 1–5. Estimated annual total organic nitrogen loads and flow-weighted average concentrations for the upper Red River of the North Basin.
Site number orintervening
reachdesignation
Site name or interveningreach designation
Wateryear
Load(tons per
year)1Uncertainty(percent)1
Flow-weightedaverage
concentration(milligrams
per liter)
1 Otter Tail River above Breckenridge, Minn. 19981999
1998-99
379444412
14129
0.51.49.50
2 Bois de Sioux River near Doran, Minn. 19981999
1998-99
182209196
161411
.91
.93
.92
R1 Intervening reach downstream from the Otter Tail River above Breckenridge, Minn., and the Bois de Sioux River near Doran, Minn., and upstream from the Red River of the North below Wahpeton, N. Dak.
19981999
1998-99
267350
----
132
------
4 Red River of the North below Wahpeton, N. Dak. 19981999
1998-99
588727657
131410
.65
.66
.66
R2 Intervening reach downstream from the Red River of the North below Wahpeton, N. Dak., and upstream from the Red River of the North at Hickson, N. Dak.
19981999
1998-99
- 2- 77- 40
----
308
------
5 Red River of the North at Hickson, N. Dak. 19981999
1998-99
585649617
302820
.57
.58
.57
R3 Intervening reach downstream from the Red River of the North at Hickson, N. Dak., and upstream from the Red River of the North above Fargo, N. Dak. (includes the Wild Rice River)
19981999
1998-99
747414581
----16
1.01.97
1.00
7 Red River of the North above Fargo, N. Dak. 19981999
1998-99
1,3331,0641,198
12118
.75
.69
.72
R4 Intervening reach downstream from the Red River of the North above Fargo, N. Dak., and upstream from the Red River of the North near Harwood, N. Dak.
19981999
1998-99
- 118- 37- 78
----
144
------
8 Red River of the North near Harwood, N. Dak. 19981999
1998-99
1,2251,0261,121
161110
.71
.69
.70
9 Sheyenne River at Harwood, N. Dak. 19981999
1998-99
480781630
172014
.62
.61
.61
R5 Intervening reach downstream from the Red River of the North near Harwood, N. Dak., and the Sheyenne River at Harwood, N. Dak., and upstream from the Red River of the North at Perley, Minn. (includes the Buffalo and Rush Rivers)
19981999
1998-99
314311313
----53
.57
.82
.67

54 Constituent Loads and Flow-Weighted Average Concentrations for the Upper Red River of the North Basin, 1997-99
11 Red River of the North at Perley, Minn. 19981999
1998-99
2,0092,1182,063
12118
0.66.67.67
1Because of rounding, the numbers given for 1998-99 may not equal the average of the numbers given for water years 1998 and 1999.
Table 1–5. Estimated annual total organic nitrogen loads and flow-weighted average concentrations for the upper Red River of the North Basin.—Continued
Site number orintervening
reachdesignation
Site name or interveningreach designation
Wateryear
Load(tons per
year)1Uncertainty(percent)1
Flow-weightedaverage
concentration(milligrams
per liter)

Appendix 1. Regression Models for Daily Concentration and Uncertainty in Estimated Annual Loads 55
Table 1–6. Estimated annual total nitrogen loads and flow-weighted average concentrations for the upper Red River of the North Basin.
Site number orintervening
reachdesignation
Site name or interveningreach designation
Wateryear
Load(tons per
year)1Uncertainty(percent)1
Flow-weightedaverage
concentration(milligrams
per liter)
1 Otter Tail River above Breckenridge, Minn. 19981999
1998-99
473530502
161310
0.64.59.61
2 Bois de Sioux River near Doran, Minn. 19981999
1998-99
310348330
393526
1.561.551.55
R1 Intervening reach downstream from the Otter Tail River above Breckenridge, Minn., and the Bois de Sioux River near Doran, Minn., and upstream from the Red River of the North below Wahpeton, N. Dak.
19981999
1998-99
3214287
----
148
------
4 Red River of the North below Wahpeton, N. Dak. 19981999
1998-99
8161,021
918
192014
.90
.93
.92
R2 Intervening reach downstream from the Red River of the North below Wahpeton, N. Dak., and upstream from the Red River of the North at Hickson, N. Dak.
19981999
1998-99
101- 4031
----
612
------
5S Red River of the North at Hickson, N. Dak. 19981999
1998-99
917981949
302620
.89
.87
.88
R3 Intervening reach downstream from the Red River of the North at Hickson, N. Dak., and upstream from the Red River of the North above Fargo, N. Dak. (includes the Wild Rice River)
19981999
1998-99
1,212622917
----22
1.641.461.58
7 Red River of the North above Fargo, N. Dak. 19981999
1998-99
2,1291,6031,866
161311
1.201.031.12
R4 Intervening reach downstream from the Red River of the North above Fargo, N. Dak., and upstream from the Red River of the North near Harwood, N. Dak.
19981999
1998-99
12311162
----
150
------
8 Red River of the North near Harwood, N. Dak. 19981999
1998-99
2,1411,9142,027
181412
1.251.281.26
9 Sheyenne River at Harwood, N. Dak. 19981999
1998-99
1,2072,1071,658
333827
1.551.651.62
R5 Intervening reach downstream from the Red River of the North near Harwood, N. Dak., and the Sheyenne River at Harwood, N. Dak., and upstream from the Red River of the North at Perley, Minn. (includes the Buffalo and Rush Rivers)
19981999
1998-99
1,5741,1491,360
----54
2.873.022.93

56 Constituent Loads and Flow-Weighted Average Concentrations for the Upper Red River of the North Basin, 1997-99
11 Red River of the North at Perley, Minn. 19981999
1998-99
4,9225,1705,045
272418
1.621.641.63
1Because of rounding, the numbers given for 1998-99 may not equal the average of the numbers given for water years 1998 and 1999.
Table 1–6. Estimated annual total nitrogen loads and flow-weighted average concentrations for the upper Red River of the North Basin.—Continued
Site number orintervening
reachdesignation
Site name or interveningreach designation
Wateryear
Load(tons per
year)1Uncertainty(percent)1
Flow-weightedaverage
concentration(milligrams
per liter)

Appendix 1. Regression Models for Daily Concentration and Uncertainty in Estimated Annual Loads 57
Table 1–7. Estimated annual total phosphorus loads and flow-weighted average concentrations for the upper Red River of the North Basin.
Site number orintervening
reachdesignation
Site name or interveningreach designation
Wateryear
Load(tons per
year)1Uncertainty(percent)1
Flow-weightedaverage
concentration(milligrams
per liter)
1 Otter Tail River above Breckenridge, Minn. 19981999
1998-99
110109109
645843
0.15.12.13
2 Bois de Sioux River near Doran, Minn. 19981999
1998-99
425951
404028
.21
.27
.24
R1 Intervening reach downstream from the Otter Tail River above Breckenridge, Minn., and the Bois de Sioux River near Doran, Minn., and upstream from the Red River of the North below Wahpeton, N. Dak.
19981999
1998-99
- 15- 7
- 16
----28
------
4 Red River of the North below Wahpeton, N. Dak. 19981999
1998-99
127161144
181913
.14
.15
.14
R2 Intervening reach downstream from the Red River of the North below Wahpeton, N. Dak., and upstream from the Red River of the North at Hickson, N. Dak.
19981999
1998-99
917784
----65
------
5 Red River of the North at Hickson, N. Dak. 19981999
1998-99
218238228
353324
.21
.21
.21
R3 Intervening reach downstream from the Red River of the North at Hickson, N. Dak., and upstream from the Red River of the North above Fargo, N. Dak. (includes the Wild Rice River)
19981999
1998-99
216101159
----32
.29
.24
.27
7 Red River of the North above Fargo, N. Dak. 19981999
1998-99
434340387
191513
.25
.22
.23
R4 Intervening reach downstream from the Red River of the North above Fargo, N. Dak., and upstream from the Red River of the North near Harwood, N. Dak.
19981999
1998-99
135434
----
124
------
8 Red River of the North near Harwood, N. Dak. 19981999
1998-99
448394421
161210
.26
.26
.26
9 Sheyenne River at Harwood, N. Dak. 19981999
1998-99
373643508
313223
.48
.50
.50
R5 Intervening reach downstream from the Red River of the North near Harwood, N. Dak., and the Sheyenne River at Harwood, N. Dak., and upstream from the Red River of the North at Perley, Minn. (includes the Buffalo and Rush Rivers)
19981999
1998-99
282132207
----
164
.51
.35
.45

58 Constituent Loads and Flow-Weighted Average Concentrations for the Upper Red River of the North Basin, 1997-99
11 Red River of the North at Perley, Minn. 19981999
1998-99
1,1021,1691,135
434130
0.36.37.37
1Because of rounding, the numbers given for 1998-99 may not equal the average of the numbers given for water years 1998 and 1999.
Table 1–7. Estimated annual total phosphorus loads and flow-weighted average concentrations for the upper Red River of the North Basin.—Continued
Site number orintervening
reachdesignation
Site name or interveningreach designation
Wateryear
Load(tons per
year)1Uncertainty(percent)1
Flow-weightedaverage
concentration(milligrams
per liter)

Appendix 1. Regression Models for Daily Concentration and Uncertainty in Estimated Annual Loads 59
Table 1–8. Estimated annual dissolved phosphorus loads and flow-weighted average concentrations for the upper Red River of the North Basin.
Site number orintervening
reachdesignation
Site name or interveningreach designation
Wateryear
Load(tons per
year)1Uncertainty(percent)1
Flow-weightedaverage
concentration(milligrams
per liter)
1 Otter Tail River above Breckenridge, Minn. 19981999
1998-99
202322
343323
0.03.03.03
2 Bois de Sioux River near Doran, Minn. 19981999
1998-99
505452
766750
.25
.24
.24
R1 Intervening reach downstream from the Otter Tail River above Breckenridge, Minn., and the Bois de Sioux River near Doran, Minn., and upstream from the Red River of the North below Wahpeton, N. Dak.
19981999
1998-99
192623
----
129
------
4 Red River of the North below Wahpeton, N. Dak. 19981999
1998-99
8810496
424431
.10
.09
.10
R2 Intervening reach downstream from the Red River of the North below Wahpeton, N. Dak., and upstream from the Red River of the North at Hickson, N. Dak.
19981999
1998-99
293130
----
223
------
5 Red River of the North at Hickson, N. Dak. 19981999
1998-99
117134126
757453
.11
.12
.12
R3 Intervening reach downstream from the Red River of the North at Hickson, N. Dak., and upstream from the Red River of the North above Fargo, N. Dak. (includes the Wild Rice River)
19981999
1998-99
239105172
----57
.32
.25
.30
7 Red River of the North above Fargo, N. Dak. 19981999
1998-99
371225298
584039
.21
.14
.18
R4 Intervening reach downstream from the Red River of the North above Fargo, N. Dak., and upstream from the Red River of the North near Harwood, N. Dak.
19981999
1998-99
- 9539
- 28
----59
------
8 Red River of the North near Harwood, N. Dak. 19981999
1998-99
276263270
423628
.16
.18
.17
9 Sheyenne River at Harwood, N. Dak. 19981999
1998-99
152271212
263122
.20
.21
.21
R5 Intervening reach downstream from the Red River of the North near Harwood, N. Dak., and the Sheyenne River at Harwood, N. Dak., and upstream from the Red River of the North at Perley, Minn. (includes the Buffalo and Rush Rivers)
19981999
1998-99
191165178
----
126
.35
.43
.38

60 Constituent Loads and Flow-Weighted Average Concentrations for the Upper Red River of the North Basin, 1997-99
11 Red River of the North at Perley, Minn. 19981999
1998-99
618700659
484834
0.20.22.21
1Because of rounding, the numbers given for 1998-99 may not equal the average of the numbers given for water years 1998 and 1999.
Table 1–8. Estimated annual dissolved phosphorus loads and flow-weighted average concentrations for the upper Red River of the North Basin.—Continued
Site number orintervening
reachdesignation
Site name or interveningreach designation
Wateryear
Load(tons per
year)1Uncertainty(percent)1
Flow-weightedaverage
concentration(milligrams
per liter)

Appendix 1. Regression Models for Daily Concentration and Uncertainty in Estimated Annual Loads 61
Table 1–9. Estimated annual suspended-sediment loads and flow-weighted average concentrations for the upper Red River of the North Basin.
Site number orintervening
reachdesignation
Site name or interveningreach designation
Wateryear
Load(thousandtons peryear)1
Uncertainty(percent)1
Flow-weightedaverage
concentration(milligrams
per liter)
1 Otter Tail River above Breckenridge, Minn. 19981999
1998-99
494547
231513
665057
2 Bois de Sioux River near Doran, Minn. 19981999
1998-99
162018
454833
828985
R1 Intervening reach downstream from the Otter Tail River above Breckenridge, Minn., and the Bois de Sioux River near Doran, Minn., and upstream from the Red River of the North below Wahpeton, N. Dak.
19981999
1998-99
- 15- 3- 9
----
101
------
4 Red River of the North below Wahpeton, N. Dak. 19981999
1998-99
506156
242517
555656
R2 Intervening reach downstream from the Red River of the North below Wahpeton, N. Dak., and upstream from the Red River of the North at Hickson, N. Dak.
19981999
1998-99
119118119
----38
------
5 Red River of the North at Hickson, N. Dak. 19981999
1998-99
169180174
393426
164160162
R3 Intervening reach downstream from the Red River of the North at Hickson, N. Dak., and upstream from the Red River of the North above Fargo, N. Dak. (includes the Wild Rice River)
19981999
1998-99
26260
161
----48
356140277
7 Red River of the North above Fargo, N. Dak. 19981999
1998-99
431239335
402623
244154202
R4 Intervening reach downstream from the Red River of the North above Fargo, N. Dak., and upstream from the Red River of the North near Harwood, N. Dak.
19981999
1998-99
714256
----
230
------
8 Red River of the North near Harwood, N. Dak. 19981999
1998-99
502281391
563633
293188244
9 Sheyenne River at Harwood, N. Dak. 19981999
1998-99
188460324
323925
243361316
R5 Intervening reach downstream from the Red River of the North near Harwood, N. Dak., and the Sheyenne River at Harwood, N. Dak., and upstream from the Red River of the North at Perley, Minn. (includes the Buffalo and Rush Rivers)
19981999
1998-99
27838
158
----
145
50798
339

62 Constituent Loads and Flow-Weighted Average Concentrations for the Upper Red River of the North Basin, 1997-99
11 Red River of the North at Perley, Minn. 19981999
1998-99
968778873
423226
319247282
1Because of rounding, the numbers given for 1998-99 may not equal the average of the numbers given for water years 1998 and 1999.
Table 1–9. Estimated annual suspended-sediment loads and flow-weighted average concentrations for the upper Red River of the North Basin.—Continued
Site number orintervening
reachdesignation
Site name or interveningreach designation
Wateryear
Load(thousandtons peryear)1
Uncertainty(percent)1
Flow-weightedaverage
concentration(milligrams
per liter)