Embed Size (px)
Citation preview

Constant Contact Survey ResultsSurvey Name: GIS Salary Survey
Response Status: Partial & Completed
Filter: None
7/31/2011 11:32 PM CDT
Page 1

What job title best describes your current position?
Answer 0% 100%Number of
Response(s)Response
RatioGIS Technician 89 10.2 %
GIS Analyst 264 30.3 %
GIS User 22 2.5 %
GIS Analyst/Programmer 66 7.5 %
GIS Developer/Programmer 58 6.6 %
GIS Instructor/Educator 16 1.8 %
GIS Database Manager 25 2.8 %
GIS Project Manager 60 6.8 %
GISManager/Coordinator/Director
139 15.9 %
GIS Consultant 55 6.3 %
Business Owner 8 <1 %
Other 61 7.0 %
No Response(s) 7 <1 %
Totals 870 100%
How many years of professional GIS experience do you have?
Answer 0% 100%Number of
Response(s)Response
RatioUnder 3 95 10.9 %
3-5 155 17.8 %
5-10 266 30.5 %
10-20 290 33.3 %
Greater than 20 58 6.6 %
No Response(s) 6 <1 %
Totals 870 100%
Page 2
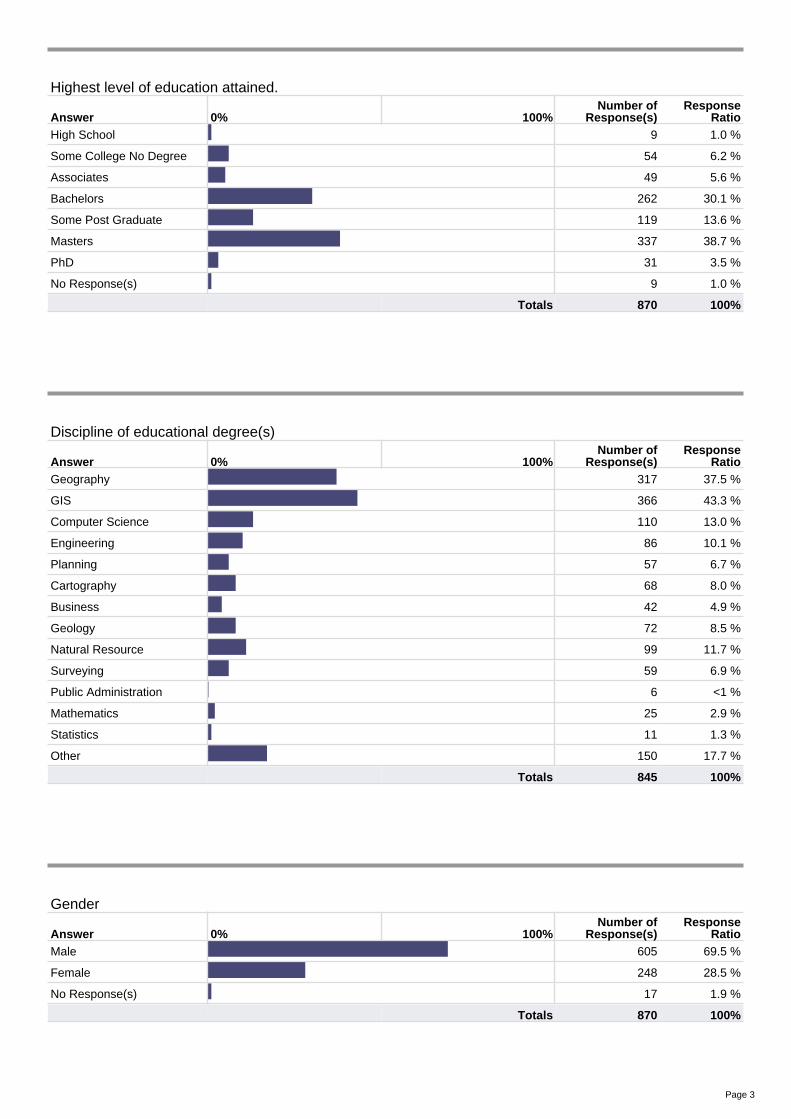
Highest level of education attained.
Answer 0% 100%Number of
Response(s)Response
RatioHigh School 9 1.0 %
Some College No Degree 54 6.2 %
Associates 49 5.6 %
Bachelors 262 30.1 %
Some Post Graduate 119 13.6 %
Masters 337 38.7 %
PhD 31 3.5 %
No Response(s) 9 1.0 %
Totals 870 100%
Discipline of educational degree(s)
Answer 0% 100%Number of
Response(s)Response
RatioGeography 317 37.5 %
GIS 366 43.3 %
Computer Science 110 13.0 %
Engineering 86 10.1 %
Planning 57 6.7 %
Cartography 68 8.0 %
Business 42 4.9 %
Geology 72 8.5 %
Natural Resource 99 11.7 %
Surveying 59 6.9 %
Public Administration 6 <1 %
Mathematics 25 2.9 %
Statistics 11 1.3 %
Other 150 17.7 %
Totals 845 100%
Gender
Answer 0% 100%Number of
Response(s)Response
RatioMale 605 69.5 %
Female 248 28.5 %
No Response(s) 17 1.9 %
Totals 870 100%
Page 3

Current Age
Answer 0% 100%Number of
Response(s)Response
RatioLess than 25 20 2.2 %
25-29 152 17.4 %
30-39 369 42.4 %
40-49 206 23.6 %
50-59 101 11.6 %
Above 60 16 1.8 %
No Response(s) 6 <1 %
Totals 870 100%
Please select the range that most closely describes your salary for the past year in U.S. dollars.
Answer 0% 100%Number of
Response(s)Response
RatioLess than $20,000 104 11.9 %
$20,000-$29,999 45 5.1 %
$30,000-$39,999 81 9.3 %
$40,000-$49,999 110 12.6 %
$50,000-$59,999 143 16.4 %
$60,000-$69,999 117 13.4 %
$70,000-$79,999 84 9.6 %
$80,000-$89,999 57 6.5 %
$90,000-$99,999 42 4.8 %
$100,000-$124,999 54 6.2 %
Greater than $125,000 19 2.1 %
No Response(s) 14 1.6 %
Totals 870 100%
Page 4
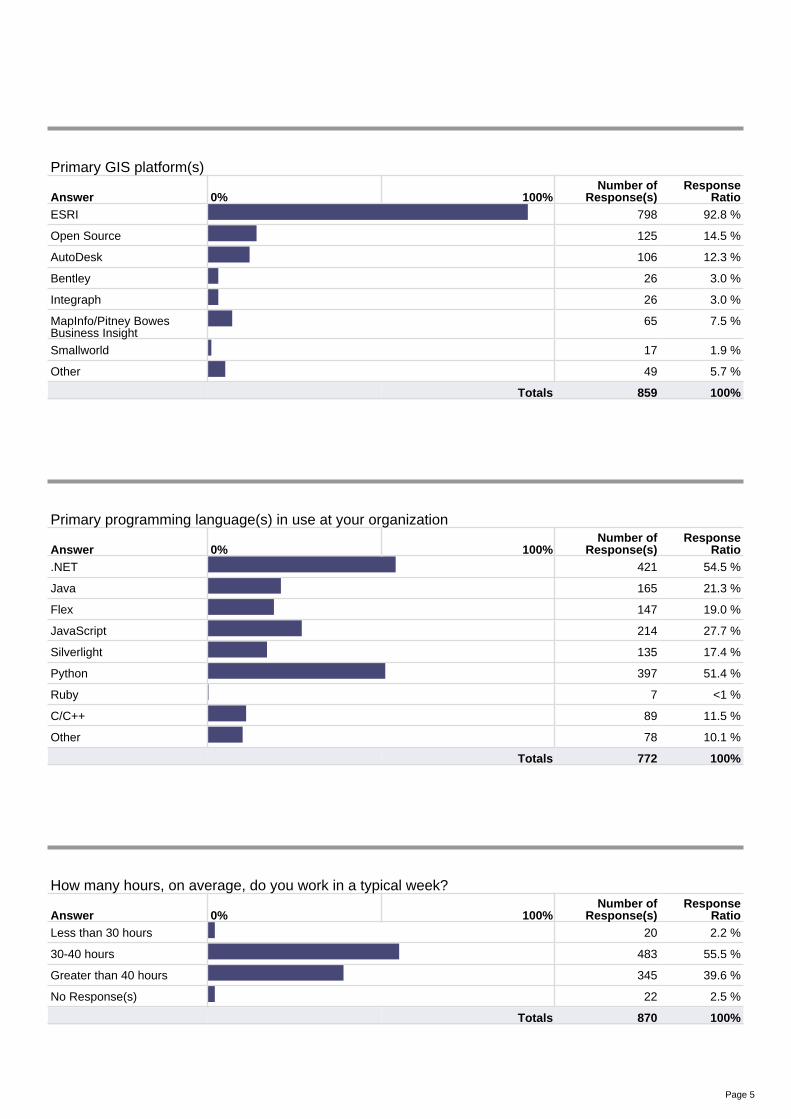
Primary GIS platform(s)
Answer 0% 100%Number of
Response(s)Response
RatioESRI 798 92.8 %
Open Source 125 14.5 %
AutoDesk 106 12.3 %
Bentley 26 3.0 %
Integraph 26 3.0 %
MapInfo/Pitney BowesBusiness Insight
65 7.5 %
Smallworld 17 1.9 %
Other 49 5.7 %
Totals 859 100%
Primary programming language(s) in use at your organization
Answer 0% 100%Number of
Response(s)Response
Ratio.NET 421 54.5 %
Java 165 21.3 %
Flex 147 19.0 %
JavaScript 214 27.7 %
Silverlight 135 17.4 %
Python 397 51.4 %
Ruby 7 <1 %
C/C++ 89 11.5 %
Other 78 10.1 %
Totals 772 100%
How many hours, on average, do you work in a typical week?
Answer 0% 100%Number of
Response(s)Response
RatioLess than 30 hours 20 2.2 %
30-40 hours 483 55.5 %
Greater than 40 hours 345 39.6 %
No Response(s) 22 2.5 %
Totals 870 100%
Page 5

Which category best describes your employer?
Answer 0% 100%Number of
Response(s)Response
RatioLocal Government 224 25.7 %
State Government 87 10.0 %
Federal Government 60 6.8 %
Private Industry 371 42.6 %
Non-Profit 42 4.8 %
Educational 43 4.9 %
Other 33 3.7 %
No Response(s) 10 1.1 %
Totals 870 100%
Where do you live?
Answer 0% 100%Number of
Response(s)Response
RatioUS West -WA,OR,ID,MT,WY,CO,UT,NV,CA,HI,AK
133 15.2 %
US Southwest -TX,NM,AZ,OK
129 14.8 %
US Midwest -ND,SD,NE,KS,MN,IA,MO,WI,IL,IN,OH,MI
66 7.5 %
US Southeast -AR,LA,MS,AL,GA,NC,SC,VA,TN,KY,WV
132 15.1 %
US Northeast -MD,PA,DE,NJ,CT,RI,MA,NH,NY,VT,ME
57 6.5 %
Western Canada -BC,AB,SA,MT
35 4.0 %
Eastern Canada -NB,PE,NS,NL
6 <1 %
Northern Canada - YU, NT,NUN
0 0.0 %
Mexico/South America 9 1.0 %
Western Europe 68 7.8 %
Eastern Europe 14 1.6 %
Australia/New Zealand 22 2.5 %
Africa 24 2.7 %
Middle East 25 2.8 %
Asia 81 9.3 %
Other 61 7.0 %
No Response(s) 8 <1 %
Totals 870 100%
Page 6