Embed Size (px)
Citation preview

1Consolidated results as at 30th June 2017
Consolidated Results as at
June 30th 2017
2Consolidated results as at 30th June 2017
• This document has been prepared by Credito Valtellinese for information purpose only and does not constitute a
public offer under any applicable legislation or an offer to sell or solicitation of an offer to purchase or subscribe for
securities or financial instruments or any advice or recommendation with respect of such securities or other financial
instruments.
• The information, opinions, estimates and forecasts contained herein have not been independently verified. They have
been obtained from, are based upon, sources that company believes to be reliable but makes no representations
(either express or implied) or warranty on their completeness, timeliness or accuracy.
• The document may contain forward-looking statements, which are therefore inherently uncertain. All forward-looking
statements rely on a number of assumptions, expectations, projections and provisional data concerning future events
and are subject to significant risks and uncertainties, many of which are outside the company’s control. There are a
variety of factors that may cause actual results and performance to be materially different from the explicit or implicit
contents any forward-looking statements and thus, such forward-looking statements are not a reliable indicator of
future performance. The company undertakes no obligation to publicly update or revise any forward-looking
statements, whether as a result of new information, future events or otherwise, except as may be required by
applicable law. The information and opinions contained in this Presentation are provided as at the date hereof and
are subject to change without notice.
• Pursuant the consolidated law on financial intermediation of 24 February 1998 (article 154-bis, paragraph 2), Simona
Orietti, in her capacity as manager in charge of financial reporting declares that the accounting information contained
in this Presentation reflects the group’s documented results, financial accounts and accounting records.
Disclaimer
3Consolidated results as at 30th June 2017
Agenda
1. Overview of Elrond transaction
2. Credit policies and asset quality
3. Funding, liquidity and securities portfolio
4. Capital ratio
5. Revenues development
6. Cost management and Net profit development
7. Annexes

4Consolidated results as at 30th June 2017
Overview of Project Elrond transaction structure
Noteholders’ Representative
Securitisation Services
Account Bank and Paying Agent
BNP Paribas
Originators
Credito Valtellinese and
Credito Siciliano
Hedge Providers
JP Morgan, Banca IMI
Monitoring Agent
Zenith Services
Master Servicer
Securitisation Services
Issuer
ELROND NPL 2017 S.r.l.
Special Servicer
CCM
SERVICING ROLES
NPL Portfolio
Purchase price
Notes’ issuance
Class A notes
Class B notes
Class J notes
Key transaction parties
Source: transaction documents
GACS GUARANTEE
5Consolidated results as at 30th June 2017
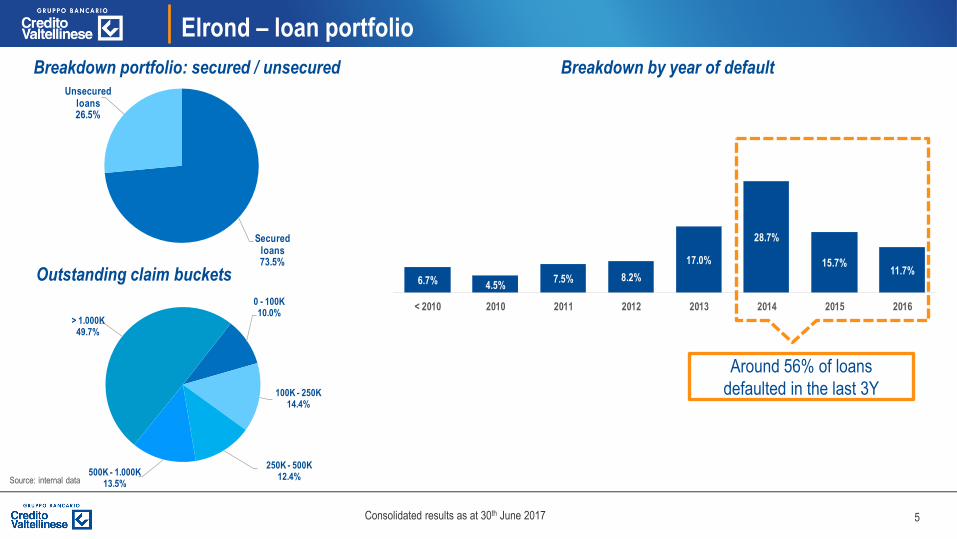
6.7% 4.5%7.5% 8.2%
17.0%
28.7%
15.7%11.7%
< 2010 2010 2011 2012 2013 2014 2015 2016
Elrond – loan portfolio
Around 56% of loans
defaulted in the last 3Y
Breakdown portfolio: secured / unsecured
Source: internal data
Breakdown by year of default
Outstanding claim buckets
Secured loans73.5%
Unsecured loans26.5%
0 - 100K10.0%
100K - 250K14.4%
250K - 500K12.4%500K - 1.000K
13.5%
> 1.000K49.7%
6Consolidated results as at 30th June 2017
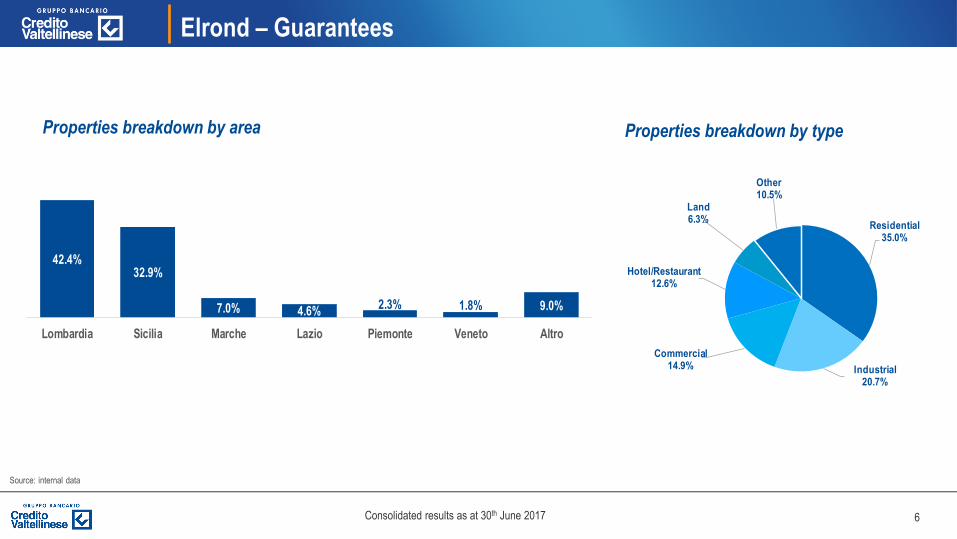
Residential35.0%
Industrial20.7%
Commercial14.9%
Hotel/Restaurant12.6%
Land6.3%
Other10.5%
42.4%32.9%
7.0% 4.6%2.3% 1.8% 9.0%
Lombardia Sicilia Marche Lazio Piemonte Veneto Altro
Elrond – Guarantees
Source: internal data
Properties breakdown by area Properties breakdown by type

7Consolidated results as at 30th June 2017
Elrond – the value of a Third Party Servicer
~ 30%
recovery
gap
Source: Moody’s
Cumulated collections over original GBV – Unsecured portfolios with and without a special servicer
8Consolidated results as at 30th June 2017
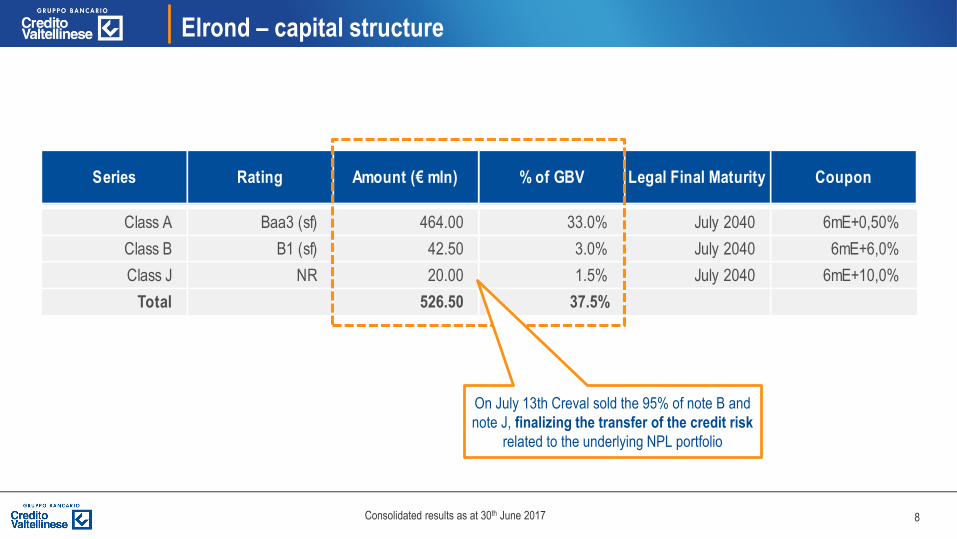
Class A Baa3 (sf) 464.00 33.0% July 2040 6mE+0,50%
Class B B1 (sf) 42.50 3.0% July 2040 6mE+6,0%
Class J NR 20.00 1.5% July 2040 6mE+10,0%
Total 526.50 37.5%
Series Rating Amount (€ mln) % of GBV Legal Final Maturity Coupon
Elrond – capital structure
On July 13th Creval sold the 95% of note B and
note J, finalizing the transfer of the credit risk
related to the underlying NPL portfolio

9Consolidated results as at 30th June 2017
Elrond - Regulatory interactions
Communication to Bank of Italy for Risk
Transfer valuation purpose (according to CRR)Submitted on July, 7th
Application to MEF for GACS guaranteeSubmitted on July, 28th
GACS expected, in any case, by the end of Q3
10Consolidated results as at 30th June 2017
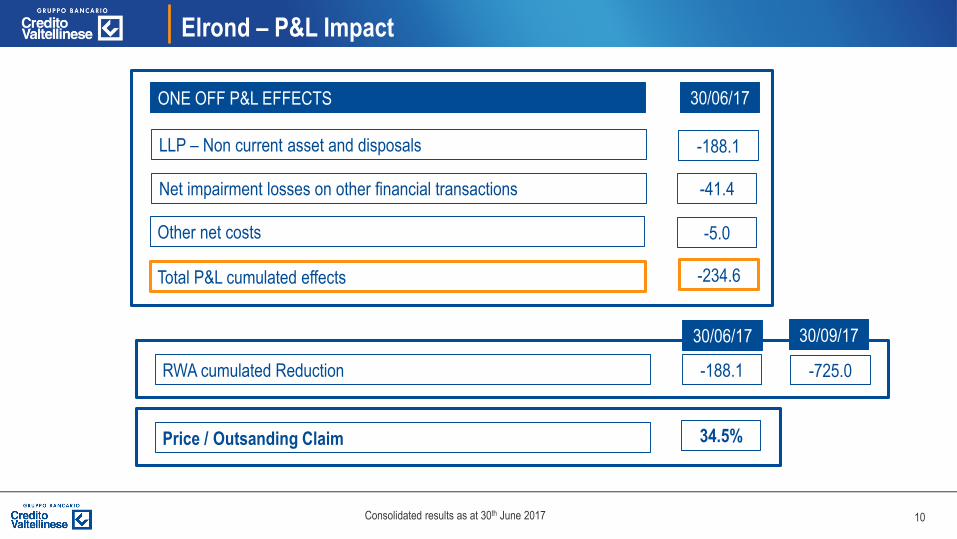
Elrond – P&L Impact
LLP – Non current asset and disposals
30/06/17
-188.1
Net impairment losses on other financial transactions -41.4
Other net costs -5.0
Total P&L cumulated effects
RWA cumulated Reduction -188.1 -725.0
ONE OFF P&L EFFECTS
Price / Outsanding Claim 34.5%
-234.6
30/06/17 30/09/17
11Consolidated results as at 30th June 2017
Agenda
1. Overview of Elrond transaction
2. Credit policies and asset quality
3. Funding, liquidity and securities portfolio
4. Capital ratio
5. Revenues development
6. Cost management and Net profit development
7. Annexes

12Consolidated results as at 30th June 2017
23,064 21,279 20,074 20,106 19,825 19,741 19,315 18,990 18,871 17,578
12.12 12.13 12.14 12.15 03.16 06.16 09.16 12.16 03.17 06.17
Credit policies and asset quality - Loans to customers analysis
* Total gross loans to customers net of exposures with institutions, mainly CCG (Cassa Compensazione e Garanzia)
and CDP (Cassa Depositi e Prestiti)
Quarterly trend (€mn) Commercial Loans * (gross amounts)
Performing loans by sector (ATECO classification)** Total gross loans by asset class**
SME corporate: revenue or total assets < 25 mn
Corporate: revenue or total asset ≥ 25 mn
Retail: Small Retail exposure ≥ 100k, Micro Retail < 100k exposure
~ 70% of total loan
book to SMEs
**Source: internal data
Proforma, including ~ 1.3 bln
“Portfolio Elrond” disposal18,854
SME Corporate38.6%
Corporate15.0%
Retail16.8%
Households26.2%
Other3.4%
Construction7.7%
Real estate10.5%
Industrial19.9%
Commercial10.8%
Services11.7%
Households29.3%
Other sector10.1%

13Consolidated results as at 30th June 2017
Credit policies and asset quality - Focus on new loans
Individuals
Mortgage 151 mn
2.37 %*
Amount
Average RateOther secured 236 mn
Unsecured 409 mn
Total amount 796 mn**
Of which substitutions («surroghe»): 31.1 mn
-7.7 %
Chg %
YoY
-24.5 %
+0.2 %
-10.0 %
351 mn 2.58 %- 17.9 %
IND
IVID
UA
LS
SM
E &
CO
RP
OR
AT
E
% Fixed Average
Rate*
Amount Chg %
YoY
36.5 %
Source: internal data
EL new performing exposures
disbursed in the period
Individual: 32 bps
Corporate: 47 bps
Retail: 59 bps
EL new originated loans
Portfolio 1H 2017: 49 bps
*Average rate from the beginning of the year
~ 1.147 mn of newly granted loans (Individuals and SMEs/Corporate) over the period
Expected Loss (EL) performing portfolio -3 bps since March 2017
**Net of institutional loans
14Consolidated results as at 30th June 2017
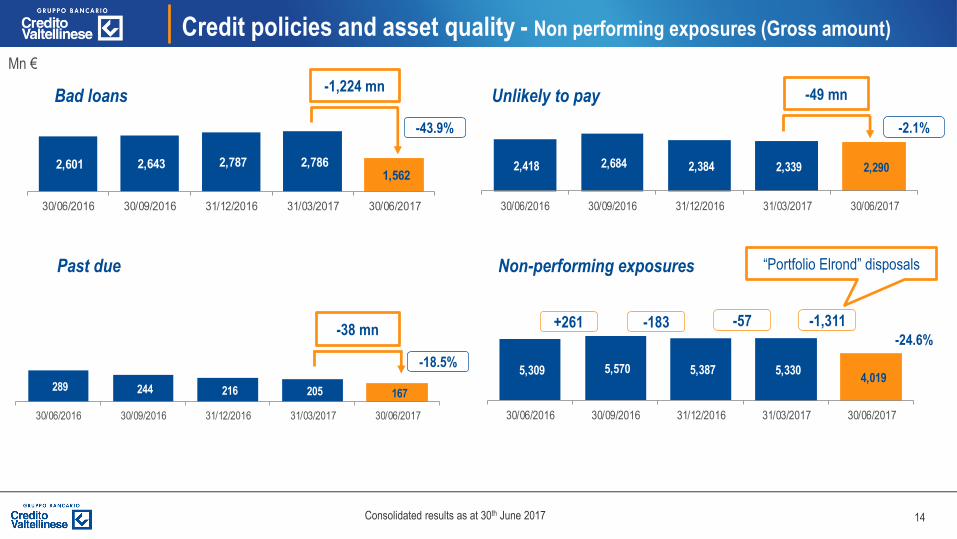
5,309 5,570 5,387 5,330 4,019
30/06/2016 30/09/2016 31/12/2016 31/03/2017 30/06/2017
2,418 2,684 2,384 2,339 2,290
30/06/2016 30/09/2016 31/12/2016 31/03/2017 30/06/2017
Credit policies and asset quality - Non performing exposures (Gross amount)
Non-performing exposures
Unlikely to pay
+261 -183 -57
Mn €
“Portfolio Elrond” disposals
2,601 2,643 2,787 2,786 1,562
30/06/2016 30/09/2016 31/12/2016 31/03/2017 30/06/2017
289 244 216 205 167
30/06/2016 30/09/2016 31/12/2016 31/03/2017 30/06/2017
-1,311
Bad loans
Past due
-49 mn-1,224 mn
-38 mn
-18.5%
-24.6%
-43.9% -2.1%

15Consolidated results as at 30th June 2017
Credit policies and asset quality – Gross Npe ratio
Npe ratio evolution: Creval vs Italian Banking System Average
Source: Moody’s report
Significant reduction
of the gap vs system
average, to the level in
2013
21.6%

16Consolidated results as at 30th June 2017
1,229 1,217 1,272 1,279 609
1,811 1,885 1,684 1,647
1,607
264 222 198 188
153
30/06/2016 30/09/2016 31/12/2016 31/03/2017 30/06/2017
Net Bad loans Net Unlikely to pay Net Past due
3,304 3,324 3,1543,114
2,369
Credit policies and asset quality – Asset quality (1/2)
Mn €
Net NPEs ̴ -935 mn since
June 2016 (-28.3%)

17Consolidated results as at 30th June 2017
Coverage Ratios 31/12/2016 30/06/2017
Bad loans 54.4% 61.0%
Unlikely to pay 29.4% 29.8%
Past due 8.2% 8.5%
0.68% 0.61% 0.53%
June 2016 December 2016 June 2017
37.8% 41.5% 41.0% 43.0%
June 2016 December 2016 June 2017 June 2017 includingwrite off
Credit policies and asset quality – Asset quality (2/2)
Mn €
Annual trend in line with the portfolio
improvement effect and new credit policy
Non-performing exposures Coverage Coverage Bonis
64.1% proforma including
write off (3.1%)
18Consolidated results as at 30th June 2017
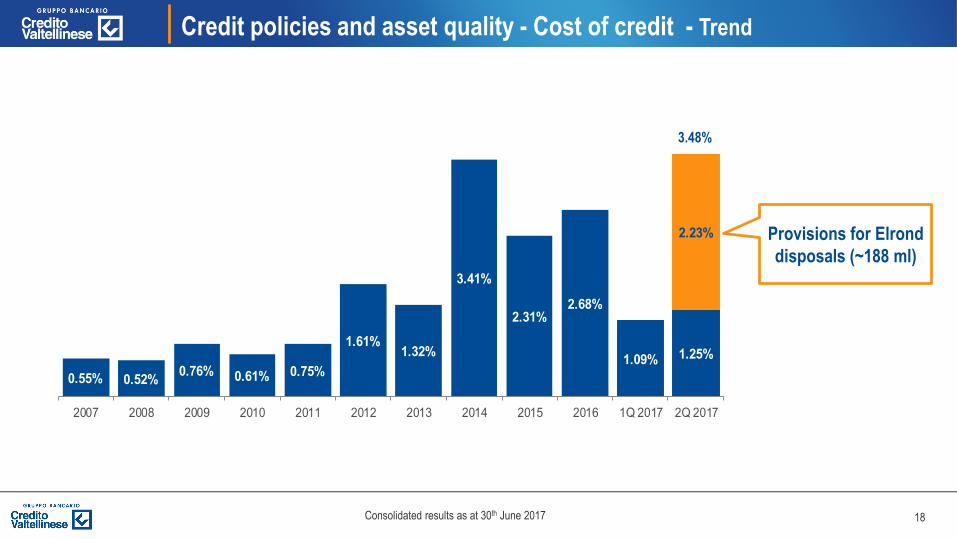
Credit policies and asset quality - Cost of credit - Trend
0.55% 0.52%0.76% 0.61% 0.75%
1.61%1.32%
3.41%
2.31%2.68%
1.09% 1.25%
2.23%
2007 2008 2009 2010 2011 2012 2013 2014 2015 2016 1Q 2017 2Q 2017
3.48%
Provisions for Elrond
disposals (~188 ml)
19Consolidated results as at 30th June 2017
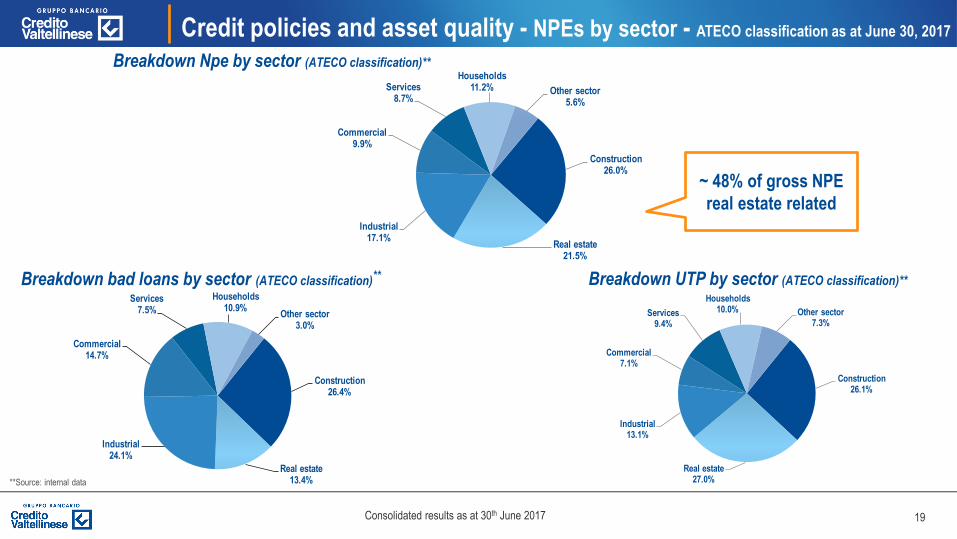
Credit policies and asset quality - NPEs by sector - ATECO classification as at June 30, 2017
Breakdown bad loans by sector (ATECO classification)** Breakdown UTP by sector (ATECO classification)**
**Source: internal data
Breakdown Npe by sector (ATECO classification)**
Construction26.0%
Real estate21.5%
Industrial17.1%
Commercial9.9%
Services8.7%
Households11.2% Other sector
5.6%
~ 48% of gross NPE
real estate related
Construction26.4%
Real estate13.4%
Industrial24.1%
Commercial14.7%
Services7.5%
Households10.9%
Other sector3.0%
Construction26.1%
Real estate27.0%
Industrial13.1%
Commercial7.1%
Services9.4%
Households10.0% Other sector
7.3%
20Consolidated results as at 30th June 2017
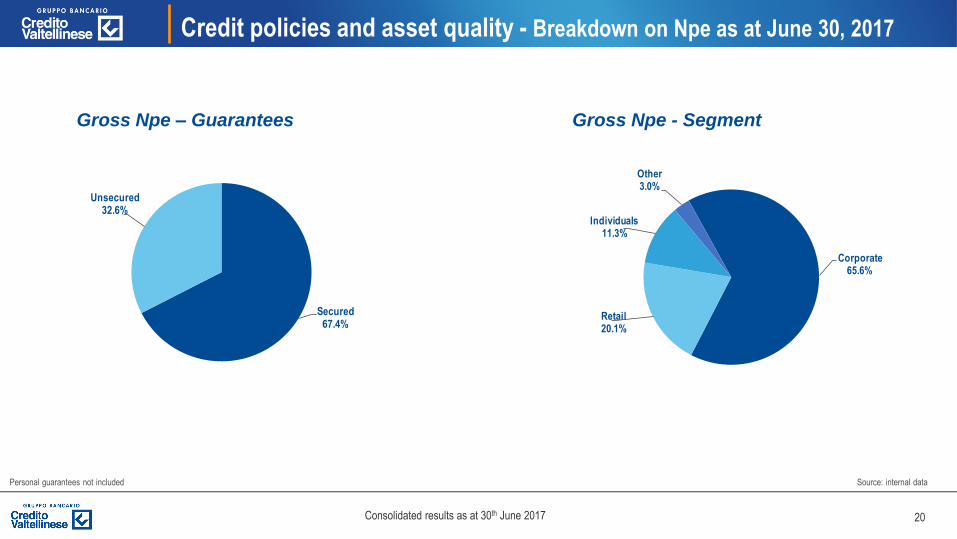
Corporate65.6%
Retail20.1%
Individuals11.3%
Other3.0%
Secured67.4%
Unsecured32.6%
Source: internal data
Gross Npe – Guarantees
Credit policies and asset quality - Breakdown on Npe as at June 30, 2017
Gross Npe - Segment
Personal guarantees not included
21Consolidated results as at 30th June 2017
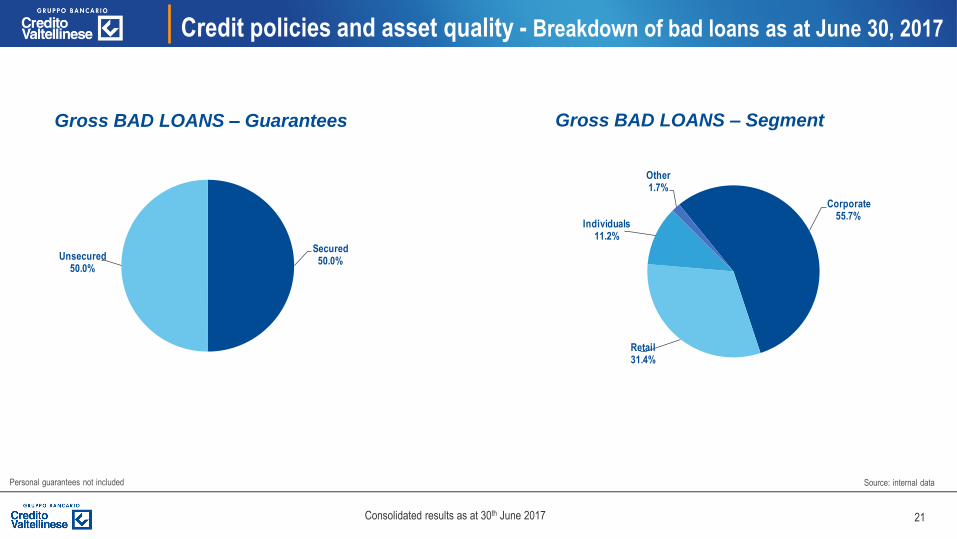
Secured50.0%Unsecured
50.0%
Source: internal data
Gross BAD LOANS – Guarantees Gross BAD LOANS – Segment
Personal guarantees not included
Credit policies and asset quality - Breakdown of bad loans as at June 30, 2017
Corporate55.7%
Retail31.4%
Individuals11.2%
Other1.7%
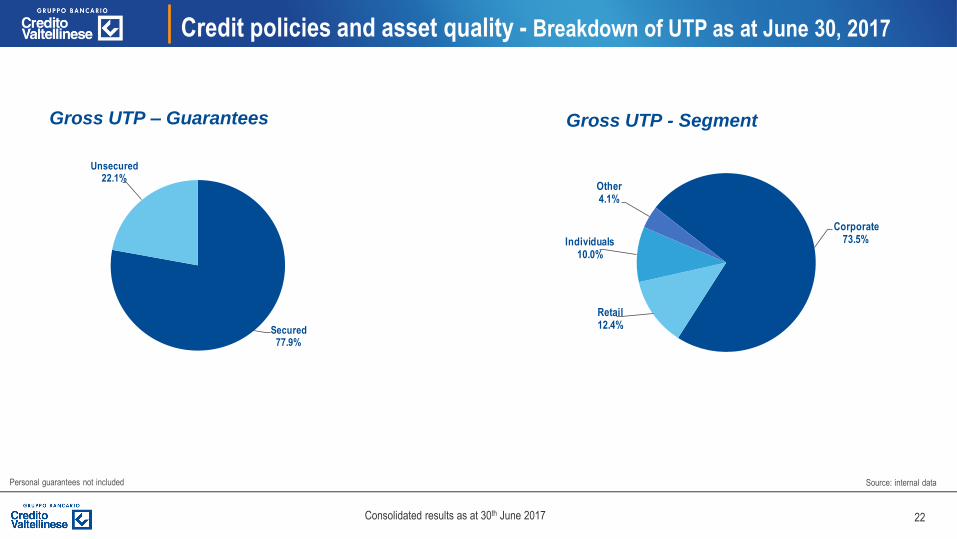
22Consolidated results as at 30th June 2017
Secured77.9%
Unsecured22.1%
Source: internal data
Gross UTP – Guarantees Gross UTP - Segment
Personal guarantees not included
Credit policies and asset quality - Breakdown of UTP as at June 30, 2017
Corporate73.5%
Retail12.4%
Individuals10.0%
Other4.1%
23Consolidated results as at 30th June 2017
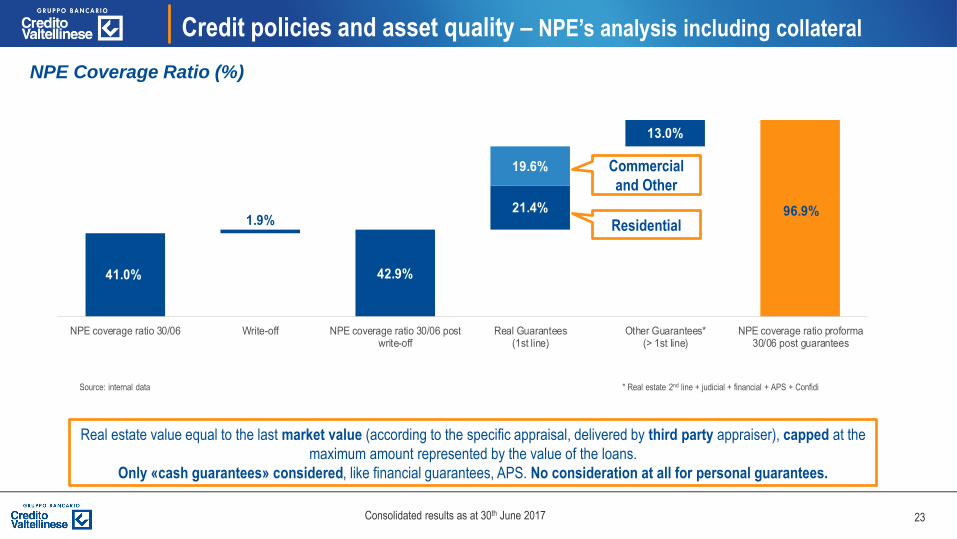
41.0% 42.9%
96.9%1.9%
21.4%
13.0%
19.6%
NPE coverage ratio 30/06 Write-off NPE coverage ratio 30/06 postwrite-off
Real Guarantees(1st line)
Other Guarantees*(> 1st line)
NPE coverage ratio proforma30/06 post guarantees
Credit policies and asset quality – NPE’s analysis including collateral
NPE Coverage Ratio (%)
Source: internal data * Real estate 2nd line + judicial + financial + APS + Confidi
Residential
Commercial
and Other
Real estate value equal to the last market value (according to the specific appraisal, delivered by third party appraiser), capped at the
maximum amount represented by the value of the loans.
Only «cash guarantees» considered, like financial guarantees, APS. No consideration at all for personal guarantees.
24Consolidated results as at 30th June 2017
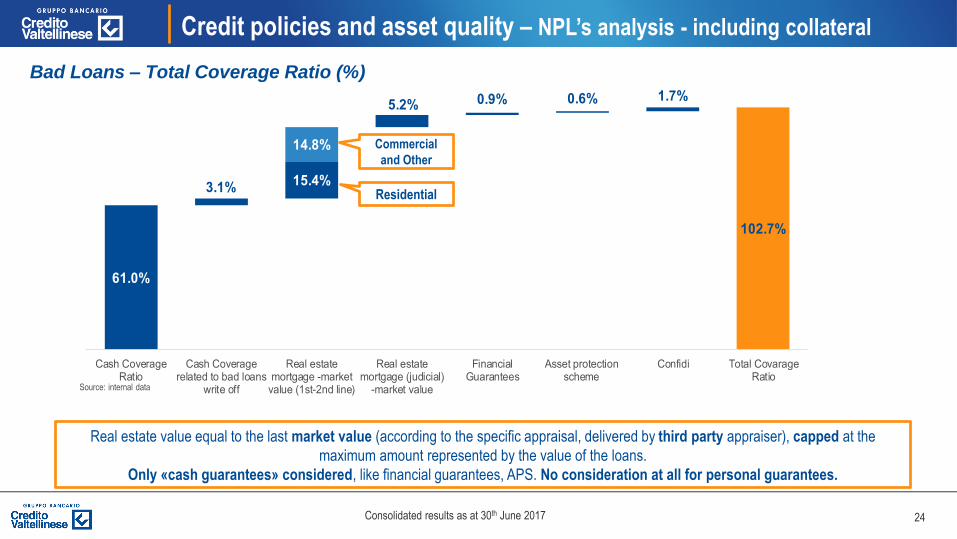
61.0%
102.7%
3.1%15.4%
5.2% 0.9% 0.6% 1.7%
14.8%
Cash CoverageRatio
Cash Coveragerelated to bad loans
write off
Real estatemortgage -market
value (1st-2nd line)
Real estatemortgage (judicial)
-market value
FinancialGuarantees
Asset protectionscheme
Confidi Total CovarageRatio
Credit policies and asset quality – NPL’s analysis - including collateral
Real estate value equal to the last market value (according to the specific appraisal, delivered by third party appraiser), capped at the
maximum amount represented by the value of the loans.
Only «cash guarantees» considered, like financial guarantees, APS. No consideration at all for personal guarantees.
Bad Loans – Total Coverage Ratio (%)
Residential
Commercial
and Other
Source: internal data

25Consolidated results as at 30th June 2017
Agenda
1. Overview of Elrond transaction
2. Credit policies and asset quality
3. Funding, liquidity and securities portfolio
4. Capital ratio
5. Revenues development
6. Cost management and Net profit development
7. Annexes
26Consolidated results as at 30th June 2017
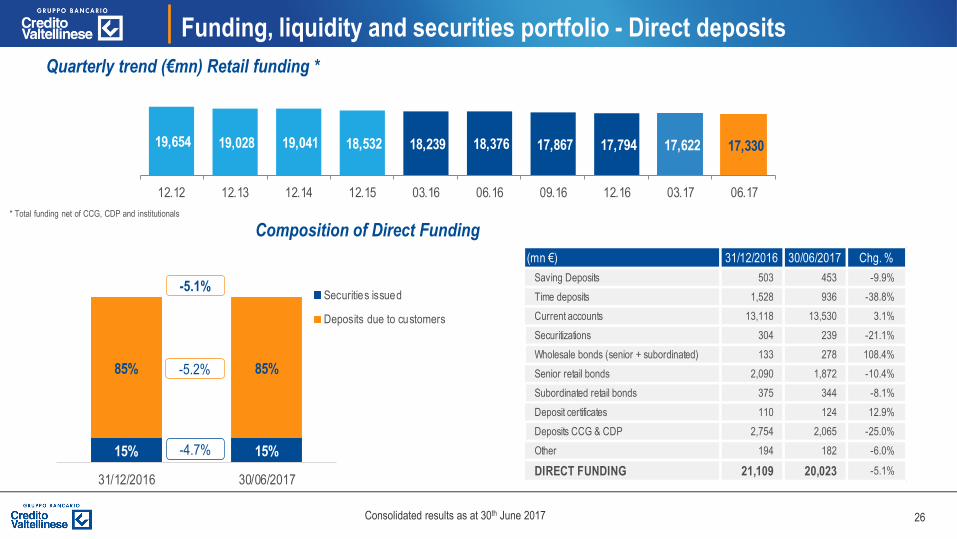
(mn €) 31/12/2016 30/06/2017 Chg. %
Saving Deposits 503 453 -9.9%
Time deposits 1,528 936 -38.8%
Current accounts 13,118 13,530 3.1%
Securitizations 304 239 -21.1%
Wholesale bonds (senior + subordinated) 133 278 108.4%
Senior retail bonds 2,090 1,872 -10.4%
Subordinated retail bonds 375 344 -8.1%
Deposit certificates 110 124 12.9%
Deposits CCG & CDP 2,754 2,065 -25.0%
Other 194 182 -6.0%
DIRECT FUNDING 21,109 20,023 -5.1%
15% 15%
85% 85%
31/12/2016 30/06/2017
Securities issued
Deposits due to customers
19,654 19,028 19,041 18,532 18,239 18,376 17,867 17,794 17,622 17,330
12.12 12.13 12.14 12.15 03.16 06.16 09.16 12.16 03.17 06.17
Funding, liquidity and securities portfolio - Direct deposits
* Total funding net of CCG, CDP and institutionals
Quarterly trend (€mn) Retail funding *
Composition of Direct Funding
-5.1%
-4.7%
-5.2%
27Consolidated results as at 30th June 2017
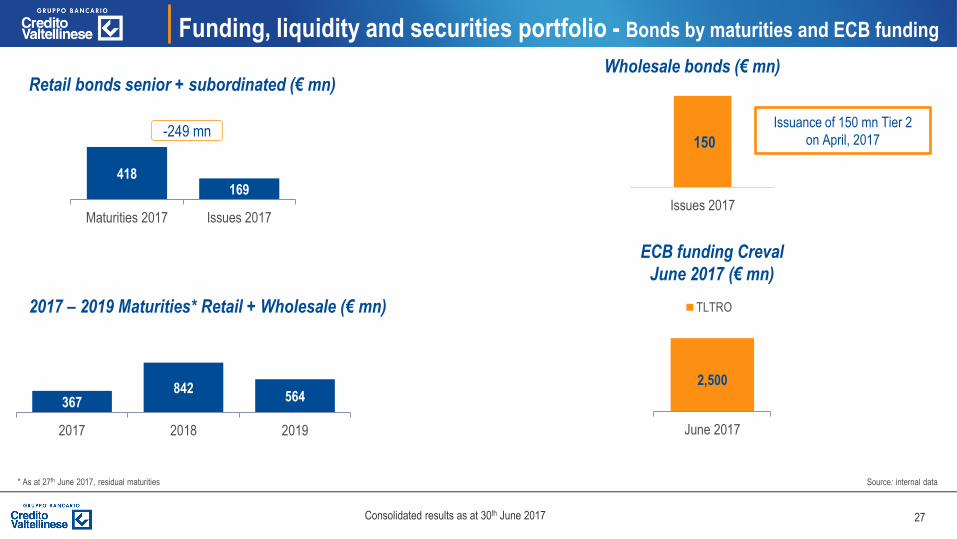
Funding, liquidity and securities portfolio - Bonds by maturities and ECB funding
* As at 27th June 2017, residual maturities
Retail bonds senior + subordinated (€ mn)
2017 – 2019 Maturities* Retail + Wholesale (€ mn)
Wholesale bonds (€ mn)
ECB funding Creval
June 2017 (€ mn)
418169
Maturities 2017 Issues 2017
-249 mn150
Issues 2017
367842
564
2017 2018 2019
2,500
June 2017
TLTRO
Source: internal data
Issuance of 150 mn Tier 2
on April, 2017
28Consolidated results as at 30th June 2017
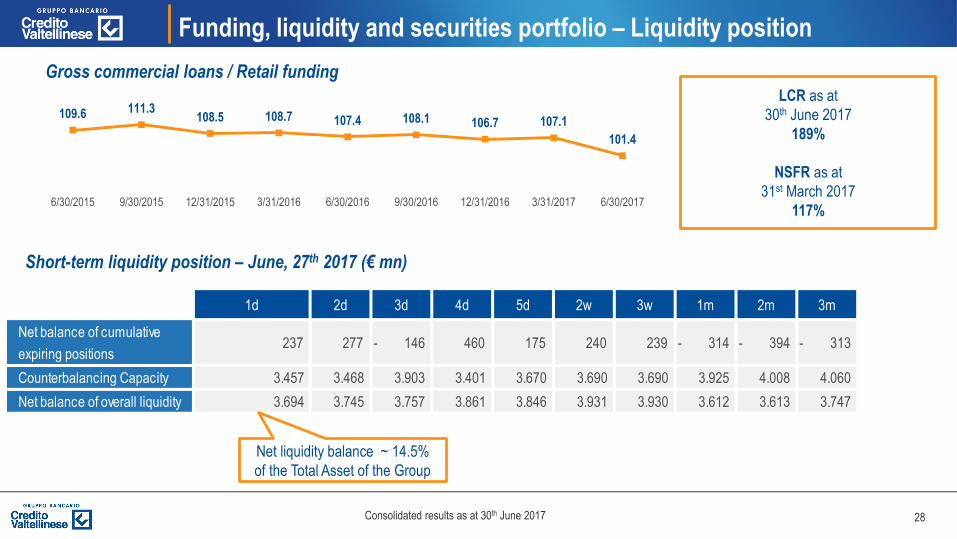
1d 2d 3d 4d 5d 2w 3w 1m 2m 3m
Net balance of cumulative
expiring positions 237 277 - 146 460 175 240 239 - 314 - 394 - 313
Counterbalancing Capacity 3.457 3.468 3.903 3.401 3.670 3.690 3.690 3.925 4.008 4.060
Net balance of overall liquidity 3.694 3.745 3.757 3.861 3.846 3.931 3.930 3.612 3.613 3.747
109.6 111.3108.5 108.7 107.4 108.1 106.7 107.1
101.4
6/30/2015 9/30/2015 12/31/2015 3/31/2016 6/30/2016 9/30/2016 12/31/2016 3/31/2017 6/30/2017
Funding, liquidity and securities portfolio – Liquidity position
Gross commercial loans / Retail funding
Short-term liquidity position – June, 27th 2017 (€ mn)
LCR as at
30th June 2017
189%
NSFR as at
31st March 2017
117%
Net liquidity balance ~ 14.5%
of the Total Asset of the Group
29Consolidated results as at 30th June 2017
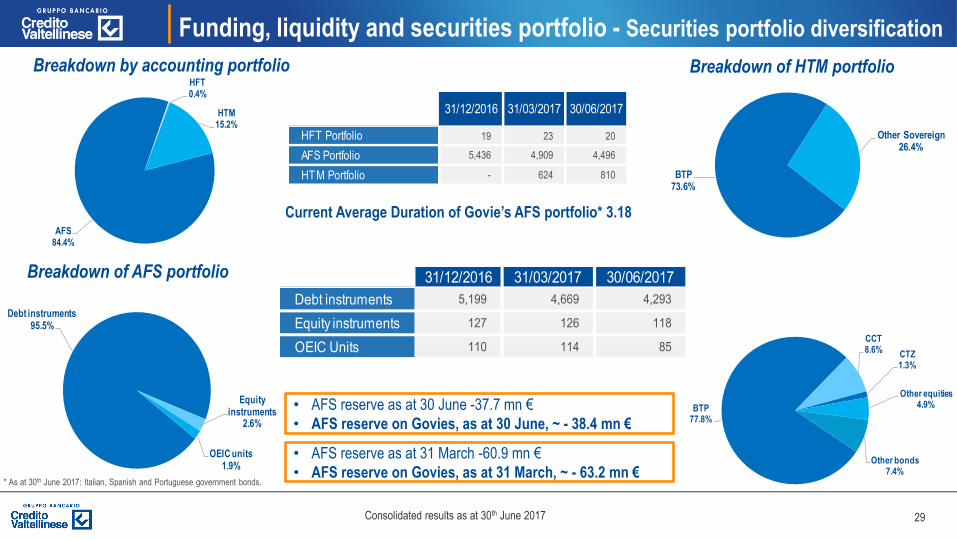
AFS84.4%
HFT0.4%
HTM15.2%
31/12/2016 31/03/2017 30/06/2017
HFT Portfolio 19 23 20
AFS Portfolio 5,436 4,909 4,496
HTM Portfolio - 624 810
Funding, liquidity and securities portfolio - Securities portfolio diversification
Current Average Duration of Govie’s AFS portfolio* 3.18
Breakdown by accounting portfolio
31/12/2016 31/03/2017 30/06/2017
Debt instruments 5,199 4,669 4,293
Equity instruments 127 126 118
OEIC Units 110 114 85
• AFS reserve as at 31 March -60.9 mn €
• AFS reserve on Govies, as at 31 March, ~ - 63.2 mn €
• AFS reserve as at 30 June -37.7 mn €
• AFS reserve on Govies, as at 30 June, ~ - 38.4 mn €
Debt instruments95.5%
Equity instruments
2.6%
OEIC units1.9%
BTP77.8%
CCT8.6%
CTZ1.3%
Other equities4.9%
Other bonds7.4%
* As at 30th June 2017: Italian, Spanish and Portuguese government bonds.
Breakdown of AFS portfolio
Breakdown of HTM portfolio
BTP73.6%
Other Sovereign26.4%
30Consolidated results as at 30th June 2017
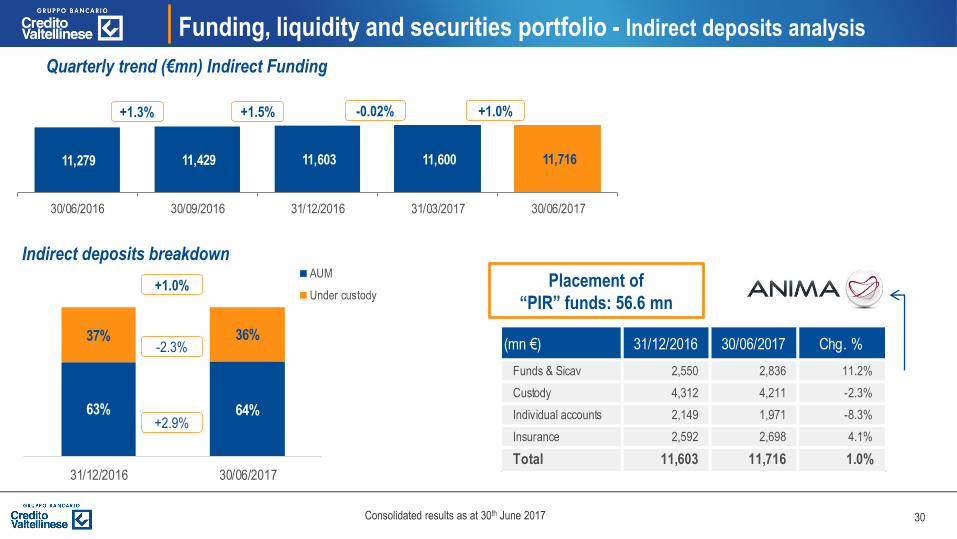
63% 64%
37% 36%
31/12/2016 30/06/2017
AUM
Under custody
11,279 11,429 11,603 11,600 11,716
30/06/2016 30/09/2016 31/12/2016 31/03/2017 30/06/2017
Funding, liquidity and securities portfolio - Indirect deposits analysis
Quarterly trend (€mn) Indirect Funding
Indirect deposits breakdown
+1.3% +1.5% -0.02%
+1.0%
+2.9%
-2.3%
+1.0%
(mn €) 31/12/2016 30/06/2017 Chg. %
Funds & Sicav 2,550 2,836 11.2%
Custody 4,312 4,211 -2.3%
Individual accounts 2,149 1,971 -8.3%
Insurance 2,592 2,698 4.1%
Total 11,603 11,716 1.0%
Placement of
“PIR” funds: 56.6 mn
31Consolidated results as at 30th June 2017
Agenda
1. Overview of Elrond transaction
2. Credit policies and asset quality
3. Funding, liquidity and securities portfolio
4. Capital ratio
5. Revenues development
6. Cost management and Net profit development
7. Annexes
32Consolidated results as at 30th June 2017
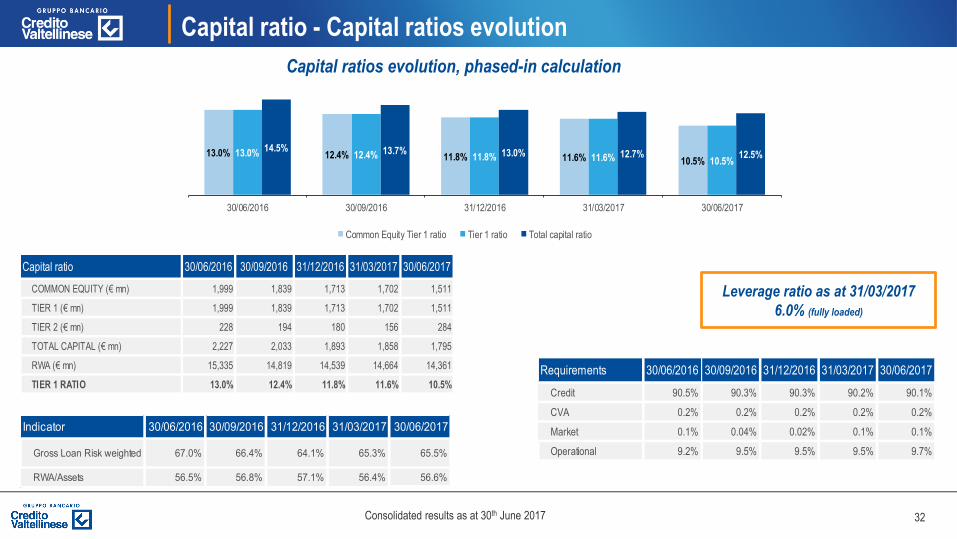
Capital ratio - Capital ratios evolution
Capital ratios evolution, phased-in calculation
Requirements 30/06/2016 30/09/2016 31/12/2016 31/03/2017 30/06/2017
Credit 90.5% 90.3% 90.3% 90.2% 90.1%
CVA 0.2% 0.2% 0.2% 0.2% 0.2%
Market 0.1% 0.04% 0.02% 0.1% 0.1%
Operational 9.2% 9.5% 9.5% 9.5% 9.7%
Leverage ratio as at 31/03/2017
6.0% (fully loaded)
Indicator 30/06/2016 30/09/2016 31/12/2016 31/03/2017 30/06/2017
Gross Loan Risk weighted 67.0% 66.4% 64.1% 65.3% 65.5%
RWA/Assets 56.5% 56.8% 57.1% 56.4% 56.6%
Capital ratio 30/06/2016 30/09/2016 31/12/2016 31/03/2017 30/06/2017
COMMON EQUITY (€ mn) 1,999 1,839 1,713 1,702 1,511
TIER 1 (€ mn) 1,999 1,839 1,713 1,702 1,511
TIER 2 (€ mn) 228 194 180 156 284
TOTAL CAPITAL (€ mn) 2,227 2,033 1,893 1,858 1,795
RWA (€ mn) 15,335 14,819 14,539 14,664 14,361
TIER 1 RATIO 13.0% 12.4% 11.8% 11.6% 10.5%
13.0% 12.4% 11.8% 11.6% 10.5%13.0% 12.4% 11.8% 11.6% 10.5%
14.5% 13.7% 13.0% 12.7% 12.5%
30/06/2016 30/09/2016 31/12/2016 31/03/2017 30/06/2017
Common Equity Tier 1 ratio Tier 1 ratio Total capital ratio

33Consolidated results as at 30th June 2017
11.1%
10.2% 10.19%10.5% 10.52% 10.8%
0.2% 0.5%
-1.5%
-0.2%-0.1% 0.1% 0.1% 0.3%
0.3%
CET1 FL1Q2017
AFS reserve Real estate deal Project Elrond Atlante General Finance TransformationDTA into tax
credits
Other elements CET1 FL2Q2017
Transitional CET1 Phase-in2Q2017
Elrond 3Q2017 CET1 Phase-in2Q2017 Pro-
forma
Capital Ratio - CET1 ratio evolution
Write off
AtlanteAcquisition of
General Finance
34Consolidated results as at 30th June 2017
Agenda
1. Overview of Elrond transaction
2. Credit policies and asset quality
3. Funding, liquidity and securities portfolio
4. Capital ratio
5. Revenues development
6. Cost management and Net profit development
7. Annexes

35Consolidated results as at 30th June 2017
198.8
365.6
142.3
3.010.8 10,7
NII Net fees andcommissions
Div. & profits on inv. inass. comp.
Trading income Other net income Operating income
Revenues development – Operating income development
93.3% of revenues from core
business (NII + Fees)
Chg % 2Q 2017 –
2Q 2016 -5.8% +4.4% -30.8% -69.7% +22.3% -7.7%
36Consolidated results as at 30th June 2017
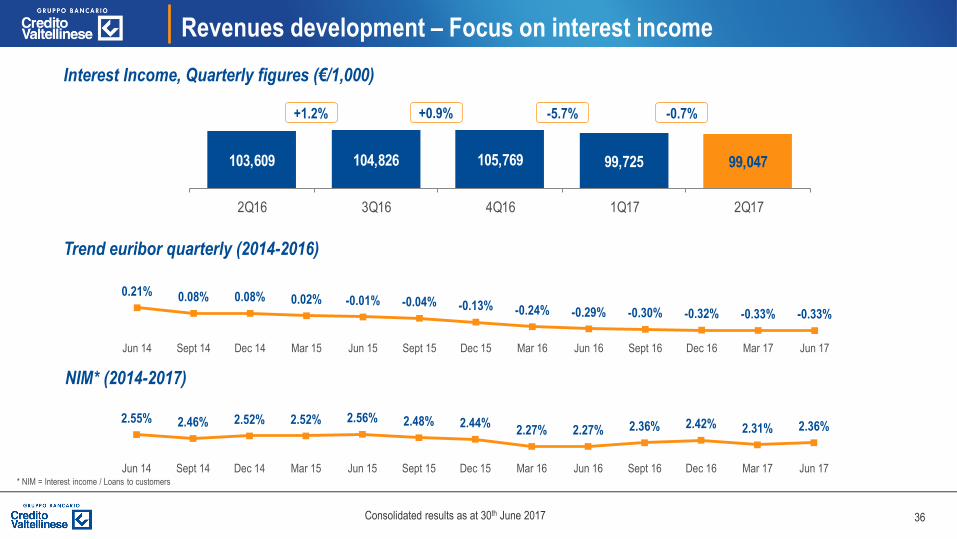
103,609 104,826 105,769 99,725 99,047
2Q16 3Q16 4Q16 1Q17 2Q17
Revenues development – Focus on interest income
Interest Income, Quarterly figures (€/1,000)
Trend euribor quarterly (2014-2016)
+1.2% +0.9% -5.7%
NIM* (2014-2017)
* NIM = Interest income / Loans to customers
-0.7%
2.55% 2.46% 2.52% 2.52% 2.56% 2.48% 2.44%2.27% 2.27% 2.36% 2.42% 2.31% 2.36%
Jun 14 Sept 14 Dec 14 Mar 15 Jun 15 Sept 15 Dec 15 Mar 16 Jun 16 Sept 16 Dec 16 Mar 17 Jun 17
0.21% 0.08% 0.08% 0.02% -0.01% -0.04% -0.13% -0.24% -0.29% -0.30% -0.32% -0.33% -0.33%
Jun 14 Sept 14 Dec 14 Mar 15 Jun 15 Sept 15 Dec 15 Mar 16 Jun 16 Sept 16 Dec 16 Mar 17 Jun 17

37Consolidated results as at 30th June 2017
12,749 8,054 7,846 6,181 5,260 5,554 6,296 6,528 4,385
107,734106,307 104,767 101,310 98,349 99,272 99,473 93,197 94,662
2Q15 3Q15 4Q15 1Q16 2Q16 3Q16 4Q16 1Q17 2Q17
Carry trade, finance, interbank and other Commercial interest margin
Revenues development – Focus on interest income
*Interest financial assets – Interest due to central counterparties – Interest term deposits with central bank – Hedging results – Interest loans to banks – Interest income securities – Interest banks – Other interest
4.4% of NII related to carry trade,
finance and interbank
The 2Q2017 amount
includes the effect of the
issuance (April 2017)
of sub debt for 150 ml
38Consolidated results as at 30th June 2017
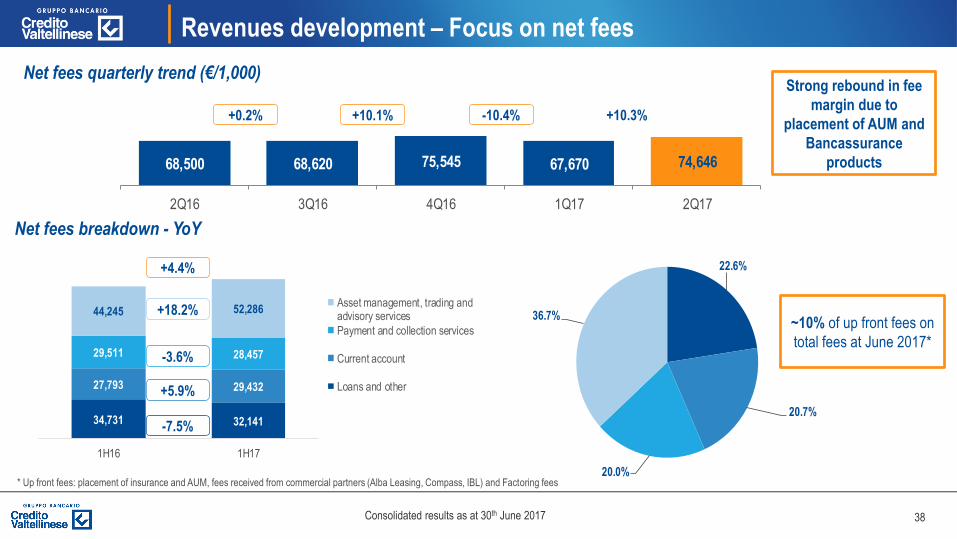
22.6%
20.7%
20.0%
36.7%
34,731 32,141
27,793 29,432
29,511 28,457
44,245 52,286
1H16 1H17
Asset management, trading andadvisory services
Payment and collection services
Current account
Loans and other
68,500 68,620 75,545 67,670 74,646
2Q16 3Q16 4Q16 1Q17 2Q17
Revenues development – Focus on net fees
Net fees quarterly trend (€/1,000)
Net fees breakdown - YoY
+0.2% +10.1%
~10% of up front fees on
total fees at June 2017*
* Up front fees: placement of insurance and AUM, fees received from commercial partners (Alba Leasing, Compass, IBL) and Factoring fees
-7.5%
+5.9%
-3.6%
+18.2%
+4.4%
-10.4% +10.3%
Strong rebound in fee
margin due to
placement of AUM and
Bancassurance
products
39Consolidated results as at 30th June 2017
Agenda
1. Overview of Elrond transaction
2. Credit policies and asset quality
3. Funding, liquidity and securities portfolio
4. Capital ratio
5. Revenues development
6. Cost management and Net profit development
7. Annexes

40Consolidated results as at 30th June 2017
261,152 255,880
1h 2016 1h 2017
1.92% 2.02%
30/06/2016 30/06/2017
Cost income ratio
Cost management and Net profit development - Operating result and cost income
Operating result development (€ mn)
Cost to asset ratio
Action plan Creval 2017-2018:
88 branches closed
(of which 23 in 2016 and 65 in 1H 2017)
Operating expenses annualized / Total Asset
365.6
109.7
134.3
107.7
13.9
Operating Income Personnel expenses Other admin. expenses Amortization Net operating margin
Including 7.9 mn of provisions for
the Single Resolution Found
(SRF)
Chg % 1Q 2017 –
1Q 2016 -7.7% -8.2% +9.1% -13.7% -18.8%
Operating expenses* (€ /1,000)
-2.0%
65.9% 70.0%
1H 2016 1H 2017

41Consolidated results as at 30th June 2017
543 543 544 543 539 526 503438
2010 2011 2012 2013 2014 2015 2016 giu-17
4,514 4,4824,362 4,312 4,275
4,1234,055
3,938
2010 2011 2012 2013 2014 2015 2016 giu-17
Number of employees
Cost management and Net profit development – branches and personnel
Number of branches
-576 employees
since 2010 (-13%)
-105 branches since
2010 (-19%)

42Consolidated results as at 30th June 2017
243,557
266,234 273,551 280,468
12.14 12.15 12.16 06.17
Cost management and Net profit development - “Customer base” as at 30.06.2017
970 k customers
Cross selling ~ 4.1
Retention rate** ~ 96.0%
+ 2.5 %
~ 177,606 downloaded apps*
+20% YoY
*As at 30/06/2017; source: internal data**Source: customer satisfaction survey – households – as at 30.06.2017
Active Internet Banking Users
17,986,067
19,740,109
H2 2016 H1 2017
+ 9.8 %
Bancaperta access H1 2017
43Consolidated results as at 30th June 2017
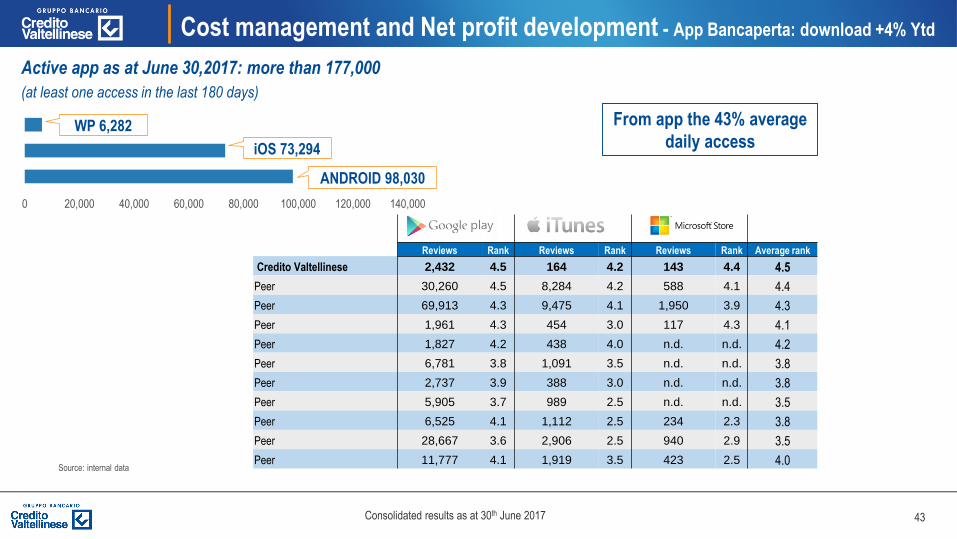
Cost management and Net profit development - App Bancaperta: download +4% Ytd
Reviews Rank Reviews Rank Reviews Rank Average rank
Credito Valtellinese 2,432 4.5 164 4.2 143 4.4 4.5
Peer 30,260 4.5 8,284 4.2 588 4.1 4.4
Peer 69,913 4.3 9,475 4.1 1,950 3.9 4.3
Peer 1,961 4.3 454 3.0 117 4.3 4.1
Peer 1,827 4.2 438 4.0 n.d. n.d. 4.2
Peer 6,781 3.8 1,091 3.5 n.d. n.d. 3.8
Peer 2,737 3.9 388 3.0 n.d. n.d. 3.8
Peer 5,905 3.7 989 2.5 n.d. n.d. 3.5
Peer 6,525 4.1 1,112 2.5 234 2.3 3.8
Peer 28,667 3.6 2,906 2.5 940 2.9 3.5
Peer 11,777 4.1 1,919 3.5 423 2.5 4.0
0 20,000 40,000 60,000 80,000 100,000 120,000 140,000
ANDROID 98,030
iOS 73,294
WP 6,282 From app the 43% average
daily access
Source: internal data
Active app as at June 30,2017: more than 177,000
(at least one access in the last 180 days)

44Consolidated results as at 30th June 2017
Cost management and Net profit development - Online data trend
79% 81%
H2 2016 H1 2017
+ 3%
77.4% 78.0%
H2 2016 H1 2017
+ 0.8%
73.9%77.4%
H2 2016 H1 2017
49.3%54.4%
H2 2016 H1 2017
+ 5%+ 10%
Source: internal data
% trading online
% money transfer online % F24 online
Fees and commissions on trading online
45Consolidated results as at 30th June 2017
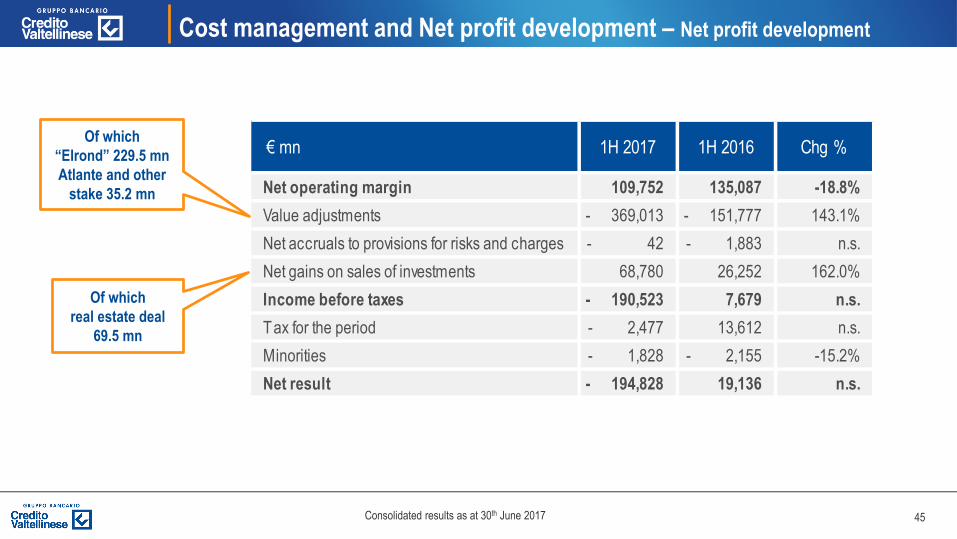
Cost management and Net profit development – Net profit development
€ mn 1H 2017 1H 2016 Chg %
Net operating margin 109,752 135,087 -18.8%
Value adjustments - 369,013 - 151,777 143.1%
Net accruals to provisions for risks and charges - 42 - 1,883 n.s.
Net gains on sales of investments 68,780 26,252 162.0%
Income before taxes - 190,523 7,679 n.s.
Tax for the period - 2,477 13,612 n.s.
Minorities - 1,828 - 2,155 -15.2%
Net result - 194,828 19,136 n.s.
Of which
“Elrond” 229.5 mn
Atlante and other
stake 35.2 mn
Of which
real estate deal
69.5 mn

46Consolidated results as at 30th June 2017
Cost management and Net profit development - Extraordinary Items
Extraordinary Items June 2017
Loss for UTP disposal -13.4
Sale of Anima 9.3
Operating Cost (Elrond) -5.0
LLP and other provisions (Elrond) -229.5
Write off of Atlante Fund and other -35.2
Profit from sale of investment 69.7
Personnel extraordinary contribution 7.5
Extraordinary Items -196.6
Pre-Tax Result -190.5
Restated Pre-Tax Result 6.1
47Consolidated results as at 30th June 2017
Agenda
1. Overview of Elrond transaction
2. Credit policies and asset quality
3. Funding, liquidity and securities portfolio
4. Capital ratio
5. Revenues development
6. Cost management and Net profit development
7. Annexes

48Consolidated results as at 30th June 2017
Annexes – Focus on DTA
Convertible DTA L. 214/2011 - Convertible into tax credits. The
recovery is certain regardless of future taxable income457 Transitional & Fully Loaded: Not deducted from CET1 - 100% RWA
DTA related to temporary differences - The recovery is subject to
future taxable income91
Transitional: Deducted from CET1 if they exceed 10% of adjusted CET1 and
if, addedd to significant holdings, they exceed 15% of adjusted CET1. Amounts
in excess deducted at phasing-in percentage (80% in 2017 for DTA arisen
after 1.1.2014 & 30% in 2017 for DTA arisen before 1.1.2014)
Fully Loaded: deducted from CET1 if they exceed 10% of adjusted CET1 and
if, added to significant holdings, they exceed 17.65% of adjusted CET1.
Amounts in excess deducted from CET1
DTA related to fiscal losses - The recovery is subject to future
taxable income60 Transitional: Deducted from CET1 (80% in 2017, 100% in 2018)
Fully Loaded: 100% deducted from CET1
Total DTA recognized in balance sheet 608
DTA not recognized in balance sheet 107.5DTA related to income losses and not recorded due to the probability
test outcome
Mn €
49Consolidated results as at 30th June 2017
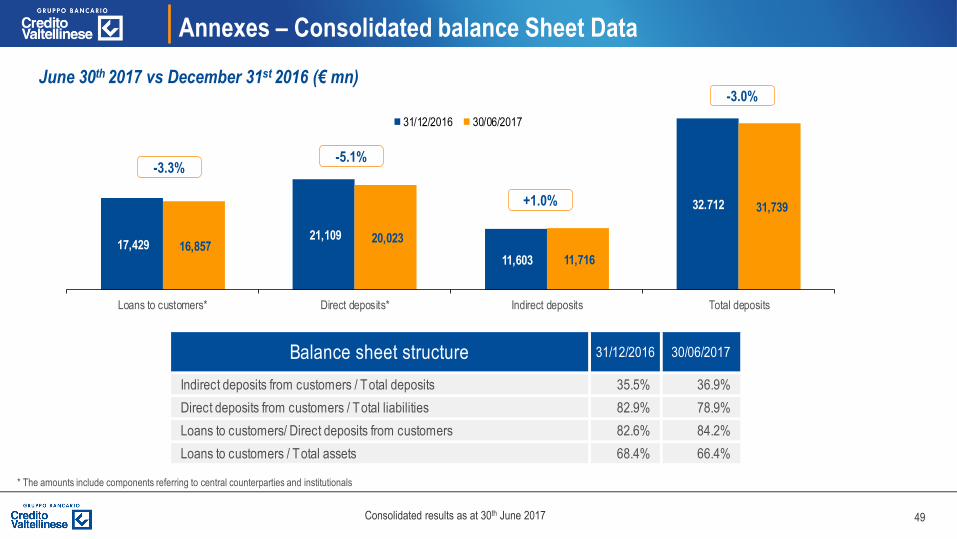
17,429 21,109
11,603
32.712
16,857 20,023
11,716
31,739
Loans to customers* Direct deposits* Indirect deposits Total deposits
31/12/2016 30/06/2017
Annexes – Consolidated balance Sheet Data
June 30th 2017 vs December 31st 2016 (€ mn)
* The amounts include components referring to central counterparties and institutionals
-3.0%
+1.0%
-5.1%-3.3%
Balance sheet structure 31/12/2016 30/06/2017
Indirect deposits from customers / Total deposits 35.5% 36.9%
Direct deposits from customers / Total liabilities 82.9% 78.9%
Loans to customers/ Direct deposits from customers 82.6% 84.2%
Loans to customers / Total assets 68.4% 66.4%
50Consolidated results as at 30th June 2017
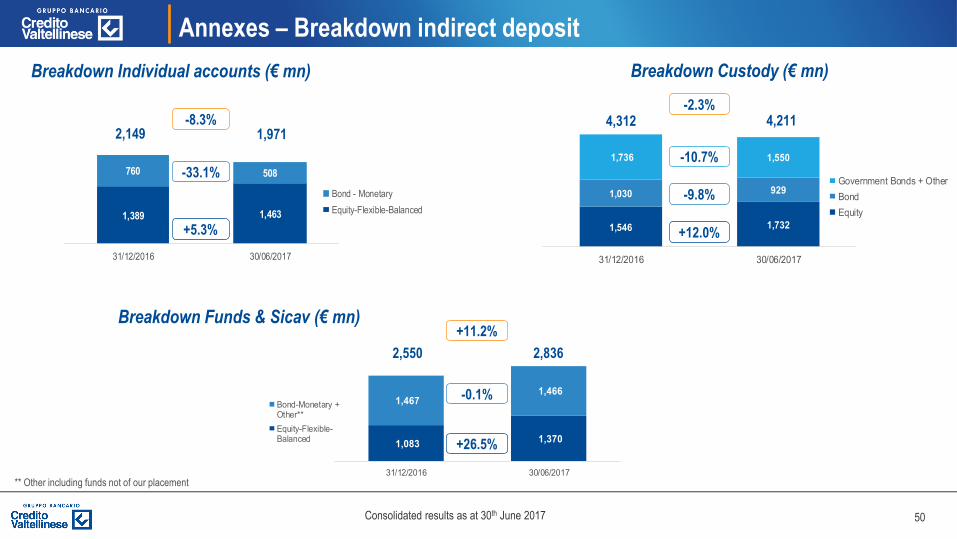
1,083 1,370
1,467 1,466
31/12/2016 30/06/2017
Bond-Monetary +Other**
Equity-Flexible-Balanced
1,389 1,463
760 508
31/12/2016 30/06/2017
Bond - Monetary
Equity-Flexible-Balanced
1,546 1,732
1,030 929
1,736 1,550
31/12/2016 30/06/2017
Government Bonds + Other
Bond
Equity
Annexes – Breakdown indirect deposit
Breakdown Individual accounts (€ mn)
** Other including funds not of our placement
-33.1%
+5.3%
-8.3%2,149
Breakdown Custody (€ mn)
Breakdown Funds & Sicav (€ mn)
1,971
+12.0%
-9.8%
-10.7%
-2.3%4,312 4,211
+26.5%
-0.1%
+11.2%
2,550 2,836
51Consolidated results as at 30th June 2017
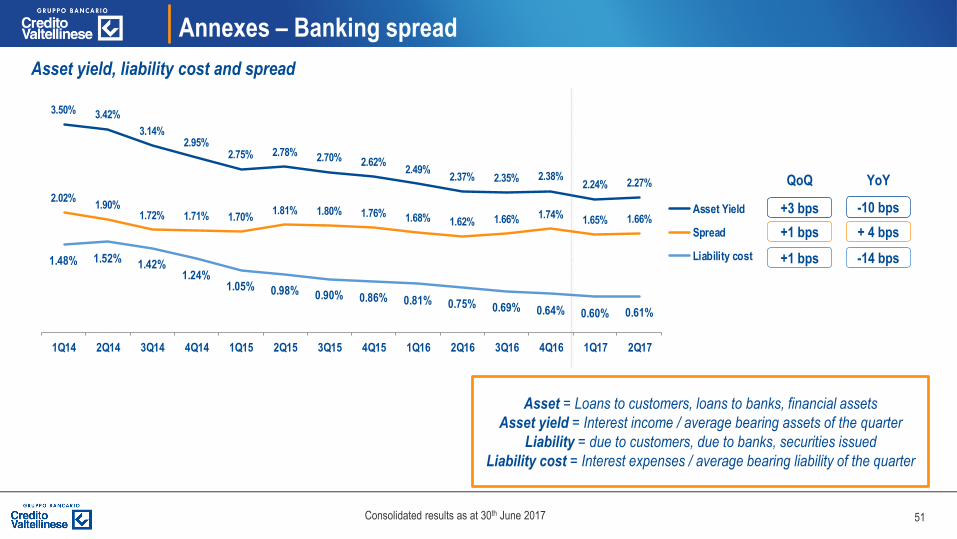
3.50% 3.42%
3.14%2.95%
2.75% 2.78% 2.70% 2.62%2.49%
2.37% 2.35% 2.38%2.24% 2.27%
2.02%1.90%
1.72% 1.71% 1.70%1.81% 1.80% 1.76% 1.68% 1.62% 1.66% 1.74%
1.65% 1.66%
1.48% 1.52%1.42%
1.24%1.05% 0.98% 0.90% 0.86% 0.81% 0.75% 0.69% 0.64% 0.60% 0.61%
1Q14 2Q14 3Q14 4Q14 1Q15 2Q15 3Q15 4Q15 1Q16 2Q16 3Q16 4Q16 1Q17 2Q17
Asset Yield
Spread
Liability cost +1 bps
+1 bps
Annexes – Banking spread
Asset yield, liability cost and spread
Asset = Loans to customers, loans to banks, financial assets
Asset yield = Interest income / average bearing assets of the quarter
Liability = due to customers, due to banks, securities issued
Liability cost = Interest expenses / average bearing liability of the quarter
QoQ
-10 bps
-14 bps
+ 4 bps
YoY
+3 bps
52Consolidated results as at 30th June 2017
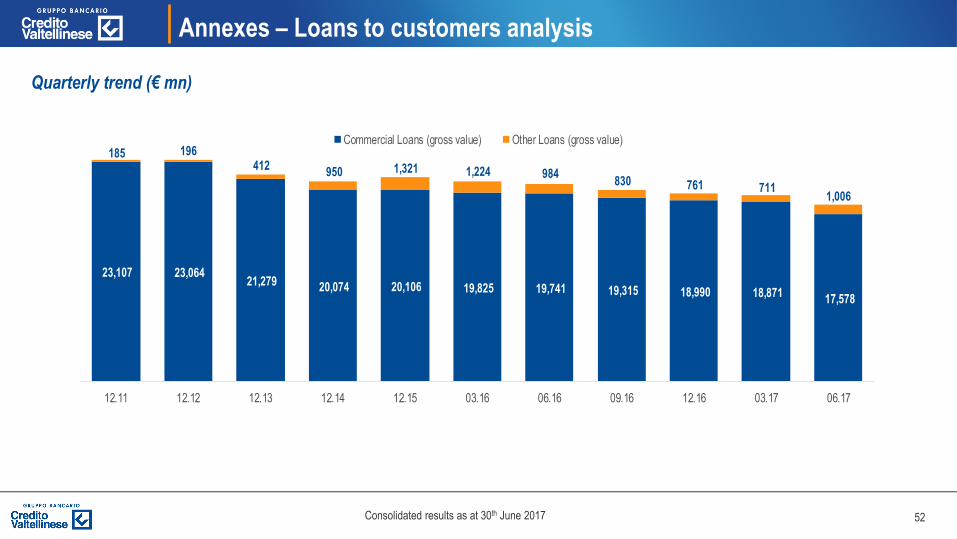
Annexes – Loans to customers analysis
Quarterly trend (€ mn)
23,107 23,064 21,279 20,074 20,106 19,825 19,741 19,315 18,990 18,871
17,578
185 196 412
950 1,321 1,224 984 830 761 711
1,006
12.11 12.12 12.13 12.14 12.15 03.16 06.16 09.16 12.16 03.17 06.17
Commercial Loans (gross value) Other Loans (gross value)
53Consolidated results as at 30th June 2017
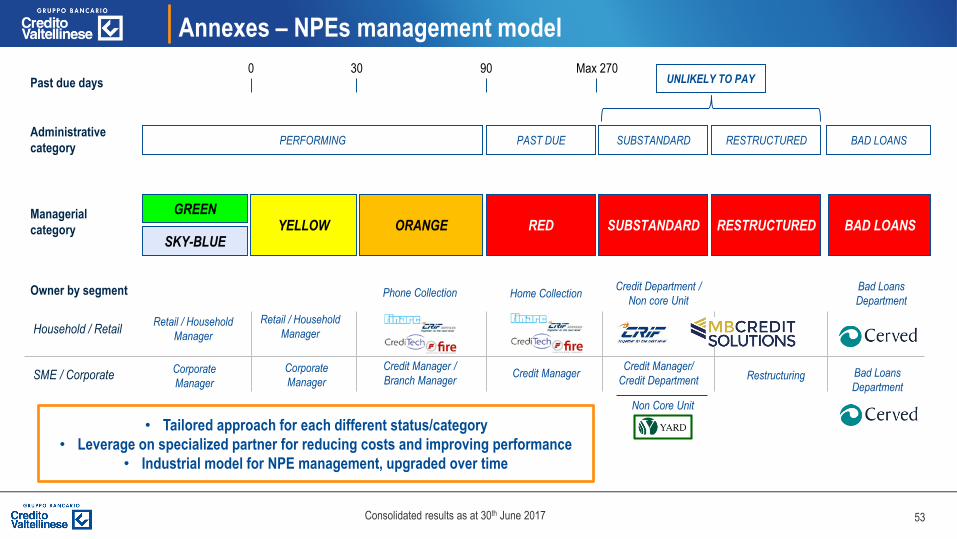
Annexes – NPEs management model
Past due days0 30 90
Administrative
category
Managerial
category
PERFORMING PAST DUE SUBSTANDARD RESTRUCTURED
GREEN
SKY-BLUEYELLOW ORANGE RED SUBSTANDARD RESTRUCTURED
Max 270
Owner by segment
Household / Retail
SME / Corporate
Retail / Household
Manager
Corporate
Manager
Retail / Household
Manager
Corporate
Manager
Phone Collection Home CollectionCredit Department /
Non core Unit
Credit Manager /
Branch ManagerCredit Manager
Credit Manager/
Credit Department Restructuring
UNLIKELY TO PAY
Non Core Unit
BAD LOANS
Bad Loans
Department
• Tailored approach for each different status/category
• Leverage on specialized partner for reducing costs and improving performance
• Industrial model for NPE management, upgraded over time
BAD LOANS
Bad Loans
Department
54Consolidated results as at 30th June 2017
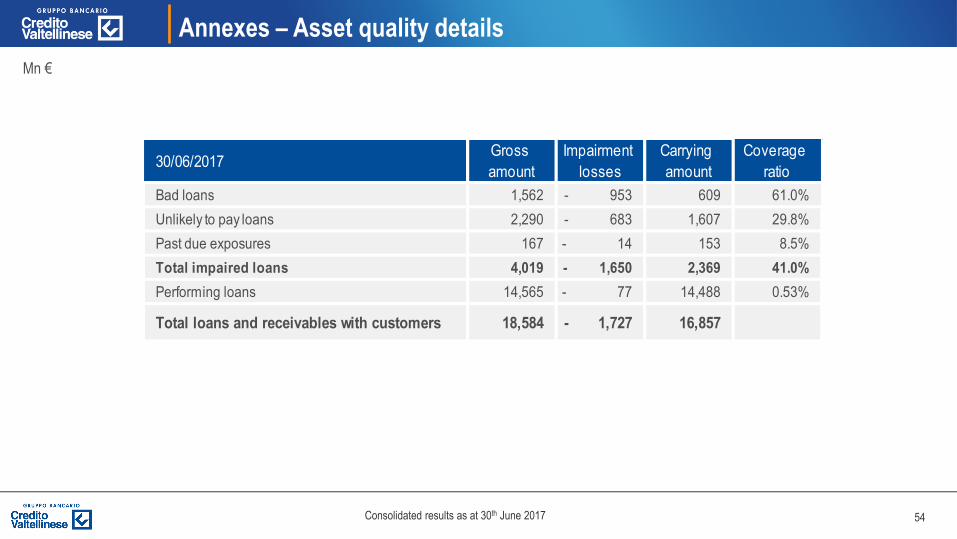
Annexes – Asset quality details
Mn €
30/06/2017Gross
amount
Impairment
losses
Carrying
amount
Coverage
ratio
Bad loans 1,562 - 953 609 61.0%
Unlikely to pay loans 2,290 - 683 1,607 29.8%
Past due exposures 167 - 14 153 8.5%
Total impaired loans 4,019 - 1,650 2,369 41.0%
Performing loans 14,565 - 77 14,488 0.53%
Total loans and receivables with customers 18,584 - 1,727 16,857
55Consolidated results as at 30th June 2017
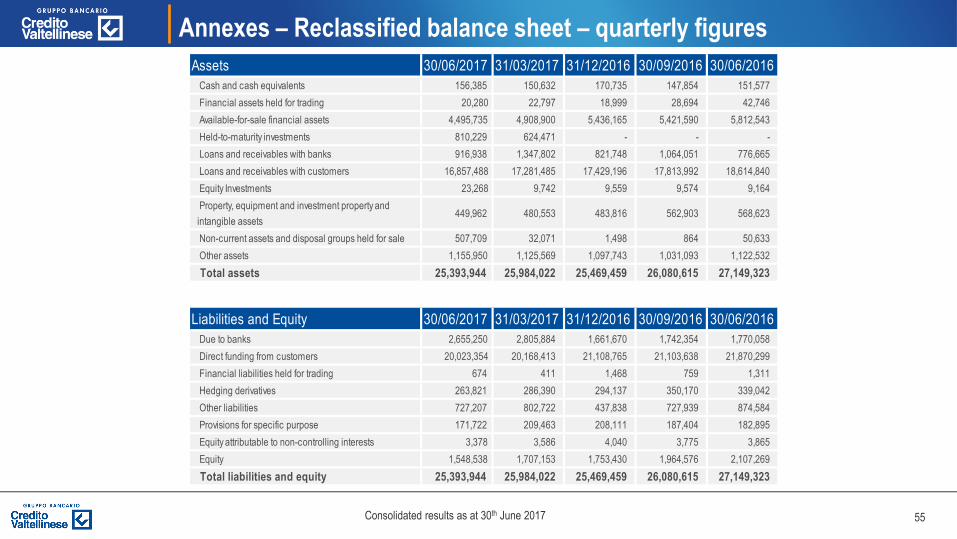
Annexes – Reclassified balance sheet – quarterly figures
Assets 30/06/2017 31/03/2017 31/12/2016 30/09/2016 30/06/2016
Cash and cash equivalents 156,385 150,632 170,735 147,854 151,577
Financial assets held for trading 20,280 22,797 18,999 28,694 42,746
Available-for-sale financial assets 4,495,735 4,908,900 5,436,165 5,421,590 5,812,543
Held-to-maturity investments 810,229 624,471 - - -
Loans and receivables with banks 916,938 1,347,802 821,748 1,064,051 776,665
Loans and receivables with customers 16,857,488 17,281,485 17,429,196 17,813,992 18,614,840
Equity Investments 23,268 9,742 9,559 9,574 9,164
Property, equipment and investment property and
intangible assets 449,962 480,553 483,816 562,903 568,623
Non-current assets and disposal groups held for sale 507,709 32,071 1,498 864 50,633
Other assets 1,155,950 1,125,569 1,097,743 1,031,093 1,122,532
Total assets 25,393,944 25,984,022 25,469,459 26,080,615 27,149,323
Liabilities and Equity 30/06/2017 31/03/2017 31/12/2016 30/09/2016 30/06/2016
Due to banks 2,655,250 2,805,884 1,661,670 1,742,354 1,770,058
Direct funding from customers 20,023,354 20,168,413 21,108,765 21,103,638 21,870,299
Financial liabilities held for trading 674 411 1,468 759 1,311
Hedging derivatives 263,821 286,390 294,137 350,170 339,042
Other liabilities 727,207 802,722 437,838 727,939 874,584
Provisions for specific purpose 171,722 209,463 208,111 187,404 182,895
Equity attributable to non-controlling interests 3,378 3,586 4,040 3,775 3,865
Equity 1,548,538 1,707,153 1,753,430 1,964,576 2,107,269
Total liabilities and equity 25,393,944 25,984,022 25,469,459 26,080,615 27,149,323

56Consolidated results as at 30th June 2017
Annexes – Reclassified consolidated income statement
Income statement Q2 2017 Q1 2017 Q4 2016 Q3 2016 Q2 2016
Net interest income 99,047 99,725 105,769 104,826 103,609
Net fee and commission income 74,646 67,670 75,545 68,620 68,500
Dividends and similar income 2,586 290 33 80 4,128
Profit (loss) of equity-accounted investments - 16 174 142 480 167
Net trading and hedging income (expense) and profit (loss) on
sales/repurchases - 1,282 12,092 - 36,062 - 15,449 28,018
Other operating net income 5,795 4,905 3,375 4,115 4,440
Operating income 180,776 184,856 148,802 162,672 208,862
Personnel expenses - 59,193 - 75,122 - 127,358 - 72,443 - 74,033
Other administrative expenses - 59,494 - 48,217 - 69,494 - 41,928 - 48,264
Depreciation/amortisation and net impairment losses on property, equipment
and investment property and intangible assets - 6,455 - 7,399 - 9,474 - 8,389 - 7,886
Operating costs - 125,142 - 130,738 - 206,326 - 122,760 - 130,183
Operating profit 55,634 54,118 - 57,524 39,912 78,679
Net impairment losses on loans and receivables and other financial assets - 321,102 - 47,911 - 102,541 - 236,914 - 102,852
Net accruals to provisions for risks and charges 1,024 - 1,066 11,493 1,055 - 1,556
Value adjustments of goodwill - - - 68,797 - -
Net gains (losses) on sales of investments 68,798 - 18 5,105 9 26,244
Pre-tax profit (loss) from continuing operations - 195,646 5,123 - 212,264 - 195,938 515
Income taxes - 801 - 1,676 16,622 41,557 14,542
Post-tax profit (loss) from continuing operations - 196,447 3,447 - 195,642 - 154,381 15,057
Profit (loss) for the period attributable to non-controlling interests - 739 - 1,089 - 1,415 - 801 - 988
Profit (Loss) for the period - 197,186 2,358 - 197,057 - 155,182 14,069

57Consolidated results as at 30th June 2017
Contacts for Investor and Financial Analysts
Ugo Colombo CFO (Chief Financial Officer)
Mob. +39 3355761968
Email [email protected]
Tiziana Camozzi Head of Investor Relations
Tel. +39 0280637471
Mob. +39 3346700124
Email [email protected]

58Consolidated results as at 30th June 2017
Consolidated Results as at
June 30th 2017