Embed Size (px)
Citation preview

Consolidated
Financial Statements
2011-12
Indian Oil Corporation Limited

144
Ecofriendly operations
145
For B.M. CHATRATH & CO. For DASS GUPTA & ASSOCIATES For PARAKH & CO.
Chartered Accountants Chartered Accountants Chartered Accountants(Firm Regn. No. 301011E) (Firm Regn. No. 000112N) (Firm Regn. No.001475C)
Sd/- Sd/- Sd/-(CA. P.R. Paul) (CA. Naresh Kumar) (CA. Aditya Kumar Rawat)
Partner Partner PartnerM. No.051675 M. No. 082069 M. No. 071767
Place : New DelhiDate : May 28, 2012
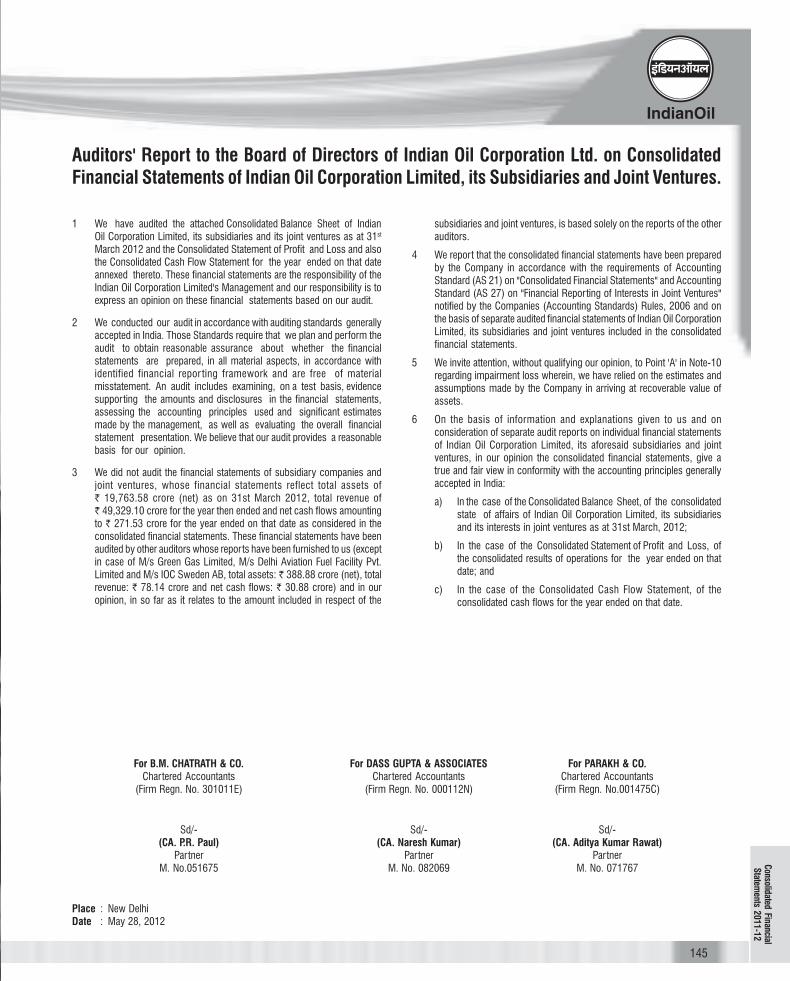
1 We have audited the attached Consolidated Balance Sheet of IndianOil Corporation Limited, its subsidiaries and its joint ventures as at 31st
March 2012 and the Consolidated Statement of Profit and Loss and alsothe Consolidated Cash Flow Statement for the year ended on that dateannexed thereto. These financial statements are the responsibility of theIndian Oil Corporation Limited's Management and our responsibility is toexpress an opinion on these financial statements based on our audit.
2 We conducted our audit in accordance with auditing standards generallyaccepted in India. Those Standards require that we plan and perform theaudit to obtain reasonable assurance about whether the financialstatements are prepared, in all material aspects, in accordance withidentified financial repor ting framework and are free of materialmisstatement. An audit includes examining, on a test basis, evidencesupporting the amounts and disclosures in the financial statements,assessing the accounting principles used and significant estimatesmade by the management, as well as evaluating the overall financialstatement presentation. We believe that our audit provides a reasonablebasis for our opinion.
3 We did not audit the financial statements of subsidiary companies andjoint ventures, whose financial statements reflect total assets of` 19,763.58 crore (net) as on 31st March 2012, total revenue of` 49,329.10 crore for the year then ended and net cash flows amountingto ` 271.53 crore for the year ended on that date as considered in theconsolidated financial statements. These financial statements have beenaudited by other auditors whose reports have been furnished to us (exceptin case of M/s Green Gas Limited, M/s Delhi Aviation Fuel Facility Pvt.Limited and M/s IOC Sweden AB, total assets: ` 388.88 crore (net), totalrevenue: ` 78.14 crore and net cash flows: ` 30.88 crore) and in ouropinion, in so far as it relates to the amount included in respect of the
subsidiaries and joint ventures, is based solely on the reports of the otherauditors.
4 We report that the consolidated financial statements have been preparedby the Company in accordance with the requirements of AccountingStandard (AS 21) on "Consolidated Financial Statements" and AccountingStandard (AS 27) on "Financial Reporting of Interests in Joint Ventures"notified by the Companies (Accounting Standards) Rules, 2006 and onthe basis of separate audited financial statements of Indian Oil CorporationLimited, its subsidiaries and joint ventures included in the consolidatedfinancial statements.
5 We invite attention, without qualifying our opinion, to Point 'A' in Note-10regarding impairment loss wherein, we have relied on the estimates andassumptions made by the Company in arriving at recoverable value ofassets.
6 On the basis of information and explanations given to us and onconsideration of separate audit reports on individual financial statementsof Indian Oil Corporation Limited, its aforesaid subsidiaries and jointventures, in our opinion the consolidated financial statements, give atrue and fair view in conformity with the accounting principles generallyaccepted in India:
a) In the case of the Consolidated Balance Sheet, of the consolidatedstate of affairs of Indian Oil Corporation Limited, its subsidiariesand its interests in joint ventures as at 31st March, 2012;
b) In the case of the Consolidated Statement of Profit and Loss, ofthe consolidated results of operations for the year ended on thatdate; and
c) In the case of the Consolidated Cash Flow Statement, of theconsolidated cash flows for the year ended on that date.
Auditors' Report to the Board of Directors of Indian Oil Corporation Ltd. on ConsolidatedFinancial Statements of Indian Oil Corporation Limited, its Subsidiaries and Joint Ventures.
Consolidated FinancialS
tatements 2
011-1
2
146
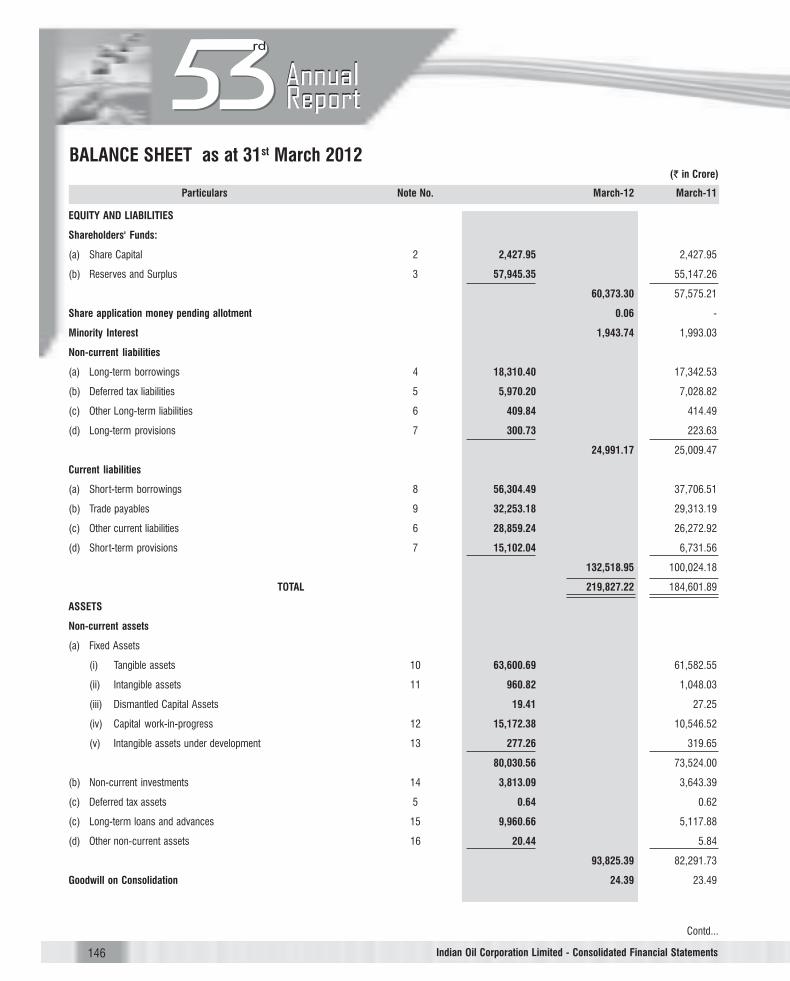
(` in Crore)
Particulars Note No. March-12 March-11
EQUITY AND LIABILITIES
Shareholders' Funds:
(a) Share Capital 2 2,427.95 2,427.95
(b) Reserves and Surplus 3 57,945.35 55,147.26
60,373.30 57,575.21
Share application money pending allotment 0.06 -
Minority Interest 1,943.74 1,993.03
Non-current liabilities
(a) Long-term borrowings 4 18,310.40 17,342.53
(b) Deferred tax liabilities 5 5,970.20 7,028.82
(c) Other Long-term liabilities 6 409.84 414.49
(d) Long-term provisions 7 300.73 223.63
24,991.17 25,009.47
Current liabilities
(a) Short-term borrowings 8 56,304.49 37,706.51
(b) Trade payables 9 32,253.18 29,313.19
(c) Other current liabilities 6 28,859.24 26,272.92
(d) Short-term provisions 7 15,102.04 6,731.56
132,518.95 100,024.18
TOTAL 219,827.22 184,601.89
ASSETS
Non-current assets
(a) Fixed Assets
(i) Tangible assets 10 63,600.69 61,582.55
(ii) Intangible assets 11 960.82 1,048.03
(iii) Dismantled Capital Assets 19.41 27.25
(iv) Capital work-in-progress 12 15,172.38 10,546.52
(v) Intangible assets under development 13 277.26 319.65
80,030.56 73,524.00
(b) Non-current investments 14 3,813.09 3,643.39
(c) Deferred tax assets 5 0.64 0.62
(c) Long-term loans and advances 15 9,960.66 5,117.88
(d) Other non-current assets 16 20.44 5.84
93,825.39 82,291.73
Goodwill on Consolidation 24.39 23.49
BALANCE SHEET as at 31st March 2012
Indian Oil Corporation Limited - Consolidated Financial Statements
Contd...

147
(` in Crore)
Particulars Note No. March-12 March-11
Sd/- Sd/- Sd/-(R. S. Butola) (P. K. Goyal) (Raju Ranganathan)
Chairman Director (Finance) Company Secretary
As per our attached Report of even date
For B.M. CHATRATH & CO. For DASS GUPTA & ASSOCIATES For PARAKH & CO.Chartered Accountants Chartered Accountants Chartered Accountants
(Firm Regn. No. 301011E) (Firm Regn. No. 000112N) (Firm Regn. No.001475C)
Sd/- Sd/- Sd/-(CA. P.R. Paul) (CA. Naresh Kumar) (CA. Aditya Kumar Rawat)
Partner Partner PartnerM. No. 051675 M. No. 082069 M. No. 071767
Place : New DelhiDate : May 28, 2012
Current assets
(a) Current investments 14 13,774.83 15,003.53
(b) Inventories 17 63,851.04 54,906.02
(c) Trade receivables 18 11,551.80 7,684.62
(d) Cash and Bank Balances 19 821.95 1,537.83
(e) Short-term loans and advances 15 33,659.55 21,632.33
(f) Other current assets 16 2,318.27 1,522.34
125,977.44 102,286.67
TOTAL 219,827.22 184,601.89
Principles of Consolidation and Significant Accounting Policies 1
Notes on Financial Statements 2 - 37
Indian Oil Corporation Limited - Consolidated Financial Statements
Consolidated FinancialS
tatements 2
011-1
2

148
(` in Crore)
Particulars Note No. March-12 March-11
Revenue from operations (Gross) 20 4,38,023.76 3,40,657.97
Less: Excise Duty 29,099.73 30,860.95
Revenue from operations (Net) 4,08,924.03 3,09,797.02
Other income 21 3,187.13 3,447.69
Total Revenue 4,12,111.16 3,13,244.71
Expenses:
Cost of materials consumed 22 2,07,631.98 1,50,041.71
Purchase of Stock-in-Trade 1,57,250.81 1,27,653.99
Changes in Inventory 23 (3,470.95) (5,613.77)
Employee benefit expenses 24 5,300.09 6,734.24
Finance cost 25 5,894.65 2,985.70
Depreciation and Amortisation on :
a) Tangible Assets 5,156.48 4,793.14
b) Intangible Assets 152.78 139.48
5,309.26 4,932.62
Other expenses 26 22,762.43 16,325.36
Total expenses 4,00,678.27 3,03,059.85
Profit before Prior Period, Exceptional Items and Tax 11,432.89 10,184.86
Income / (Expenses) pertaining to Prior Years (Net) 27 270.25 (70.88)
Profit before Exceptional Items and Tax 11,703.14 10,113.98
Exceptional Items (Refer point 5B of Note - 28) (7,707.82) -
Profit before Tax 3,995.32 10,113.98
Tax expense:
Current tax 790.36 1,715.56[includes ` (507.08) crore (2011 : ` (207.14) crore) relating to prior years]
Mat Credit Entitlement (1.03) (1,298.42)
Deferred tax (1,059.28) 1,611.22[includes ` 150.53 crore (2011 : ` (124.59) crore) relating to prior years]
STATEMENT OF PROFIT AND LOSS for the Year Ended 31st March 2012
Indian Oil Corporation Limited - Consolidated Financial Statements
Contd...

149
(` in Crore)
Particulars Note No. March-12 March-11
Sd/- Sd/- Sd/-(R. S. Butola) (P. K. Goyal) (Raju Ranganathan)
Chairman Director (Finance) Company Secretary
As per our attached Report of even date
For B.M. CHATRATH & CO. For DASS GUPTA & ASSOCIATES For PARAKH & CO.
Chartered Accountants Chartered Accountants Chartered Accountants(Firm Regn. No. 301011E) (Firm Regn. No. 000112N) (Firm Regn. No.001475C)
Sd/- Sd/- Sd/-(CA. P.R. Paul) (CA. Naresh Kumar) (CA. Aditya Kumar Rawat)
Partner Partner PartnerM. No. 051675 M. No. 082069 M. No. 071767
Place : New DelhiDate : May 28, 2012
Profit / (loss) for the period 4,265.27 8,085.62
Less: Share of Minority 39.29 254.90
Profit / (loss) for the Group 4,225.98 7,830.72
Earning per Equity Share (`):
(1) Basic 17.41 32.25
(2) Diluted 17.41 32.25
Face Value Per Share (`) 10 10
Principles of Consolidation and Significant Accounting Policies 1
Notes on Financial Statements 2 - 37
Total Income includes ` 4,600.40 crore (2011: ` 3,229.12 crore) share of jointly controlled entities.
Total Expenditure includes ` 4,151.07 crore (2011: ` 2,863.70 crore) share of jointly controlled entities.
Indian Oil Corporation Limited - Consolidated Financial Statements
Consolidated FinancialS
tatements 2
011-1
2

150
CASH FLOW STATEMENT for the year ended 31st March 2012
(` in Crore)
Particulars March-12 March-11
A Cash Flow from Operating Activities
1 Profit Before Tax 3,995.32 10,113.98
2 Adjustments for :
Depreciation 4,983.87 4,952.89
Loss/(Profit) on sale of Assets (net) 2.47 25.23
Loss/(Profit) on Investments (net) 18.87 26.56
Amortisation of Capital Grants (1.19) (1.16)
Amortisation of Premium on Forward Contracts 89.66 132.45
Provision for Probable Contingencies (net) 37.78 38.24
Provision for Loss on Investments (net) 418.15 78.74
Provision for Doubtful Debts, Advances, Claims andObsolescence of Stores (net) (229.51) 118.99
Provision for Dimunition in 'Receivable from trust' (net) (513.21) (96.86)
Provision for MTM loss on interest rate swap 110.26 -
Interest Income on Investments (1,171.94) (1,307.46)
Dividend Income on Investments (780.53) (981.96)
Interest Expenditure 5,901.61 2,988.65
8,866.29 5,974.31
3 Operating Profit before Working Capital 12,861.61 16,088.29Changes (1+2)
4 Change in Working Capital:(Excluding Cash & Bank Balances)
Trade & Other Receivables (16,271.77) (8,960.93)
Inventories (8,962.51) (13,656.74)
Trade and Other Payables 12,013.86 17,351.42
Change in Working Capital (13,220.42) (5,266.25)
(13,220.42) (5,266.25)
5 Cash Generated From Operations (3+4) (358.81) 10,822.04
6 Less : Taxes Paid 406.61 4,003.17
7 Net Cash Flow from Operating Activities (5-6) (765.42) 6,818.87
B Cash Flow from Investing Activities:
Sale/Transfer of Assets 1,372.78 293.80
Sale / Maturity of Investments 790.74 2,950.71
Interest Income on Investments 1,189.94 1,659.94
Dividend Income on Investments 780.53 981.96
Purchase of Assets (3,482.98) (3,103.65)
Investments in Long Term Investments / Others (168.76) (260.48)
Expenditure on Construction Work in Progress (13,535.42) (10,612.72)
Net Cash Generated/(Used) in Investing Activities: (13,053.17) (8,090.44)
Indian Oil Corporation Limited - Consolidated Financial Statements
Contd...

151
(` in Crore)
Particulars March-12 March-11
Sd/- Sd/- Sd/-(R. S. Butola) (P. K. Goyal) (Raju Ranganathan)
Chairman Director (Finance) Company Secretary
As per our attached Report of even date
For B.M. CHATRATH & CO. For DASS GUPTA & ASSOCIATES For PARAKH & CO.
Chartered Accountants Chartered Accountants Chartered Accountants(Firm Regn. No. 301011E) (Firm Regn. No. 000112N) (Firm Regn. No.001475C)
Sd/- Sd/- Sd/-(CA. P.R. Paul) (CA. Naresh Kumar) (CA. Aditya Kumar Rawat)
Partner Partner PartnerM. No. 051675 M. No. 082069 M. No. 071767
Place : New DelhiDate : May 28, 2012
C Net Cash Flow From Financing Activities:
Proceeds from/(Repayments of) Long-Term Borrowings 3,654.53 (90.00)
Proceeds from/(Repayments of) Short-Term Borrowings 18,618.27 8,455.15
Interest paid (6,364.30) (3,341.79)
Dividend/Dividend Tax paid (2,805.12) (3,812.38)
Net Cash Generated/(Used) from Financing Activities: 13,103.38 1,210.98
D Net Change in Cash & Bank Balances (715.21) (60.59)(A+B+C)
E - 1 Cash & Bank Balances as at end of the year 821.95 1,537.83
Add: Impact of Exchange variation taken to Reserves 0.67 0.01
822.62 1,537.84
Less:
2 Cash & Bank Balances as at the 1,537.83 1,598.43beginning of Period
NET CHANGE IN CASH & BANK BALANCE (E 1-2) (715.21) (60.59)
Notes:
1. Cash & Bank Balances as at end of the year 821.95 1,537.83
Less: Other Bank Balances 300.74 754.18
Total Cash and Cash Equivalents 521.21 783.65
2. Figures for previous periods have been regrouped wherever necessary for uniformity in presentation.
Indian Oil Corporation Limited - Consolidated Financial Statements
Consolidated FinancialS
tatements 2
011-1
2

152
NOTE - 1: PRINCIPLES OF CONSOLIDATION & SIGNIFICANT ACCOUNTING POLICIES
A. Principles of Consolidation
A.1. The consolidated financial statements relate to Indian Oil CorporationLimited (Parent Company), its subsidiaries and Joint Venturecompanies. The consolidated financial statements have been preparedon the following basis:
A.1.1. The financial statements of the Parent Company and itsSubsidiary Companies have been combined on a line-by-line basis by adding together the book values of like items ofassets, liabilities, income and expenses, after eliminating theintra-group balances, intra-group transactions and unrealisedprofits or losses in accordance with Accounting Standard -21 on "Consolidated Financial Statements". The share ofMinority Interest in the Subsidiaries has been disclosedseparately in the "Consolidated Financial Statements".
A.1.2. The financial statements of Joint Ventures have beencombined by applying proportionate consolidation methodon a line-by-line basis on items of assets, liabilities, income,and expenses after eliminating propor tionate share ofunrealized profits or losses in accordance with AccountingStandard -27 on "Financial Reporting of Interests in JointVentures".
A.1.3. The consolidated financial statements have been preparedusing uniform accounting policies for like transactions andevents in similar circumstances and are presented to theextent possible, in the same manner as the Parent Company'sseparate financial statements.
A.1.4. The excess/shortfall of cost to the Parent Company of itsinvestment in the respective subsidiary companies and jointventure companies is recognized in the financial statementsas goodwill/capital reserve respectively as per the equitymethod of valuation.
A.2. The Consolidated Financial Statements include the results of thefollowing entities:
Sl. Name of Country of Relation Ownership
No. Company incorporation Interest
1. Chennai Petroleum India Subsidiary 51.89%Corporation Ltd
2. Lanka IOC PLC Sri Lanka Subsidiary 75.12%
3. IndianOil (Mauritius) Ltd Mauritius Subsidiary 100%
4. IOC Middle East FZE Dubai- UAE Subsidiary 100%
5. IndianOil CREDA India Subsidiary 74%Bio-Fuels Ltd.
6. IOC Sweden AB Sweden Subsidiary 100%
7. IOT Infrastructure & India Joint Venture 47.92%Energy Services Ltd
8. Lubrizol India Pvt. Ltd India Joint Venture 50%
9. AVI-OIL India Pvt. Ltd India Joint Venture 25%
10. Petronet LNG Ltd India Joint Venture 12.5%
11. IndianOil Petronas Pvt.Ltd. India Joint Venture 50%
12. Green Gas Ltd India Joint Venture 22.50%
13. IndianOil Skytanking Ltd. India Joint Venture 33.33%
14. Indo Cat Pvt.Ltd. India Joint Venture 50%
15. Suntera Nigeria 205 Ltd. Nigeria Joint Venture 25%
16. Delhi Aviation Fuel Facility India Joint Venture 37%(Private) Limited
17. IndianOil Ruchi India Joint Venture 50%Biofuels LLP
18. Indian Synthetic India Joint Venture 50%Rubber Limited
19. NPCIL IndianOil Nuclear India Joint Venture 26%Energy CorporationLimited (NINECL)
Note: Proportionate consolidation in respect of Investments in the Joint VentureCompanies M/s Petronet CI Ltd., Petronet VK Ltd; Petronet India Ltdand Indianoil Panipat Power Consortium Ltd. have not been incorporatedin the preparation of consolidated financial statements as theManagement has decided to exit from these Joint Ventures and providedfor full diminution in the value of investment.
B. Significant Accounting Policies
B.1. Significant accounting policies of parent companyare enclosed asAnnexure-I.
B.2. For certain items, the Company and its subsidiaries and Joint ventureshave followed different accounting policies. However impact of thesame is not material.
C. Financial statements of IOML, LIOC, IOC Middle East FZE, IOC Sweden ABand Suntera Nigeria are drawn in Mauritius Rupees, Sri Lankan Rupees,UAE Dirhams Euro and USD, respectively. The transactions with theseforeign subsidiaries/Joint Ventures are considered as non integral operationas per Accounting Standard-11 on "The Effects of Changes in ForeignExchange Rates" and accordingly, the Financial Statements have beentranslated in Indian Rupees for the purpose of Consolidated FinancialStatements.
Indian Oil Corporation Limited - Consolidated Financial Statements
153
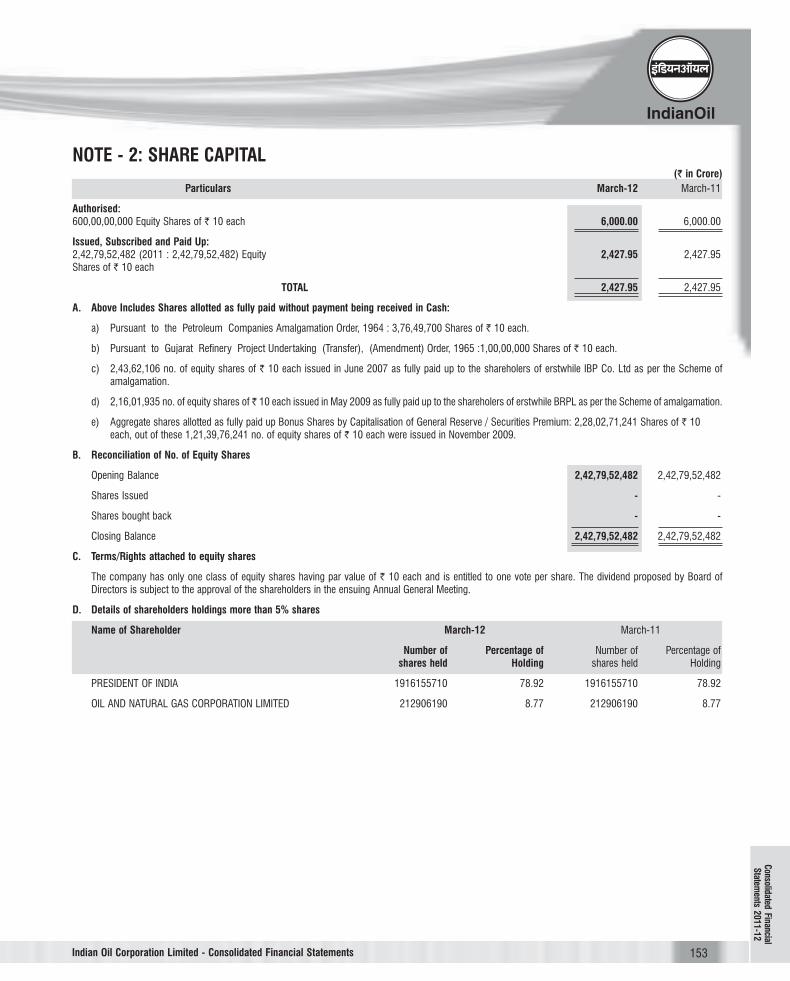
NOTE - 2: SHARE CAPITAL(` in Crore)
Particulars March-12 March-11
Authorised:
600,00,00,000 Equity Shares of ` 10 each 6,000.00 6,000.00
Issued, Subscribed and Paid Up:2,42,79,52,482 (2011 : 2,42,79,52,482) Equity 2,427.95 2,427.95Shares of ` 10 each
TOTAL 2,427.95 2,427.95
A. Above Includes Shares allotted as fully paid without payment being received in Cash:
a) Pursuant to the Petroleum Companies Amalgamation Order, 1964 : 3,76,49,700 Shares of ` 10 each.
b) Pursuant to Gujarat Refinery Project Undertaking (Transfer), (Amendment) Order, 1965 :1,00,00,000 Shares of ` 10 each.
c) 2,43,62,106 no. of equity shares of ` 10 each issued in June 2007 as fully paid up to the shareholers of erstwhile IBP Co. Ltd as per the Scheme ofamalgamation.
d) 2,16,01,935 no. of equity shares of ̀ 10 each issued in May 2009 as fully paid up to the shareholers of erstwhile BRPL as per the Scheme of amalgamation.
e) Aggregate shares allotted as fully paid up Bonus Shares by Capitalisation of General Reserve / Securities Premium: 2,28,02,71,241 Shares of ` 10each, out of these 1,21,39,76,241 no. of equity shares of ` 10 each were issued in November 2009.
B. Reconciliation of No. of Equity Shares
Opening Balance 2,42,79,52,482 2,42,79,52,482
Shares Issued - -
Shares bought back - -
Closing Balance 2,42,79,52,482 2,42,79,52,482
C. Terms/Rights attached to equity shares
The company has only one class of equity shares having par value of ` 10 each and is entitled to one vote per share. The dividend proposed by Board ofDirectors is subject to the approval of the shareholders in the ensuing Annual General Meeting.
D. Details of shareholders holdings more than 5% shares
Name of Shareholder March-12 March-11
Number of Percentage of Number of Percentage ofshares held Holding shares held Holding
PRESIDENT OF INDIA 1916155710 78.92 1916155710 78.92
OIL AND NATURAL GAS CORPORATION LIMITED 212906190 8.77 212906190 8.77
Indian Oil Corporation Limited - Consolidated Financial Statements
Consolidated FinancialS
tatements 2
011-1
2
154
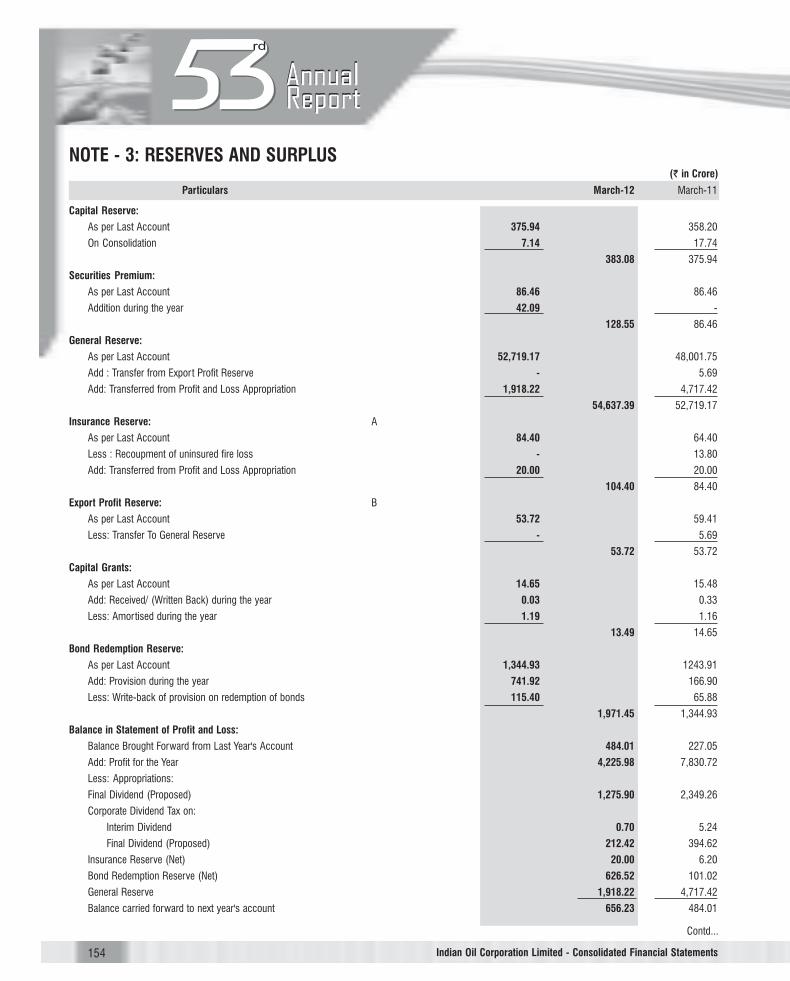
NOTE - 3: RESERVES AND SURPLUS(` in Crore)
Particulars March-12 March-11
Capital Reserve:
As per Last Account 375.94 358.20
On Consolidation 7.14 17.74
383.08 375.94
Securities Premium:
As per Last Account 86.46 86.46
Addition during the year 42.09 -
128.55 86.46
General Reserve:
As per Last Account 52,719.17 48,001.75
Add : Transfer from Export Profit Reserve - 5.69
Add: Transferred from Profit and Loss Appropriation 1,918.22 4,717.42
54,637.39 52,719.17
Insurance Reserve: A
As per Last Account 84.40 64.40
Less : Recoupment of uninsured fire loss - 13.80
Add: Transferred from Profit and Loss Appropriation 20.00 20.00
104.40 84.40
Export Profit Reserve: B
As per Last Account 53.72 59.41
Less: Transfer To General Reserve - 5.69
53.72 53.72
Capital Grants:
As per Last Account 14.65 15.48
Add: Received/ (Written Back) during the year 0.03 0.33
Less: Amortised during the year 1.19 1.16
13.49 14.65
Bond Redemption Reserve:
As per Last Account 1,344.93 1243.91
Add: Provision during the year 741.92 166.90
Less: Write-back of provision on redemption of bonds 115.40 65.88
1,971.45 1,344.93
Balance in Statement of Profit and Loss:
Balance Brought Forward from Last Year's Account 484.01 227.05
Add: Profit for the Year 4,225.98 7,830.72
Less: Appropriations:
Final Dividend (Proposed) 1,275.90 2,349.26
Corporate Dividend Tax on:
Interim Dividend 0.70 5.24
Final Dividend (Proposed) 212.42 394.62
Insurance Reserve (Net) 20.00 6.20
Bond Redemption Reserve (Net) 626.52 101.02
General Reserve 1,918.22 4,717.42
Balance carried forward to next year's account 656.23 484.01
Indian Oil Corporation Limited - Consolidated Financial Statements
Contd...

155
(` in Crore)
Particulars March-12 March-11
Devaluation Exch. Difference Reserve: C
As per Last Account 0.67 0.68
Less: Exchange variation on revaluation 0.67 0.01
- 0.67
Foreign Currency Monetary Item Translation Difference Account
As per Last Account - (0.10)
Add: Foreign Currency Exchange Gain/ (Loss) on Long Term Monetary Items - 0.10
- -
Translation Reserve on Consolidation
As per Last Account (16.69) (31.07)
Add : Translation difference 13.73 14.38
(2.96) (16.69)
TOTAL 57,945.35 55,147.26
A. Reserve is created to mitigate risk of loss of assets not insured with external insurance agencies.
B. Amount set aside out of profits from exports for availing income tax benefits.
C. Reserve created for devaluation of funds lying abroad.
Share of jointly controlled entities 909.47 665.43
NOTE - 4: LONG TERM BORROWINGS(` in Crore)
Particulars Long Term Current Maturities
March-12 March-11 March-12 March-11
SECURED LOANS
Bonds:
Non-Convertible Redeemable Bonds-Series-VIII B 1,070.00 1,070.00 - -
Non-Convertible Redeemable Bonds-Series-XI 1,415.00 - - -
Non-Convertible Redeemable Bonds-Series-IX 1,600.00 1,600.00 - -
Non-Convertible Redeemable Bonds-Series-VII B 500.00 500.00 - -
Non-Convertible Redeemable Bonds-Series-X - 2,000.00 2,000.00 -
Non-Convertible Redeemable Bonds-Series-VI - 768.10 768.10 -
Non-Convertible Redeemable Bonds-Series-VIII A - - - 430.00
Non-Convertible Redeemable Bonds-Series-V 126.40 158.00 31.60 31.60
4,711.40 6,096.10 2,799.70 461.60
Term Loans:
From banks 652.00 462.32 112.63 103.40
From other parties
Oil Industry Development Board (OIDB) 1,107.50 2,955.00 1,847.50 1,047.50
Others 233.41 186.72 20.09 9.61
1,992.91 3,604.04 1,980.22 1,160.51
Total Secured Loans 6,704.31 9,700.14 4,779.92 1,622.11
Indian Oil Corporation Limited - Consolidated Financial Statements
Contd...
Consolidated FinancialS
tatements 2
011-1
2

156
UNSECURED LOANS
Bonds
Foreign Currency Bonds 5,088.00 2,230.00 - -
Term Loans:
i) From Banks/Financial Institutions:
In Foreign Currency 3,949.62 2,343.07 31.67 585.66
Senior Notes (Bank of America) 1,526.40 1,338.00 - -
In Rupees 300.00 500.00 - 0.52
ii) From Others
In Rupees 741.88 1,230.73 588.85 505.49
6,517.90 5,411.80 620.52 1,091.67
Deferred Payment Liabilities 0.19 0.59 - -
Total Unsecured Loans 11,606.09 7,642.39 620.52 1,091.67
TOTAL LONG-TERM BORROWINGS 18,310.40 17,342.53 5,400.44 2,713.78
Share of jointly controlled entities 649.09 539.64 79.55 66.36
(` in Crore)
Particulars Long Term Current Maturities
March-12 March-11 March-12 March-11
NOTE - 5: DEFERRED TAXIn compliance of Accounting Standard – 22 on “Accounting for Taxes on Income, the item wise details of Deferred Tax Liability (net) are as under:
(` in Crore)
As on Provided during Balance as on01.04.2011 the year 31.03.2012
Deferred Tax Liability:
Depreciation and other fixed Assets of the group 8,613.13 801.32 9,414.45
Total Deferred Tax Liability (A) 8,613.13 801.32 9,414.45
Deferred Tax Assets:
Provision on Inventories, Trade Receivables, Loans and advances, Investments 621.67 20.50 642.17
Compensation for Voluntary Retirement Scheme 6.75 0.08 6.83
43B Disallowances etc. 520.07 1,841.75 2,361.82
Capital Grants 4.76 (0.39) 4.37
Provision for Leave Encashment/Retirement Benefits 431.68 (1.98) 429.70
Total Deferred Tax Assets (B) 1,584.93 1,859.96 3,444.89
Deferred Tax Liability (Net) (A – B) 7,028.20 (1,058.64) 5,969.56
Previous Year 5,417.00 1,611.20 7,028.20
Share of jointly controlled entities 81.68 83.01
As per Balance Sheet
Deferred Tax Liability 7,028.82 5,970.20
Deferred Tax Asset 0.62 0.64
Deferred Tax Liability (Net) 7,028.20 5,969.56
Indian Oil Corporation Limited - Consolidated Financial Statements

157
NOTE - 6: OTHER LIABILITIES(` in Crore)
Particulars Non Current Current
March-12 March-11 March-12 March-11
Current maturities of long-term debt (Refer Note 4) - - 5,400.44 2,713.78
Interest accrued but not due on loans - - 632.61 477.66
Interest accrued and due on borrowings - - 52.12 31.83
Income received in advance - - 0.17 -
Investor Education & Protection Fund to be creditedon the due dates :
- Unpaid Dividend - - 41.85 12.87
- Unpaid Matured Deposits - - 0.01 0.01
- - 41.86 12.88
Liability on Foreign Currency Contracts - - 391.21 4,027.16
Less: Foreign Currency Receivables - - 379.69 3,937.38
- - 11.52 89.78
Security Deposits 339.58 365.06 10,093.00 8,667.24
Discount on Forward Contract - - 0.38 -
Trade Payables 0.29 0.90 - -
Other Liabilities 69.97 48.53 12,627.14 14,279.75
TOTAL 409.84 414.49 28,859.24 26,272.92
Share of jointly controlled entities 70.64 45.53 248.11 201.69
Indian Oil Corporation Limited - Consolidated Financial Statements
Consolidated FinancialS
tatements 2
011-1
2

158
NOTE - 7: PROVISIONS(` in Crore)
Particulars Long Term Short Term
March-12 March-11 March-12 March-11
Provision for Employee Benefits 294.25 203.64 1,727.60 2,483.29
Other Provisions
Provision for Taxation:
For Current Tax - - 339.58 6.07
Less : Advance payments - - 272.95 -
Total Provisions for Taxation - - 66.63 6.07
Proposed Dividend - - 1,275.90 2,349.26
Corporate Dividend Tax - - 209.30 395.05
Contingencies for probable obligations A - - 11,712.35 1,497.89
Provision for MTM Loss on Interest Rate Swap - - 110.26 -
Other Provisions 6.48 19.99 - -
TOTAL 300.73 223.63 15,102.04 6,731.56
Share of jointly controlled entities 15.23 27.76 88.27 64.46
A. In compliance of Accounting Standard – 29 on “Provisions, Contingent Liabilities and Contingent Assets”, the required information is as under:
Particulars Opening Addition Utilization Reversals ClosingBalance during during the during the Balance***
the year* year** year**
Excise 0.88 0.26 0.06 0.69 0.39
Sales Tax 144.08 79.78 2.30 5.04 216.52
Entry Tax 1,279.46 10,174.66 - 0.13 11,453.99
Others 73.79 14.84 0.10 47.08 41.45
TOTAL 1,498.21 10,269.54 2.46 52.94 11,712.35
Previous Year 1,269.96 233.07 2.16 2.66 1,498.21
* Additions include: March-12 March-11
- capitalized 0.09 0.28
- included in raw material/other expenses 687.34 188.86
- shown as Exceptional Item 7,707.82 -
- amount transferred from liabilities to provisions 1,781.24 -
** Includes utilization/reversal of provision of ` Nil crore (2011: ` 0.85 crore), out of provision capitalized and ` 0.13 crore (2011: ` Nil crore) out of provisionincluded in Raw Material.
*** Expected timing of outflow is not ascertainable at this stage.
Indian Oil Corporation Limited - Consolidated Financial Statements

159
NOTE - 8: SHORT TERM BORROWINGS(` in Crore)
Particulars March-12 March-11
SECURED LOANS
Loans Repayable on Demand
From Banks:
Working Capital Demand Loan 5,712.67 7,240.75
Cash Credit 230.96 107.84
Foreign Currency Loans 46.53 -
5,990.16 7,348.59
From Others:
Loans through Collaterised Borrowings and Lending Obligation (CBLO)of Clearing Corporation of India Ltd. (CCIL) 1,827.00 2,630.00
Loans and advances from related parties 0.08 0.14
Total Secured Loans 7,817.24 9,978.73
UNSECURED LOANS
Loans Repayable on Demand
From Banks/Financial Institutions:
In Foreign Currency 22,289.49 15,413.76
In Rupees 19,408.91 11,310.12
From Others
Commercial Paper 4,760.00 1,000.00
Inter-Corporate Deposits 2,000.00 -
48,458.40 27,723.88
Other Loans and Advances 28.85 3.90
Total Unsecured Loans 48,487.25 27,727.78
TOTAL SHORT-TERM BORROWINGS 56,304.49 37,706.51
Share of jointly controlled entities 43.42 29.79
NOTE - 9: TRADE PAYABLES(` in Crore)
Particulars March-12 March-11
Sundry Creditors:
Dues of micro and small enterprises 12.24 9.63
Dues to Related Parties 665.90 406.89
Due to others 31,575.04 28,896.67
32,253.18 29,313.19
TOTAL 32,253.18 29,313.19
Share of jointly controlled entities 543.91 466.91
Indian Oil Corporation Limited - Consolidated Financial Statements
Consolidated FinancialS
tatements 2
011-1
2
160
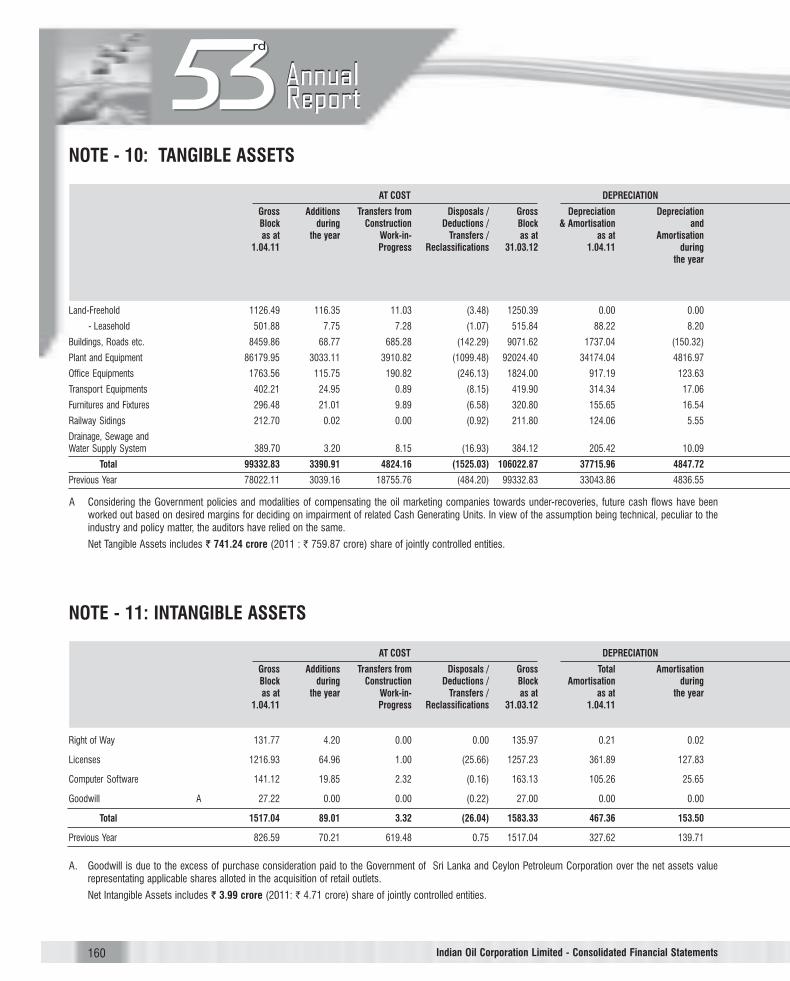
NOTE - 10: TANGIBLE ASSETS
AT COST DEPRECIATION
Gross Additions Transfers from Disposals / Gross Depreciation DepreciationBlock during Construction Deductions / Block & Amortisation and
as at the year Work-in- Transfers / as at as at Amortisation1.04.11 Progress Reclassifications 31.03.12 1.04.11 during
the year
Land-Freehold 1126.49 116.35 11.03 (3.48) 1250.39 0.00 0.00
- Leasehold 501.88 7.75 7.28 (1.07) 515.84 88.22 8.20
Buildings, Roads etc. 8459.86 68.77 685.28 (142.29) 9071.62 1737.04 (150.32)
Plant and Equipment 86179.95 3033.11 3910.82 (1099.48) 92024.40 34174.04 4816.97
Office Equipments 1763.56 115.75 190.82 (246.13) 1824.00 917.19 123.63
Transport Equipments 402.21 24.95 0.89 (8.15) 419.90 314.34 17.06
Furnitures and Fixtures 296.48 21.01 9.89 (6.58) 320.80 155.65 16.54
Railway Sidings 212.70 0.02 0.00 (0.92) 211.80 124.06 5.55
Drainage, Sewage andWater Supply System 389.70 3.20 8.15 (16.93) 384.12 205.42 10.09
Total 99332.83 3390.91 4824.16 (1525.03) 106022.87 37715.96 4847.72
Previous Year 78022.11 3039.16 18755.76 (484.20) 99332.83 33043.86 4836.55
A Considering the Government policies and modalities of compensating the oil marketing companies towards under-recoveries, future cash flows have beenworked out based on desired margins for deciding on impairment of related Cash Generating Units. In view of the assumption being technical, peculiar to theindustry and policy matter, the auditors have relied on the same.
Net Tangible Assets includes ` 741.24 crore (2011 : ` 759.87 crore) share of jointly controlled entities.
NOTE - 11: INTANGIBLE ASSETS
AT COST DEPRECIATION
Gross Additions Transfers from Disposals / Gross Total AmortisationBlock during Construction Deductions / Block Amortisation during
as at the year Work-in- Transfers / as at as at the year1.04.11 Progress Reclassifications 31.03.12 1.04.11
Right of Way 131.77 4.20 0.00 0.00 135.97 0.21 0.02
Licenses 1216.93 64.96 1.00 (25.66) 1257.23 361.89 127.83
Computer Software 141.12 19.85 2.32 (0.16) 163.13 105.26 25.65
Goodwill A 27.22 0.00 0.00 (0.22) 27.00 0.00 0.00
Total 1517.04 89.01 3.32 (26.04) 1583.33 467.36 153.50
Previous Year 826.59 70.21 619.48 0.75 1517.04 327.62 139.71
A. Goodwill is due to the excess of purchase consideration paid to the Government of Sri Lanka and Ceylon Petroleum Corporation over the net assets valuerepresentating applicable shares alloted in the acquisition of retail outlets.
Net Intangible Assets includes ` 3.99 crore (2011: ` 4.71 crore) share of jointly controlled entities.
Indian Oil Corporation Limited - Consolidated Financial Statements

161
(` in Crore)
AMORTISATION AND IMPAIRMENT NET BLOCK
Disposals / Total Total Impairment Impairment Total AS AT AS ATDeductions / Depreciation Impairment Loss loss reversed Impairment 31.03.12 31.03.11
Transfers / and Loss as at during during the Loss uptoReclassifications Amortisation 1.04.11 the year the year 31.03.12
upto
31.03.12
(Refer A)
0.00 0.00 0.00 0.00 0.00 0.00 1250.39 1126.49
0.34 96.76 0.00 0.00 0.00 0.00 419.08 413.66
(20.68) 1566.04 0.00 0.00 0.00 0.00 7505.58 6722.82
35.74 39026.75 34.32 0.00 0.00 34.32 52963.33 51971.59
(180.08) 860.74 0.00 0.00 0.00 0.00 963.26 846.37
(6.69) 324.71 0.00 0.00 0.00 0.00 95.19 87.87
(2.98) 169.21 0.00 0.00 0.00 0.00 151.59 140.83
(0.82) 128.79 0.00 0.00 0.00 0.00 83.01 88.64
(0.65) 214.86 0.00 0.00 0.00 0.00 169.26 184.28
(175.82) 42387.86 34.32 0.00 0.00 34.32 63600.69 61582.55
(164.45) 37715.96 34.32 0.00 0.00 34.32 61582.55
(` in Crore)
AMORTISATION AND IMPAIRMENT NET BLOCK
Disposals / Total Total Impairment Total AS AT AS ATDeductions / Amortisation Impairment Loss during Impairment 31.03.12 31.03.11
Transfers / upto Loss as at the year Loss uptoReclassifications 31.03.12 1.04.11 31.03.12
0.00 0.23 0.00 0.00 0.00 135.74 131.56
0.00 489.72 1.65 0.00 1.65 765.86 853.39
0.00 130.91 0.00 0.00 0.00 32.22 35.86
0.00 0.00 0.00 0.00 0.00 27.00 27.22
0.00 620.86 1.65 0.00 1.65 960.82 1048.03
0.02 467.36 1.65 0.00 1.65 1048.03
Indian Oil Corporation Limited - Consolidated Financial Statements
Consolidated FinancialS
tatements 2
011-1
2
162
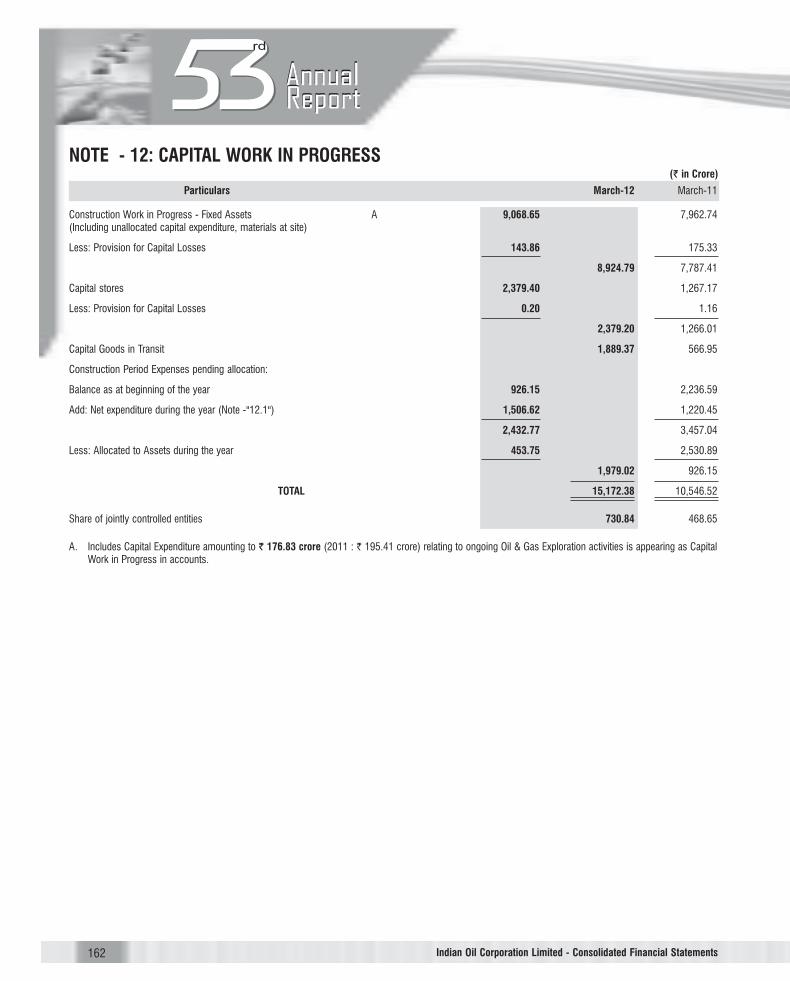
NOTE - 12: CAPITAL WORK IN PROGRESS(` in Crore)
Particulars March-12 March-11
Construction Work in Progress - Fixed Assets A 9,068.65 7,962.74(Including unallocated capital expenditure, materials at site)
Less: Provision for Capital Losses 143.86 175.33
8,924.79 7,787.41
Capital stores 2,379.40 1,267.17
Less: Provision for Capital Losses 0.20 1.16
2,379.20 1,266.01
Capital Goods in Transit 1,889.37 566.95
Construction Period Expenses pending allocation:
Balance as at beginning of the year 926.15 2,236.59
Add: Net expenditure during the year (Note -"12.1") 1,506.62 1,220.45
2,432.77 3,457.04
Less: Allocated to Assets during the year 453.75 2,530.89
1,979.02 926.15
TOTAL 15,172.38 10,546.52
Share of jointly controlled entities 730.84 468.65
A. Includes Capital Expenditure amounting to ` 176.83 crore (2011 : ` 195.41 crore) relating to ongoing Oil & Gas Exploration activities is appearing as CapitalWork in Progress in accounts.
Indian Oil Corporation Limited - Consolidated Financial Statements

163
Note - 12.1: CONSTRUCTION PERIOD EXPENSES (NET) DURING THE YEAR(` in Crore)
Particulars March-12 March-11
Payments to and Provision for Employees 191.36 218.97
Repairs and Maintenance 7.08 5.24
Consumption of Stores and Spares 0.05 1.12
Power & Fuel 48.34 369.09
Rent 4.82 4.94
Insurance 40.92 44.94
Rates and Taxes 0.84 0.27
Travelling Expenses 27.16 19.90
Communication Expenses 1.43 1.45
Printing and Stationery 0.94 0.65
Electricity and Water Charges 11.44 6.90
Bank Charges 0.68 0.69
Technical Assistance Fees 0.54 29.77
Exchange Fluctuation 544.43 (7.00)
Borrowing Cost 617.64 372.93
Depreciation and Amortisation on
Tangible Assets 17.29 23.14
Intangible Assets 0.06 0.23
Start Up/ Trial Run Expenses 2.92 60.94
Others 47.21 102.66
Total Expenses 1,565.15 1,256.83
Less : Recoveries 58.53 36.38
Net Expenditure during the year 1,506.62 1,220.45
NOTE - 13: INTANGIBLE ASSETS UNDER DEVELOPMENT(` in Crore)
Particulars March-12 March-11
Work in Progress - Intangible Asset 277.26 319.65(Including Unallocated Capital Expenditure)
TOTAL 277.26 319.65
Share of jointly controlled entities 0.01 -
Indian Oil Corporation Limited - Consolidated Financial Statements
Consolidated FinancialS
tatements 2
011-1
2

164
Note - 14: INVESTMENTS(` in Crore)
Particulars March-12 March-11
NON CURRENT INVESTMENTS: (AT COST)
QUOTED: 3,028.15 3,028.24(Market Value of ` 20,174.50 crore (2011: ` 21,995.51 Crore)
UNQUOTED:
In Government - Securities 6.25 6.25
In Petroleum India International (AOP by Oil Companies)
-Capital Fund 15.00 15.00
-Share in accumulated surlpus 18.16 17.13
33.16 32.13
In Others 745.53 576.77
784.94 615.15
CURRENT INVESTMENTS (UNQUOTED):
(AT LOWER OF COST OR MARKET PRICE)
Oil Companies GOI SPL Bonds 15,354.68 16109.68
Less: Provision for Diminution 1,594.23 1268.41
13,760.45 14,841.27
In Others 14.38 162.26
13,774.83 15,003.53
Total 17,587.92 18,646.92
Share of jointly controlled entities 226.84 319.28
Indian Oil Corporation Limited - Consolidated Financial Statements

165
NOTE - 15: LOANS AND ADVANCES(` in Crore)
Particulars Long Term Short Term
March-12 March-11 March-12 March-11
Advance for Capital Expenditure
Secured, Considered Good 199.91 134.51 - -
Unsecured, Considered Good 8,012.87 3,283.92 - -
Unsecured, Considered Doubtful 0.20 0.54 - -
8,212.98 3,418.97 - -
Less: Provision for Doubtful Advance 0.20 0.54 - -
8,212.78 3,418.43 - -
Advances for Investments
Joint Ventures 12.67 12.67 - -
Advance recoverable in cash or in kind or forvalue to be received:
From Related Parties
Secured, Considered Good 0.05 0.20 0.01 0.03
Unsecured, Considered Good 68.21 0.01 16.61 5.73
Unsecured, Considered Doubtful - - - 40.53
68.26 0.21 16.62 46.29
Less : Provision for Doubtful Advances - - - 40.53
68.26 0.21 16.62 5.76
From Others
Secured, Considered Good 829.67 735.05 89.79 100.63
Unsecured, Considered Good 601.15 804.80 3,886.50 4,761.60
Unsecured, Considered Doubtful 0.33 0.32 7.20 6.05
1,431.15 1,540.17 3,983.49 4,868.28
Less : Provision for Doubtful Advances 0.33 0.32 7.20 6.05
1,430.82 1,539.85 3,976.29 4,862.23
1,499.08 1,540.06 3,992.91 4,867.99
Amount Recoverable from Central/State Govt.:
Unsecured, Considered Good - - 20,926.89 11,002.11
Finance Lease Receivables 8.89 10.29 1.40 1.43
Claims Recoverable: A
From Related Parties
Unsecured, Considered Good - - 17.16 8.57
Unsecured, Considered Doubtful - - 17.01 14.40
- - 34.17 22.97
From Others
Secured, Considered Good - - - -
Unsecured, Considered Good - - 1,107.29 1,027.51
Unsecured, Considered Doubtful 0.12 0.12 49.41 52.61
0.12 0.12 1,156.70 1,080.12
Less : Provision for Doubtful Claims 0.12 0.12 66.42 67.01
- - 1,090.28 1,013.11
- - 1,124.45 1,036.08
Indian Oil Corporation Limited - Consolidated Financial Statements
Contd...
Consolidated FinancialS
tatements 2
011-1
2

166
NOTE - 15: LOANS AND ADVANCES (Contd.)(` in Crore)
Particulars Long Term Short Term
March-12 March-11 March-12 March-11
Balance with Customs, Port Trust and
Excise Authorities:
Unsecured, Considered Good - - 38.25 64.04
Deposits for Leave Encashment Fund - - 1,784.69 1,533.15
Advance Tax - - 469.44 198.16
Mat Credit Receivable - - 691.99 1,285.80
Materials given on loan:
To Others
Unsecured, Considered Good - - - 0.81
Sundry Deposits
To Others
i) Secured, Considered Good 9.04 9.04 0.10 0.10
ii) Unsecured, Considered Good 218.20 127.39 4,629.43 1,642.66
iii) Unsecured, Considered Doubtful 0.04 0.04 0.32 0.14
227.28 136.47 4,629.85 1,642.90
Less : Provision for Doubtful Deposits 0.04 0.04 0.32 0.14
227.24 136.43 4,629.53 1,642.76
TOTAL 9,960.66 5,117.88 33,659.55 21,632.33
Share of jointly controlled entities 219.41 76.33 102.71 86.30
Indian Oil Corporation Limited - Consolidated Financial Statements
167Indian Oil Corporation Limited - Consolidated Financial Statements
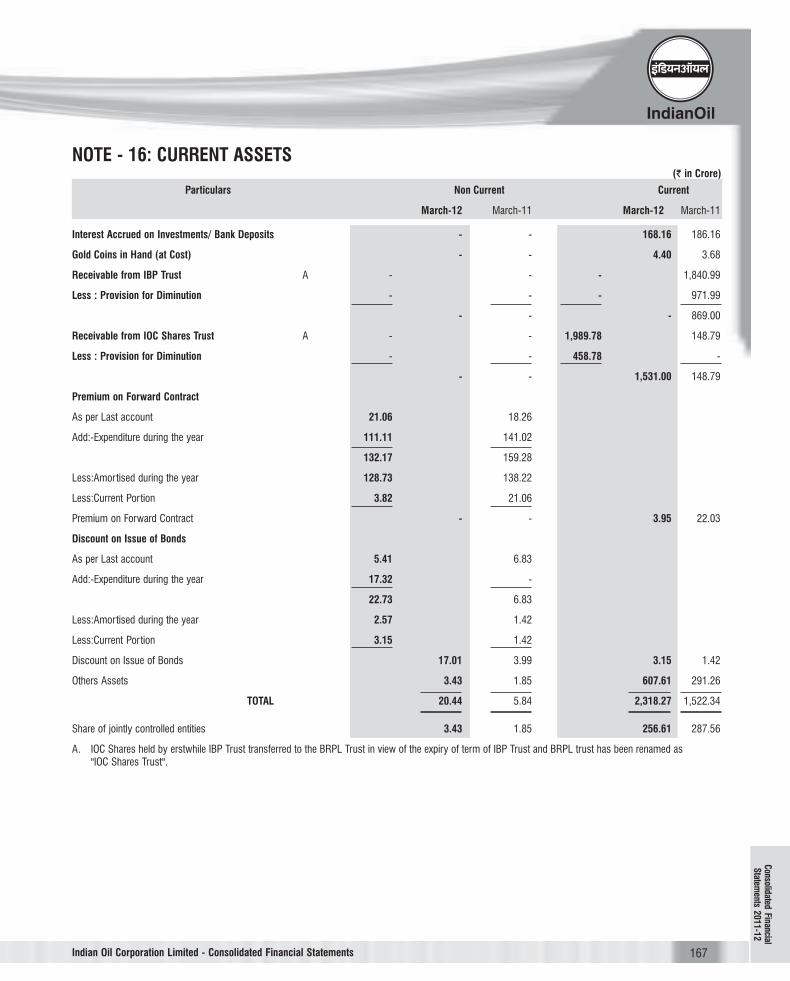
NOTE - 16: CURRENT ASSETS(` in Crore)
Particulars Non Current Current
March-12 March-11 March-12 March-11
Interest Accrued on Investments/ Bank Deposits - - 168.16 186.16
Gold Coins in Hand (at Cost) - - 4.40 3.68
Receivable from IBP Trust A - - - 1,840.99
Less : Provision for Diminution - - - 971.99
- - - 869.00
Receivable from IOC Shares Trust A - - 1,989.78 148.79
Less : Provision for Diminution - - 458.78 -
- - 1,531.00 148.79
Premium on Forward Contract
As per Last account 21.06 18.26
Add:-Expenditure during the year 111.11 141.02
132.17 159.28
Less:Amortised during the year 128.73 138.22
Less:Current Portion 3.82 21.06
Premium on Forward Contract - - 3.95 22.03
Discount on Issue of Bonds
As per Last account 5.41 6.83
Add:-Expenditure during the year 17.32 -
22.73 6.83
Less:Amortised during the year 2.57 1.42
Less:Current Portion 3.15 1.42
Discount on Issue of Bonds 17.01 3.99 3.15 1.42
Others Assets 3.43 1.85 607.61 291.26
TOTAL 20.44 5.84 2,318.27 1,522.34
Share of jointly controlled entities 3.43 1.85 256.61 287.56
A. IOC Shares held by erstwhile IBP Trust transferred to the BRPL Trust in view of the expiry of term of IBP Trust and BRPL trust has been renamed as"IOC Shares Trust".
Consolidated FinancialS
tatements 2
011-1
2

168
NOTE - 17: INVENTORIES(` in Crore)
Particulars March-12 March-11
In Hand:
Stores, Spares etc. 2,709.33 2,190.63Less : Provision for Losses 132.57 115.08
2,576.76 2,075.55Raw Materials 18,167.63 16,184.56Finished Products 19,923.28 17,617.05Stock in Trade 4,845.86 4,691.46Stock in Process 5,737.68 4,531.60WIP - Construction Contracts 17.12 8.16Barrels and Tins 32.14 27.25
51,300.47 45,135.63In Transit:
Stores & Spares 145.36 137.83Raw Materials 11,998.38 9,029.97Finished Products 2.21 1.90Stock in Trade 404.62 600.69
12,550.57 9,770.39TOTAL 63,851.04 54,906.02
Share of jointly controlled entities 207.30 137.25
NOTE - 18: TRADE RECEIVABLES(` in Crore)
Particulars March-12 March-11
Over Six Months:
From Others
i) Secured Considered Good - -
ii) Unsecured, Considered Good 1,495.98 346.24
iii) Unsecured, Considered Doubtful 140.63 373.05
1,636.61 719.29
1,636.61 719.29
Other Debts:
From Related Parties
i) Secured Considered Good - -
ii) Unsecured, Considered Good 38.84 23.02
iii) Unsecured, Considered Doubtful - -
38.84 23.02
From Others
i) Secured Considered Good 49.87 132.14
ii) Unsecured, Considered Good 9,967.11 7,183.22
ii) Unsecured, Considered Doubtful 74.12 56.51
10,091.10 7,371.87
10,129.94 7,394.89
11,766.55 8,114.18
Less : Provision for Doubtful Debts 214.75 429.56
TOTAL 11,551.80 7,684.62
Share of jointly controlled entities 406.53 318.60
Indian Oil Corporation Limited - Consolidated Financial Statements

169
NOTE - 19: CASH AND BANK BALANCES(` in Crore)
Particulars March-12 March-11
Cash and Cash Equivalents
Bank Balances with Scheduled Banks:
a) Current Account 317.63 602.18
b) Earmarked Balances A 43.48 14.84
361.11 617.02
Bank Balances with Non-Scheduled Banks:
Bank of Commerce & Development, Libya 0.50 0.44
Myanmar Economic Bank Branch(5), Rangoon B 0.01 0.79
Others 3.06 3.06
3.57 4.29
Cheques, Drafts in hand 152.87 159.92
Cash Balances, Including Imprest 3.66 2.42
Other Bank Balances
a) Fixed Deposit Account C 299.70 753.36
b) Blocked Account 1.04 0.82
300.74 754.18
TOTAL 821.95 1,537.83
Share of jointly controlled entities 319.49 112.75
A) Pertains to Unpaid Dividend/Fractional Share Warrants.B) There exists restrictions on repatriation of said amount from Myanmar.C) Earmarked in favour of Port Authorities.
NOTE - 20: REVENUE FROM OPERATIONS(` in Crore)
Particulars March-12 March-11
Sale of Products and Crude 3,92,478.69 3,18,885.99
Less: Discounts 4,434.77 4,264.74
Sales (Net of Discounts) 3,88,043.92 3,14,621.25
Sale of Services 981.12 783.55
Other Operating Revenues (Note - 20.1) 1,692.60 881.03
3,90,717.64 3,16,285.83
Subsidy From Central/State Govt. A 1,820.28 1,767.30
Grant from Government of India B 45,485.84 22,604.84
TOTAL 4,38,023.76 3,40,657.97
A. Subsidies on sales of SKO (PDS) and LPG (Domestic) in India amounting to ` 1,770.98 crore (2011: ` 1,731.56 crore) and subsidies on sales of SKO & LPGto customers in Bhutan amounting to ` 49.30 crore (2011: ` 35.74 crore) have been reckoned as per the schemes notified by Government of India.
B1. The Group has accounted for Budgetary Support of ` 45,485.84 crore towards under-recovery on sale of HSD, SKO (PDS) and LPG (Domestic) for 2011-12[2010-11: ` 22,604.84 crore towards under-recovery on sale of MS (upto 25th June 2010), HSD, SKO (PDS) and LPG (Domestic)] in the Profit and LossAccount as Revenue Grants.
B2. In line with the scheme formulated by Petroleum Planning and Analysis Cell (PPAC), the Group has received during the year, discounts of ` 29,619.23 crore(2011: ` 16,703.73 crore) on Crude Oil/Products purchased from ONGC/GAIL/OIL and the same has been adjusted against the purchase cost. In addition anamount of ` 341.50 crore (2011: NIL) received from OIL has been accounted as other Operating Revenue.
Indian Oil Corporation Limited - Consolidated Financial Statements
Consolidated FinancialS
tatements 2
011-1
2
170
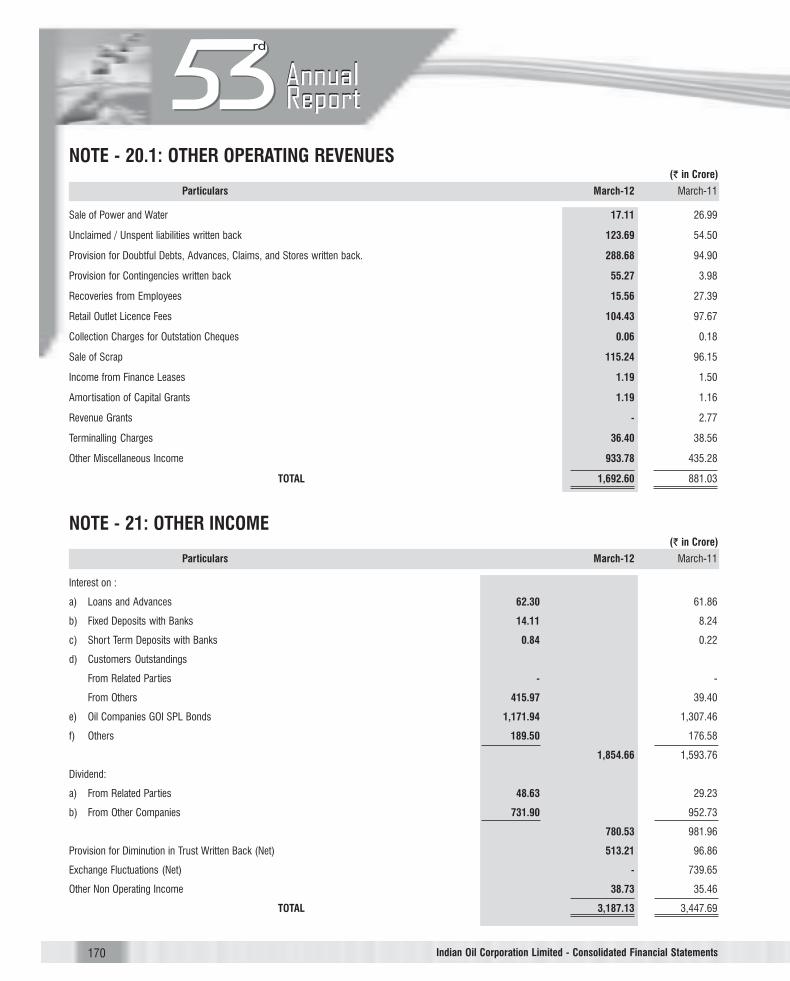
NOTE - 20.1: OTHER OPERATING REVENUES(` in Crore)
Particulars March-12 March-11
Sale of Power and Water 17.11 26.99
Unclaimed / Unspent liabilities written back 123.69 54.50
Provision for Doubtful Debts, Advances, Claims, and Stores written back. 288.68 94.90
Provision for Contingencies written back 55.27 3.98
Recoveries from Employees 15.56 27.39
Retail Outlet Licence Fees 104.43 97.67
Collection Charges for Outstation Cheques 0.06 0.18
Sale of Scrap 115.24 96.15
Income from Finance Leases 1.19 1.50
Amortisation of Capital Grants 1.19 1.16
Revenue Grants - 2.77
Terminalling Charges 36.40 38.56
Other Miscellaneous Income 933.78 435.28
TOTAL 1,692.60 881.03
NOTE - 21: OTHER INCOME(` in Crore)
Particulars March-12 March-11
Interest on :
a) Loans and Advances 62.30 61.86
b) Fixed Deposits with Banks 14.11 8.24
c) Short Term Deposits with Banks 0.84 0.22
d) Customers Outstandings
From Related Parties - -
From Others 415.97 39.40
e) Oil Companies GOI SPL Bonds 1,171.94 1,307.46
f) Others 189.50 176.58
1,854.66 1,593.76
Dividend:
a) From Related Parties 48.63 29.23
b) From Other Companies 731.90 952.73
780.53 981.96
Provision for Diminution in Trust Written Back (Net) 513.21 96.86
Exchange Fluctuations (Net) - 739.65
Other Non Operating Income 38.73 35.46
TOTAL 3,187.13 3,447.69
Indian Oil Corporation Limited - Consolidated Financial Statements

171
NOTE - 22: COST OF MATERIAL CONSUMED(` in Crore)
Particulars March-12 March-11
Raw Material Consumed:
Opening Balance 25,214.53 17,466.91
Add: Purchases 2,12,583.46 1,57,789.33
2,37,797.99 1,75,256.24
Less: Closing Stock 30,166.01 25,214.53
TOTAL 2,07,631.98 1,50,041.71
NOTE - 23: CHANGE IN INVENTORY(` in Crore)
Particulars March-12 March-11
Closing Stock
Finished Products 19,925.49 17,618.95
Stock in Process 5,737.68 4,531.60
Stock- in - trade 5,250.48 5,292.15
30,913.65 27,442.70
Less:
Opening Stock
Finished Products 17,618.95 14,445.70
Stock in Process 4,531.60 3,115.62
Stock - in - Trade 5,292.15 4,267.61
27,442.70 21,828.93
NET (INCREASE)/DECREASE (3,470.95) (5,613.77)
NOTE - 24: EMPLOYEE BENEFIT EXPENSES(` in Crore)
Particulars March-12 March-11
Salaries, Wages, Bonus etc. 3,796.05 4,148.49
Contribution to Provident & Other Funds 754.54 1,638.74
Voluntary Retirement Compensation 12.52 6.07
Staff Welfare Expenses 736.98 940.94
TOTAL 5,300.09 6,734.24
A. Disclosure in compliance with Accounting Standard-15 (Revised 2005) on “Employee Benefits” is given in Note - 29.
Indian Oil Corporation Limited - Consolidated Financial Statements
Consolidated FinancialS
tatements 2
011-1
2

172
NOTE - 25: FINANCE COST(` in Crore)
Particulars March-12 March-11
Interest Payments on:
Fixed period loans from Banks/Financial Institutions/Others 611.13 528.27
Bonds 482.99 477.62
Short Term loans from Banks 2,125.70 1,170.73
Others 1,718.59 627.69
4,938.41 2,804.31
Other Borrowing Cost 38.81 5.63
Applicable Net Gain / (Loss) on Foreign 917.43 175.76Currency Transactions and Translation
TOTAL 5,894.65 2,985.70
NOTE - 26: OTHER EXPENSES(` in Crore)
Particulars March-12 March-11
Consumption:
a) Stores, Spares and Consumables 953.44 882.96
b) Packages & Drum Sheets 382.06 326.51
1,335.50 1,209.47
Power & Fuel 22,878.06 15,125.08
Less : Fuel from own production 18,996.27 13,172.06
3,881.79 1,953.02
Throughput, Processing & Blending Fees, Royalty and Other Charges 490.29 377.65
Octroi, Other Levies and Irrecoverable taxes 976.57 842.80
Repairs and Maintenance
i) Plant & Machinery 1,587.83 1,349.83
ii) Buildings 159.21 148.16
iii) Others 126.19 115.33
1,873.23 1,613.32
Freight, Transportation Charges and Demurrage 7,508.52 6,894.08
Office Administration, Selling and Other Expenses (Note - 26.1) 8,160.42 4,026.69
TOTAL 24,226.32 16,917.03
Less: Company's use of own Products and Crude 880.87 948.90
23,345.45 15,968.13
Duties (Net) (583.02) 357.23
TOTAL (Net) 22,762.43 16,325.36
Indian Oil Corporation Limited - Consolidated Financial Statements

173
NOTE - 26.1: OFFICE, ADMINISTRATION, SELLING AND OTHER EXPENSES(` in Crore)
Particulars March-12 March-11
Rent 358.95 279.17
Insurance 110.27 82.24
Rates & Taxes 75.08 68.95
Donations 9.05 1.54
Payment to auditors
a) Audit Fees 1.47 1.20
b) Tax Audit Fees 0.13 0.13
c) Other Services(for issuing certificates etc.) 0.36 0.45
d) Out of Pocket Expenses 0.42 0.31
2.38 2.09
Travelling & Conveyance 371.43 324.87
Communication Expenses 50.35 45.50
Printing & Stationery 31.79 27.82
Electricity & Water 201.45 179.65
Bank Charges 53.68 31.64
Bad Debts, Advances & Claims written off 49.21 7.16
Provision/ Loss on Assets sold or written off 2.47 25.23
Technical Assistance Fees 29.58 44.84
Exchange Fluctuation (net) 3,182.86 -
Provision for Doubtful Debts, Advances, Claims, CWIP, Stores etc. 59.17 213.89
Provision for Dimunition in Investments 418.15 78.74
Security Force Expenses 264.93 238.19
Sales Promotion Expenses (Incl. Commission) 494.19 452.53
Handling Expenses 214.47 165.47
Expenses on Enabling Facilities 24.00 41.68
Commodity Hedging Losses (Net) 328.13 48.35
Terminalling Charges 20.06 24.94
Provision for Probable Contingencies 93.05 42.22
Exploration & Production Cost A 180.23 333.44
Amortisation of Premium on Forward Contracts 89.66 132.45
MTM Loss on Interest Rate Swap 110.26 -
Loss on Sale of Investments (Net) 18.87 26.56
Expenses on CSR Activities 78.47 89.82
Miscellaneous Expenses 1,238.23 1,017.71
TOTAL 8,160.42 4,026.69
A. In respect of Oil and Gas Exploration activities, Revenue Expenditure amounting to ` 180.23 crore (2011 : ` 333.44 crore) and Capital Expenditure amountingto ` (51.41) crore (2011 : ` 19.80 crore) of Oil and Gas Exploration Projects have been incorporated in these accounts on the basis of unaudited statementsprovided by respective operators of Production Sharing Contracts to the Company.
Indian Oil Corporation Limited - Consolidated Financial Statements
Consolidated FinancialS
tatements 2
011-1
2

174
NOTE - 27: INCOME / EXPENSES RELATING TO PREVIOUS YEARS(` in Crore)
Particulars March-12 March-11
Income:
Miscellaneous Income 40.91 8.75
Sale of Products - (2.62)
Total Income 40.91 6.13
Expenditure:
Purchase of Products and Crude 0.16 (0.09)
Depreciation and Amortization on:
Tangible Assets (326.05) 20.27
Intangible Assets 0.66 -
Consumption of Stores, Spares and Consumables (1.27) (9.25)
Technical fees 1.30 (3.18)
Power and Fuel (1.22) (3.25)
Repairs and Maintenance 7.93 2.64
Interest 6.96 2.95
Rent 0.08 5.33
Rates & Taxes 1.45 0.27
Payment to and Provision for Employees 16.38 (5.68)
Other Expenses 64.28 67.00
Total Expediture (229.34) 77.01
NET INCOME /(EXPENDITURE) 270.25 (70.88)
Indian Oil Corporation Limited - Consolidated Financial Statements

175
NOTE - 28
1. Contingent Liabilities & Commitments
A. Contingent Liabilities
A.1 Contingent Liabilities amounting to ` 8,829.47 crore (2011: `7,888.70 crore) are as under :
A.1.1 ` 4,975.99 crore (2011: ` 5,301.69 crore) being thedemands raised by the Central Excise /Customs/ Sales TaxAuthorities.
A.1.2 ` 910.21 crore (2011: ` 756.76 crore) including ` 593.79
crore (2011: ` 512.09 crore) on account of Projects forwhich suits have been filed in the Courts or cases are lyingwith Arbitrator.
A.1.3 ` 2,126.64 crore (2011: ` 1,179.25 crore) in respect ofIncome Tax demands.
A.1.4 ` 816.63 crore (2011: ` 651.00 crore) in respect of otherclaims.
A.1.5 The Company has not considered those disputed demands/claims as contingent liabilities, the outflow of resources forwhich would be remote.
A.2 Interest/Penalty, if any, on some of the above claims isunascertainable.
A.3 Pending decision of the Government, no liability could be determinedand provided for in respect of additional compensation, if any,payable to the land owners and the Government for certain landsacquired.
B. Commitments
B.1 Capital Commitments
Estimated amount of contracts remaining to be executed on CapitalAccount not provided for ` 18,671.21 crore (2011: ` 22,863.56crore).
B.2 Other Commitments
The Group has an export obligation to the extent of ` 3,226.10
crore (2011: ` 3,871.83 crore) on account of concessional rate ofcustoms duty availed under EPCG license scheme on import of
capital goods.
2. Purchase of crude oil from ONGC, Oil India Limited and Panna MuktaTapti JV and some other oilfields has been accounted for provisionally,pending finalization of agreements with respective parties. Adjustments,if any, will be made on finalization of agreements.
3. Title Deeds for Land and residential apartments as also lease and otheragreements in respect of certain lands/buildings, the book value of whichis ` 95.12 crore (2011: ` 89.56 crore), are pending for execution orrenewal.
4. Transactions with other Oil Marketing Companies are jointly reconciledon an ongoing basis.
5. A Pursuant to orders pronounced by the Honorable Supreme Court /various High Courts in the matter of Entry Tax on Crude Oil, HSD &Lubricants and as advised, the Group has not provided for EntryTax amounting to ` 894.89 crore in respect of Panipat Refinery,Mundra-Panipat & Salaya Mathura Pipelines and Asaouti LubeBlending Plant (2011: ` 5,106.43 crore in respect of Mathura &Panipat Refineries, Mundra-Panipat & Salaya Mathura Pipelines andAsaouti Lube Blending Plant) including ` 207.17 crore for the yearin respect of Panipat Refinery, Mundra-Panipat & Salaya MathuraPipelines and Asaouti Lube Blending Plant (2011: ` 1363.24 crorein respect of Mathura & Panipat Refineries, Mundra-Panipat & SalayaMathura Pipelines and Asaouti Lube Blending Plant).
B Consequent to the recent order pronounced by Hon’ble High Courtof Allahabad in December, 2011, upholding the Constitutional Validityof retrospective application of Entry Tax Law in the State of UP, theCompany had filed a Special Leave Petition before Hon’ble SupremeCourt of India. Although the Apex Court has granted the stay order,the Company has been directed by the Court to deposit 50% ofarrears towards the Entry Tax and Full tax prospectively vide itsorder of January, 2012 in respect of crude imported in the State ofUP. Accordingly, pending final disposal of the matter, an amount of` 8,156.56 crore (including interest of ` 2,165.02 crore) has beenprovided in the books during 2011-12. Out of this, an amount of `7,707.82 crore comprising of entry Tax and interest thereon uptoDecember, 2011 has been shown as Exceptional Item.
6. In the absence of relevant notification by the Government of Indiaspecifying the period and applicable rate at which cess on turnover ispayable under section 441A of the Companies Act, 1956, the same isnot determinable and hence, not provided for.
Indian Oil Corporation Limited - Consolidated Financial Statements
Consolidated FinancialS
tatements 2
011-1
2

176
NOTE - 29: EMPLOYEE BENEFITS
The Group has adopted Accounting Standard 15 (AS15) on “Employee Benefits”. These consolidated financial statements include the obligations as per therequirements of this standard except for those subsidiaries which are incorporated outside India who have determined the valuation/provision for employee benefitsas per requirements of their respective countries. The disclosure in compliance with the Standard is as under:
(a) Provident Fund
During the year, the Group has recognised ` 276.26 crore (2010-11 : ` 350.21 crore) as Employer's contribution to Provident Fund in the Profit and LossAccount (included in Contribution to Provident and Other Funds in Note - 24).
(b) Pension Scheme
During the year, the Group has recognised ` 348.65 crore (2010-11 : ` 355.95 crore) towards Defined Contributory Employees Pension Scheme in theProfit and Loss Account (included in Contribution to Provident and Other Funds in Note - 24).
(c) Reconciliation of balance of Defined Benefit Obligation(` in Crore)
Gratuity Leave Encashment PRMS Resettlement Long Service StaffAllowance Award Pension Fund
at AOD
Funded Non-Funded Funded Non-Funded Funded Non-Funded Non-Funded Non-Funded Funded
Defined Obligation at the 1,445.42 1.87 4.29 1,631.45 829.99 20.56 83.00 112.29 9.28beginning of the year 1,405.89 1.95 3.91 1,407.79 825.72 18.33 82.50 94.73 9.98
Current Service Cost 18.23 0.10 0.22 53.53 52.90 0.18 3.45 20.19 0.24 21.12 0.15 0.21 54.79 46.44 0.16 3.72 5.01 0.28
Interest Cost 116.86 0.17 0.30 130.76 70.00 1.65 7.06 10.23 0.68 113.36 0.22 0.29 114.22 70.00 1.48 7.07 7.84 0.74
Past Service Cost - - (0.08) - - (0.15) - - - 2.34 - - - - - - - -
Benefits paid (108.12) (0.25) (1.14) (213.30) (70.39) (0.86) (2.66) (17.59) (2.07) (110.16) (0.09) (0.54) (167.21) (60.08) (0.75) (1.95) (9.79) (2.02)
Actuarial (gain)/ loss on obligations (21.65) (0.05) 1.00 80.72 0.44 10.11 (11.49) 94.41 (0.16) 12.90 (0.36) 0.43 221.86 (52.09) 1.36 (8.34) 14.50 0.30
Defined Benefit Obligation at the 1,450.74 1.84 4.59 1,683.16 882.94 31.49 79.36 219.53 7.97
end of the year 1,445.45 1.87 4.30 1,631.45 829.99 20.58 83.00 112.29 9.28
(d) Reconciliation of balance of Fair Value of Plan Assets
(` in Crore)
Gratuity Leave Encashment PRMS Resettlement Long Service StaffAllowance Award Pension Fund
at AOD
Funded Non-Funded Funded Non-Funded Funded Non-Funded Non-Funded Non-Funded Funded
Fair Value of Plan Assets at the 1,554.95 - 3.87 - - - - - 8.17beginning of the year 1,416.87 - 2.67 - - - - - 9.35
Expected return on plan assets 128.64 - 0.33 - - - - - 0.68 118.59 - 0.27 - - - - - 0.75
Contribution by employer 103.75 - 1.14 - 901.37 - - - 0.76 111.56 - 1.48 - - - - - -
Benefit paid (108.12) - (1.14) - (70.39) - - - (2.07) (110.15) - (0.54) - - - - - (2.02)
Actuarial gain / (losses) 18.62 - 0.11 - 51.96 - - - 0.20 18.09 - (0.01) - - - - - 0.09
Fair value of plan assets at the 1,697.84 - 4.31 - 882.94 - - - 7.74
end of the year 1,554.96 - 3.87 - - - - - 8.17
Indian Oil Corporation Limited - Consolidated Financial Statements
Contd...

177
(e) Reconciliation of Fair Value of Plan Assets and Defined Benefit Obligation
(` in Crore)
Gratuity Leave Encashment PRMS Resettlement Long Service StaffAllowance Award Pension Fund
at AOD
Funded Non-Funded Funded Non-Funded Funded Non-Funded Non-Funded Non-Funded Funded
Fair Value of Plan Assets at the 1,697.84 - 4.31 - 882.94 - - - 7.74end of the year 1,554.96 - 3.87 - - - - - 8.17
Defined Benefit Obligation at the 1,450.74 1.84 4.59 1,683.16 882.94 31.49 79.36 219.53 7.97end of the year 1,445.45 1.87 4.30 1,631.45 829.99 20.58 83.00 112.29 9.28
Amount recognised in the Balance Sheet (247.10) 1.84 0.28 1,683.16 - 31.49 79.36 219.53 0.23 (109.51) 1.87 0.43 1,631.45 829.99 20.58 83.00 112.29 1.11
(f) Amount recognised in CWIP / Profit and Loss Account(` in Crore)
Gratuity Leave Encashment PRMS Resettlement Long Service StaffAllowance Award Pension Fund
at AOD
Funded Non-Funded Funded Non-Funded Funded Non-Funded Non-Funded Non-Funded Funded
Current Service Cost 18.23 0.10 0.22 53.53 52.90 0.18 3.45 20.19 0.24 21.12 0.15 0.21 54.79 46.44 0.16 3.72 5.01 0.28
Interest Cost 116.86 0.17 0.30 130.76 70.00 1.65 7.06 10.23 0.68 113.36 0.22 0.29 114.22 70.00 1.48 7.07 7.84 0.74
Expected (return) / loss on plan asset (128.64) - (0.33) - - - - - (0.68) (118.59) - (0.27) - - - - - (0.75)
Past Service Cost - - (0.08) - - (0.15) - - - 2.34 - - - - - - - -
Actuarial (gain)/ loss (40.27) (0.05) 0.89 80.72 (51.52) 10.11 (11.49) 94.41 (0.36) (5.19) (0.36) 0.44 221.86 (52.09) 1.36 (8.34) 14.50 0.21
Expenses for the year (33.82) 0.22 1.00 265.01 71.38 11.79 (0.98) 124.83 (0.12)
13.04 0.01 0.67 390.87 64.35 3.00 2.45 27.35 0.48
(g) Major Actuarial Assumptions
Gratuity Leave Encashment PRMS Resettlement Long Service StaffAllowance Award Pension Fund
at AOD
Funded Non-Funded Funded Non-Funded Funded Non-Funded Non-Funded Non-Funded Funded
Discount rate 8.63% 10.63% 8.29% 8.63% 8.63% 8.30% 8.63% 8.63% 8.63%8.30% 8.50% 7.75% 8.30% 8.30% 8.30% 8.30% 8.30% 8.30%
Expected return on plan assets 8.60% - - - - - - - 9.00%8.00% - - - - - - 9.00%
Salary escalation 8.00% 4.00% 8.00% 8.00% - - - - 8.00%8.00% 4.00% 7.00% 8.00% - - - - 8.00%
Inflation - - - - 7.00% 7.00% 6.00% - - - - - - 7.00% 7.00% 6.00% - -
Indian Oil Corporation Limited - Consolidated Financial Statements
Consolidated FinancialS
tatements 2
011-1
2

178
NOTE - 30: SEGMENT INFORMATION
Information regarding Primary Segment Reporting as per AS-17 for the year ended March 31, 2012 is as under:
(` in Crore)
March-12 March-11
Petroleum Petro- Other Eliminations Total Petroleum Petro Other Eliminations TotalProducts chemicals Businesses Products chemicals Businesses
Revenue
External Revenue 3,90,544.12 11,174.09 7,205.82 - 4,08,924.03 2,99,332.49 5,768.13 4,696.40 - 3,09,797.02
Inter-segment Revenue 7,506.24 48.72 3,617.94 (11,172.90) - 4,632.42 67.35 1,185.47 (5,885.24) -
Total Revenue 3,98,050.36 11,222.81 10,823.76 (11,172.90) 4,08,924.03 3,03,964.91 5,835.48 5,881.87 (5,885.24) 3,09,797.02
Result
Segment Results 17,664.13 (209.94) 308.57 - 17,762.76 11,705.20 (1,609.35) (242.45) - 9,853.40
Less:
Interest Expenditure 5,894.65 2,985.70
Loss on Sale of Investments (Net) 18.87 26.56
Provision for diminution in Investments (Net) 418.15 78.74
Loss on sale and disposal of Assets 2.47 25.23
Exchange Loss (Net) 3,182.86 -
Add:
Interest/Dividend Income 2,635.19 2,575.72
Provision for diminution in Trust written back (Net) 513.21 96.86
Exchange Gain (Net) - 739.65
Other non operating income 38.73 35.46
Prior year income/(expenses) -net 270.25 (70.88)
Profit before Exceptional items and Tax 11,703.14 10,113.98
Exceptional Items (7,707.82) -
Profit Before Tax 3,995.32 10,113.98
Less: Income Tax (including
deferred tax) (269.95) 2,028.36
Profit After Tax 4,265.27 8,085.62
Other Information
Segment Assets 1,80,562.32 18,242.32 2,211.42 - 2,01,016.06 1,43,822.91 19,027.97 1,555.91 - 1,64,406.79
Corporate Assets 18,786.13 20,170.99
Total Assets 2,19,802.19 1,84,577.78
Segment Liabilities 67,989.04 828.66 1,102.94 - 69,920.64 54,544.18 2,065.50 850.12 - 57,459.80
Corporate Liabilities 87,588.84 67,573.23
Total Liabilities 1,57,509.48 1,25,033.03
Capital Employed
Segment Wise 1,12,573.28 17,413.66 1,108.48 1,31,095.42 89,278.73 16,962.47 705.79 1,06,946.99
Corporate (68,802.71) (47,402.24)
62,292.71 59,544.75
Capital Expenditure 13,880.33 196.88 426.48 14,503.69 11,323.29 7,947.46 276.64 19,547.39
Depreciation and Amortization 4,258.02 952.54 98.70 5,309.26 3,808.99 1,040.04 83.59 4,932.62
Notes:1. The Group is engaged in the following business segments:
a) Sale of Petroleum Productsb) Sale of Petrochemicalsc) Other Businesses, comprises Sale of Gas, Explosives & Cryogenics, Wind Mill & Solar Power Generation and Oil & Gas Exploration Activities jointly undertaken in the form
of unincorporated Joint Ventures.Segments have been identified and reported, taking into account, the nature of products and services and differing risks and returns.2. Segment Revenue comprises of the following:
i) Turnover (Net of Excise Duty)ii) Subsidy/Grants received from Government of Indiaiii) Other Operating Income
3. There are no reportable geographical segments.
Indian Oil Corporation Limited - Consolidated Financial Statements

179
As required by AS -18 "Related Party Disclosures", are given below :
2. The following transactions were carried out with the related parties in the ordinary course of business:
a) Details relating to parties referred to in item number 1(A) above :
(` in Crore)
2011-12 2010-11
i) Sales 256.06 191.59(Includes sales to Lubrizol India Pvt. Ltd ` 169.57 crore (2010-11 : ` 159.78 crore) andIndian Oil Petronas Pvt. Ltd. ` 85.70 crore ( 2010-11 : ` 11.78 crore))
ii) Interest received 0.05 1.10(Includes interest received from IOT Infrastructure Energy Services Ltd ` 0.02 crore(2010-11 : ` 1.08 crore) and Petronet VK Ltd. ` 0.03 crore (2010-11: ` 0.02 crore))
iii) Consultancy Services/Other Income 80.68 67.02(Includes Consultancy Service/Other Income from Lubrizol India Pvt. Ltd. ` 34.56 crore
(2010-11 : ` 30.72 crore), Petronet LNG Ltd. ` 23.21 crore (2010-11 : ` 19.71 crore)and IndianOil Petronas Pvt. Ltd. ` 8.35 crore ( 2010-11 ` 8.00 crore))
iv) Purchase of Products 7,387.95 3,837.96(Includes Purchase of Products from Petronet LNG Ltd ` 7,318.35 crore ( 2010-11 : ` 3,753.78 crores))
v) Purchase of Chemicals/materials 280.73 228.15(Includes Purchase of chemicals /materials from Lubrizol India Pvt. Ltd ` 280.60 crore
(2010-11 : ` 228.15 crore))
vi) Handling Expenses 316.10 228.04(Includes Handling Expenses to IndianOil Sky Tanking Ltd ` 208.79 crore (2010-11 : ` 130.91)and Indian Oil Petronas Pvt Ltd ` 94.02 crore (2010-11 : ` 79.22 crores))
vii) Freight Expenses 0.33 0.25(Includes Freight Expenses to Lubrizol India Pvt Ltd ` 0.31 crore (2010-11 : ` 0.24 crore))
viii Exploration & Production Expenses 10.09 -(Exploration & Production Expenses to IOT Infrastructure Energy Services Ltd ` 10.09 crore (2010-11 : NIL))
ix) Reimbursement of Expenses 5.25 5.08(Includes Reimbursment of Expenses Indian Oil Petronas Pvt. Ltd. ` 2.27 crore (2010-11 : ` 2.49 crore),IndianOil Sky Tanking Ltd ` 1.80 crore (2010-11 : ` 1.57 crore) and IOT Infrastructure Energy Services Ltd` 0.54 crore (2010-11: NIL))
x) Investments made during the year 116.93 126.18(Includes Investment made in Indian Synthetic Rubber Ltd. ` 115.62 crore (2010-11 ` 25.00 crore))
1. RELATIONSHIP
A) DETAILS OF JOINT VENTURE COMPANIES/ ENTITIES 1) IOT Infrastructure Energy Services Ltd. 2) Lubrizol India Pvt. Ltd 3) Petronet VK Ltd 4) IndianOil Petronas Pvt. Ltd 5) Avi-Oil India Pvt.Ltd 6) Petronet India Ltd. 7) Petronet LNG Ltd. 8) Green Gas Ltd. 9) IndianOil Panipat Power Consortium Ltd. 10) Petronet CI Ltd. 11) Indo Cat Pvt. Ltd. 12) IndianOil SkyTanking Ltd. 13) Suntera Nigeria 205 Ltd. 14) Delhi Aviation Fuel Facilty Pvt Limted 15) Indian Synthetic Rubber Limited 16) IndianOil Ruchi Biofuels LLP 17) NPCIL- IndianOil Nuclear Energy Corporation Limited 18) Indian Additives Ltd.
19) National Aromatics and petrochemicals Corporation Ltd. 20) Ceylon Petroleum Storage terminal Ltd.
B) Whole-time Directors
1) Shri R.S.Butola2) Shri B.M.Bansal (upto 31.01.2011)3) Shri S.V.Narasimhan (upto 30.04.2011)4) Shri V.C.Agrawal (upto 31.07.2010)5) Shri G.C.Daga (upto 30.09.2011)6) Shri B.N.Bankapur (upto 31.08.2011)7) Shri Anand Kumar (upto 30.06.2010)8) Shri K.K. Jha (upto 31.01.2012)9) Shri R.K.Malhotra10) Shri Sudhir Bhalla11) Shri A.M.K.Sinha12) Shri P.K.Goyal13) Shri R.K.Ghosh14) Shri Makarand Nene15) Shri V.S. Okhade
NOTE - 31: RELATED PARTY DISCLOSURES
Indian Oil Corporation Limited - Consolidated Financial Statements
Contd...
Consolidated FinancialS
tatements 2
011-1
2

180
(` in Crore)
2011-12 2010-11
xi) Purchase/Acquistion of Fixed Assets 256.77 437.04(Includes Purchase/Acqusition of Fixed Assets from IOT Infrastructure Energy Services Ltd` 256.77 crore (2010-11 : ` 434.37 crore))
xii) Provisions made/(written off) during the year (40.38) 0.19(Includes write back of provision made against advance given to Suntera Nigeria 205 Ltd.` 40.53 crore (2010-11: NIL))
xiii) Outstanding Receivables/ Loans Recoverable 278.05 108.26(Includes Outstanding Recevables from IOT Infrasturcture Energy Services Ltd ` 169.12 crore
(2010-11 : ` 41.62 crore) and Suntera Nigeria 205 Ltd ` 68.11 crore (2010-11 : ` 40.53 crore))
xiv) Outstanding Payables 642.86 557.99(Includes Outstanding payable to Petronet LNG. Ltd. ` 429.99 crore ( 2010-11 : 219.45 crore)and IOT Infrastructure Energy Services Ltd ` 132.25 crore (2010-11 : ` 237.48 crore))
xv) Claims Recoverable 14.40 14.40(Claims recoverable from National Aromatics and Petrochemicals Corporation Ltd.` 14.40 crore (2010-11 : ` 14.40 crore))
xvi) Provision for Doubtful Claims 14.40 14.40(Provision for Doubtful Claims in respect of National Aromatics and Petrochemicals Corporation Ltd.` 14.40 crore (2010-11 : ` 14.40 crore))
b) Details relating to the parties referred to in Item No.1 (B) above :
(` in Crore)
FY 2011-12
Details of Whole-time Directors Remuneration Recovery of Interest & Outstanding
Furniture Hire Charges loans/advances
receivables
1) Shri R.S.Butola 0.37 - -
2) Shri B.M.Bansal - - -
3) Shri S.V.Narasimhan 0.57 - -
4) Shri V.C.Agrawal - - -
5) Shri G.C.Daga 0.63 - -
6) Shri B.N.Bankapur 0.54 - -
7) Shri Anand Kumar - - -
8) Shri K.K. Jha 0.41 0.01 -
9) Shri R.K.Malhotra 0.37 - -
10) Shri Sudhir Bhalla 0.40 - 0.05
11) Shri A.M.K.Sinha 0.31 0.01 -
12) Shri P.K.Goyal 0.42 0.01 0.03
13) Shri R.K.Ghosh 0.29 - 0.08
14) Shri Makarand Nene 0.20 - -
15) Shri V S Okhde 0.06 - 0.01
TOTAL 4.57 0.03 0.17
FY 2010-11
Details of Whole-time Directors Remuneration Recovery of Interest & Outstanding
Furniture Hire Charges loans/advances
receivables
1) Shri R.S.Butola 0.03 - -
2) Shri B.M.Bansal 0.63 - -
3) Shri S.V.Narasimhan 0.45 - -
4) Shri V.C.Agrawal 0.50 - -
5) Shri G.C.Daga 0.42 - -
Indian Oil Corporation Limited - Consolidated Financial Statements
Contd...

181
6) Shri B.N.Bankapur 0.45 - -
7) Shri Anand Kumar 0.55 - -
8) Shri K.K. Jha 0.42 - 0.02
9) Shri R.K.Malhotra 0.25 - -
10) Shri Sudhir Bhalla 0.13 - 0.06
11) Shri A.M.K.Sinha 0.01 0.01 -
12) Shri P.K.Goyal - - -
13) Shri R.K.Ghosh - - -
14) Shri Makarand Nene - - -
15) Shri V S Okhde - - -
TOTAL 3.84 0.01 0.08
Notes:
1) This does not include the impact of provision made on acturial valuation of retirement benefit Schemes and provision made during the period towards PostRetirement Benefits as the same are not separately ascertainable for individual directors.
2) In addition, whole - time Directors are also allowed the use of Corporation's car for private purposes upto 12,000 kms per annum on a payment of ` 520/- permensem for car less than 16 hp or ` 780/- per mensem for car of above 16 hp as specified in the terms of appointment.
3) No disclosure is required for Subsidiary Companies which can be treated as state controlled enterprises '(i.e. ownership by Central/State Govt, directly orindirectly, of more than 50% of voting rights shall be treated as state controlled enterprise)
4) In case of Joint Venture Companies constituted/acquired during the period, transactions w.e.f. date of constitution/acquisition is disclosed.
5) In case of Joint Venture Companies which have been closed/divested during the period, transactions upto the date of closure/disinvestment only are disclosed.
Indian Oil Corporation Limited - Consolidated Financial Statements
Consolidated FinancialS
tatements 2
011-1
2

182
Finance Leases on Tank Wagons:
Company has entered into Lease Agreement with Indian Railways in respect of BTPN Tank Wagons for a minimum period of 20 years. The lease rentals from the dateof formation of rake are @ 16% for the first 10 years and thereafter at the nominal rate of 1% of the cost.
(` in Crore)
Particulars March-12 March-11
A. Gross Investments in Finance Lease 415.64 415.64
Less: Unearned Finance Income 4.05 5.24
Less: Finance Income Received 167.10 165.91
Less: Minimum Lease payment received 234.20 232.77
Net Investment in Finance Lease as on Date 10.29 11.72
B. Unearned finance Income 4.05 5.24
C. Present Value of Minimum Lease Payments Receivable
Not Later than one year 1.40 1.43
Later than one year and not later than five years 7.14 6.77
Later than Five years 1.75 3.52
Total : 10.29 11.72
D. Break-up of un-earned income
Not Later than one year 1.04 1.19
Later than one year and not later than five years 2.75 3.44
Later than Five years 0.26 0.61
Total 4.05 5.24
Operating leases:
a) As Lessee
Lease Rentals charged to the profit and loss account and maximum obligations on long term non-cancellable operating leases payable as per the rentalsstated in the respective lease agreements:
(` in Crore)
Particulars March-12 March-11
A. Lease rentals recognized during the period 50.48 51.71
B. Lease Obligations
- Not later than One Year 47.57 49.09
- Later than one year and not later than five years 160.61 163.59
- Later than five years 556.14 583.89
b) As Lessor
The lease rentals recognized as income in these statements as per the rentals stated in the respective agreements:
(` in Crore)
Particulars March-12 March-11
A. Lease rentals recognized as income during the period 1.51 2.52
B. Lease Rentals(Category of assets – Plant & Equipment)
- Gross Carrying Amount 2.05 2.04
- Accumulated Depreciation 1.19 1.10
- Depreciation recognized in Profit and Loss Account 0.09 0.10
These relate to storage tankage facilities for petroleum products given on lease at mutually agreed lease rent.
NOTE - 32: LEASESDisclosure as required under Accounting Standard – 19 on “Leases”:
Indian Oil Corporation Limited - Consolidated Financial Statements

183
NOTE - 33: EARNINGS PER SHARE (EPS)
In compliance of Accounting Standard – 20 on “Earning Per Share”, the calculation of Earning Per Share (Basic and Diluted) is as under:
March-12 March-11
Profit for the Group (` in Crore) 4,225.98 7,830.72
Total Weighted Average number of equity shares used for computing Earning Per Share (Basic & Diluted) 2427952482 2427952482
Earning Per Share (Basic and Diluted) (`) 17.41 32.25
Face value per share (`) 10/- 10/-
Indian Oil Corporation Limited - Consolidated Financial Statements
In compliance of AS-27, " Financial Reporting of Interest in Joint Ventures", the required information is as under:
1) Disclosure of Interest in the following categories of Joint Ventures:
(a) Jointly Controlled Operations:-
The Corporation has entered into production sharing agreements for oil and gas exploration blocks with the Govt. of India and other body corporates.Thesejoint ventures are:
Name Participating Interest of IOC (%)
31.03.2012 31.03.2011
IN INDIA
Under NELP Block
MN-OSN-2000/2 20.00 20.00
AA-ONN-2001/2 20.00 20.00
MB-OSN-2004/1 20.00 20.00
MB-OSN-2004/2 20.00 20.00
KG-DWN-2005/1 20.00 20.00
GK-OSN-2009/1 20.00 20.00
GK-OSN-2009/2 30.00 30.00
CB-ONN-2010/6 * 20.00 -
Others
AAP-ON-94/1 43.55 43.55
BK-CBM-2001/1 20.00 20.00
NK-CBM-2001/1 20.00 20.00
OUTSIDE INDIA
FARSI BLOCK IRAN 40.00 40.00
LIBYA BLOCK 86 50.00 50.00
LIBYA BLOCK 102/4 50.00 50.00
SHAKTHI GABON** 50.00 50.00
YEMEN 82 15.00 15.00
YEMEN 83 15.00 15.00
AREA 95-96 25.00 25.00
Block K *** - 12.50
* Block awarded under NELP-IX
** Participating Interest will come down to 45% after Exploration phase.
***Block relinquished during the year 2011-12.
NOTE - 34: INTEREST IN JOINT VENTURES
Consolidated FinancialS
tatements 2
011-1
2

184
(b) Jointly Controlled Assets:-
Details of Group's share of Jointly Owned Assets included above:(` in Crore)
Assets Name of Joint Original Accumulated W.D.V. as atParticulars Owners Cost Depreciation & 31.03.12
Amortisation
Land - Freehold HPC/BPC 3.10 0.00 3.10
Land - Leasehold HPC/BPC 0.18 0.06 0.12
Buildings HPC/BPC 17.97 6.05 11.92
Plant and Equipment HPC/BPC/GSFC/IPCL/GNRE 127.31 59.99 67.32
Transport Equipment RAILWAYS 183.58 174.40 9.18
Railway Sidings HPC/BPC/KRIBHKO 55.92 36.72 19.20
Drainage,Sewage & Water Supply GSFC 0.99 0.94 0.05
Furniture HPC/BPC 0.00 0.00 0.00
Total 389.05 278.16 110.89
Previous year 386.52 269.69 116.83
(c) Jointly Controlled Entities:-
Name Country of Ownership Interest of IOC(%)Incorporation 31.03.2012 31.03.2011
(i) IOT Infrastructure Energy Services Ltd India 47.92 49.89(name changed from Indian Oil Tanking Ltd)
(ii) Lubrizol India Pvt. Ltd. India 50.00 50.00
(iii) Petronet VK Ltd. India 26.00 26.00
(iv) Petronet CI Ltd. India 26.00 26.00
(v) IndianOil SkyTanking Ltd. India 33.33 33.33
(vi) Indo Cat Pvt. Ltd. India 50.00 50.00
(vii) Delhi Aviation Fuel Facility Pvt. Ltd. India 37.00 37.00
(viii) IndianOil Petronas Pvt.Ltd. India 50.00 50.00
(ix) Suntera Nigeria 205 Ltd Nigeria 25.00 25.00
(x) IndianOil Panipat Power Consortium Ltd. India 50.00 50.00
(xi) Avi-Oil India Pvt. Ltd. India 25.00 25.00
(xii) Petronet India Ltd. India 18.00 18.00
(xiii) Petronet LNG Ltd. India 12.50 12.50
(xiv) Indian Synthetic Rubber Limited India 50.00 50.00
(xv) IndianOil Ruchi Biofuels LLP India 50.00 50.00
(xvi) Green Gas Ltd. India 22.50 22.50
(xvii) NPCIL IndianOil Nuclear Energy Corporation Limited (NINECL) India 26.00 -
2) IOC's Share in aggregate of Contingent Liabilities and Capital Commitments of Jointly Controlled Operations and Assets :
(` in Crore)
31.03.2012 31.03.2011
(a) Jointly Controlled Operations
(i) Contingent Liabilities 0.20 14.09
(ii) Capital Commitments 1,214.86 999.94
(b) Jointly Controlled Assets
(i) Contingent Liabilities - -
(ii) Capital Commitments - -
Indian Oil Corporation Limited - Consolidated Financial Statements

185
3) IOC's Share in assets,liabilities,income,expenses,contingent liabilities and capital commitments of Jointly Controlled Entities:
(` in Crore)
31.03.2012 31.03.2011
(i) Assets
- Long Term Assets 1938.55 1495.58
- Current Assets 1306.98 1104.72
(ii) Liabilities
- Current Liabilities and Provisions 938.95 790.61
- Other Liabilities 802.74 666.85
(iii) Income 4602.13 3233.34
(iv) Expenses 4152.87 2867.91
(v) Contingent Liabilities 89.47 38.08
(vi) Capital Commitments 497.75 382.97
Financial and Derivative Instruments:
1. All derivative contracts entered into by the Company are for hedging its foreign currency exposures and commodity trading exposures relating tounderlying transactions and firm commitments and not for any speculative or trading purposes.
2. The Derivative contracts entered into by the Company and outstanding as on 31st March 2012 are as below:
(a) For Hedging Currency Risks
Nominal amounts of derivative contracts entered into by the Company and outstanding as on 31st March 2012 is given below:(` in Crore)
S. No. Particulars Unit of Currency As on 31.03.2012 As on 31.03.2011
No of Aggregate No of Aggregatecontracts amount contracts amount
1. Forward Contracts USD 16 379.80 108 4,004.13
(b) For Hedging Commodity Related Risks:
Category–wise quantitative data about commodity derivative transactions that are outstanding as on 31st March 2012 is given below:
Quantity ( in ‘000 bbls)
S. No. Particulars As at 31st March 2012* As at 31st March 2011
1. Swaps on Crude oil 500 9450
2. Margin Hedging 250 2400
* Positions settled on 16.04.2012
(c) For Hedging Interest Rate Related Risks:
Interest rate swap for ` 2,544 crore (2010-11: ` 2230 crore) - (USD 50 crore) syndicated loan (swap from 1/3/6 month USD LIBOR till maturity to2.222% Fixed)
S. No. Particulars Number of Contracts
As at 31st March 2012 As at 31st March 2011
1 Swaps of Interest Rates 1 1
Mark to market losses as at the Balance Sheet date, if material, are recognised in the Statement of Profit and Loss
3. Foreign currency exposure that are not hedged by a derivative instrument as on 31st March 2012 is given below:
(` in Crore)
S. No. Particulars As on 31.03.2012 As on 31.03.2011
Aggregate amount Aggregate amount
1 Unhedged 53,193.44 42,996.16
NOTE - 35: EXPOSURE TO FINANCIAL AND COMMODITY TRADING DERIVATIVES
Indian Oil Corporation Limited - Consolidated Financial Statements
Consolidated FinancialS
tatements 2
011-1
2

186
NOTE - 36: ADDITIONAL DISCLOSURES BY GROUP COMPANIES
Lanka IOC Ltd.
a) Goodwill represents the excess of purchase consideration paid in 2003 to the Government of Sri Lanka over the net assets value representing applicable sharesallotted in the acquisition of the retail outlet, which were vested with Independent Petroleum Marketers Limited (IPML). The IPML was subsequently amalgamatedin 2004 with Lanka IOC LPC and dissolved.
Goodwill represents future economic benefits arising from other assets which were acquired from the above business combination that were not able toindividually identified and separately recognized. Accumulated amortization as at the balance sheet date amounting to INR 34,510,737 which were amortizedup to 2007 based on 20 years useful life. However, as per the revised accounting standards goodwill is tested annually for impairment and carried at cost lessaccumulated impairment losses.
b) Lanka IOC Ltd owns 1/3rd share of Ceylon Petroleum Storage Terminal Limited (CPSTL), also known as the “Common User Facility” (CUF). The Company paidUS$ 45 million to Ceylon Petroleum Corporation on 22 January 2004 to obtain 1/3rd share of CPSTL. Investment is recorded at cost and details are as under:
(` in Crore)
2011-12 2010-11
At the beginning of the year 177.52 172.84
Translation Difference (1.49) 4.68
Closing Net book amount 176.03 177.52
c) In terms of the agreement entered into with the Board of Investment of Sri Lanka under section 17 of the Board of Investment Law No. 4 of 1978, the Companyis exempt from income tax for a period of 10 years commencing from 14.02.2003. The current year’s tax charge wholly consists of tax on non-exempt interestincome.
Petronet LNG Ltd.
a) In terms of the provisions contained in the Dahej LNG Port Terminal Concession Agreement, the Company has to develop a Solid Cargo Port along with LNGTerminal. A Joint Venture Company “ Adani Petronet (Dahej) Port Pvt Ltd (APPPL)” has been formed for development of Solid Cargo Port. The Company hasacquired 26% equity in APPPL.
b) Customs Duty on import of Project material/equipment has been assessed provisionally (current and previous years) and additional liability, if any, on thisaccount will be provided on final assessment.
Indian Oil Corporation Limited - Consolidated Financial Statements
187Indian Oil Corporation Limited - Consolidated Financial Statements
NOTE - 37: PREVIOUS YEAR FIGURES
A. The Financial Statements for the year ended 31st March, 2011 were prepared as per the then applicable Schedule VI to the Companies Act, 1956. Consequentto the Notification of Revised Schedule VI under the Companies Act, 1956, the Financial Statements for the year ended 31st March, 2012 have been preparedas per Revised Schedule VI. Accordingly, the previous year figures have also been reclassified by the Company to conform to current year's classification.
B. The adoption of Revised Schedule VI for previous year figures does not impact recognition and measurement principles followed for preparation of FinancialStatements.
C. Previous year's comparative figures have been regrouped wherever necessary. Figures in brackets indicate deductions.
Sd/- Sd/- Sd/-(R. S. Butola) (P. K. Goyal) (Raju Ranganathan)
Chairman Director (Finance) Company Secretary
As per our attached Report of even date
For B.M. CHATRATH & CO. For DASS GUPTA & ASSOCIATES For PARAKH & CO.Chartered Accountants Chartered Accountants Chartered Accountants
(Firm Regn. No. 301011E) (Firm Regn. No. 000112N) (Firm Regn. No.001475C)
Sd/- Sd/- Sd/-(CA. P.R.Paul) (CA. Naresh Kumar) (CA. Aditya Kumar Rawat)
Partner Partner PartnerM. No. 051675 M. No. 082069 M. No. 071767
Place : New DelhiDate : May 28, 2012
Consolidated FinancialS
tatements 2
011-1
2

188
1 BASIS OF PREPARATION
1.1 The financial statements are prepared under historical costconvention in accordance with the mandatory accountingstandards notified by the Companies (Accounting Standards)Rules, 2006 and the provisions of the Companies Act, 1956.
1.2 The preparation of financial statements requires themanagement to make estimates and assumptions that affectthe reported amount of assets, liabilities and disclosure ofcontingent liabilities as at the date of the financial statements.Management believes that these estimates and assumptionsare reasonable and prudent. However, actual results coulddiffer from estimates.
2 FIXED ASSETS
2.1 Tangible Assets
2.1.1 Fixed Assets are stated at acquisition cost less accumulateddepreciation / amortization and cumulative impairment.
2.1.2 Land acquired on perpetual lease as well as on lease for over99 years is treated as free hold land.
2.1.3 Land acquired on lease for 99 years or less is treated asleasehold land.
2.1.4 Technical know-how / license fee relating to plants/facilitiesare capitalised as part of cost of the underlying asset.
2.2 Construction Period Expenses on Projects
2.2.1 Revenue expenses exclusively attributable to projects incurredduring construction period are capitalised. However, suchexpenses in respect of capital facilities being executed alongwith the production/operations simultaneously are chargedto revenue.
2.2.2 Financing cost incurred during construction period on loansspecifically borrowed and utilised for projects is capitalisedon quarterly basis up to the date of capitalisation.
2.2.3 Financing cost, if any, incurred on General Borrowings usedfor projects is capitalised at the weighted average cost. Theamount of such borrowings is determined on quarterly basisafter setting off the amount of internal accruals.
2.3 Capital Stores
2.3.1 Capital stores are valued at cost. Specific provision is madefor likely diminution in value, wherever required.
2.4 Depreciation/Amortisation
2.4.1 Cost of leasehold land for 99 years or less is amortised overthe lease period.
2.4.2 Depreciation on fixed assets is provided in accordance withthe rates as specified in Schedule XIV to The Companies Act,1956, on straight line method, upto 95% of the cost of theasset other than Insurance spares which are depreciated upto100%. Depreciation is charged pro-rata on quarterly basis onassets, from/upto the quarter of capitalisation/ sale, disposal/dismantle or earmarking for disposal/dismantling during theyear.
SIGNIFICANT ACCOUNTING POLICIES
2.4.3 Assets, other than LPG Cylinders and Pressure Regulators,costing upto ` 5,000/-per item are depreciated fully in theyear of capitalisation.
2.4.4 Expenditure on the items, ownership of which is not with theCompany are charged off to revenue in the year of incurrenceof such expenditure.
2.5 Impairment of Assets
As at each balance sheet date, the carrying amount of cashgenerating units / assets is tested for impairment so as todetermine:
(a) the provision for impairment loss, if any, required; or
(b) the reversal, if any, required of impairment loss recognizedin previous periods.
Impairment loss is recognized when the carrying amount ofan asset exceeds recoverable amount.
3. INTANGIBLE ASSETS
3.1 Technical know-how / license fee relating to productionprocess and process design are recognised as IntangibleAssets and amortised on a straight line basis over a period often years or life of the underlying plant/ facility, whichever isearlier.
3.2 Expenditure incurred on Research & Development, other thanon capital account, is charged to revenue.
3.3 Costs incurred on computer software purchased/developedresulting in future economic benefits, are capitalised asIntangible Asset and amortised over a period of three yearsbeginning from the quar ter in which such software iscapitalised. However, where such computer software is stillin development stage, costs incurred during the developmentstage of such software are accounted as "Intangible AssetsUnder Development".
3.4 Cost of Right of Way for laying pipelines is capitalised.However, such Right of Way being perpetual in nature, is notamortised.
4. BORROWING COST
Borrowing costs that are attributable to the acquisition and constructionof the qualifying asset are capitalized as part of the cost of such assets.A qualifying asset is one that necessarily takes substantial period oftime to get ready for intended use. All other borrowing costs are chargedto revenue.
5. FOREIGN CURRENCY TRANSLATION
5.1 Transactions in foreign currency are initially recorded atexchange rates prevailing on the date of transactions.
5.2 Monetary items denominated in foreign currencies (such ascash, receivables, payables etc.) outstanding at the end ofreporting period, are translated at exchange rates prevailingas at the end of reporting period.
5.3 Non-monetary items denominated in foreign currency, (suchas investments, fixed assets etc.) are valued at the exchangerate prevailing on the date of the transaction.
Annexure-I
Indian Oil Corporation Limited - Consolidated Financial Statements

189Indian Oil Corporation Limited - Consolidated Financial Statements
5.4.1 (a) Any gains or losses arising due to differences inexchange rates at the time of translation or settlementare accounted for in the Statement of Profit & Losseither under the head foreign exchange fluctuation orinterest cost, as the case may be, except those relatingto long-term foreign currency monetary items.
(b) Exchange differences on long-term foreign currencymonetary items relating to acquisition of depreciableassets are adjusted to the carrying cost of the assetsand depreciated over the balance life of the assets. Inother cases, exchange differences are accumulatedin a "Foreign Currency Monetary Item TranslationDifference Account" and amortised over the balanceperiod of such long-term foreign currency monetaryitem but not beyond 31st March, 2020, by recognitionas income or expense in each of such periods.
5.4.2. Premium/discount arising at the inception of the forwardcontracts entered into to hedge foreign currency risks areamortised as expense/income over the life of the contract.Outstanding forward contracts as at the reporting date arerestated at the exchange rate prevailing on that date.
6. INVESTMENTS
6.1 Long term investments are valued at cost and provision fordiminution in value, thereof is made, wherever such diminutionis other than temporary.
6.2 Current investments are valued at lower of cost or fair marketvalue.
7. INVENTORIES
7.1 Raw Materials
7.1.1 Raw materials including crude oil are valued at cost determinedon weighted average basis or net realizable value, whicheveris lower.
7.1.2 Stock in Process is valued at raw material cost plus conversioncosts as applicable or net realizable value, whichever is lower.
7.1.3 Crude oil in Transit is valued at cost or net realizable value,whichever is lower.
7.2 Finished Products and Stock-in-Trade
7.2.1 Finished products and stock in trade, other than lubricants,are valued at cost determined on 'First in First Out' basis ornet realizable value, whichever is lower. Cost of FinishedProducts produced is determined based on raw material costand processing cost.
7.2.2 Lubricants are valued at cost on weighted average basis ornet realizable value, whichever is lower. Cost of lubricantsinternally produced is determined based on cost of inputsand processing cost.
7.2.3 Imported products in transit are valued at CIF cost or netrealisable value whichever is lower.
7.3 Stores and Spares
7.3.1 Stores and Spares (including Barrels & Tins) are valued atweighted average cost. Specific provision is made in respectof identified obsolete stores & spares and chemicals for likelydiminution in value. Further, an adhoc provision @ 5% is alsomade on the balance stores and spares (excluding barrels,
tins, stores in transit, chemicals, crude oil and own products)towards likely diminution in the value.
7.3.2 Stores & Spares in transit are valued at cost.
8. TRADE RECEIVABLES
In addition to the specific provision made, an adhoc provision @ 1% isalso made in respect of Trade Receivables, other than those relating toOil Marketing companies, Subsidiary & Joint Venture companies andExport customers, to recognize the element of uncertainty.
9. CONTINGENT LIABILITIES AND CAPITAL COMMITMENTS
9.1 Contingent Liabilities
9.1.1 Show Cause Notices issued by various Government Authoritiesare not considered as Obligation.
9.1.2 When the demand notices are raised against such show causenotices and are disputed by the Company, these are classifiedas disputed obligations.
9.1.3 The treatment in respect of disputed obligations, in each caseabove ` 5 lakh, are as under:
a) a provision is recognized in respect of presentobligations where the outflow of resources is probable;
b) all other cases are disclosed as contingent liabilitiesunless the possibility of outflow of resources is remote.
9.2 Capital Commitments
Estimated amount of contracts remaining to be executed oncapital account above ` 5 lakhs, in each case, are consideredfor disclosure.
10. REVENUE RECOGNITION
10.1 Revenue from sale of goods is recognised when sufficientrisks and rewards are transferred to customers, which isgenerally on dispatch of goods.
10.2 Dividend income is recognized when the company's right toreceive dividend is established.
10.3 Claims (including interest on outstandings) are accounted:a) When there is cer tainty that the claims are realizableb) Generally at cost
10.4 Income and expenditure upto Rupees five lakhs in each casepertaining to previous years are accounted for in the currentyear.
10.5 Pre-paid expenses upto Rupees five lakhs in each case arecharged to revenue.
11. EXCISE DUTY
Excise duty is accounted on the basis of both, payments made in respectof goods cleared as also provision made for goods lying in stock. Closingstock value includes excise duty payable / paid on finished goods.
12. TAXES ON INCOME
Provision for current tax is made as per the provisions of the IncomeTax Act, 1961. Deferred Tax Liability / Asset resulting from 'timingdifference' between book and taxable profit is accounted for consideringthe tax rate and laws that have been enacted or substantively enactedas on the Balance Sheet date. Deferred Tax Asset is recognized andcarried forward only to the extent that there is virtual certainty that theasset will be realized in future.
Consolidated FinancialS
tatements 2
011-1
2

190
13. EMPLOYEES BENEFITS
13.1 Short Term Benefits:
Short Term Employee Benefits are accounted for in the periodduring which the services have been rendered.
13.2 Post-Employment Benefits and Other Long Term EmployeeBenefits :
a) The Company's contribution to the Provident Fund isremitted to separate trusts established for this purposebased on a fixed percentage of the eligible employee'ssalary and charged to Statement of Profit and Loss.Shor tfall, if any, in the fund assets, based on theGovernment specified minimum rate of return, will bemade good by the Company and charged to Statementof Profit and Loss.
b) The Company operates defined benefit plans forGratuity and Post Retirement Medical Benefits. Thecost of providing such defined benefits is determinedusing the projected unit credit method of actuarialvaluation made at the end of the year and areadministered through respective Trusts. Actuarialgains/losses are charged to Statement of Profit andLoss.
c) Obligations on Compensated Absences, Resettlementand Long Service Awards are provided using theprojected unit credit method of actuarial valuation madeat the end of the year.
d) The Company operates a defined contribution schemefor Pension benefits for its employees and thecontribution is remitted to a separate Trust.
13.3 Termination Benefits:
Payments made under Voluntary Retirement Scheme arecharged to Statement of Profit and Loss.
14. GRANTS
14.1 Capital Grants
In case of depreciable assets, the cost of the asset is shown
at gross value and grant thereon is treated as Capital Grantswhich are recognised as income in the Statement of Profitand Loss over the period and in the proportion in whichdepreciation is charged.
14.2 Revenue Grants
Revenue grants are reckoned as per the respective schemesnotified by Government from time to time, subject to finaladjustments as per separate audit wherever applicable.
15. OIL & GAS EXPLORATION ACTIVITIES
15.1 The Company is following the "Successful Efforts Method" ofaccounting for Oil & Gas exploration and production activitiesas explained below:
a) Survey costs are expensed in the year of incurrence.
b) Acquisition cost, cost of incomplete / undecidedexploratory wells and development costs are carriedas capital work in progress till the time these are eithertransferred to producing properties on completion orexpensed in the year when determined to be dry, asthe case may be.
c) Expenditure towards unfinished Minimum WorkProgramme with and without extension of time isexpensed in the year of incurrence.
15.2 Company's share of proved reserves of oil and gas aredisclosed when notified by the Operator of the relevant block.
15.3 The Company's proportionate share in the assets, liabilities,income and expenditure of joint venture operations areaccounted as per the participating interest in such joint ventureoperations.
16. COMMODITY HEDGING
The realised gain or loss in respect of commodity hedging contracts,the pricing period of which has expired during the year, are recognisedin the Statement of Profit & Loss. However, in respect of contracts, thepricing period of which extends beyond the balance sheet date, suitableprovision for likely loss, if any, is made.
Indian Oil Corporation Limited - Consolidated Financial Statements