Embed Size (px)
Citation preview

OracleField Service CloudConfiguring and Using Reports
18A

Configuring and Using Reports
Part Number: E92188-02
Copyright © 2018, Oracle and/or its affiliates. All rights reserved
Authors: The Field Service Cloud Information Development Team
This software and related documentation are provided under a license agreement containing restrictions on use and disclosure and are protected byintellectual property laws. Except as expressly permitted in your license agreement or allowed by law, you may not use, copy, reproduce, translate, broadcast,modify, license, transmit, distribute, exhibit, perform, publish, or display in any part, in any form, or by any means. Reverse engineering, disassembly, ordecompilation of this software, unless required by law for interoperability, is prohibited.
The information contained herein is subject to change without notice and is not warranted to be error-free. If you find any errors, please report them tous in writing.
If this is software or related documentation that is delivered to the U.S. Government or anyone licensing it on behalf of the U.S. Government, the followingnotice is applicable:
U.S. GOVERNMENT END USERS: Oracle programs, including any operating system, integrated software, any programs installed on the hardware, and/or documentation, delivered to U.S. Government end users are "commercial computer software" pursuant to the applicable Federal Acquisition Regulationand agency-specific supplemental regulations. As such, use, duplication, disclosure, modification, and adaptation of the programs, including any operatingsystem, integrated software, any programs installed on the hardware, and/or documentation, shall be subject to license terms and license restrictionsapplicable to the programs. No other rights are granted to the U.S. Government.
This software or hardware is developed for general use in a variety of information management applications. It is not developed or intended for use inany inherently dangerous applications, including applications that may create a risk of personal injury. If you use this software or hardware in dangerousapplications, then you shall be responsible to take all appropriate fail-safe, backup, redundancy, and other measures to ensure its safe use. OracleCorporation and its affiliates disclaim any liability for any damages caused by use of this software or hardware in dangerous applications.
Oracle and Java are registered trademarks of Oracle Corporation and/or its affiliates. Other names may be trademarks of their respective owners.
Intel and Intel Xeon are trademarks or registered trademarks of Intel Corporation. All SPARC trademarks are used under license and are trademarks orregistered trademarks of SPARC International, Inc. AMD, Opteron, the AMD logo, and the AMD Opteron logo are trademarks or registered trademarks ofAdvanced Micro Devices. UNIX is a registered trademark of The Open Group.
This software or hardware and documentation may provide access to or information about content, products, and services from third parties. OracleCorporation and its affiliates are not responsible for and expressly disclaim all warranties of any kind with respect to third-party content, products, andservices unless otherwise set forth in an applicable agreement between you and Oracle. Oracle Corporation and its affiliates will not be responsible for anyloss, costs, or damages incurred due to your access to or use of third-party content, products, or services, except as set forth in an applicable agreementbetween you and Oracle.
The business names used in this documentation are fictitious, and are not intended to identify any real companies currently or previously in existence.

Oracle Field Service CloudConfiguring and Using Reports
Contents
Preface .................................................................................................................. i
1 Overview of Dashboard and Reports 1Dashboard .................................................................................................................................................................. 1
Reports ...................................................................................................................................................................... 8
2 Dashboard Reports 11Completion Progress Report .................................................................................................................................... 11
Activities By Capacity Categories Report ................................................................................................................. 11
Average Productivity By Activity Report .................................................................................................................... 14
Average Productivity By Work Type Report .............................................................................................................. 16
Resources By Statuses Report ................................................................................................................................ 17
Comparing Resources by Number of Activities Report ............................................................................................. 18
Comparing Resources By Productivity Report .......................................................................................................... 21
Auto-Routing Results Dashboard Chart .................................................................................................................... 23
Routing Errors Reasons Report ................................................................................................................................ 24
Mean Time to Deliver Report ................................................................................................................................... 25
Percent of Activities Met Report ............................................................................................................................... 27
Percent of Customer Expectations Met Report ........................................................................................................ 29
PAS Responses Per Resource Report ..................................................................................................................... 31
Average Travel Time Per Resource Report ............................................................................................................... 33
Activities By Statuses Report ................................................................................................................................... 35
Completion Progress By Volume Report .................................................................................................................. 37
3 Routes and Activities Reports 41About Routes and Activities Reports ........................................................................................................................ 41
View the InTime/Late/Early Activity Report ............................................................................................................... 41
View the Notification Summary Report ..................................................................................................................... 42
Print Route ............................................................................................................................................................... 43
View the Route Statistics Report .............................................................................................................................. 44
View the Route Time Parameters Report ................................................................................................................. 44

Oracle Field Service CloudConfiguring and Using Reports
3 Routes and Activities Reports 41View the Routing Report .......................................................................................................................................... 45
View Scheduled Reports .......................................................................................................................................... 46
View the Configuration History Report ...................................................................................................................... 47
4 Oracle Field Service Cloud Communication and Post Activity SurveyReports
51
About communication and Post Activity Survey reports ........................................................................................... 51
View the Average Number of Calls Per Customer .................................................................................................... 51
View the Percent of Accurate Last Messages Report ............................................................................................... 52
View the Percent of Contacted Customers Report ................................................................................................... 52
View the Last Message Window Size Report ........................................................................................................... 53
View the Transferred Calls Report ............................................................................................................................ 53
Generate Post Activity Survey (PAS) Reports ........................................................................................................... 53
View the Messages Report ...................................................................................................................................... 54
5 Statistical/Administrative Reports 57About Statistical and Administrative Reports ............................................................................................................ 57
Export a Report ....................................................................................................................................................... 57
Notes On Time Calculations ..................................................................................................................................... 57
View the Average Travel Time Report ...................................................................................................................... 58
View the File Storage Usage Report ........................................................................................................................ 59
View the GPS Alerts Per Resource Report ............................................................................................................... 60
View the Inventories Report ..................................................................................................................................... 61
View the Inactive Users Report ................................................................................................................................ 62
View the Number of Active Users ............................................................................................................................ 62
View the Travel Statistics Report .............................................................................................................................. 63
View the Work Order Statistics Report ..................................................................................................................... 63
View the Work Statistics Report ............................................................................................................................... 65
6 Troubleshooting Reports 67Report Words and Header Translations ................................................................................................................... 67
Time-Out Messages ................................................................................................................................................. 67

Oracle Field Service CloudConfiguring and Using Reports
Preface
Preface
This preface introduces information sources that can help you use the application and this guide.
Using Oracle Applications
To find guides for Oracle Applications, go to the Oracle Help Center.
Documentation Accessibility
For information about Oracle's commitment to accessibility, visit the Oracle Accessibility Program website.
Videos included in this guide are provided as a media alternative for text-based topics also available in this guide.
Contacting Oracle
Access to Oracle SupportOracle customers that have purchased support have access to electronic support through My Oracle Support. Forinformation, visit My Oracle Support or visit Accessible Oracle Support if you are hearing impaired.
Comments and SuggestionsPlease give us feedback about Oracle Applications Help and guides. Please take one of the following surveys:
• For web-based user guide, Web-based User Guide Survey
• For tutorial feedback, Tutorial Survey
i

Oracle Field Service CloudConfiguring and Using Reports
Preface
ii

Oracle Field Service CloudConfiguring and Using Reports
Chapter 1Overview of Dashboard and Reports
1 Overview of Dashboard and Reports
Dashboard
About DashboardThe Dashboard is a handy tool allowing to view the company reports in a clear graphical representation. It shows real-timereports (e.g. technicians productivity by work type, comparison between resources by number of work orders, etc.) in theform of charts. .
The Dashboard is available in the Core Manage Application under the Dashboard menu item (typically found under Dispatch> Dashboards. When the user first accesses the Dashboard, no reports are configured. The screen is empty with theDashboard configuration menu in the bottom. You can use the configuration menu to add a Dashboard chart to yourpersonal Dashboard quickly and easily.
PrerequisitesYou must have a user name and password to log in to the web interface. If you do not know your user name or password,contact your system administrator.
Set permissions to access Dashboard and ReportsYou can choose to display or hide the reports in the Dashboard or Reports menu.
• Configuring Dashboards—Access to the Dashboard functionality is controlled by User Types. You can setpermissions to use Dashboard by opening the User Types screen. See Grant Permissions to View the Dashboardon page 1 for more details.
• Configuring Reports—Access to the Reports functionality is controlled by User Types. You can set permissions toview Reports by opening the User Types screen. See Grant Permissions to View Reports on page 9 formore details.
Grant Permissions to View the DashboardAccess to the Dashboard functionality is controlled by permissions.
1. Click Configuration .2. In the Configuration page, click User Types.
The User Types screen appears.
3. Select a user type and then select Screen Configuration tab.
This figure shows the Screen Configuration tab options in the User Types screen. Selecting a screen displays the listof available permissions for that screen.
1

Oracle Field Service CloudConfiguring and Using Reports
Chapter 1Overview of Dashboard and Reports
4. Click Dashboard to open the Dashboard Permissions screen.5. To select the dashboard reports with default permissions, click the Click to Add button.6. In the Add Action dialog, click the check boxes next to the dashboard reports and click OK.7. Click the profile under the Actions column to add each profile.
This figure shows the Dashboard report permissions screen with the access modes available for use.
8. Select a profile and click the Modify link. Select the access mode you want to use for the profile selected and clickSave.
2

Oracle Field Service CloudConfiguring and Using Reports
Chapter 1Overview of Dashboard and Reports
Note: If the Modify dialog displays Read-only access, you cannot specify any conditions to validateaccess to the report.
9. Click Close.
View Dashboard DetailsDashboard reports are not configured the first time you access the application.
If you are accessing for the first time, your dashboard screen is empty, displaying the ‘Use drag and drop to create reports'message with the Configuration menu in the bottom.
The configuration menu is a horizontal bar with icons representing the available reports. Each icon consists of a graphicalimage of the chart corresponding to the report and the report name. A hint appears when you hover on the icon to display thetype of data presented in the report.
Drag the icon from the Configuration menu and drop it. The Dashboard displays the details of the report accordingly.
Click any slice in a pie chart or bar in a bar graph to view the details in the dashboard as follows:
This figure shows the Resources by statuses dashboard window with details about a slice representing Active Route selectedin the pie chart.
To close the dashboard window, click the “X” in the top right-hand corner.
Add Dashboard ChartsDashboard charts graphically represent the status of resources and help you to track the activities of resources. You can adddashboard charts to your personal Dashboard using the configuration menu.
The configuration menu is a horizontal bar with icons that represent the reports that are available to you. You can configureyour Dashboard to view the charts that interest you most.
1. Click Dashboard to open the Dashboard.2. Click Configure Dashboard.
3

Oracle Field Service CloudConfiguring and Using Reports
Chapter 1Overview of Dashboard and Reports
The Dashboard configuration menu displays a selection of reports at the bottom of the work area.
This figure shows the configuration menu as a horizontal bar with icons representing dashboard charts.
Each icon consists of the graphical image of the chart corresponding to the report and the report name.
3. Hover your mouse over any icon.
A hint appears describing briefly the type of data presented in the report.
4. Select the item from the Resource Tree whose report you want to view.5. Drag the appropriate report icon to your work area.
A chart is automatically created based on the Resource or Bucket selected in the resource tree.
6. Repeat the above steps to add more reports to the Dashboard screen.
If the user quits the Dashboard after creating the charts, the layout of the charts is saved and displayed the next timethe user accesses the Dashboard.
7. Click Configure Dashboard button to hide the Dashboard configuration menu.
Note: You cannot hide the Dashboard configuration menu when the Dashboard screen is empty.
All charts currently configured in the Dashboard show data for the resource that is currently selected in the resourcetree. Whenever you select a different resource, all charts are updated with the data related to the new resourceimmediately. It is not necessary to configure the whole set of charts for each resource.
Navigate the DashboardUse the navigation icons in the screen to navigate the Dashboard.
1. Hover your cursor over the title of any dashboard and a set of icons will display in the upper right corner of yourscreen.
2. Click the Options icon to display the options for the Dashboard.
The Options icon allows you to set options for this Dashboard so that when you open it, the Dashboard displaysrefreshed statistics for the resource, organization, or bucket on which it is currently based.
This figure shows the Dashboard Options panel with Always show report for resource check box, Date drop-downlist.
4

Oracle Field Service CloudConfiguring and Using Reports
Chapter 1Overview of Dashboard and Reports
3. Optionally, set values for the following fields.a. Click Always show report for check box to ensure that the most current chart data displays whenever you
open the Dashboard.b. Select a date from the drop-down list.
By default, the chart displays statistics for the current day.
c. Click Save.
This chart will always display in your Dashboard for this resource or bucket or organization, regardless of the entityyou selected in the resource tree.
4. Click the Minimize icon to hide the chart from view.
See Manage the Charts on page 5 for details about minimizing charts.
5. Click the Close icon to close the Dashboard.
Manage the ChartsYou can modify the display of a chart by modifying the chart properties such as minimizing, restoring, configuring anddeleting.
MinimizingFollow these steps to use the icons on the Dashboard reports.
1. Click the minimize icon.
The chart setting window collapses into a single title bar with two icons – maximize and 'remove.2. Click the Minimize icon to hide the chart from view.
A minimized Dashboard floats to the top of your screen, where it appears with other minimized dashboards.
This figure shows how minimized dashboards appear in the Dashboard screen.
5

Oracle Field Service CloudConfiguring and Using Reports
Chapter 1Overview of Dashboard and Reports
3. Click the maximize icon. to restore the chart to its original size.4. Click the Close icon on the title bar to remove the chart from the Dashboard.
ResizingThe size of a chart displayed on the Dashboard screen can be increased or decreased according to the user's preferences.
Follow these steps to resize the chart on the Dashboard screen.
1. Locate the resizing tool in the bottom right corner.2. Drag the corner of the chart window to resize the chart as necessary.3. The chart content (diagrams and legend) is resized accordingly.
Animated HighlightingDiscusses the animation actions that occur when data is highlighted in charts.
All reports (except Gauge) have legends describing the data shown in the charts.
When the mouse hovers over a legend item, the corresponding section of the chart is highlighted. The same effect occurswhen the mouse hovers over the chart itself.
If a chart legend item is clicked, the corresponding chart section remains highlighted even when the mouse is removed. Thisgives the user a clearer view of the data shown on the chart.
To remove the highlighting, the user has to click the same legend item again or click a different item to have it highlightedinstead.
Chart HintsA set of hints displayed to assist the user working on charts. All charts (except Gauge) have hints containing the details of thedata used in the chart. The hints appear when the mouse is hovered over the chart sections. Depending on the type of thechart and the type of the report, the hint content may vary.
6

Oracle Field Service CloudConfiguring and Using Reports
Chapter 1Overview of Dashboard and Reports
This figure shows the dashboard window for Resource by statuses report. The dashboard window displays a pie chart withchart hints for a selected slice.
In pie charts, the hints contain the description of the data to which the selected 'slice' corresponds, the absolute value of theslice and its percentage value.
In column charts, the hints contain the description of the data to which the selected column corresponds and its absolutevalue.
This figure shows the dashboard window for Mean time to deliver report. The dashboard window displays a column chartwith chart hints for a selected resource.
Dashboard Calendar
Selecting a date opens a calendar showing the three-month period around the selected date.
Depending on the report type, the chart displays data for a certain date or for a date range. In any case, the data displayedin the chart is related to a date selected by the user. Initially, the charts are created for today's date which can be changed ifnecessary. The date is displayed in the calendar window which has a left and right arrow to switch the currently selected dateone day earlier or later.
7

Oracle Field Service CloudConfiguring and Using Reports
Chapter 1Overview of Dashboard and Reports
Clicking the calendar window opens the calendar for a three-month period with the currently selected month in the middle.
A different date can be selected by clicking it in the calendar. The left and right arrows shift the calendar one month earlieror later. When the date is clicked, the calendar is hidden and all charts in the screen are immediately updated with the datacorresponding to the selected date.
Refresh the ReportsYou can refresh a report either automatically or manually. This task discusses how to manually refresh reports.
Automatic refreshing of reports:Each report has its own auto-reloading interval, after which it is recalculated and redrawn. For example, some reportsrefresh automatically after 10 minutes and some after one hour. At the same time, the general reloading timer that affects allapplication windows affects the Dashboard page. This setting is found in the My Display settings.
Note: Short refresh intervals may slow down the system. The recommended refresh interval is 5 minutes orlonger.
Manual Refreshing
A report is refreshed when:
• the browser window is refreshed
• a different resource is selected in the resource tree (if the report is not set to display data for a single resource only)
• the report settings are changed
• the date is changed in the calendar
• the user starts the application in another browser tab and returns to the tab where the Dashboard is open
Only those reports that have new data are refreshed after one of these actions.
Follow these steps to refresh the tables manually.
1. Click Refresh in the report.2. Choose another bucket/resource in the Resource Tree (if report is not fixed for a certain resource/bucket).3. Change the fixed resource (if the resource was fixed).4. Change report settings.5. Change the report date.6. Open the application in another browser tab, and return to the Dashboard.
Reports
About Standard ReportsYou can display a report by clicking the and directly selecting the name/title of the report from the navigation pane.
PrerequisitesYou must have a user name and password to log in to Oracle Field Service Cloud Core Manage Service. If you do not knowyour user name or password, contact your system administrator.
8

Oracle Field Service CloudConfiguring and Using Reports
Chapter 1Overview of Dashboard and Reports
You can view the following categories of standard reports:
• Routes and activities reports
• Oracle Field Service Cloud communication and post activity survey reports
• Statistical and administrative reports
Note: Report column names are available only in English and cannot be modified.
Grant Permissions to View ReportsAccess to the Reports functionality is controlled by permissions.
1. Click Configuration .2. In the Configuration page, click User Types.
The User Types screen appears.
3. Select a user type and then select Screen Configuration tab.4. Click Main Menu Items to open the Permissions screen for commands displayed on the main menu.5. To select the reports with default permissions, click the Click to Add button.6. In the Add Action dialog, click the check boxes next to each report to add it and click OK.7. Click the profile under the Actions column to add each profile.8. Select a profile and click the Modify link. Select the access mode you want to use for the profile selected and click
Save.
Note: If the Modify dialog displays Read-only access, you cannot specify any conditions to validateaccess to the report.
9. Click Close.
Create ReportsAll the dashboard reports show the data related to the performance of a resource. Therefore, any report and thecorresponding chart must be associated with a resource.
The Dashboard screen has a resource tree similar to other screens. The resource tree shows the hierarchical structure of allresources in the company with the root resource on top. When the Dashboard screen is first opened, the root resource isselected automatically. This step must be performed to associate the report to any resource other than the root resource.
1. Click Dispatch.2. Select Dashboard from the drop-down menu to open your Dashboard.
The Dashboard screen appears with a resource tree.
Note: The resource tree shows the hierarchical structure of all resources in the company with the rootresource on the top.
3. Select a resource from the resource tree.4. Drag a report icon from the configuration menu and drop it in the Dashboard screen.
9

Oracle Field Service CloudConfiguring and Using Reports
Chapter 1Overview of Dashboard and Reports
The corresponding chart appears in the Dashboard screen.
5. To display the chart, click theShow icon.
This figure shows the Show icon used to display a chart.
.6. To hide the chart, click the Hide icon.
This figure shows the Hide icon used to hide a chart.
Note: The charts are saved automatically when you quit the dashboard and displays on the screen whenyou access the dashboard again.
7. Click Configure dashboard.
The Dashboard configuration menu is closed.
Note: You cannot hide the configuration menu if the Dashboard is empty without any charts.
The chart configured for the selected resource in the resource tree is displayed on the dashboard screen. If youselect another resource, the charts are updated with the resource’s data.
10

Oracle Field Service CloudConfiguring and Using Reports
Chapter 2Dashboard Reports
2 Dashboard Reports
Completion Progress ReportThe Completion progress by volume report shows the number of activities completed per hour for a selected date incomparison with the average number of activities completed in the previous week and previous month. Only the regular andreopen activities are considered to generate this report.
The completion progress dashboard report is displayed to the following user categories:
• buckets/organizations
• individual resources
1. Click Dashboard to open the Dashboard.2. Select the Completion progress by volume chart
The title bar of the chart displays a set of icons.
3. Click the Options icon to display the options for the chart.
See Navigate the Dashboard on page 4 for more details.
4. Select the following Date options from the drop-down list:
◦ Selected Day– Reports for the day selected in the calendar
◦ Day before selected – Reports for the day before the day selected in the calendar
The Completion progress by volume chart refreshes to display the data based on your selection.
Activities By Capacity Categories ReportThe Activities by Capacity Categories report displays the total number of completed activities by capacity categories onselected month per day. Teamwork and pre-work are not taken into account.
The Activities by Capacity categories Dashboard report is displayed for:
• buckets/organizations
• individual resources
Note: Teamwork is not displayed in the Dashboard. This has to be taken into account when monitoring theperformance of resources having a lot of teamwork activities in their routes.
The Activities by Capacity Categories report is represented with a column chart.
This figure shows the Activities by Capacity Categories report in a column chart, with number of activities and date. Activitiessuch as Deinstall, Install, Upgrade, and Trouble call are represented in the chart date-wise.
11

Oracle Field Service CloudConfiguring and Using Reports
Chapter 2Dashboard Reports
The chart options allow you to select a month or the month before it and the chart will display the data for the correspondingperiod. When any date is selected in the calendar, the chart will display data for the period from the 1st of the month till thelast date of the same month.
The details of the Activities by Capacity Categories report are provided in the following table:
Element Description
Header Report name and the reported period in parentheses
Columns Each column represents the whole number of completed activities per day. Columns may consistof several sections marked by different colors � each color matches a certain capacity category(described in the chart legend). Apart from differentiating the categories in colors, you can view themas text.
Note: If there are no work skills in the system, the report will show the whole number ofactivities.
Legend Capacity categories containing the activities performed by:• the selected individual resource (if an individual resource is selected in the Resource Tree), or
• all resources in the selected bucket/organization (if a bucket or organization is selected) If theselected resource performs only some of the capacity categories existing in the system, thecolumns and the legend will contain only the capacity categories performed by the resource.
Axes Horizontal: date vertical: number of activities
Hint Date, name of the Capacity Category and the number of activities performed by the resources insuch Capacity Category
12

Oracle Field Service CloudConfiguring and Using Reports
Chapter 2Dashboard Reports
View the Capacity By Category ReportThe Capacity by category report shows the expected duration in minutes and the quota (amount of work performed) for aspecific work type and time slot. You can view this report only when selecting a quota enabled bucket.
1. Click Dashboard to open the Dashboard.2. Select a quota enabled bucket.3. Select the Capacity by category chart from the Dashboard.
The title bar of the chart displays a set of icons.
4. Click the Options icon to display the options for the chart.
See Navigate the Dashboard on page 4 for more details.
5. Select the following Date options from the drop-down list:
◦ Selected Day– Reports for the day selected in the calendar
◦ Day before selected – Reports for the day before the day selected in the calendar
6. Select the following Capacity category type from the drop-down list:
◦ Any Capacity Category– Average values for all work types will be calculated
◦ Specific Capacity Category– Values for any specific work type that applies to this Resource will becalculated
7. Do one of the followinga. In the Time slots field, select a time-slot option from the drop-down list:
- All– Average values for all time slots will be calculated- Specific time slot– Values for any specific time slot can be calculated
b. In the Booking intervals field, select an option from the drop-down list.8. Modify the following values, if necessary
◦ Major Capacity Usage
◦ Critical Capacity Usage
This figure shows the Capacity by category report that appears as a gauge.
13

Oracle Field Service CloudConfiguring and Using Reports
Chapter 2Dashboard Reports
The gauge shows in minutes the anticipated total activity duration (based on work orders) and the amount of quotaassigned for each specific time slot and work type:
◦ The gauge is set up with 0 in the lower left quadrant.
◦ The hand of the gauge sweeps from left (0) to right as capacity is used, pointing to the current amount ofcapacity that has been consumed.
◦ The higher value is determined automatically by multiplying Capacity and 1.3 shown in the lower rightquadrant.
◦ The space between capacity and the higher value represents the point at which the number of work orders forthat work type has exceeded quota. If the hand moves into this area (as a result of those additional minutesbeing consumed) the area will be highlighted in red. Apart from differentiating the capacity change in colors,you can also view the capacity value as text.
9. The minute hand in the Capacity by category report changes with higher capacity.
Consider an example where the gauge shows the following information:
• Time Slot is 8-10.
• Date is 06/18/09.
• Capacity (based on available resources and their calendars) is 1100 minutes and is shown as a tic mark highlightedin yellow at the outer edge. Apart from highlighting the capacity in yellow color, the capacity is also shown as text inthe center of the gauge.
The hand points to the current capacity that has been consumed (415 minutes). The current capacity value is also shown atthe bottom of the gauge.
Average Productivity By Activity ReportThe Average Productivity by Activity report displays the average number of activities by each activity type per day for selectedresource(s) and month. The report does not consider teamwork and pre-work.
If there are no activity types in the system, the report will show the whole number of activities. The report is calculated bygrouping the number of activities of each type and dividing the resulting sums by the number of working resources. This isdone for each day of a month. For example, if 20 upgrades were performed, and 4 resources worked, the average will be 5upgrades per resource. The 'Average productivity by activity type' Dashboard report can be displayed for:
• buckets/organizations
• individual resources
Note: Teamwork is not displayed in the Dashboard. This has to be taken into account when monitoring theperformance of resources having a lot of teamwork activities in their routes.
The Average Productivity by Activity report is represented with a column chart.
This figure shows the Average Productivity by Activity column chart with average activities and date.
14

Oracle Field Service CloudConfiguring and Using Reports
Chapter 2Dashboard Reports
The Average Productivity by Activity column chart includes the following elements:
Element Description
Header Displays the report name and the reported period in parentheses
Columns The average number of completed activities of each type. The chart contains as many different colorcolumns as there are activity types in the legend.
Legend Activities performed by:• the selected individual resource (if an individual resource is selected in the Resource Tree), or
• all resources in the selected bucket/organization (if a bucket or organization is selected) If theselected resource performs only some of the activity types existing in the system, the chartand the legend will contain only the activity types performed by the resource.
Axes horizontal: datevertical: average activities
Hint Date, activity type and the average number of activities of the particular type performed by theresource
15

Oracle Field Service CloudConfiguring and Using Reports
Chapter 2Dashboard Reports
Average Productivity By Work Type ReportThe Average productivity by work type report displays the average number of activities per day for the month by worktype.
This report has the following characteristics:
• It refreshes automatically every hour
• Selecting a set of resources enables you to view the organization
• Selecting an individual resource enables you to view only that resource’s productivity
• The average is calculated as the total number of work orders of the selected type divided by the average number ofworking resources
• The report does not include teamwork, non-customer activities, or pre-work
1. Open the Average productivity by activity type report.2. Select the following month options from the drop-down list:
◦ Selected – Reports for the month selected in the calendar
◦ Before selected – Reports for the month before the one selected in the calendar
The horizontal axis shows the days of the month; the vertical shows the average number of activities. The ranges representthe average number of completed activities of each type on that day. The colors in a range match the work types described inthe chart. Apart from differentiating the work types in colors, you can also view them as text in the chart hints.
This figure shows the Average productivity by work type report displaying the average productivity for each day.
16

Oracle Field Service CloudConfiguring and Using Reports
Chapter 2Dashboard Reports
Resources By Statuses ReportThe Resources by Statuses report shows status of activities such as percentage of non-working day, not activated route andactive route for a selected date in the calendar.
The chart options allows you to select a date from the calendar. The number of resources by statuses for the selected date.The Resources by Statuses report is represented with a column chart.
The Resources by Statuses report includes the following elements:
Element Description
Header Displays the report name and date.
Columns The chart displays all the resources in the selected bucket or organization for the specified date. Each slice represents the percentage of the route status in the whole number.
Legend The following statuses are available:
• Non Working Day
• Non Activated Route
• Non Activated in Time
• Activate Route
• Deactivated Route
If resources of the selected bucket or organization have routes of only some of the statuses, theslices and the legend will contain only such statuses.
Hint Each activity displays a hint with route status, number of resource routes of such status in thebucket or organization and their percentage share in the whole number of resources.
View the Resources By Statuses ReportThe Resources by statuses report shows at a glance the proportion of resources that have activated their routes comparedto those who did not activate in time and those who are not working today.
This report has the following characteristics:
• It depicts the number of resources for each status for the date that you select
• You can run it for any bucket or organization
• If you select an individual resource in the Resource Tree, the chart will be configured for the parent bucket
• It refreshes automatically every 10 minutes
1. Click Dashboard to open the Dashboard.2. Select the Resources by statuses chart.
17

Oracle Field Service CloudConfiguring and Using Reports
Chapter 2Dashboard Reports
The title bar of the chart displays a set of icons.
3. Click the Options icon to display the options for the chart.
See Navigate the Dashboard on page 4 for more details.
4. Select one of the following date options from the drop-down list:
◦ Selected day– Reports for the day selected in the calendar
◦ Day Before selected – Reports for the day before the one selected in the calendar
The whole pie chart represents the total number of resources in a bucket or organization. The status of eachresource can be represented by a "slice."
This figure shows the Resources by statuses as a pie chart displaying the number of resources in a bucket.
5. The report shows the number of resources for the following statuses:
◦ Non Working Day – The resource is not scheduled to work on this day
◦ Not Activated Day – The resource has not activated his/her queue (route) for the day
◦ Not Activated in Time – The resource activated the route outside the required activation time set by theclient. For example, if the client decides all resources must activate no later than 15 minutes after the shift starttime, then anyone outside of that time did not activate on time.
◦ Active Queue – The resource has activated his or her route for the day
◦ Deactivated Queue – The resource has deactivated his or her route for the day
Comparing Resources by Number of Activities ReportThe Comparing resources by number of activities report shows the number of activities completed by each resourceof a bucket/organization for the selected month. Activities collaborated with teamwork and pre-work are not considered forgenerating this report.
The chart options allows you to choose a month to display the data for the corresponding period. You can filter the displaydata by an activity type group or activity type represented in the list of activities in the selected bucket or organization. Youcan also define the number of resources and the number of activities to display on the chart. You can select from 20, 40, 50or all resources. The Comparing resources by number of activities is represented with a column chart.
18

Oracle Field Service CloudConfiguring and Using Reports
Chapter 2Dashboard Reports
This figure shows the Comparing resources by number of activities report as a column chart with number of activities for eachresource.
The Comparing resources by number of activities report includes the following elements:
Element Description
Header Displays the report name, the reported period and the number of resources in the header.
Columns Each column represents the number of activities of each type completed by a resource duringthe specified month. The chart columns contains several sections marked with different colorsrepresenting various types of activities. Apart from differentiating the activity types in colors, you canalso view them as chart hints.
Legend Denotes the type of activity performed by the resources in the selected bucket/organization. If theresources in the selected bucket/organization perform only some of the activity types existing in thesystem, the columns and the legend displays only the activities performed.
Axes horizontal: Resources vertical: Number of activities
Hint Each activity displays a hint pop-up with Resource name, activity type and the number of activitiesof such type.
19

Oracle Field Service CloudConfiguring and Using Reports
Chapter 2Dashboard Reports
View the Comparing Resources By Number of Activities ReportThe Comparing resources by number of activities report displays the number of completed activities for each work skillby resource and by job type or all direct children of a chosen bucket/aggregator for the selected month.
This report has the following characteristics:
• You can run it for buckets/aggregators. If you select an individual resource in the Resource Tree, the report will beconfigured for the parent bucket/aggregator.
• It refreshes automatically every hour
• The report does not include teamwork, non-customer activities, or pre-work
1. Click Dashboard to open the Dashboard.2. Select the Comparing resources by number of activities chart
The title bar of the chart displays a set of icons.
3. Click the Options icon to display the options for the chart.
See Navigate the Dashboard on page 4 for more details.
4. Select the following Month options from the drop-down list:
◦ Selected– Reports for the month selected in the calendar
◦ Before selected – Reports for the month before the one selected in the calendar
The horizontal axis lists individual resources by name; the vertical axis shows average activities. Each columnrepresents the number of work orders completed by one resource during the month. The colors correspond to thework skills defined in the legend. Apart from differentiating the work skills in colors, you can also view them as text inthe chart hints.
This figure shows the Comparing resources by number of activities report as a column chart. The columns representthe number of activities for each resource.
20

Oracle Field Service CloudConfiguring and Using Reports
Chapter 2Dashboard Reports
Comparing Resources By Productivity ReportThe Comparing Resources by Productivity report shows the average number of activities completed for an activity typeper resource per day for all the resources in a bucket/organization. Activities collaborated based on the teamwork and pre-work are not considered for generating this report.
The chart options allows you to choose a month to display the data for the corresponding period. You can filter the displaydata by activity type group or activity type represented in the list of activities in the selected bucket or organization. You canalso define the number of resources and the number of activities to display on the chart. You can select from 20, 40, 50 or allresources. The Comparing Resources by Productivity report is represented with a column chart.
This figure shows the dashboard window for Comparing Resources by Productivity column chart displaying average activitiesfor each resource.
The Comparing Resources by Productivity report includes the following elements:
Element Description
Header Displays the report name, the reported period and the number of resources in the header.
Columns Each column represents the average number of activities for each activity type completed by aresource during the specified month. The chart columns contains several sections marked withdifferent colors representing various types of activities.
Legend Denotes the type of activities performed by the resources in the selected bucket/organization. If theresources in the selected bucket/organization perform only some of the activity types existing in thesystem, the columns and the legend displays only the activities performed.
Axes • horizontal: Resources
• vertical: Average activities
Hint Each activity displays a hint pop-up with Resource name, activity type and the number of activitiesfor each activity type.
21

Oracle Field Service CloudConfiguring and Using Reports
Chapter 2Dashboard Reports
View the Comparing Resources Productivity ReportThe Comparing resources productivity report displays the average number of completed work orders by work skill perresource/day. The report calculates data for all direct children of a chosen bucket/aggregator.
Productivity is calculated as the total number of work orders completed by a resource during the month divided by thenumber of working days. This chart is often used along with the Comparing resources by number of activities report.
This report has the following characteristics:
• You can run it for buckets/aggregators. If you select an individual resource in the Resource Tree, the report will beconfigured for the parent bucket/aggregator.
• It refreshes automatically every hour
• The report does not include teamwork, non-customer activities, or pre-work
1. Click Dashboard to open the Dashboard.2. Select the Comparing resources productivity chart.
The title bar of the chart displays a set of icons.
3. Click the Options icon to display the options for the chart.
See Navigate the Dashboard on page 4 for more details.
4. Select the following Month options from the drop-down list:
◦ Selected– Reports for the month selected in the calendar
◦ Before selected – Reports for the month before the one selected in the calendar
The horizontal axis lists individual resources by name; the vertical axis represents the number of work orders. Eachcolumn represents the number of work orders completed by one resource during the month. The colors correspondto the work types defined in the legend. Apart from differentiating the work types in colors, you can also view themas text in the chart hints.
22

Oracle Field Service CloudConfiguring and Using Reports
Chapter 2Dashboard Reports
Auto-Routing Results Dashboard ChartThe Auto-Routing Results chart displays the number of auto-routed, manually routed, and not-routed activities in theselected bucket on the selected day.
This report has the following characteristics:
• You can run this report for buckets or organizations. If you select an individual resource or organization in theResource Tree, the report will be configured for the parent bucket.
• It displays the share or auto-routed, manually routed or not-routed activities as a percentage of the whole number ofactivities in the selected bucket, which is assumed to be 100%. Breaks are not included.
• If you have not run Routing, the report shows the message, 'No Data'.
• The report calculates data for all child resources of the selected bucket (not only direct child resources but also theirchild resources, and so on).
The Auto-Routing Results report is represented with a pie chart.
This figure shows the Auto-routing results dashboard report that calculates data for all child resources of a selected bucket.
1. Click Dashboard to open the Dashboard.2. Select the Auto-Routing Results Dashboard report.
The title bar of the report displays a set of icons.
3. Click the Options icon to display the options for the chart.
See Navigate the Dashboard on page 4 for more details.
4. Select an activity type group from the drop-down list.5. Select the following Date options from the drop-down list:
◦ Selected day–Reports for the day selected in the calendar
23

Oracle Field Service CloudConfiguring and Using Reports
Chapter 2Dashboard Reports
◦ Day before selected–Reports for the day before the one selected in the calendar
6. Click Save.
Routing Errors Reasons ReportThe Routing Errors Reasons report displays the reasons for Not-routed activities by activity type for a selected date. Only theplanned activities are considered for creating this report.
The chart options allow you to select a date from the calendar. You can also filter the display data by the activity type groupfor a selected bucket. The Routing errors reasons report is represented with a pie chart.
The Routing errors reasons report includes the following elements:
Element Description
Header Displays the report name and date.
Columns The chart represents all the not-routed activities in the selected bucket on a specified day and isassumed to be 100%. Each slice represents the percentage share of the activities not-routed for a specific routing errorreason. The chart may contain as many slices as there are routing error reasons.
Legend Type of data represented by the chart:• Routing error reasons.
• The slices and the legend contain only the routing error reasons used in the selected bucketrouting results.
Hint Each activity displays a hint pop-up with Routing error reason, number of activities not routed forthat reason and percentage share.
View the Routing Errors Reasons ReportThe Routing errors reasons report shows the number of work orders that were not analyzed or processed by Oracle FieldService Cloud Routing and the reasons why such work orders could not be routed.
This report has the following characteristics:
• You can run the report for buckets/aggregators. If you select an individual resource in the Resource Tree, the chartwill be configured for the parent bucket/aggregator.
• The report refreshes automatically every hour.
1. Click Dashboard to open the Dashboard.2. Select the Routing errors reasons report.3. Click the Options icon to display the options for the chart.
See Navigate the Dashboard on page 4 for more details.
24

Oracle Field Service CloudConfiguring and Using Reports
Chapter 2Dashboard Reports
4. Select the following date options from the drop-down list:
◦ Selected – Reports for the day selected in the calendar
◦ Before selected – Reports for the day before the one selected in the calendar
5. Optionally, filter the chart by selecting a work-type option from the drop-down list.
The pie chart represents the total number of work orders to be routed; the color of the "slices" indicate the reasonwhy the work orders could not be routed: Work Zone errors, Work Skill errors, and other reasons such as missingaddress. Apart from differentiating the slices in colors, you can also view the details of the slice as text in the charthints.
This figure shows the Routing errors reasons report displaying the number of work orders that were not analyzed orprocessed.
Mean Time to Deliver ReportThe Mean Time to Deliver report shows the average time the activity is created, (re)assigned to a resource, and the time theactivity is started by a resource. The report includes all the resources of a bucket/organization. Activities collaborated withteamwork and pre-work are not considered for generating this report.
The chart options lets you to choose a month and add a filter to display data for a particular activity type group. You can alsosetup the chart to show data for a particular capacity category assigned to the selected bucket or organization and definethe number of resources whose activities is to be shown on the chart. you can select from 20, 40, 50 or all resources. TheMean time to deliver dashboard report is accessible only in the buckets/organizations. If an individual resource is selectedin the resource tree, the report is configured for the entire parent bucket or organization. The Mean time to deliver report isrepresented with a column chart.
This figure shows the Mean time to deliver column chart displaying the mean time for each resource.
25

Oracle Field Service CloudConfiguring and Using Reports
Chapter 2Dashboard Reports
The Mean time to deliver report includes the following elements:
Element Description
Header Displays the report name, the reported period and the number of resources is displayed in theheader.
Columns Each column shows the time elapsed from the activity creation to its assigning, and from assigningto start. Each column consists of two colors representing time from activity creation to assignment(blue color) and time from activity assignment to start (red color)
Legend From assigning to start, From creating to assigning
Axes horizontal: Resources vertical: Time (in days)
Hint Each activity displays a hint pop-up with resource name, description of time corresponding to theselected column part and the time in days, hours and minutes.
View the Mean Time to Deliver ReportThe Mean time to deliver report displays the average time it takes to assign a work order to a resource, or reassigned toanother resource, and from the moment it is assigned until it is started by the resource. The report calculates data for alldirect children of the chosen bucket/aggregator. If an individual resource is selected from the Resource Tree, the report willbe configured for the parent bucket/aggregator of that resource.
This report has the following characteristics:
• You can run it for buckets/aggregators. If you select an individual resource in the Resource Tree, the chart will beconfigured for the parent bucket/aggregator.
26
Oracle Field Service CloudConfiguring and Using Reports
Chapter 2Dashboard Reports
• It refreshes automatically every hour
• The report does not include teamwork, non-customer activities, non-ordered activities, or pre-work
1. Click Dashboard to open the Dashboard.2. Select the Mean time to deliver report.3. Click the Options icon to display the options for the chart.
See Navigate the Dashboard on page 4 for more details.
4. Select the following month options from the drop-down list:
◦ Selected – Reports for the month selected in the calendar
◦ Before selected – Reports for the month before the one selected in the calendar
5. Select a capacity category from the drop-down list, for example IN - Install.6. Select an Activity Type Group from the drop-down list.
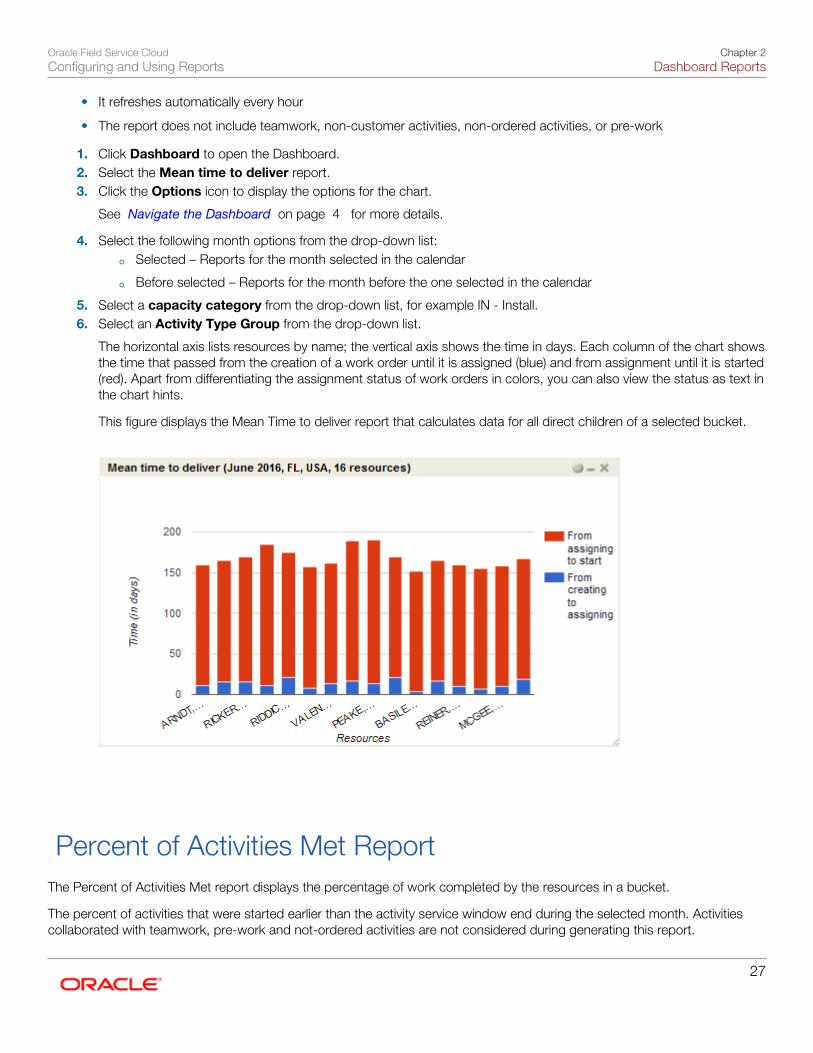
The horizontal axis lists resources by name; the vertical axis shows the time in days. Each column of the chart showsthe time that passed from the creation of a work order until it is assigned (blue) and from assignment until it is started(red). Apart from differentiating the assignment status of work orders in colors, you can also view the status as text inthe chart hints.
This figure displays the Mean Time to deliver report that calculates data for all direct children of a selected bucket.
Percent of Activities Met ReportThe Percent of Activities Met report displays the percentage of work completed by the resources in a bucket.
The percent of activities that were started earlier than the activity service window end during the selected month. Activitiescollaborated with teamwork, pre-work and not-ordered activities are not considered during generating this report.
27

Oracle Field Service CloudConfiguring and Using Reports
Chapter 2Dashboard Reports
The Percent of Activities Met report is denoted with a column chart and includes the following elements:
Element Description
Header Displays the report name, reported period and the number of resources whose data is displayed onthe chart.
Columns Denotes the percentage of activities started by each resource before the service window end.
Legend The chart uses only one color to display data, therefore the chart has no legend.
Axes • horizontal: Resources
• vertical: Percent of activities
Hint Resource name and the percent of activities met.
View the Percentage of Activities Met ReportThe Percentage of activities met report displays the percent of completed work orders by resource that were startedwithin the service window during a selected month.
This report has the following characteristics:
• You can run it for buckets/aggregators. If you select an individual resource in the Resource Tree, the chart will beconfigured for the parent bucket/aggregator.
• It refreshes automatically every hour
• The report does not include teamwork, non-customer activities, non-ordered activities, or pre-work
1. Click Dashboard to open the Dashboard.2. Select the Percentage of activities met chart.
The title bar of the chart displays a set of icons.
3. Click the Options icon to display the options for the chart.
See Navigate the Dashboard on page 4 for more details.
4. Select the following month options from the drop-down list:
◦ Selected– Reports for the month selected in the calendar
◦ Before selected – Reports for the month before the one selected in the calendar
The horizontal axis lists individual resources by name; the vertical axis shows the percentage of work orderscompleted within the service window. Each column represents the work of one resource.
This figure shows the Percentage of activities met chart displaying the percent of completed work orders by aresource.
28

Oracle Field Service CloudConfiguring and Using Reports
Chapter 2Dashboard Reports
Percent of Customer Expectations Met ReportThe Percent of Customer Expectations Met report displays the number of activities started early, in time and late in a deliverywindow of a bucket/organization messaged to the customer.
The total requirement is considered as 100 percent. Only the completed and not-done activities are taken into account. If anactivity has no specified service window start and service window end data, it is not included in the report. The chart optionslets you to select a date and add filter to display the data by display data for a particular activity type group or for any activitytypes represented in the list of activities in the selected bucket or organization. When you select a date from the calendar, thechart displays data for the period from the 1st of the month till the last date of the same month.
The Percent of Customer Expectations Met report is represented with a column chart.
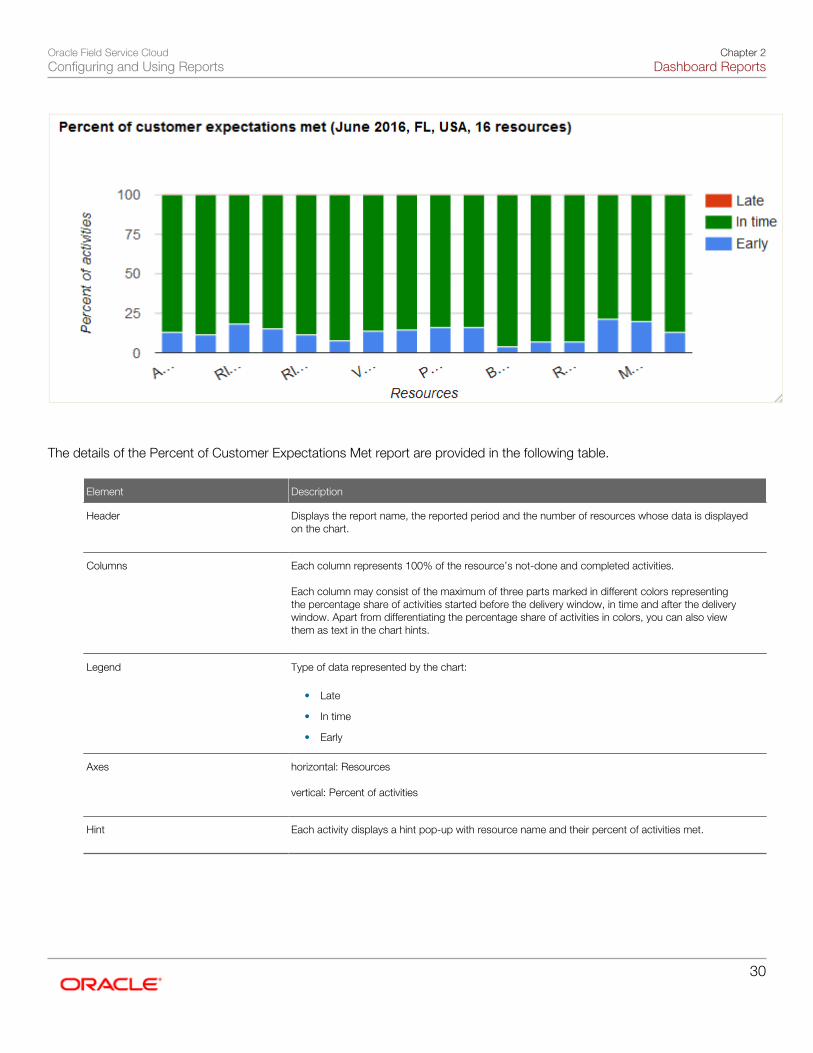
This figure shows the Percent of Customer Expectations Met column chart displaying percentage of activities assigned toresources. Late, In time and Early activities are denoted in the chart.
29
Oracle Field Service CloudConfiguring and Using Reports
Chapter 2Dashboard Reports
The details of the Percent of Customer Expectations Met report are provided in the following table.
Element Description
Header Displays the report name, the reported period and the number of resources whose data is displayedon the chart.
Columns Each column represents 100% of the resource’s not-done and completed activities. Each column may consist of the maximum of three parts marked in different colors representingthe percentage share of activities started before the delivery window, in time and after the deliverywindow. Apart from differentiating the percentage share of activities in colors, you can also viewthem as text in the chart hints.
Legend Type of data represented by the chart:
• Late
• In time
• Early
Axes horizontal: Resources vertical: Percent of activities
Hint Each activity displays a hint pop-up with resource name and their percent of activities met.
30

Oracle Field Service CloudConfiguring and Using Reports
Chapter 2Dashboard Reports
View the Percentage of Customer Expectations Met ReportThe Percentage of customer expectations met report shows the percentage of activities (without teamwork and pre-work) that were started within the service window during a selected month. The total number of work orders that werecompleted by a resource is taken as 100%.
This report has the following characteristics:
• You can run it for buckets/aggregators. If you select an individual resource in the Resource Tree, the chart will beconfigured for the parent bucket/aggregator.
• It refreshes automatically every hour
• The report does not include teamwork, non-customer activities, non-ordered activities, or pre-work
• You can enter a value from 0 to 80 to define the interval during which any work orders started are considered“started on time”. (This is also known as “allowable lateness”.)
1. Navigate the Dashboard on page 4 .2. Select the Percentage of customer expectations met chart
The title bar of the chart displays a set of icons.
3. Click the Options icon to display the options for the chart.
See Navigate the Dashboard on page 4 for more details.
4. Select an activity type group from the drop-down list.5. Select the following Month options from the drop-down list:
◦ Selected– Reports for the month selected in the calendar
◦ Before selected – Reports for the month before the one selected in the calendar
6. Provide a value to specify Allowable lateness limit.7. Select an option from the Number of resources to show drop-down list to specify the number of rows to be
displayed in the work area.
PAS Responses Per Resource ReportThe 'PAS Response per Resource report shows the PAS statistics for the question chosen per resource for the selecteddate. The data used in the report is taken from the Daily Extract 'PAS answers file'.
The chart options allows you to choose the selected date from the calendar. For the chart to display the required data, PASneeds to be selected in the corresponding field. Additionally, the chart options lets you to define the number of resourceswhose data needs to be shown in the chart. You can select from 20, 40, 50, or all resources to be displayed. The report isdenoted with a radial gauge chart.
This figure shows the PAS Response per Resource column chart showing number of answers for each technician.
31

Oracle Field Service CloudConfiguring and Using Reports
Chapter 2Dashboard Reports
The PAS Response per Resource report includes the following elements:
Element Description
Header Report name, date, resource name, number of resources.
Columns Each column shows the number of answers per individual resource. Each column may consistof up to three parts marked by different colors representing the answers received to the selectedquestion: yes, no, or no answer. Apart from differentiating the answers received in colors, you canalso view them as text in the chart hints.
Legend Answers as they are defined in the voice script:
• no
• yes
• - (no answer)
Axes • horizontal: Resources
• Vertical: Number of answers
Hint Resource name, PAS answer and number of such answers.
View the Post Activity Survey Responses Per Resource ReportThe Post Activity Survey (PAS) responses per resource report shows the responses to Post Activity Surveys for anindividual resource.
32

Oracle Field Service CloudConfiguring and Using Reports
Chapter 2Dashboard Reports
The chart can be configured to show data for all direct children of the buckets/organizations that you select. If an individualresource is selected, the chart will be configured for its parent bucket/organization. The system uses the data warehouse tocalculate the report. You must update the report manually.
1. Open the Post Activity Survey (PAS) responses per resource report.
The report shows the responses to Post Activity Surveys for the selected resource.
2. Select the following date options from the drop-down list:
◦ Selected day – Reports for the day selected in the calendar
◦ Day before selected – Reports for the day before the day selected
3. Select a question from the PAS question drop-down list:4. Select the options from the Maximum resources drop-down list options to indicate the number of resources to be
included in the report and click Apply:
◦ Show all
◦ Show 20
◦ Show 40
◦ Show 50
Average Travel Time Per Resource ReportThe Average Travel Time Per Resource report displays the average time used by the resource to travel to the customer on thespecified day for all direct children of the chosen bucket/organization.
The 'Average travel time per resource' Dashboard report can be displayed for buckets or organizations. If an individualresource is selected in the Resource Tree, the report will be configured for its parent bucket or organization.
The Average travel time per resource report shows data for the day selected in the calendar. The chart options allowchoosing the selected date or the date before it. Additionally, the chart can be filtered to display data for a particular activitytype organization or for any activity types represented in the list of activities in the selected bucket. The third option allowsdefining the number of resources whose travel time is to be shown on the chart. The user can select 20, 40, 50 or allresources to be displayed.
The Average Travel Time Per Resource report is represented with a column chart.
This figure shows the Average Travel Time Per Resource column chart displaying the minutes of traveling per resource.
33

Oracle Field Service CloudConfiguring and Using Reports
Chapter 2Dashboard Reports
The details of the Average Travel Time Per Resource column chart is provided in the following table:
Element Description
Header Displays the Report name, the reported period and the number of resources whose data isdisplayed on the chart.
Columns Average travel time of each resource is shown as a column
Legend The chart uses only one color to display data, therefore, the chart has no legend
Axes horizontal: Resource vertical: Minutes of traveling
Hint Resource name and their average travel time in minutes
View the Average Travel Time Per Resource ReportThe Average travel time per resource report displays the average time spent by resources traveling to customers on anyday that you select.
This report has the following characteristics:
• You can run it for buckets/aggregators. If you select an individual resource in the Resource Tree, the chart will beconfigured for the parent bucket/aggregator.
• It refreshes automatically every hour.
1. Click Dashboard to open the Dashboard.2. Select the Average travel time per resource report.
The Average travel time per resource report shows data for the day selected in the calendar. The chart optionsallow choosing the selected date or the date before it. Additionally, the chart can be filtered to display data for aparticular activity type group or for any activity types represented in the list of activities in the selected bucket. Thethird option allows defining the number of resources whose travel time is to be shown on the chart. The user canselect 20, 40, 50 or all resources to be displayed. The Average Travel Time Per Resource report is represented witha column chart.
34

Oracle Field Service CloudConfiguring and Using Reports
Chapter 2Dashboard Reports
3. Click the Options icon to display the options for the chart.
See Navigate the Dashboard on page 4 for more details.
4. Select the following date options from the drop-down list:
◦ Selected – Reports for the day selected in the calendar
◦ Before selected – Reports for the day before the one selected in the calendar
The horizontal axis shows individual resources by name; the vertical axis measures travel time in minutes.
This figure shows the Average Travel Time Per Resource report as a column chart that calculates the average travel time.
Activities By Statuses ReportThe Activities by Statuses report displays the number of activities by statuses for the specified day.
The Activities by Statuses Dashboard report is displayed for:
• buckets/organizations
• individual resources
You can either view the report details as a pie chart or in a table.
To open the dashboard report, click Dispatch and then select Dashboardfrom the drop-down menu. The Activities bystatuses dashboard report is represented with a pie chart.
This figure shows the Activities by statuses report as a pie chart. The list of statuses are displayed in the Legend.
35

Oracle Field Service CloudConfiguring and Using Reports
Chapter 2Dashboard Reports
The Activities by statuses dashboard report shows data for the day selected in the calendar. The chart options allowchoosing the selected date or the date before it. You can filter to display data for a particular activity type group or for anyactivity types represented in the list of activities assigned to the selected resource.
Element Description
Header Displays the report name and date in parentheses.
Slices The entire diagram represents all activities assigned to the selected resource on the specified dayand is assumed to be 100%. Each colored slice represents the activities of a certain status showingthe percentage share of such activities in the whole number. Apart from differentiating the activitystatuses in colors, you can also view them as text in the chart hints.
Legend Statuses of the activities assigned to:• the selected individual resource (if an individual resource is selected in the Resource Tree), or
• all resources in the selected bucket/group (if a bucket or group is selected) If activitiesassigned to the selected resource belong only to some of the statuses existing in the system,the slices and the legend will contain only the statuses of the activities assigned to theresource.
Hint Activity status, the number of such activities assigned to the resource and their percentage share inthe whole number of activities.
View the Activities By Status ReportThe Activities by Status report shows the status of each activity within the reporting period. This report displays the numberof activities assigned to the selected resource (or resources grouped by their type and final status within selected dates. Thisreport does not include deleted activities.
1. Select the Navigation button.
36

Oracle Field Service CloudConfiguring and Using Reports
Chapter 2Dashboard Reports
2. Select the Activities by Status report from the navigation pane. There are four types of activities: regular, reopen,activities or pre-work. The Activities by Status report displays the following information:
◦ Activity Group: Indicates the name of the activity group and decides the number of rows in the report. Forexample, if there are less number of final statuses in an activity group, the report will have few rows (one foreach final status).
◦ Activity Final Status: Shows the final status of the job or activity in the current activity group.
◦ Type prework: Indicates the number of prework activities for the current activity group and the final status.
◦ Type regular: Indicates the number of regular activities for the current activity group and the final status.
◦ Type reopened: Indicates the number of reopened activities for the current activity group and the final status.
◦ Total: Shows the total number of activities for the current activity group and the final status
This figure shows the Activities by Status report showing the activity group, activity final status and the total count ofprework, regular, and reopened activities.
3. Use the Print or Export options to print the report or to export it in .csv format.
Completion Progress By Volume ReportThe Completion Progress by Volume report shows the total volume of activities completed in minutes or points per hour for aselected date in comparison with the average number of activities completed in the previous week and previous month. Onlythe regular and reopen activities are considered to generate this report.
The completion progress dashboard report is displayed to the following user categories:
• buckets/organizations
• individual resources
The Completion progress by volume chart lets you to select a date and add filter to display the data by activity type group.You also need to select the units of measurement to represent the completed activities volume. If the company does not usepoints according to its 'Business Rules' settings, data is not displayed when 'Points' are selected. The Completion progressby volume report is represented with a column chart.
This figure shows the Completion Progress by Volume report column chart displaying the volume of completion for each hour.
37

Oracle Field Service CloudConfiguring and Using Reports
Chapter 2Dashboard Reports
The details of the Completion progress by volume report is provided in the following table:
Element Description
Header Displays the report name and date in the header.
Columns There can be up to three columns per hour representing the following data:
• the volume of activities completed by a resource in an hour on the selected date.
• the average number of activities completed by the same resource at the same time in theprevious week.
• the average number of activities completed by the same resource at the same time in theprevious month.
Note: If the previous week/month statistics is not available, the corresponding column isnot show.
Legend Type of data represented by the chart:
• Completed (date), Units of measurement
• Average completed (week), Units of measurement
• Average completed (month), Units of measurement
38

Oracle Field Service CloudConfiguring and Using Reports
Chapter 2Dashboard Reports
Element Description
Axes horizontal: Hour vertical: Volume
Hint Each activity displays a hint pop-up with Hour, data corresponding to the selected column, columnrepresenting the volume of activities and the units of measurement.
39

Oracle Field Service CloudConfiguring and Using Reports
Chapter 2Dashboard Reports
40

Oracle Field Service CloudConfiguring and Using Reports
Chapter 3Routes and Activities Reports
3 Routes and Activities Reports
About Routes and Activities ReportsThese reports provide the information necessary to manage routing, schedule activities and respond to customer demand.
You can directly access the following reports from the Reports menu.
• Inventory Report
• Messages Report
• Print Route
• Scheduled Report
• File Storage usage
Note: The reports listed under the Reports tab in your configuration may vary from the ones discussed here.
The other reports cannot be accessed directly. You can navigate to the User Types screen by clicking Configuration andthen selecting User Types. You may navigate to Dashboard reports from the Dashboard menu.
Note: Report column names are available only in English and cannot be modified.
View the InTime/Late/Early Activity ReportThe In Time/Late/Early Activity report shows you the percentage of activities that were started on time and those that werestarted late, started early, not started or cancelled for either the individual resource or the bucket.
Activities started on time, late, or early are calculated by comparing the actual start time to the Service Window. This reportcan be used to measure on time performance.
1. Select the Navigation button.2. Select In Time/Late/Early Activity from the navigation pane. The report displays the following information:
◦ Provider – The resource or bucket that you selected from the Resource Tree
◦ Total number of appts – The total number of regular activities assigned to resources within the reportingperiod
◦ Started In Time % – The percent of regular activities that were started within the service window, as well asthe activities that have an indefinite service window (that is, the service window start/end is null). The searchoption for this field was set to 100% in order to return all start time statistics.
◦ Started Late % – The percent of regular activities started late. This includes activities with a not null servicewindow and an actual start time that occurs after the end of the service window. The search option for thisfield was set to 100% in order to return all start time statistics.
◦ Started Early % – The percent of regular activities that were started early. This includes activities with a notnull service window and an actual start time that occurs earlier than the start time of the service window. Thesearch option for this field was set to 100% in order to return all start time statistics.
41

Oracle Field Service CloudConfiguring and Using Reports
Chapter 3Routes and Activities Reports
◦ Not Started % – The percent of regular activities that were not started, indicated by a final status ofPending. The search option for this field was set to 100% in order to return statistics for all activities that werenot started.
◦ % Canceled – The percent of regular activities that were canceled without having been started. The searchoption for this field was set to 100% in order to return statistics for all canceled activities.
This figure shows the In Time/Late/Early Activity report with the percentage of activities started, canceled, or notstarted.
3. Use the Print or Export options to print the report or to export it in .csv format.
View the Notification Summary ReportThe Notification Summary report summarizes the status of the messages sent to customers during the reporting period.
1. Select the Navigation button.2. Select Notification Summary from the navigation pane.
The Notification Summary reports include all messages of any status excluding new and sending that were sentby any method available (voice, e-mail, external system, manual, etc.).
This figure shows the Notification Summary report displaying the summary of message statuses sent to customers.
42

Oracle Field Service CloudConfiguring and Using Reports
Chapter 3Routes and Activities Reports
3. Click View and set filters to view messages sent on a certain day or under a particular scenario.
Print RouteThe Print Route option enables you to print the route of a single resource, and provides a summary of the resource’s day.
1. Select the resource in the resource tree whose route you would like to print.2. Select the Navigation button.3. Select Print Route from the navigation pane.
The Print Route report is displayed.
The route report displays in the Work area.
This figure shows the Print Route report displaying the route of a selected resource for a day.
4. Review the following information in the report:
◦ Start – Indicates the estimated time of arrival for the pending work order or the time that the job is scheduledto begin
◦ Activity Type – Displays the type of job or work to be performed, such as install, trouble call, and so on, aswell as any non-customer facing activities, such as warehouse, break, and so on.
◦ Service Window – Specifies the time boundaries for this work order, as scheduled by the company andexpected by the customer.
◦ Account Number – Displays the primary identifier for ownership of an account.
43

Oracle Field Service CloudConfiguring and Using Reports
Chapter 3Routes and Activities Reports
◦ Name – Displays the name of the customer receiving the service.
◦ Address – Displays the customer’s service location.
◦ Zip – Displays the postal code of the service location.
◦ Phone – Displays the telephone number of the customer receiving the service.
5. Use the Print or Export links to print the report or to export it in .csv format.
View the Route Statistics ReportThe Route Statistics report shows you the percentage of activated routes, the percentage of completed routes, the averagenumber of activities per route, and a summary of the time spent on actual activities.
1. Select the Navigation button.2. Select Route Statistics from the navigation pane.
The Route Statistics report is displayed.3. Filter the information in the report by resource or by bucket depending on the selection you make in the Resource
Tree.4. Review the following information in the report:
◦ Provider name: Displays only those resources, groups, or buckets that had at least one route assignedduring the reporting period
◦ Total Routes: Total number of routes assigned (day of work) to a given resource/bucket/group within thereporting period. Routes with activities and/or deleted activities only are not taken into account.
◦ % Activated: Percent of routes that were activated during the reporting period. Routes with activities and/ordeleted activities only are not taken into account.
◦ % Complete: Percent of routes that were completed (activated routes that include only activities with thefollowing statuses: Completed, Canceled, Suspended, and Not done) during the reporting period. Routes thatcontain deleted activities or routes that do not contain any activity are not taken into account.
◦ Average number of appts per route: Average number of regular activities (activities) per route. Reopenedactivities and pre-work are not taken into account.
◦ Summary time spent on appts (hrs): Summary time spent processing activities (in hours) during thereporting period. All activities that have been started and have a NOT NULL length are included as is timespent on reopened activities and pre-work.
5. Use the Print or Export options to print or export the report in .csv format.
View the Route Time Parameters ReportThe Route time parameters report calculates the average time parameters, in hours, for one route.
1. Select the Navigation button.2. Select Route time parameters from the navigation pane.
The Route time parameters report is displayed.
This figure shows the Route Time parameters report that calculates the average time parameters, in hours, for oneroute.
44

Oracle Field Service CloudConfiguring and Using Reports
Chapter 3Routes and Activities Reports
3. Review the following information in the report:
◦ Provider—The resource or bucket that you selected from the Resource Tree. If you selected a Bucket thatincludes multiple resources, statistics will be broken down by resource. If you select a bucket that includesother buckets, the statistics will be broken down by bucket like the report above.
◦ Average activation time—The average time in decimal format (for example, 08:40 will be displayed as 8.66)of route activation for the resource or bucket per day over the reporting period.
◦ Length of day—The average number of hours between the start of the first job or activity and the end of thelast job or activity for the selected resource or bucket during the reporting period.
◦ Time spent on appts —The average number of hours spent on appointments over the reporting period.
◦ Time spent on activities—The average number of hours spent on individual Activities over the reportingperiod. (An appointment is sometimes made up of more than one activity.)
◦ Time spent on travel —The average number of hours spent on Travel and Idle time over the reportingperiod.
◦ Number of completed appts —The average number of completed appointments for the selected technicianor bucket per day over the reporting period.
Note: The term average is used because a date range can be selected when running the report.
View the Routing ReportThe routing report analyzes the quality of routes and measures the performance of the routing group over time. The routingreport provides route statistics, such as travel time, work time, and number of completed jobs, and is used to measure bothproductivity and drive time.
1. Select the Navigation button.2. Select the Routing report from the navigation pane.3. Review the routing report. It presents a summary of each route, planned or actual, in terms of minutes of travel,
work, job fit %, overtime and idle time. It presents the current view at the time it is run as follows:
◦ If run before the start of the day, the report represents the planned route
◦ If run after the end of the day (or days later), the report represents what actually happened
◦ If run mid-day, the report will be part actual and part planned
4. Select a resource bucket or organization in the Resource Tree to run the routing report .
A single total line is provided for all the resources included in the report. Some buckets contain resources whileothers govern a hierarchy of buckets or organizations. The report will be broken down either by individual resource orby bucket or organization, depending on the hierarchy.
45

Oracle Field Service CloudConfiguring and Using Reports
Chapter 3Routes and Activities Reports
5. Review the following information in the report:
◦ Aggregator —Either a bucket or an organization
◦ Resource – Name of the selected resource
◦ Date – The date of Route in day/month/year format
◦ Jobs – The number of jobs on route for that day, filtered by status and work type conditions. Status can beany of the following:
- Pending- Started- Complete- Suspended
The total number of jobs includes jobs that meet the status and work type conditions above, including jobsthat were on the resource’s route within the specified day and jobs with no service window (all day jobs).
◦ Travel (mins) – The number of minutes used for travel. If the route has not yet been completed, this will showthe estimated travel time.
Note: Travel time represents total travel time from and to known locations. If an activity (such aslunch) is not a known location, Oracle Field Service Cloud will not represent that time in travel time.Similarly, time spent on activities (meetings or lunch) is not represented in the routing report.
◦ Work (mins) – The total minutes of work-duration time in a technician's route for a specified day in thedefined date range. If the route has not been started or completed yet, this will show the estimated work time.
◦ Job Fit % – The average skill level for jobs on a route. This metric is based on the Oracle Field Service Cloudwork skill %. If a technician does not have a corresponding work skill for an activity (or doesn't have any workskills), then the work skill for the activity is considered to be 0.
◦ Overtime – The number of overtime minutes for the day. Overtime is calculated as [End of the last jobperformed] - [Schedule shift end time]. If a resource has no overtime, the report will display a "0" value.
Note: Oracle Field Service Cloud considers overtime to be any time outside the resources’sshift for that day. This does not influence the Oracle Field Service Cloud overtime calculation. ifthe technician has a 10 hour day scheduled or has worked 35 hours earlier in the week, OracleField Service Cloud just looks at time within or outside the shift represented in that day’s workingcalendar.
◦ Idle Time – The time within a route when a technician is waiting to begin traveling to the customer's locationin order not to arrive before the service window starts. In other words, it is the time that is not filled with traveltime, work time, or an activity.
View Scheduled ReportsThe Schedule Report option enables you to view a list of reports that have been set up to run on a specified schedule.
Initial report scheduling is handled by your system administrator.1. Select the Navigation button.2. Select Schedule Report from the navigation pane.
A list of the reports that have been scheduled to run on a recurring basis by the system administrator appears.
This figure displays the Schedule Reports page showing the list of all scheduled reports.
46

Oracle Field Service CloudConfiguring and Using Reports
Chapter 3Routes and Activities Reports
The details of the Scheduled Report is provided in the following table:
Column Description
ID The unique identifier for this report.
Report name The name of the report.
Start Date The start date of the reporting period.
End Date The end date of the reporting period.
Report Type The format of report to be sent or saved (CSV, HTML, XML, PDF).
Time The time that the report was run.
Recurrence How often this report is run. You cannot run or modify any recurring reports.
Action To view the details of the settings for an individual report (View).
View the Configuration History ReportThis report displays the changes made to any of the Configuration pages within the application.
1. Select the Navigation button.2. Select 'Configuration History from the navigation pane.
The Configuration History report is displayed.
47
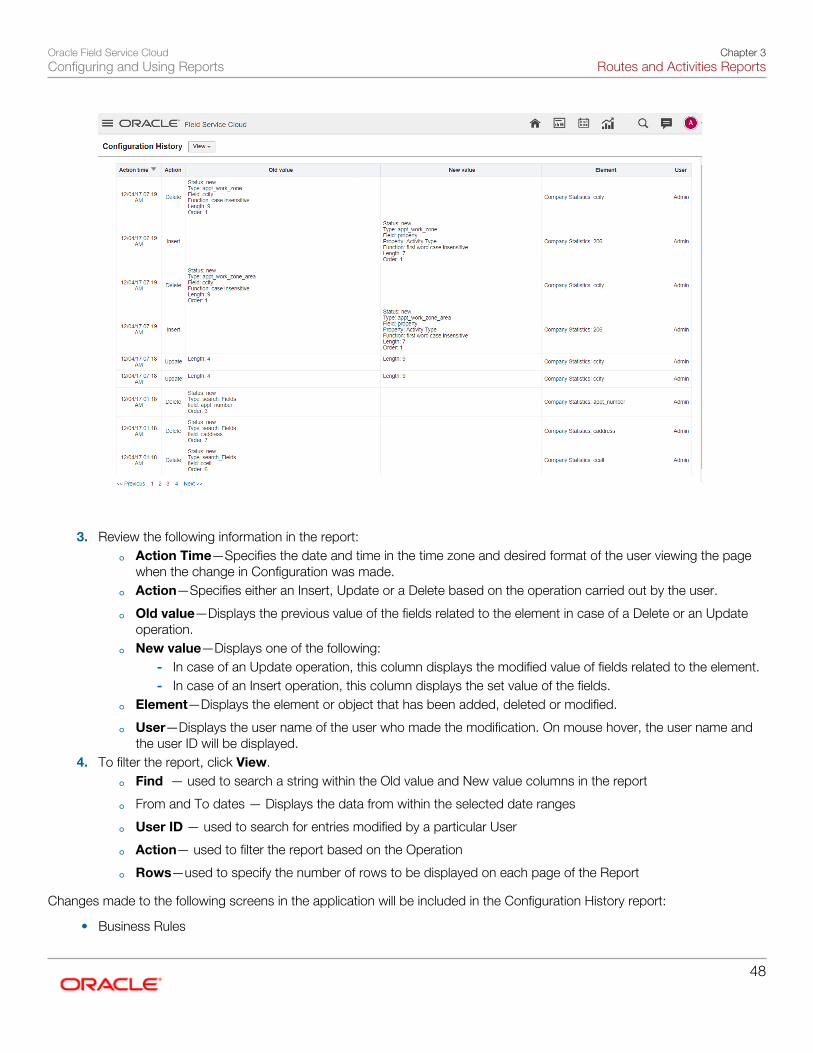
Oracle Field Service CloudConfiguring and Using Reports
Chapter 3Routes and Activities Reports
3. Review the following information in the report:
◦ Action Time—Specifies the date and time in the time zone and desired format of the user viewing the pagewhen the change in Configuration was made.
◦ Action—Specifies either an Insert, Update or a Delete based on the operation carried out by the user.
◦ Old value—Displays the previous value of the fields related to the element in case of a Delete or an Updateoperation.
◦ New value—Displays one of the following:- In case of an Update operation, this column displays the modified value of fields related to the element.- In case of an Insert operation, this column displays the set value of the fields.
◦ Element—Displays the element or object that has been added, deleted or modified.
◦ User—Displays the user name of the user who made the modification. On mouse hover, the user name andthe user ID will be displayed.
4. To filter the report, click View.
◦ Find — used to search a string within the Old value and New value columns in the report
◦ From and To dates — Displays the data from within the selected date ranges
◦ User ID — used to search for entries modified by a particular User
◦ Action— used to filter the report based on the Operation
◦ Rows—used to specify the number of rows to be displayed on each page of the Report
Changes made to the following screens in the application will be included in the Configuration History report:
• Business Rules
48
Oracle Field Service CloudConfiguring and Using Reports
Chapter 3Routes and Activities Reports
• Link Templates
• Work Schedules
• Work Zones
• Work Skills
• Properties
• Capacity Categories
• Time Slots
• Resource Types
• Activity Types
• Inventory Types
• Glossary
• Action Management
• Display
• Filters
• Organizations
• Login Policies
• User Types
• Oracle Knowledge
• Statistics
• Outbound Integration
• Message Scenarios
• Holidays
• Resource Info
• Resource Calendars
• Locations
• Resource Work Zones
• Users (Except for Collaboration and Helpdesk groups)
• Daily
• Routing
• My Display
• Themes (only when default Theme is changed)
• Applications (limited to changes in the context of APIs)
Known Behaviors:
• The 'Find' option within 'View' is applicable only for the Old value and New value columns, it is no available for theIdentifier column.
49
Oracle Field Service CloudConfiguring and Using Reports
Chapter 3Routes and Activities Reports
• When searching:
◦ it is possible to search Old value and New value columns only using the value of the field and not the fieldname. For example: For the entry 'Activity Type: Install', you can perform a search on the word 'Install', butnot on 'Activity Type’.
◦ Users can be searched using the User ID and not the User Name.
• Some fields may display the IDs of the values, instead of the actual values. For example: Design Theme: 2 or TimeSlots can have values like 2, 3.
• The Identifier column, in some cases may display IDs instead of or in addition to values. For example: 'Display Profile:UT16_DISPLAY_PROFILE/26' instead of 'Display Profile: UT16_DISPLAY_PROFILE’ ID: 15497
• The Identifier may display just the Company name when the Business Rules screen is modified.
• In entries related to the Statistics page, the value of the Type displays the label instead of the text. For example:'Type: appt_duration' instead of 'Type: Activity duration stats fields’
• The Context Layout displayed within the Identifier column shows the label instead of the text. For example: 'DisplayContext Layout: web_menu manage/540’
• In some cases, the number of rows displayed on the screen may be less than the configured number of rows. Forexample: The page may display only 18 rows on the screen though the user has set 20 as the number of rows.
• Sorting is only available using the Action Time and Operation columns.
• Values of sensitive information like passwords, client secrets, and certificates will be masked using * characters.
• Collaboration and Helpdesk groups would not be shown in Configuration History.
• Changes done to the SAML login policy using "Upload Metadata XML" will not be logged.
50

Oracle Field Service CloudConfiguring and Using Reports
Chapter 4Oracle Field Service Cloud Communication and Post Activity
Survey Reports
4 Oracle Field Service Cloud Communicationand Post Activity Survey Reports
About Oracle Field Service Cloud Communication and PostActivity Survey ReportsThe reports in this category document the company's performance in communicating with customers, delivering service ontime and meeting customer expectations.
Note: Report column names are available only in English and cannot be modified.
View the Average Number of Calls Per CustomerThe Average Number of Calls per Customer report provides statistics about the voice messages that were sent tocustomers during the reporting period.
1. Select the Navigation button.2. Select the Average Number of Calls per Customer report from the navigation pane. The report contains the
following information:
◦ Message Type:—Indicates the following types of messages based on message triggers:- day_before- reminder- today_%- call_ahead- complete
◦ Number of sent messages: —Shows the total number of voice messages (of all types) that were sent tocustomers within the reporting period. It displays the total number of successfully sent voice messages with afinal status of Sent or Delivered.
◦ Average Number of Calls per Customer shows the average number of calls (of all types) that onecustomer received within the reporting period.
The Average Number of Calls per Customer report shows the Average number of calls successfully sent to onecustomer. This number is calculated as [The total number of successfully sent calls] Divided by: [The number ofcustomers who received at least one voice message of any type, with a status of Sent or Delivered].
3. Use the Print or Export links to print the report or to export it in .csv format.
51

Oracle Field Service CloudConfiguring and Using Reports
Chapter 4Oracle Field Service Cloud Communication and Post Activity
Survey Reports
View the Percent of Accurate Last Messages ReportThe Percent of accurate last messages report shows the percentage of Last Notification calls in which the service windowboundaries communicated to the customer were accurate.
An accurate call is one where the actual start time of the activity appears to be within the boundaries of the time windowspecified by the call (±10 minutes). A last notification call is the last voice message that the customer received before theactivity was started.
1. Click Dashboard to open the Dashboard.2. Select the Percent of Last Accurate Message chart.
The Percent of accurate last messages report displays the percentage of Last Notification calls in which the service windowboundaries communicated to the customer were accurate.
The details of the Percent of Last Accurate Message report are provided in the following table:
Option Description
Date The notification date
Percent of Accurate Last Calls The ratio between the number of accurate last customer notification calls and the total number ofwork orders that have at least one customer notification call with the “Sent” or “Delivered” result.
The following activities are taken into account:
• Activities that have been started
• Notification calls containing the estimated service or delivery window
View the Percent of Contacted Customers ReportThe Percent of Contacted Customers report shows the total number and percentage of customers who received at leastone message containing either a service or delivery window.
1. Click Dashboard to open the Dashboard.2. Select the Percent of Contacted Customers report.
The following table describes the columns displayed on the Percent of Contacted Customers report.
Option Description
Date The notification date
Number of Contacted Customers The total number of customers contacted during a given date.
Percent of Contacted Customers The percent of contacted customers.
The following equation is used to determine this percentage:
52

Oracle Field Service CloudConfiguring and Using Reports
Chapter 4Oracle Field Service Cloud Communication and Post Activity
Survey Reports
The quotient of number of customersdivided by the total number of customers who should have been contacted.
View the Last Message Window Size ReportThe Last Message Window Size report shows the percentage of customers whose last successfully sent notification includedan estimated delivery time window of a specific duration.
1. Select the Navigation button.2. Navigate to the Last Message Window from the navigation pane. The Last Message Window Size report contains
the following information:
◦ Size of Window (min): Estimated time window for service or delivery as transmitted (in minutes) to thecustomer in the last successfully sent notification (with a status of Sent or Delivered).
◦ Percent of Calls: Percent of customers who were given an estimated window of time for delivery.
View the Transferred Calls ReportThe Transferred Calls report shows the number of voice calls that were transferred to the Call Center (when a customerselected the corresponding automatic option).
1. Select the Navigation button.2. Navigate to the Transferred Calls report from the navigation pane. The Transferred Calls Report contains the
following information:
◦ Date:—Notification Date.
◦ Before Start Route:—The number of voice calls transferred to the Call Center before the route wasactivated.
◦ After Start Route:—The number of voice calls transferred to the Call Center after the route had beenactivated.
◦ Inactive Route:—The number of voice calls transferred to the Call Center for routes that were not activated.
◦ Total Count:—Total number of voice calls transferred to the Call Center .
Generate Post Activity Survey (PAS) ReportsPAS Reports summarize the results of Post Activity Surveys.
You must be using the Oracle Field Service Cloud Communication module in order to generate this report.1. Click Dashboard to open the Dashboard.2. Select PAS Report.
The PAS Report displays the results of Post Activity Surveys.
This figure shows the PAS Report displaying the results of Post Activity Surveys.
53

Oracle Field Service CloudConfiguring and Using Reports
Chapter 4Oracle Field Service Cloud Communication and Post Activity
Survey Reports
The PAS report details are provided in the following table:
Option Description
Total The total number of respondents.
(Yes) The number of respondents who answered "Yes."
(No) The number of respondents who answered "No."
1 to 5 The level of satisfaction based on the question posed to the customer.
PAS Reports can vary significantly based on the questions in the post-activity surveys. The percent given for each questionrow should total 100% across all columns.
View the Messages ReportThe Messages report details the results of messages sent out through the Notification Engine. This report shows only thosemessages that use set property delivery channel (method) if they were generated in less than one hour. The only exceptionfrom this rule: Messages with failed status. Such messages are important for troubleshooting therefore they do not have theone-hour expiration time.
1. Select the subject of your report from the resource tree.
This could be a bucket or organization, such as XYZ contractors, or one or more resources.2. Click the Navigation button.3. Select Messages Report from the navigation pane.4. Click View to display the filtering options for this report.5. Select your options.
a. From/To Date: Use the calendar icons to select the desired dates.b. Trigger: Select a trigger from the drop-down menu. The trigger is the action taken within Oracle Field Service
Cloud that triggers the message. For example, if you would like to run a report showing all messages triggeredwhen an order is canceled, select Cancel.
c. Find: Use this field to search for a certain term, word, or character (such as the name of a resource) within theresults.
d. Rows: Enter the number of rows you want to see at one time. The default value is 20.
The Messages report details the results of messages sent out through the Notification Engine.
54

Oracle Field Service CloudConfiguring and Using Reports
Chapter 4Oracle Field Service Cloud Communication and Post Activity
Survey Reports
Field Description
Method How the message was sent. For example, internal process or external system.
Status The status of the message at the time the report was run.
Description Additional information about the message status.
Miscellaneous Other information
Scenario (Step) The scenario or step referenced in the message.
Trigger The event or reason why the message was sent.
Call Day The day the call was placed.
Day Created The date and time that the message could be seen in the system.
55

Oracle Field Service CloudConfiguring and Using Reports
Chapter 4Oracle Field Service Cloud Communication and Post Activity
Survey Reports
56

Oracle Field Service CloudConfiguring and Using Reports
Chapter 5Statistical/Administrative Reports
5 Statistical/Administrative Reports
About Statistical and Administrative ReportsThese reports display data based on statistics collected in the Oracle Field Service Cloud system. All statistical reports usethe main database.
Note: Report column names are available only in English and cannot be modified.
Export a ReportAny report can be exported as a .csv file. Once it is downloaded, usually to Excel, you can use the data in any type ofreporting tool. When you print or export a report, it is printed or exported in the language set in the Company languagesection of the Display screen.
The Export option is available for all reports in the work area. You can save your report as a.csv file that you can open inExcel or other application.
1. From any open report window, click Export.
The Open Report dialog for the selected report appears.
2. Select Open with and then choose any application from the list to view the report.3. Optionally, select Save File to save the report to the default application, Excel.
The filename of the saved file is displayed in the language set in the operating system.
4. Optionally, click the Do this automatically for files like this from now on check box to save the export settingsas default.
5. Click OK to export the report.
The file is saved in .csv format.
Notes On Time CalculationsOvertime and travel time are addressed differently when you are calculating times.
Oracle Field Service Cloud considers overtime to be any time outside the resource’s shift for that day. This does not influenceovertime calculation. If the resource has a 10 hour day scheduled or has worked 35 hours earlier in the week, the applicationjust looks at time within or outside the shift represented in that day’s working calendar.
Travel time represents total travel time from and to known locations. If an activity (such as lunch) has no known location, theapplication will not include that time in travel time. Similarly, time spent on activities (meetings or lunch) is not included in therouting report.
57

Oracle Field Service CloudConfiguring and Using Reports
Chapter 5Statistical/Administrative Reports
View the Average Travel Time ReportThe Average Travel Time Report shows you the average travel time between activities for an individual resource or anentire bucket during any reporting period that you select.
Travel time is determined by subtracting the end time of one activity or appointment with a known location from the start timeof the next activity, provided this location is also known. Events such as lunch breaks are not included as those events do nothave a destination.
If resources do not create activities in the application for things like fuel stops, special parts runs or meetings, then travel timeas represented will be inflated. Resources should be encouraged to create an activity for any time between activities that islonger than 10 minutes and is not travel time.
1. Select the Resource or Bucket in the resource tree that is the subject of your report.2. Select the Navigation button.3. Select the Average Travel Time from the navigation pane.4. Click View to display the settings for this report.
◦ From/To Date—Use the calendar icons to select the desired dates.
◦ Travel Time—Use this field to search for travel times over a certain number of minutes. By default this is setat 0 to return all travel time statistics. (This field can be useful when searching for long average travel times.)
◦ Find...in: <resource name>—Enter a name or portion of a name to search for results for a particularresource.
This figure shows the Average Travel Time report listing the average travel time for resources.
58

Oracle Field Service CloudConfiguring and Using Reports
Chapter 5Statistical/Administrative Reports
This report lists the average travel time for each individual resource or organization that you select as well as the average forthis report.
View the File Storage Usage ReportThe File Storage usage report provides you with information about the file storage usage, namely: a number of requests andtransferred bytes which are grouped by day, file storage type, backend and bucket.
1. Select the Navigation button.2. Select File Storage usage from the navigation pane.
The File Storage usage screen is displayed.3. Click View to display the drop-down menu, specify the following values and then click Apply.
a. Enter the the From date and To date: to specify the reporting period.b. Select the Status to display the report only for a specific status (failed, success).c. Enter the Operation to display the report only for a specific operation.
- del—delete file- get—get file contents- put—put file contents- list—get stored files listing
d. Find...in: Enter values to search for results for a particular location based on a To/From Activity Key orportion of a key that you enter here.
59

Oracle Field Service CloudConfiguring and Using Reports
Chapter 5Statistical/Administrative Reports
e. Rows: Enter the number of rows you want to see at one time.4. Click Print to print the report or Export to export the report as a .csv file.
The File Storage usage report provides you with information about file storage usage.
This figure shows the File Storage usage report:
Field Description
Date Displays the day for which the data are aggregated.
Type Displays the type of the file storage as follows:• exchange refers to daily extract
• property refers to file properties
Backend Indicates the file storage type.
Note: This value is for reference only; it does not affect any functionality.
Bucket Displays the File storage bucket (name of the backend specific container where the files are stored).
Requests Displays the total number of requests performed.
Bytes Displays the total number of bytes transferred.
View the GPS Alerts Per Resource ReportThe GPS alerts per resource report shows the number of activities with 'started outside the location', 'completed outsidethe location' or 'resource left the activity location' alerts.
1. Select the Navigation button.2. Select GPS alerts per resource from the navigation pane. Click View and then click the calendar icon to select a
date, and then click Apply.
The GPS alerts per resource report shows how many activities have such alerts as 'started outside the location','completed outside the location' or 'resource left the activity location'.
60

Oracle Field Service CloudConfiguring and Using Reports
Chapter 5Statistical/Administrative Reports
3. Review the following fields:
◦ Provider: Displays the name of the resource
◦ Total number of activities: Displays the number of activities assigned to the resource (which have GPStracks)
◦ Activity started outside the location %: Displays the percentage of activities which were started outsidethe planned work location
◦ Activity completed outside the location %: Displays the percentage of activities which were completedoutside the planned work location
◦ Resource left the activity location %: Displays the percentage of times when the resource left the workzone
◦ Idles %: Displays the percentage of idle statuses
4. Use the Print and Export options to print or export the report in the .csv format.
View the Inventories ReportThis report will display the inventory list and activity list for inventories. The user can configure and use custom inventoryproperties excluding file properties.
1. Select a resource from the resource tree.2. Select the Navigation button.3. Select Inventories from the navigation pane.
The Inventories report is displayed.
4. Click Add New to add a new inventory or select the Modify link to edit an existing inventory. Complete the followingfields as necessary:
◦ Serial Number:Specifies the serial number of the inventory item.
◦ Inventory pool: Displays the pool to which the inventory item belongs.
◦ Inventory Type: Provides the type of the inventory item. Enter a value.
◦ Quantity: Specifies the Quantity of non-serialized inventory. Enter a quantity.
61

Oracle Field Service CloudConfiguring and Using Reports
Chapter 5Statistical/Administrative Reports
◦ Model: Displays the model number of the inventory item.
5. Use the Print or Export options to print the report or to export in .csv format.
View the Inactive Users ReportThe Inactive Users Report lists the users that have been inactive for a designated period of time. Administrators can use thisreport to monitor system use.
1. Select the Navigation button.2. Select Inactive Users from the navigation pane.
The View settings determine the period during which users were inactive. If you want to view the number of inactiveusers for a particular date, click View and then click the calendar icon below Last login to select a date, and thenclick Apply.
The Inactive Users report provides details about inactive users such as user names, status, user type, and thenumber of days since their last login.
The Inactive Users Report lists the users that have been inactive for a designated period of time.
3. Use the Print and Export options to print or export the report in the .csv format.
View the Number of Active UsersThe Number of Active Users report enables you to view the number of users in use on any day that you select.
1. Select the Navigation button.2. Select Number of Active Users from the navigation pane.
The Number of active users report is displayed.3. Click View. Specify a date and the number of rows to display for your report and click Apply.
The report shows the number of individual users for each user type. A test chart is also available for use.
62

Oracle Field Service CloudConfiguring and Using Reports
Chapter 5Statistical/Administrative Reports
View the Travel Statistics ReportThe Travel Statistics report provides you with historical information about travel to and from service locations.
1. Select the Navigation button.2. Select Travel Statistics from the navigation pane.
The Travel Statistics screen is displayed.3. Click View to display the drop-down menu, specify the following values and then click Apply.
a. Start Key/End Key: Optionally, enter a start and end key. These are based on the activity keys set up foryour configuration in the Statistics Parameters screen.
To open this screen, click Configuration and select Statistics Parameters in the Subsystems AndIntegrations section.
b. Find...in: Enter values to search for results for a particular location based on a To/From Activity Key orportion of a key that you enter here.
c. Rows: Enter the number of rows you want to see at one time.4. Click Print to print the report or Export to export the report as a .csv file.
The Travel Statistics report provides you with historical information about travel to and from service locations.
Field Description
Activity Key From/Activity Key To Displays the Start and Finish indicators developed for your configuration under StatisticsParameters.
Avg Indicates the average travel time in minutes.
Dev Indicates the standard deviation from the travel time.
Count Displays the quantity of averaged samples in the current category.
Level Indicates whether statistics were gathered at the company, organization or individual resource level.
View the Work Order Statistics ReportThis report displays the statistics for work orders.
1. Select a resource from the resource tree2. Select the Navigation button.3. Select Work Order Statistics from the navigation pane.
The Work Order Statistics report is displayed.
63

Oracle Field Service CloudConfiguring and Using Reports
Chapter 5Statistical/Administrative Reports
4. Review the following information in the report:
◦ Provider: Resource name. Displays only those resources that have at least one activated route with regularnot deleted activities within the given dates.
◦ Work type: Displays the work types of activities assigned to a given resource within the selected date. Ifseveral activity work types are available then the table will have several rows for this resource – one row pereach work type.
◦ Total number of appts: Provides the total number of regular activities of a specific work type by a selectedresource within the selected date.
◦ %Completed: Displays the percentage of completed activities on which the work order statistics are based.
◦ Average time to complete: Displays the average time required to complete a regular activity of a specificwork type by a selected resource within the selected date. Only completed activities are taken into account.
5. To filter the report, click View and enter one of the following values in the Work type filter field:
◦ * (default value)—The report displays the data related to all activities of all work types within the selected date.
◦ a label of a specific work type—The report displays the data related to activities of only that work type.
6. Use the Print or Export options to print the report or to export in .csv format.
64
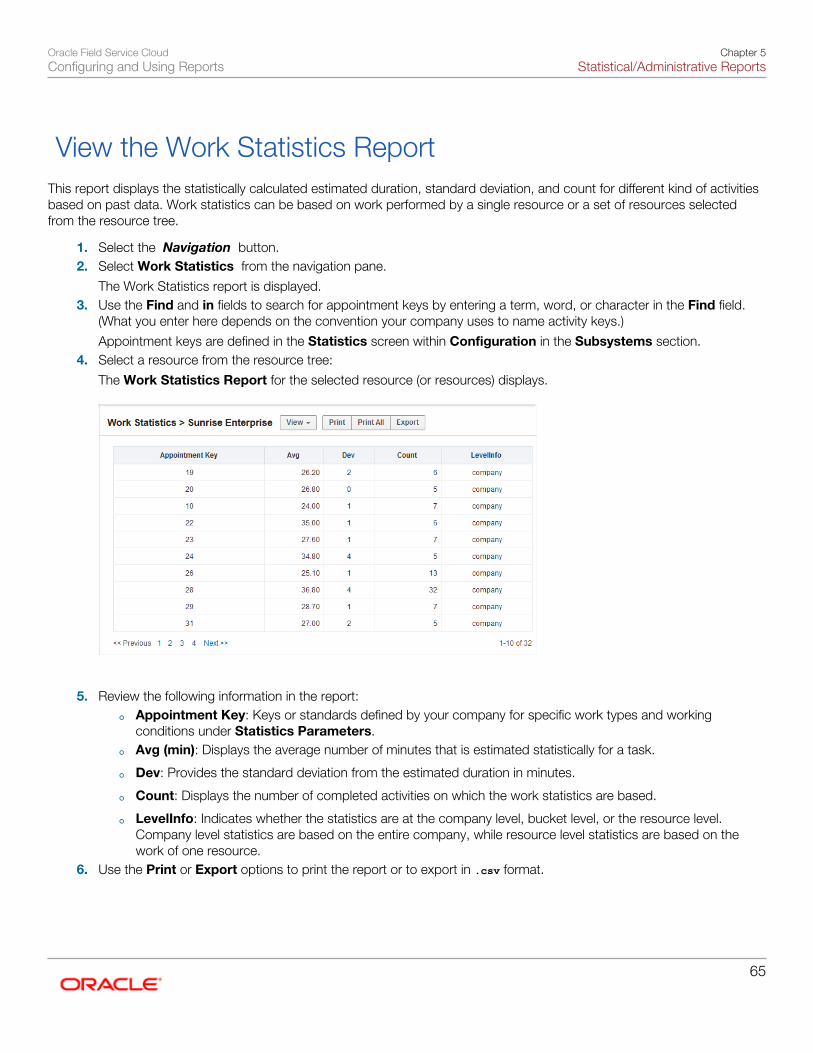
Oracle Field Service CloudConfiguring and Using Reports
Chapter 5Statistical/Administrative Reports
View the Work Statistics ReportThis report displays the statistically calculated estimated duration, standard deviation, and count for different kind of activitiesbased on past data. Work statistics can be based on work performed by a single resource or a set of resources selectedfrom the resource tree.
1. Select the Navigation button.2. Select Work Statistics from the navigation pane.
The Work Statistics report is displayed.3. Use the Find and in fields to search for appointment keys by entering a term, word, or character in the Find field.
(What you enter here depends on the convention your company uses to name activity keys.)
Appointment keys are defined in the Statistics screen within Configuration in the Subsystems section.4. Select a resource from the resource tree:
The Work Statistics Report for the selected resource (or resources) displays.
5. Review the following information in the report:
◦ Appointment Key: Keys or standards defined by your company for specific work types and workingconditions under Statistics Parameters.
◦ Avg (min): Displays the average number of minutes that is estimated statistically for a task.
◦ Dev: Provides the standard deviation from the estimated duration in minutes.
◦ Count: Displays the number of completed activities on which the work statistics are based.
◦ LevelInfo: Indicates whether the statistics are at the company level, bucket level, or the resource level.Company level statistics are based on the entire company, while resource level statistics are based on thework of one resource.
6. Use the Print or Export options to print the report or to export in .csv format.
65

Oracle Field Service CloudConfiguring and Using Reports
Chapter 5Statistical/Administrative Reports
66

Oracle Field Service CloudConfiguring and Using Reports
Chapter 6Troubleshooting Reports
6 Troubleshooting Reports
Report Words and Header TranslationsSome report words and headers are not available in translated languages.
Time-Out MessagesIf a particular report is not loaded, there might be a problem with setting the filters in the View drop-down list correctly.
Following message is displayed:
• Unable to load data. Change parameters and press apply to view report
Reports taking longer the 30 seconds to load will receive the above time-out message. When this occurs, youshould change the values in the filters or update the position in the resource tree hierarchy.
67

Oracle Field Service CloudConfiguring and Using Reports
Chapter 6Troubleshooting Reports
68

Oracle Field Service CloudConfiguring and Using Reports
Revision History
Revision History
This document will continue to evolve as existing sections change and new information is added.
Date What’s Changed Notes
February 2018 • Added new section on Configuration History report.
• Minor changes for clarity and consistency
November 2017 Reorganized topic structure and minor changes for clarityand consistency
October 2017 • Statistical/Administrative Reports chapter includesinformation about File storage usage report andWork Order statistics report.
• Minor changes for clarity and consistency
March 2017 • Dashboard chapter includes information aboutgranting permissions to view reports
• Minor changes for clarity and consistency
April 2016 The content of Dashboard Reports is now included in thisguide.
Dashboard navigation and configuration were merged intothe Dashboard and Overview of Dashboard sections.
69

Oracle Field Service CloudConfiguring and Using Reports
Revision History
70