Embed Size (px)
Citation preview

1
Configuring an Audit Work Instructions
Contents Section 1.0: Fill out EQ LTE Analysis Quick Reference Sheet ...................................................................................... 2
Section 2.0: Configuring an Audit - Audit Wizard .......................................................................................... 5
Section 2.1: Audit Information .................................................................................................................. 5
Section 3.0: Setting up Base Station and Loggers .......................................................................................... 7
Section 3.1: Configuring the Base Station ................................................................................................. 7
Section 3.2: Configuring Pressure Loggers................................................................................................. 7
Section 3.3: Configuring Current Loggers .................................................................................................. 8
Section 4.0: Create Table ............................................................................................................................... 9
Section 5.0: USB Cable ................................................................................................................................ 14
Section 5.1: Ethernet Cable Option…………………………………………………………………………………………………………
Before starting a new audit, make sure that all settings on your Base Station settings are up to date and the units on your account are correct.

2
Section 1.0: Fill out the EQ LTE Analysis Quick Reference Sheet
Located on Virtual Library and the homepage of the EQ LTE website.

3

4

5
Section 2.0: Configuring an Audit - Audit Wizard
Log into the Quincy Site
http://quincy.scadar.net/
Works best with google chrome!!
• Click Audit Wizard to set up the Audit
Section 2.1: Audit Information
• Information that you fill out will be put in the audit report.

6
Fill in the customer information, this will be used in the report wizard to populate the report.
Once all required fields are complete the step at the bottom of the page will display a green check mark.
Click the next step to move on to configuring the data loggers

7
Section 3.0: Setting up Base Station and Loggers Section 3.1: Configuring the Base Station
• Press the “+” button to enter the serial number of the base station
• Type in the SN on your Base station. The SN is located on the back of the Base Station and click ‘OK’ to continue
Section 3.2: Configuring Pressure Loggers
• Select the proper logger, and fill in the SN, in the future the SN will be remembered, and can be selected from the drop-down menu.

8
• One logger must be used for system pressure to calculate the pressure fluctuations. Select the Snow Flake icon for the system pressure logger only.
• For current logger fill in all information • click ‘OK’ to continue
Section 3.3: Configuring Current Loggers
• Select the proper logger, and fill in the SN for the selected logger
• Name the logger based on compressor, Ex. QSI 500 North
• Click on the Select Compressor Table Icon
9
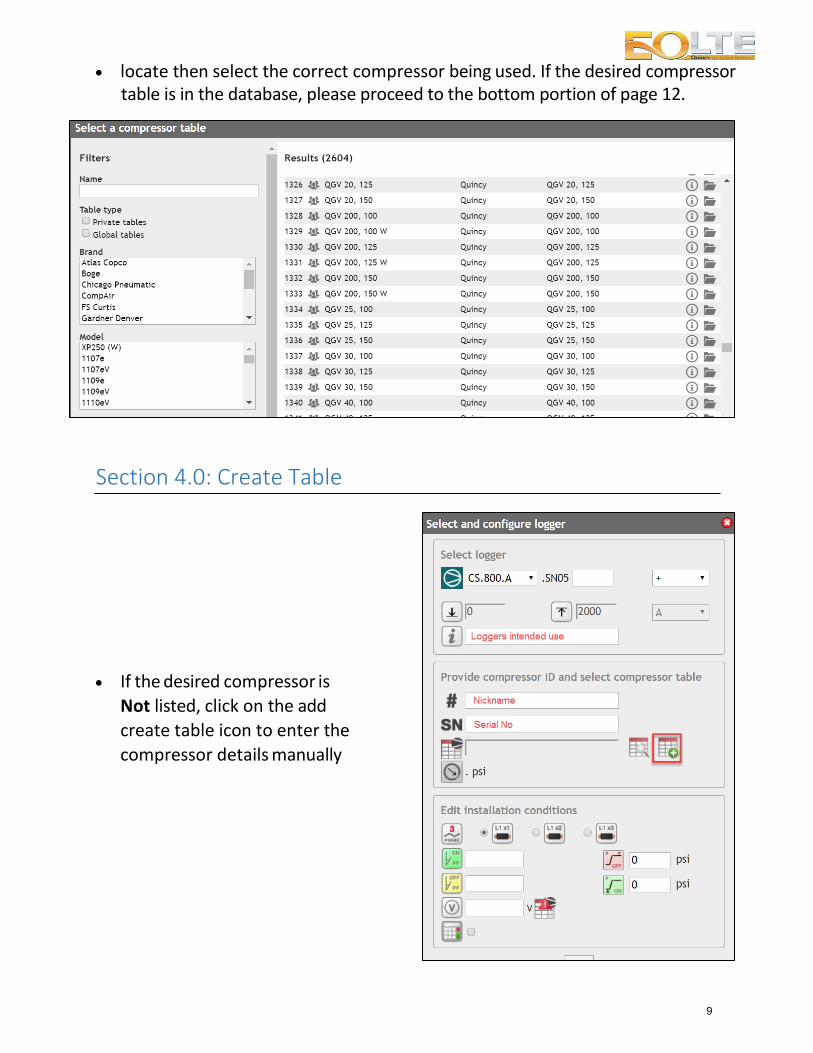
• locate then select the correct compressor being used. If the desired compressor table is in the database, please proceed to the bottom portion of page 12.
Section 4.0: Create Table
• If the desired compressor is Not listed, click on the add create table icon to enter the compressor details manually

10
• If you have a CAGI data sheet for the compressor, click on the “add CAGI table” icon
• Then proceed to enter the data and click “Save” when finish
• If you do Not have a CAGI data sheet for the compressor, click on the “add table” icon

11
• Refer to the EQ LTE Analysis Quick Reference Sheet to easily fill in necessary data for a new compressor
• The Icon will turn green when
complete,
• Click on the next icon
• Fill in the Power and motor data
• Use .9 as default for the Loaded
Power Factor
• Use .55 as default for the Power Factor Offload
• Click on the next icon
• Fill in KW and CFM data from CAGI or tech data

12
• The result is a plot that displays the relationship between input power(kW) and output (cfm)
• Click on the red check to finish creating table
• Click OK to finish configuring the current logger
• When all the desired loggers have been configured, click on the next step to create site & energy profile

13
Shutdown Hrs.: The audit will assume log time is typical operation, if this differs because of shutdowns or holidays you can enter the total number of hours per year
CO2: Only necessary in certain locations
US Gal: Enter the total storage capacity in the system, Supply Side only, or select Poor, Average, and Generous on the right side
• Be sure to add the cost per kWh
• You can also select peak times and add a different kW if this varies.
• Click the next step when complete

14
Section 5.0: USB Cable Method
Important: This step is always completed before any connections at the audit site
Click on the cloud to base icon
Then click on “Download Config Button”
Remember what folder you download to. Make certain no other config.bin files in the folder
Make sure that pop-ups are allowed from this site!!
• Connect Base Station to Computer with USB Cable
• Continue with scanning and press open folder to view files

15
• Copy the ‘config.bin’ file and paste it into Base Station(Scadar)
• Safety Eject USB Cord
• Remember to disconnect base before transferring to loggers
• The next steps be completed from the base station
IF USB METHOD DOES NOT WORK, please try the Ethernet Cable Option in Section 5.1 below.
• Most likely this will have to be done at home
- Does not work at Quincy Locations (Firewall issues)
- Also, will not work at hotels, since you must enter a passcode
- Does not work by plugging into your laptop

16
Section 5.1: Ethernet Cable Option
• Turn on Base Station by plugging in the power supply
• Connect the Base Station to the internet using the Ethernet CAT 5e cable
- Internet Connection must be a DSL or cable modem without a password
• On the Base Station, navigate to the Cloud to Base
• Then press the enter button (shown to the right) to download the configured audit

16
At the Installation Work Instructions
Contents Section 1.0: Cloud to Base ................................................................................................................................. 17
Section 2.0: Base to Loggers ........................................................................................................................ 18
Section 3.0 Logging information........................................................................................................................ 20
Section 3.1: Connecting Current Loggers .......................................................................................................... 22
Section 3.2: Connecting Pressure Loggers ............................................................................................... 25
Section 4.0: Loggers to Base .............................................................................................................................. 26
Section 5.0: Base to Cloud ........................................................................................................................... 27
Section 6.0: Uploading Data to Computer ................................................................................................... 28

17
Section 1.0: Cloud to Base
IMPORTANT: See the last section in the ‘Configuring an Audit’ work instructions before continuing
• The following steps will be completed from the base station
• Use back arrow to get to the menu
on the left side, use down arrow to advance to the next menu, Cloud to base, here you will upload your audit data from the cloud to the base station
• Once there is a green check mark in in the cloud to base icon, the audit has been successfully transferred to the Base Station.
Newly downloaded audits from
Audit configuration available for selection
Base station active audit
Maximum 25 audit configurations
1 active audit allowed at a time
Base station is not a mass storage device

18
• Use arrows to arrow down to next step and select your audit file
• VERY IMPORTANT THAT YOUR AUDIT IS SELECTED BEFORE DOWNLOADING TO LOGGERS!!
Section 2.0: Base to Loggers
• Use down arrow to move to Base to Logger. Here you will use the Bluetooth button on each logger to load data from base station to each logger. It is best to select one logger at a time.

19
The data loggers must be within a 10m/33ft range to connect via Bluetooth.

20
• Again, note the check mark, ensure that you have a green check mark, signifying that this step is complete.
• Repeat this process for all loggers that will be in use
The data loggers can now be taken to the audit location and installed for the duration of the audit. The Base Station will not be required until after the data loggers finish collecting data for the audit.
Section 3.0 Logging information
• Now the loggers are logging no data, and the light will have a slow blink with the test button is pressed.
• The logger automatically recognizes when it is logging actual data. The
loggers are set and ready to be installed.
• Once installed and logging data you will see a change in light blink pattern, the pressure will have a rapid flash, while the KW logger will blink twice then pause and blink once.
An explanation of condition feedback follows...

21
• EQ LTE data loggers are intentionally designed with simplicity of operation and long battery life in mind, they therefore do not feature complex cable interconnects or a complex user interface. Logger software is intuitive and therefore requires no operator intervention. Instead, once a data logger is armed (completion of the Base to Logger step using your EQ LTE Base station) it's working! So how do you know if it’s actually doing something...
• On the bottom right of each data logger, you will find a single diagnostic KEY
and a RED LED above. You can press this diagnostic key at any time. Pressing this key has no effect on data logging! Once pressed the RED LED will pulse to offer condition feedback. The RED LED will self-extinguish after 5 minutes.

22
Section 3.1: Connecting Current Loggers
• Observe the wiring of the control box and directional flow of the current.

23
• Before using the amp clamp on the current logger, make sure that the arrow on the side of the amp is pointing in the same direction as the incoming power.
• The amp clamp should be clamped around the L1 wire.

24
• To measure the voltage of a unit, connect the red and black voltage clamps to L2 and L3 as shown in the image above.
For successful auditing always install as shown
Never install sensors downstream of a VSD frequency inverter
If voltage and power factor cannot be established the Quincy Site will default to ‘calculate my kW’
The loggers typically need to collect data for about 7 days The loggers also can collect a max of 14 days of data

25
Section 3.2: Connecting Pressure Loggers
• The pressure logger can be connected to any compressed air outlet throughout a plant to collect data.
• Locate the pressure sensor in such a way as to avoid moisture or other forms of debris forming on the sensor element.

26
• Ideally, mount the pressure sensor up right
• For common system pressure, mount the pressure sensor at a location where the sensor is exposed to the ‘common’ system pressure of all compressors in the system at all times. For example, a common pipe work header or a compressed air storage vessel...
Section 4.0: Loggers to Base
• When the logging is complete the data will need to be uploaded from the loggers to the base station.
• Very important to select the correct
audit in the file menu on the base station.
• Use arrows and navigate to loggers to base icon

27
• Use the Bluetooth button on the loggers to upload data from the loggers to the base station
• Again, note the check mark, ensure that you have a green check mark, signifying that this step is complete.
Section 5.0: Base to Cloud
• Navigate with the arrows to the Base to Cloud icon
• Click the enter icon to begin downloading the data from the Base Station to the cloud.
• The green check is an indication that the process was successful and you can now proceed to view your audit at the Quincy Site.

28
Section 6.0: Uploading Data via USB Cable Method
• Once the base to cloud step is complete, the data can be up loaded to the computer.
• Plug Base station to a power source and connect to your computer via USB
cable.
• In the audit configuration options, click on the Base to Cloud icon then click on the Upload Package button in the upper right corner.
The icons on the left will not turn green until after you have uploaded the package successfully

29
• Find and double click on the ‘PACKAGE.BIN’ file saved inside the base station “BS_DRIVE” or “SCADAR(E:)”
When complete, you should see all green icons on the left part of the screen and a notification on the right of the screen that the package has been successfully uploaded
IF USB METHOD DOES NOT WORK, please try the Ethernet Cable Option in Section 5.1 on the next page.

30
Section 5.1: Ethernet Cable Option
• Turn on Base Station by plugging in the power supply
• Connect the Base Station to the internet using the Ethernet CAT 5e cable
- Internet Connection must be a DSL or cable modem without a password
• On the Base Station, navigate to the Base to Cloud
• Then press the enter button (shown to the right) to download the configured audit

31
Analysis and Simulation Work Instructions
Contents Section 1.0: Analyzing Data on quincy.scadar.net ............................................................................................ 32
Section 2.0: Chart Wizard ............................................................................................................................ 33
Section 2.1: Creating Style Template ....................................................................................................... 34
Section 3.0: Graph Wizard ........................................................................................................................... 35
Section 3.1: Creating Style Template ....................................................................................................... 38
Section 4.0: Simulation Wizard ................................................................................................................... 39
Section 5.0: Publish Wizard ......................................................................................................................... 49
Section 5.1: Using Quincy Built-in Report Template ................................................................................ 50
Section 5.2: Creating Custom Report Template ....................................................................................... 52

32
Section 1.0: Analyzing Data on quincy.scadar.net
Go to the Audit Wizard and select your audit, then synchronize your audit data. If there are any changes that need to be made, you can go back in your audit configuration, make the necessary changes and the click the “RE-SYNC” button.
At this point you can use the Wizards to analyze your data. Select the Chart Wizard, Graph Wizard or Simulation Wizard.

33
Section 2.0: Chart Wizard
The Chart Wizard landing page layout is shown below. from this landing page, you can create and select stylesheets, choose pre-configured chart options, and review the selected audit data status. To begin, click the blank style sheet.
Select your desired pre-configured chart options (hover over icons for details), then select the audit and click the Run Wizard Wand icon.

34
The page shown below is the Charting page and here you can create more charts
or save the current charts to the audit folder by clicking the Save charts icon.
Section 2.1: Creating Style Template
To create a stylesheet from the selected pre-configured charts, click on the Save as style sheet icon to create the template.

35
Select the stylesheet to create the new template, then click OK.
Section 3.0: Graph Wizard The Graph Wizard landing page layout is shown below. from this landing page, you can create and select stylesheets, choose pre-configured graph options, and review the selected audit data status.

36
Select your desired pre-configured graph options (hover over icons for details),
then select the audit and click the Run Wizard Wand icon.
The page shown below is the Graphing page and here you can create more graphs or edit your current graphs (hover over icons for details).

37
In the Graphing page, you can zoom in on a certain time during the collection of data by clicking and dragging or manually entering the time.
You can also save the current graphs to the audit folder by clicking the Save graphs icon.

38
Section 3.1: Creating Style Template
The same as Chart Wizard, to create a stylesheet from the selected pre- configured graph, click on the Save as style sheet icon to create the template.
Select the stylesheet to create the new template, then click OK.
39
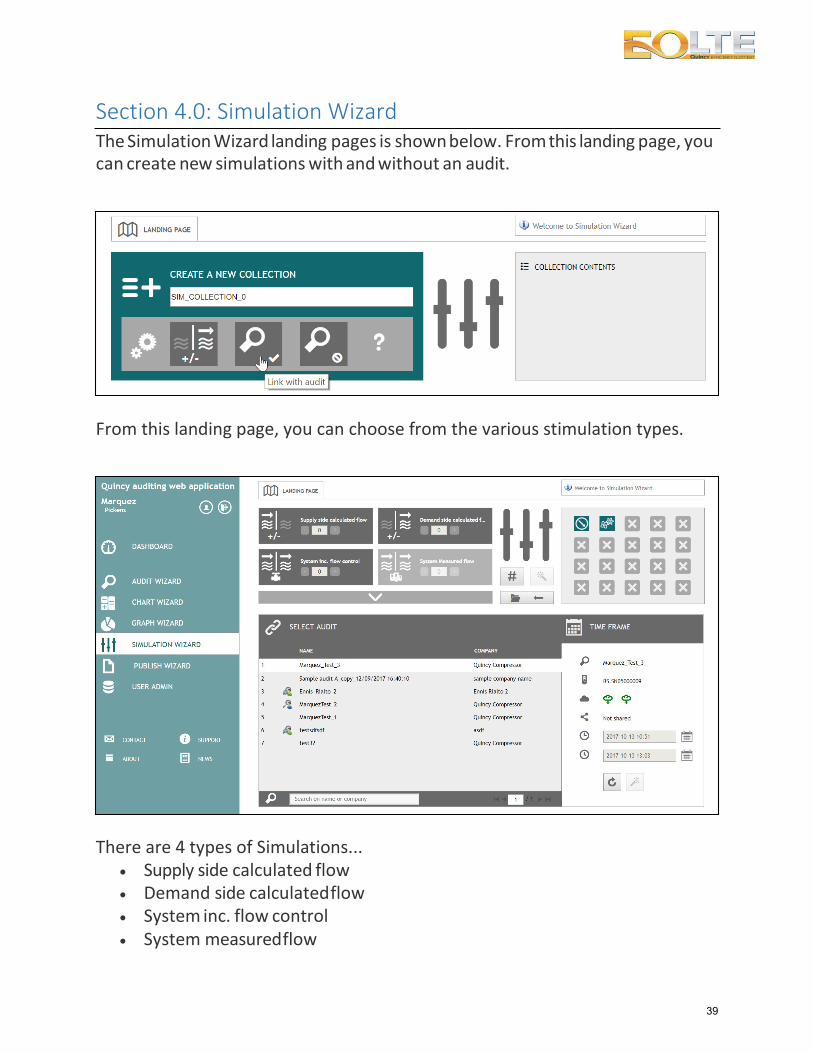
Section 4.0: Simulation Wizard The Simulation Wizard landing pages is shown below. From this landing page, you can create new simulations with and without an audit.
From this landing page, you can choose from the various stimulation types.
There are 4 types of Simulations...
• Supply side calculated flow
• Demand side calculated flow
• System inc. flow control • System measured flow

40
Each Simulation type has a dedicated icon which is referenced throughout Simulation Wizard as well as any corresponding Simulation Report PDF outputs (discussed elsewhere).
The following icons are taken from the Simulation Wizard - Landing page and include 'quantity' of Simulations selection. Within a Simulation collection, users can produce multiple Simulations and of distinct types. If a given Simulation type is unavailable, it is either because the appropriate data loggers were not present (e.g. if no flow logger is present then the System measured flow Simulation type will be grayed out) or the Simulation is not linked to a compressed air audit.
Supply side calculated flow:
This Simulation type focuses on compressed air generation.
System inc. flow control:
This Simulation type provisions for the addition of a flow control device where compressed air generation equipment is typically installed in groups either side of a flow control device with a 'base' pressure target used for equipment downstream of the flow control device and a 'trim' pressure target used for equipment upstream of the flow control device.
System measured flow:
This Simulation type substitutes calculated flow (calculated flow is derived from the respective 'compressor tables') for measured flow which is derived from one or a group of flow sensors.

41
This Simulation type is only available for Simulations that are linked to a compressed air audit!
Demand side calculated flow:
Demand side calculated flow focuses on compressed air 'process' demand. Process demand is derived by considering 'System volume' (a value configured in Audit Wizard when a site and energy profile was established) and System pressure characteristics. This Simulation type is only available for Simulations that are linked to a compressed air audit and where 'System pressure' was logged!
The Simulator page layout is shown below:
The Simulator page consists of... • The Simulator tool bar
• The Simulation tab navigation bar
• The Simulation tool bar

42
• The Graph area
• The Chart area
• The text annotation area
The Simulator tool bar:
The Simulator tool bar contains 'info, save, print PDF 'annual' simulation collection, print 'time span' simulation collection, tariff and 'toggle full screen' buttons. Consistent with other Wizards there's an information window located top right which will annunciate information messages from time to time...
• The info button toggles a popup which displays the Simulation collection
name, the linked audit (if any) as well as the audit start and end time
• The save button toggles a popup that allows the user to make save selections...
• Edit the Simulation collection name • Edit the name of each Simulation tab within the Simulation collection • Exclude (discard) selected Simulation tab or tabs from the save action • Save the Simulation collection
• The print PDF 'annual' simulation button toggles a popup that allows the user to make print PDF choices relating to all 'Annual' simulations contained within the Simulation collection...
• Exclude selected Simulation tab or tabs from the print action (Note: selections that are included in the print action will form part of a single PDF file)
• Optionally upload a title page image for the Simulation report PDF (e.g. your company logo)
• Edit the Simulation report PDF name • Print the Simulation report to PDF
• The print PDF 'time span' simulation button toggles a popup that allows the user to make identical print PDF choices relating to all 'Time span' simulations contained within the Simulation collection
• The tariff button toggles a popup that displays the tariff table and permits changes that affect the average tariff used (Note: SCADAR uses an

43
average tariff in monetary calculations which is derived from the tariff table)
• The toggle full screen button offers the user the option to toggle between a screen contained within a browser (initial) web page or full screen (Note: full screen mode offers significantly more SCADAR application 'screen real estate'. SCADAR recommends users to toggle 'full screen' for a better SCADAR experience!)
The Simulation tab navigation bar:
The Simulation tab navigation bar consists of 5 buttons (from left to right)... • Add an additional simulation to the Simulation collection
• Navigate to first Simulation tab
• Navigate left
• Navigate right
• Navigate to last Simulation tab
The Simulation tool bar (shown below with the Simulation tab navigation bar above):
The Simulation tool bar consists of equipment icons and selection buttons placed in a 'two row' arrangement. The two-row arrangement provides for a RED 'before' and BLUE 'after' simulation display...
• When a user first lands on the Simulator page, the RED line may or may not
be populated with equipment icons (shown above)... • If the Simulation is not linked to an audit, a + button will display
allowing the user to create an equipment configuration from equipment contained in the library...

44
• If the audit is linked to an audit, the equipment configuration audited
will display (shown above) • When a user first lands on the Simulator page, the BLUE line will not be
populated with equipment icons. Users can choose to 'Lock & copy' the equipment configuration from the RED line onto the BLUE line or use the + button to create a new / alternative equipment configuration for the BLUE line
• When a user copies the RED line to the BLUE line, the RED line is locked!
• To re-edit the RED line, use the 'lock & copy' button to go back • Equipment icons on the RED line may or may not be re-ordered. This
feature aims to preserve the integrity of known audit data... When a Simulation is linked to an audit and the high and low pressure set-points for 'all equipment' was entered (i.e. actual or known pressure set-point information) during the Audit Wizard step, the equipment icons cannot be re-ordered! If equipment icons can be re-ordered (equipment pressure set- points are either not known or is incomplete) simply drag and drop the equipment icons as required...

45
• If equipment pressure set-points are not known, EQ LTE assumes target system pressure is a nominal 6 BAR (or PSI equivalent) and assumes the compressor cascade configuration. This can be edited!
• Select the respective air compressor and edit its pressure set-points and save changes...
• The equipment icon popup features delete and include / exclude buttons, when grayed out these buttons cannot be used (e.g. shown above, the delete and include / exclude icons are grayed out to preserve the integrity of known audit data)
• Similarly, and as discussed earlier, if the equipment pressure set- points are known (entered during the Audit Wizard step) the pressure set-point fields will be grayed out!
• The target system pressure on the RED line will equal the lower pressure set point of the last compressor in the pressure cascade
• There's a pressure unit indicator on the right side
• Complete configuration of the RED line before proceeding to edit the BLUE line! Once a user either 'locks and copies' the RED line to the BLUE line or the user begins adding equipment to the BLUE line, no further edits to the RED line are permitted!
The Simulation tool bar with the RED line copied to the BLUE line...
Further notes relational to configuration of the BLUE line... • You can re-order equipment
• You can edit compressor pressure set-points

46
• You can include or exclude equipment from the Simulation tab
• You can permanently delete equipment from the Simulation tab
• You can add alternative equipment to the Simulation tab
• Add alternative equipment to the Simulation tab from the library...
The Graph area (Annual Simulation sub tab shown):
The Graph area displays 'RED' specific efficiency, 'BLUE' specific efficiency as well as annual utilization (discussed elsewhere) and the before and after pressure. The legend can be used to include or exclude legend items from the display. Hovering over graph elements will display additional graph properties

47
(e.g. RED System pressure shown for the third compressor in the cascade displayed).
There's a file save button located on the left of the graph area...
The popup permits the user to...
• Give the Graph image a name (default name shown)
• Save the Graph image to the user’s audit folder
• Download the image to your device (e.g. PC)
The Chart area (Annual Simulation sub tab shown)
Column description: 1. Annual Utilization %
1. For Simulations that are not linked to an audit the 'Annual Utilization' is an assumption
2. For Simulations that are linked to an audit the 'Annual Utilization' is derived from the audit data
3. For practical reasons, Annual Utilization is grouped into segments of 10% starting with 0 - 10% and ending with 90 - 100%
2. Annual Utilization hours 1. Utilization hours is relational to Utilization %

48
2. Utilization hours can be edited 1. Use the padlock to unlock the hour values for edit 2. Edit as necessary 3. Observe that the total must equal 8760 hours (or 1 year)
1. Utilization + Running off load + Stopped + System shutdown = 8760
2. For Simulations that are linked to an audit, 'System shutdown hours' is taken from Audit Wizard - Step 3 'configure site and energy information'
3. Flow 4. kW relational to flow (RED) 5. kW relational to flow (BLUE) 6. kW savings (RED - BLUE) 7. kW savings - annual (RED - BLUE) 8. Monetary savings - annual (RED - BLUE)
Row description: • Column icon & padlock button
• 0 - 10%, ... • 90 - 100%
• System off load running hours
• System topped hours
• System shutdown hours
• Summary Simulation totals for RED energy, BLUE energy as well as energy, cost & CO2 savings
The text annotation area:
Use the text annotation area to annotate information that you would like to include in the Simulation Report PDF (discussed elsewhere).

49
Section 5.0: Publish Wizard The Publish Wizard landing page layout is shown below. From this landing page, you can create and select report templates, choose pre-configured Quincy audit report, edit current reports, and create PDF of an audit.
Its normal for some users can experience page load delay. The faster the internet connection speed, the faster the cloud server can respond.

50
Section 5.1: Using Quincy Built-in Report Template
To begin this process to use the Quincy pre-configured report templates click on the grey portion of the Edit Basic icon (shown in the red circle below).
Click on the Reset template to default icon (see picture below). Then Quincy pre- configured report template will have been created. If you don't reset their template to default, you will not see the template that has been created your use.

51
Once the Reset template to default have been pressed, click the save icons and save report as Basic.
From the Publish Wizard landing page you should now be able to use the Quincy pre-configured report by selecting the desired audit and clicking the Run wizard icon.

52
Here you can make any additional edits or add attachments from the audit folder and you can also convert the document to a PDF. (Any writing in red in the report should be changed to the suggested information)
Section 5.2: Creating Custom Report Template
To begin this process to create a custom report template click on the grey portion of the Edit Custom 1 icon (shown in the red circle below).

53
If the report is not already blank, click the Update to blank icon to begin editing the blank document.
Use the Add graph/chart container icon to add new figures and use the headed/footer icon to insert a company logo or page number to the report. When you are done editing, use the Reset template to default and save icons to create the new custom 1 report template.
The same process can be done to obtain the advance template