Embed Size (px)
Citation preview

Confidential & Proprietary • Copyright © 2007 The Nielsen Company
The rise and rise of the ethical consumer
Jonathan Banks
20 February 2008

Confidential & ProprietaryCopyright © 2007 The Nielsen Company
Agenda• Consumer concerns• Consumer behaviour• Manufacturer and retailer responses: sales/growth
Confidential & ProprietaryCopyright © 2007 The Nielsen Company
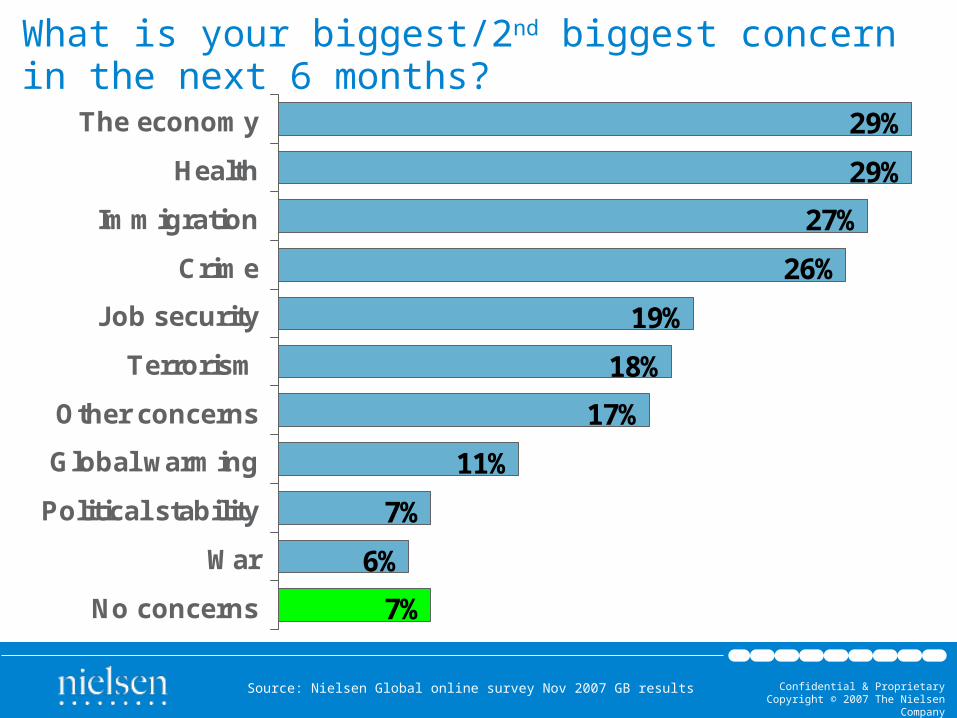
What is your biggest/2nd biggest concern in the next 6 months?
29%
29%
27%
26%
19%
18%
17%
11%
7%
6%
7%
The economy
Health
Immigration
Crime
Job security
Terrorism
Other concerns
Global warming
Political stability
War
No concerns
Source: Nielsen Global online survey Nov 2007 GB results

Confidential & ProprietaryCopyright © 2007 The Nielsen Company
GDP per capita vs. Household spend on food
Sources: UN; International Labour Organization; allcountries.org; National Bureau Of Statistics of the The Peoples Republic Of China; swivel.com; World Resources Institute; International Finance Corporation; & Namibia Community and Household Surveillance (CHS) Findings, Oct. 2006.
India
Russia
Namibia*China
Brazil
Japan
France
Spain
Greece
Norway
SwedenFinland
Denmark
U.K.
U.S.
R2 = 0.8
Household Spend on Food (%)
GD
P P
er
Ca
pit
a, U
S $
* Household spend on food (%) for Caprivi, Kavango, Ohangw ena, Omusati, Oshana, and

Confidential & ProprietaryCopyright © 2007 The Nielsen Company
4 megatrends: Fairtrade can address them all
Health/Well-Being
Ethical
Convenience/Practicality
Indulgence/Pleasure

Confidential & ProprietaryCopyright © 2007 The Nielsen Company
Organic (y2) and Fairtrade (y1) drive sustainability buzzBuzz share for key categories, as a % of sustainability discussion
0.0%
0.5%
1.0%
1.5%
2.0%
2.5%
3.0%
3.5%
4.0%
% o
f S
usta
inab
ilit
y M
en
tio
ns f
or
All
Tre
nd
s
Excep
t O
rgan
ic
0%
10%
20%
30%
40%
50%
60%
Org
an
ic a
s a
% o
f S
us
tain
ab
ilit
y M
en
tio
ns
Fair Trade Plastic Packaging CSA Organic
Source: Nielsen BuzzMetrics
n = 241,227 messages about sustainability, between 7/01/2006 and 6/30/2007
CSAs = Community Supported Agriculture
Confidential & ProprietaryCopyright © 2007 The Nielsen Company
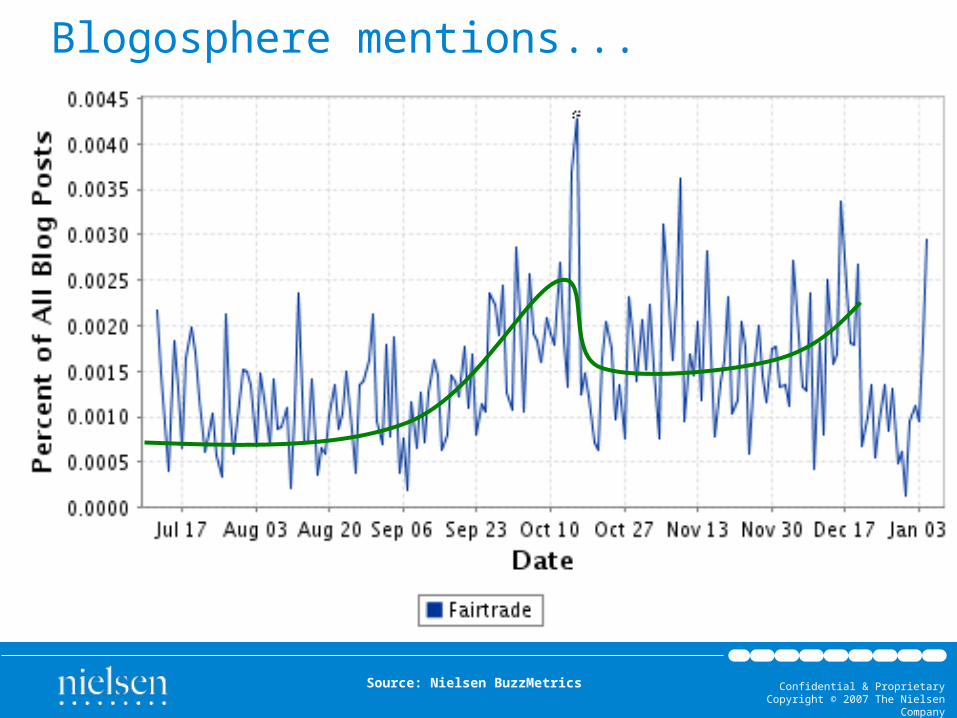
Blogosphere mentions...
Source: Nielsen BuzzMetrics

Confidential & ProprietaryCopyright © 2007 The Nielsen Company
Fairtrade topics of discussion
Source: Nielsen BuzzMetrics 2007

Confidential & ProprietaryCopyright © 2007 The Nielsen Company
In competition with other offerings...
46%
38%
36%
36%
29%
25%
25%
17%
16%
13%
Products with minimum/no packaging
Products in recyclable packaging
Products without pesticides
Products not tested on animals
Fair Trade products
Products from a Farmers Market
Energy efficient products or appliances
Ethically produced or grown products
Organic products
None of these
Source: Nielsen Homescan Survey 2007
Confidential & ProprietaryCopyright © 2007 The Nielsen Company
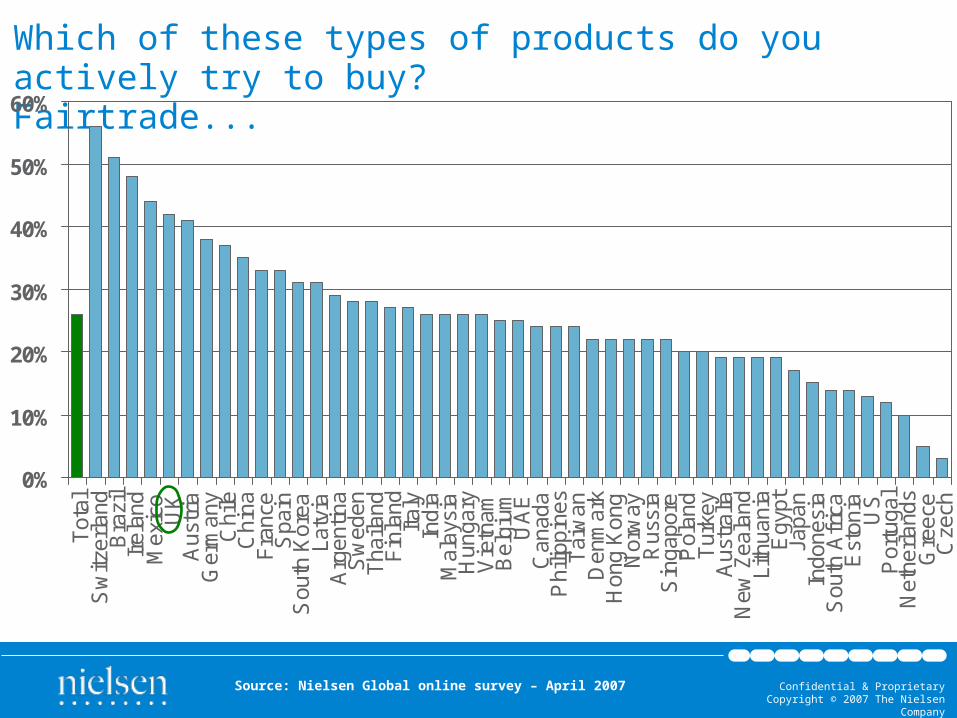
Which of these types of products do you actively try to buy?Fairtrade...
0%
10%
20%
30%
40%
50%
60%T
otal
Sw
itzer
land
Bra
zil
Irel
and
Mex
ico
UK
Aus
tria
Ger
man
yC
hile
Chi
naF
ranc
eS
pain
Sou
th K
orea
Latv
iaA
rgen
tina
Sw
eden
Tha
iland
Fin
land
Italy
Indi
aM
alay
sia
Hun
gary
Vie
tnam
Bel
gium
UA
EC
anad
aP
hilip
pine
sT
aiw
anD
enm
ark
Hon
g K
ong
Nor
way
Rus
sia
Sin
gapo
reP
olan
dT
urke
yA
ustr
alia
New
Zea
land
Lith
uani
aE
gypt
Japa
nIn
done
sia
Sou
th A
fric
aE
ston
iaU
SP
ortu
gal
Net
herla
nds
Gre
ece
Cze
ch
Source: Nielsen Global online survey – April 2007
Confidential & ProprietaryCopyright © 2007 The Nielsen Company
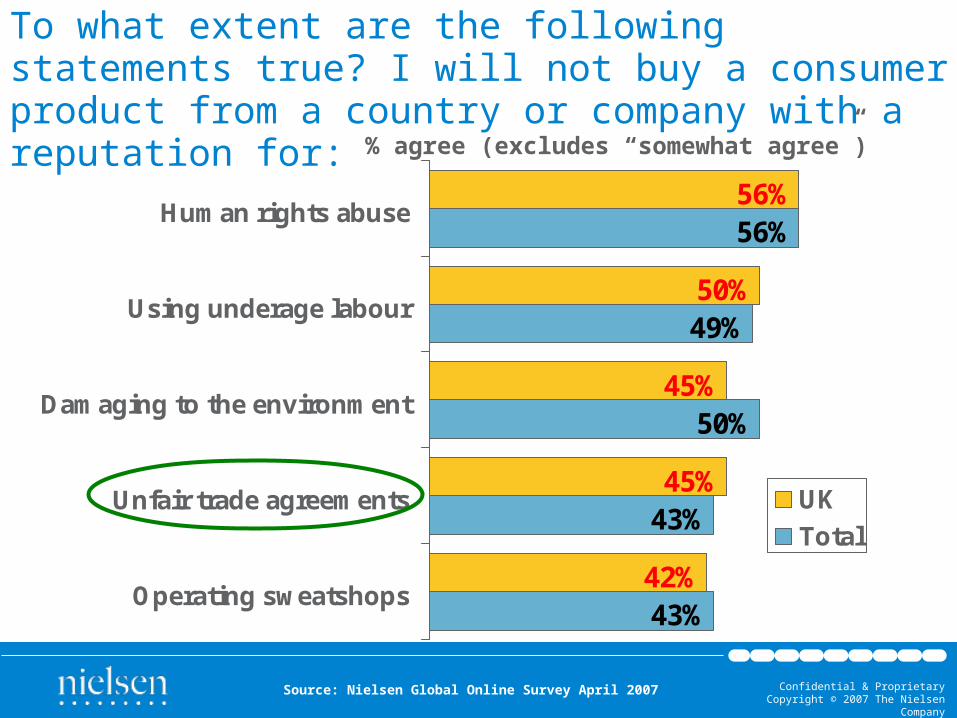
To what extent are the following statements true? I will not buy a consumer product from a country or company with a reputation for:
43%
43%
50%
49%
56%
42%
45%
45%
50%
56%
Operating sweatshops
Unfair trade agreements
Damaging to the environment
Using underage labour
Human rights abuse
UK
Total
% agree (excludes “somewhat agree”)
Source: Nielsen Global Online Survey April 2007

Confidential & ProprietaryCopyright © 2007 The Nielsen Company
Fairtrade sales: Denmark
•0
1.000
2.000
3.000
4.000
5.000
6.000
7.000
8.000
9.000
•W46
04
•W50
04
•W01
05
•W05
05
•W09
05
•W13
05
•W17
05
•W21
05
•W25
05
•W29
05
•W33
05
•W37
05
•W41
05
•W45
05
•W49
05
•W01
06
•W05
06
•W09
06
•W13
06
•W17
06
•W21
06
•W25
06
•W29
06
•W33
06
•W37
06
•W41
06
•W45
06
•W49
06
•W01
07
•W05
07
•W09
07
•W13
07
•W17
07
•W21
07
•W25
07
•W29
07
•W33
07
•W37
07
•W41
07
•1.000 kr.
Source: Nielsen scanning data
2005 2006 2007

Confidential & ProprietaryCopyright © 2007 The Nielsen Company
US Fair trade coffee imports

Confidential & ProprietaryCopyright © 2007 The Nielsen Company
0
1
2
3
4
5
6
7
8
Source: Nielsen ScanTrack £m Grocery Multiples For Fair Trade Includes Co-Op
Fairtrade fortnights highlighted
1st-13th March
6th-19th March
26th Feb-11th March
Weekly sales in Grocery Multiples
2005 2006 2007
£m
£280m +47%

Confidential & ProprietaryCopyright © 2007 The Nielsen Company
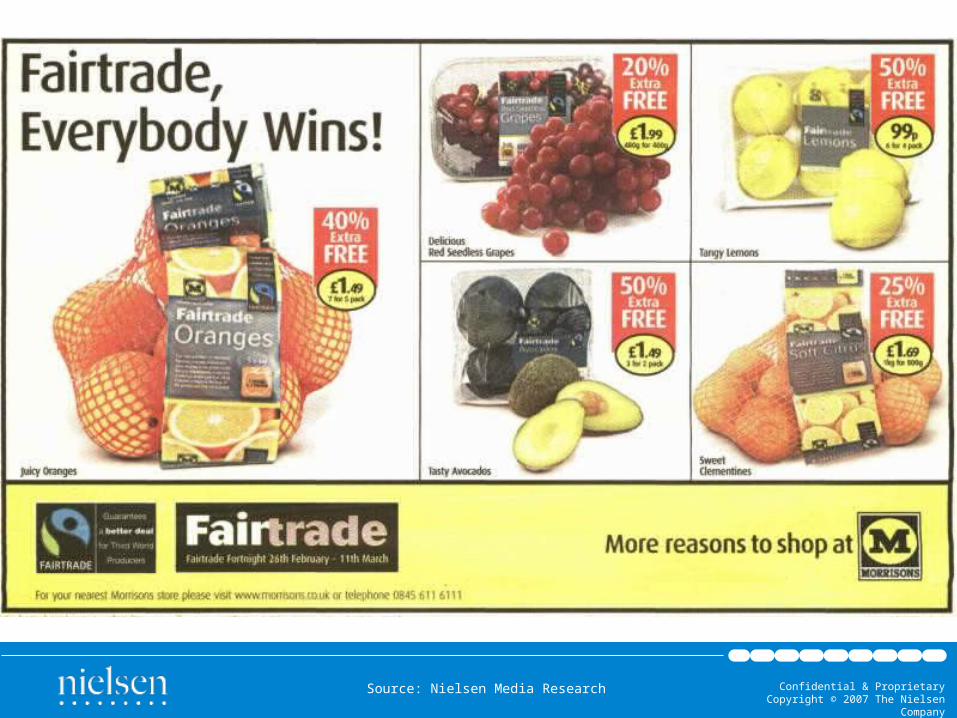
80. 'Fairtrade' foodContinuing to expand our ranges of ‘Fairtrade’ food including converting all
our jams, conserves, and bagged sugar to
‘Fairtrade’ and offering more ‘Fairtrade’ fruit, wine
and other products.81. 'Fairtrade' clothing
Converting 20 million clothing garments
including £5 plain t-shirts, women’s strappy vests
and oxford shirts to ‘Fairtrade’ cotton – equal to 10% of all M&S cotton
use.
Source: Nielsen Media Research
Confidential & ProprietaryCopyright © 2007 The Nielsen Company
Source: Nielsen Media Research

Confidential & ProprietaryCopyright © 2007 The Nielsen Company
Source: Nielsen Media Research

Confidential & ProprietaryCopyright © 2007 The Nielsen Company
Fairtrade lines stocked
136128
87100
5649
70
145134
116 115
85 84 80
Co-op
Tesco
Wai
trose
Sainsb
ury
Morri
sons
Asda
M&S
2006 2007
Source: Nielsen Homescan
Confidential & ProprietaryCopyright © 2007 The Nielsen Company
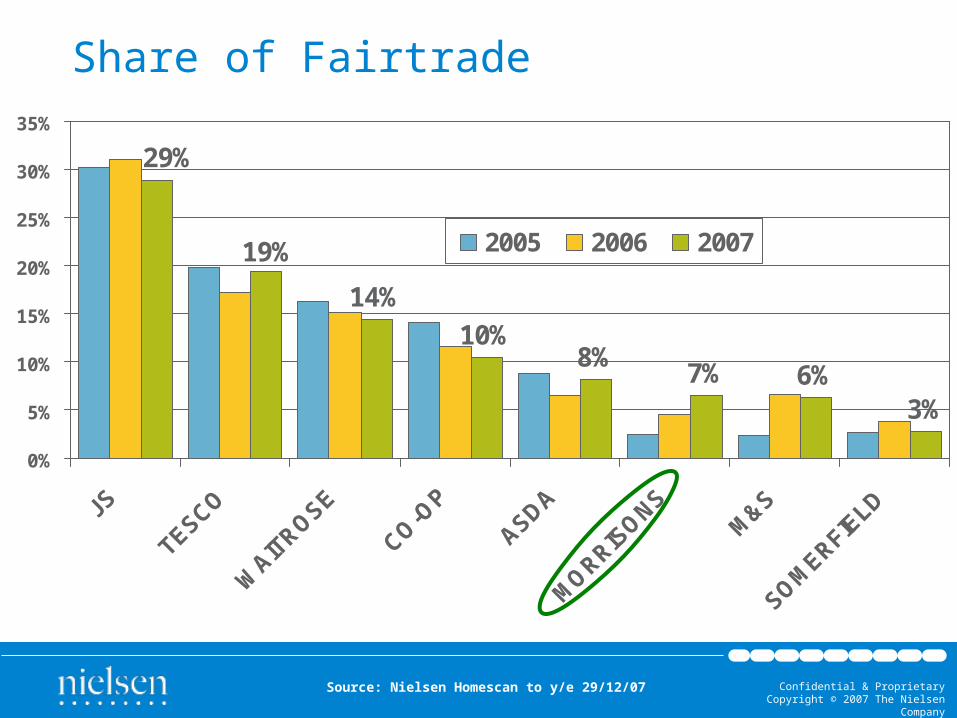
Share of Fairtrade
14%
10%8%
7% 6%3%
29%
19%
0%
5%
10%
15%
20%
25%
30%
35%
JS
TESCO
WAIT
ROSE
CO-O
P
ASDA
MO
RRISO
NSM
&S
SOM
ERFIELD
2005 2006 2007
Source: Nielsen Homescan to y/e 29/12/07
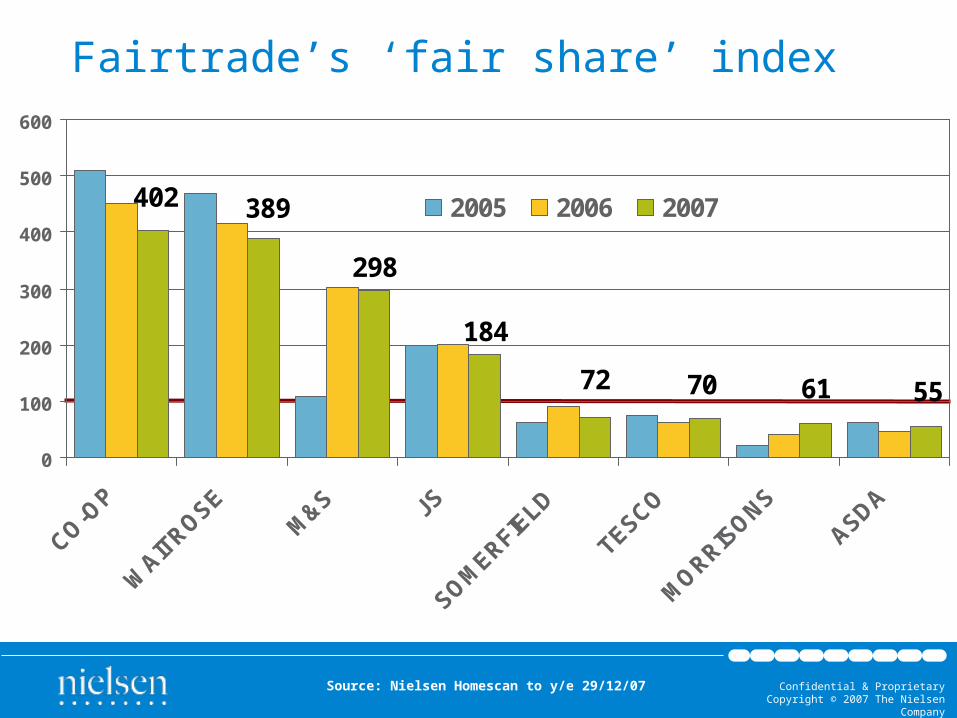
Confidential & ProprietaryCopyright © 2007 The Nielsen Company
298
184
5572 61
402
70
389
0
100
200
300
400
500
600
2005 2006 2007
Fairtrade’s ‘fair share’ index
Source: Nielsen Homescan to y/e 29/12/07

Confidential & ProprietaryCopyright © 2007 The Nielsen Company
Source: Nielsen Media Research
Confidential & ProprietaryCopyright © 2007 The Nielsen Company
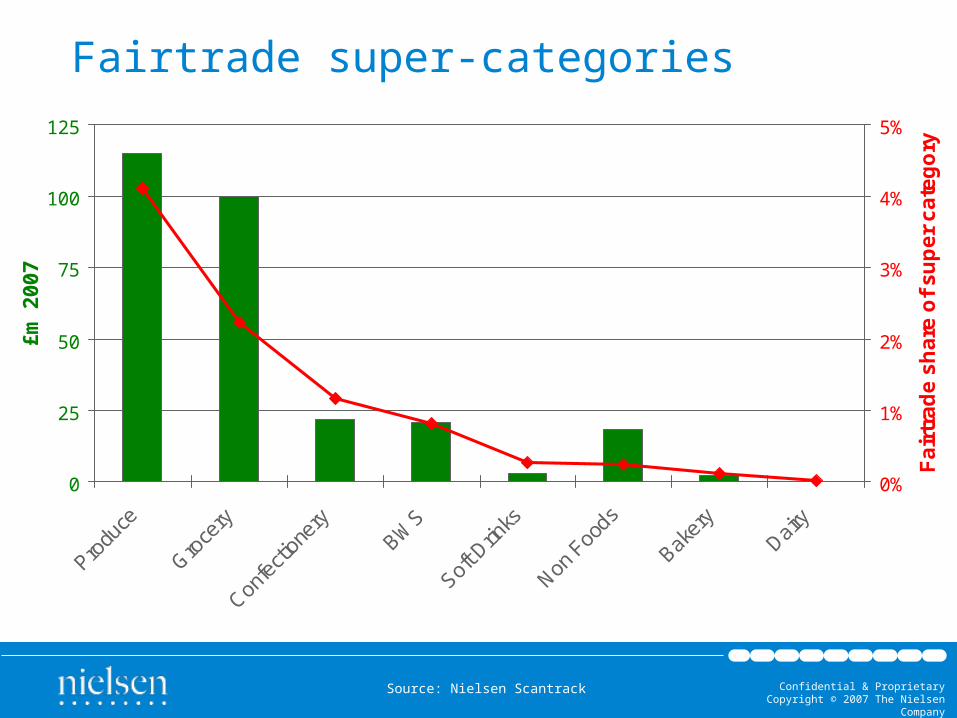
Fairtrade super-categories
0
25
50
75
100
125
Pro
duce
Gro
cery
Con
fecti
oner
y
BW
S
Sof
t Drin
ks
Non
Foo
ds
Bak
ery
Dair
y
£m
20
07
0%
1%
2%
3%
4%
5%
Fa
irtr
ad
e s
ha
re o
f s
up
er
ca
teg
ory
Source: Nielsen Scantrack

Confidential & ProprietaryCopyright © 2007 The Nielsen Company
Fairtrade: top category shares21%
20%19%
16%7%
6%6%
5%5%
5%4%
4%4%
3%3%
3%2%
2%2%2%
Hot Beverages - CocoaHot Beverages - Ground CoffeeChocolate - Plain Moulded Bars
Produce - BananasProduce - Oranges (fixed weight)
Produce - LemonsCooking Aids - Demerara Sugar
Preserves - MarmaladesProduce - Pineapple
Hot Beverages - Instant CoffeePreserves - Jams
Hot Beverages - Tea BagsCooking Aids - Cooking Chocolate
Dried Foods - Hot CerealsChocolate - Milk Recipe BarsHot Beverages - Packet Teas
Produce - MangoProduce - Satsumas
Hot Beverages - Drinking ChocolateIce-Cream
Source: Nielsen Scantrack

Confidential & ProprietaryCopyright © 2007 The Nielsen Company
Fairtrade: top categories - £m92
27
25
18
18
18
10
9
5
5
4
4
3
3
3
3
3
32
Produce - Bananas
Hot Beverages - Instant Coffee
Hot Beverages - Ground Coffee
DIY & Gardening (Cut flowers)
Hot Beverages - Tea Bags
Wines
Chocolate - Plain Moulded Bars
Dried Foods - Hot Cereals
Produce - Oranges (fixed weight)
Produce - Pineapple
Preserves - Jams
Ice-Cream
Chocolate - Milk Moulded Bars
Produce - Lemons
Produce - Grapes
Preserves - Marmalades
Soft Drink - Pure Fruit & Veg Drinks
Chocolate - Milk Recipe Bars
Produce - Satsumas
Source: Nielsen Scantrack

Confidential & ProprietaryCopyright © 2007 The Nielsen Company
Fairtrade sales on promotionAverage sold on promotion for all products: 25%
11
1413 13
12 1110
98
TOTAL JS
MORRIS
ONS
SOM
ERFIELD
CO-OP
M&S
ASDA
TESCO
WAIT
ROSE
Source: Nielsen Homescan y/e 29/12/07

Confidential & ProprietaryCopyright © 2007 The Nielsen Company
Average price per pack indexed on 2005
-5.8
1.1
-3.2
-4.5
-3.1
1.1
3.5
0.7
COFFEEGROUND
COFFEEINSTANT
TEA BAGS TEA PACKETS
2006 2007
Source: Nielsen Homescan y/e 29/12/07

Confidential & ProprietaryCopyright © 2007 The Nielsen Company
Fairtrade from the consumer’s viewpoint...
Source; Nielsen Homescan survey
% agree

Confidential & ProprietaryCopyright © 2007 The Nielsen Company
Media Exposure
Agree
Neither Agree
nor Disagree Disagree
Index Index IndexDaily Mail 20% 100 103 95Daily Star 2% 72 102 128Daily Telegraph 7% 129 90 84Metro 5% 122 100 75The Guardian 3% 220 51 50The Independent 2% 195 57 67The Times 5% 157 83 65Daily Express 6% 96 111 86Daily Mirror 9% 87 113 93The Sun 18% 66 113 115Local Daily Newspaper 18% 106 99 96Other daily newspaper 6% 116 105 73Do not read any daily newspapers 32% 99 94 111
I prefer to buy Fair Trade Products.
Thinking about daily
newspapers, which of the
following do you read at least once a week
All Households
Source: Nielsen Homescan

Confidential & ProprietaryCopyright © 2007 The Nielsen Company

Confidential & ProprietaryCopyright © 2007 The Nielsen Company
Caution...• “What’s the relevance of the ‘parrot’ logo?”• “Low commodity prices are caused by over-supply”• “Any subsidy or protection scheme is wrong”• “Fair trade schemes encourage further over-production”• “Fair trade rewards inefficient producers”• “Only a small proportion of the premium I pay reaches the producer”• “Makes things worse for producers outside Fair trade schemes”• “Wrong for Fair trade schemes to align with big multi-national
manufacturers and retailers”• “Better to help poor farmers add value to a basic crop or• grow something with higher demand (and therefore price)”• “I choose better ways to give money to charity”• “Fairtrade quality is lower than other similarly priced alternatives”• “Manufacturers and retailers have an obligation to their shareholders to
maximise (optimise) profit”• “There are so many different logos on packs it’s confusing”• “Accreditation bodies are just there to make money for themselves”

Confidential & ProprietaryCopyright © 2007 The Nielsen Company
Summary
• Ethical consumption– awarenessattitudesbehaviour
• Fairtrade ‘competes’ with other offerings• +47%• Co-op, Waitrose, M&S and JS overindex• Top categories: bananas, coffee, flowers, tea• Prices lower than 2005
– but 48% agree “too expensive”
• Confusion• Integrity

Confidential & ProprietaryCopyright © 2007 The Nielsen Company
Closing thought on the health of your customers and the planet...
“It is not your duty to finish the work, but neither are you free to neglect it.”
Source: Rabbi Tarfon, Pirke Avot, Talmud