Embed Size (px)
Citation preview

Int. J. Electrochem. Sci., 7 (2012) 9781 - 9794
International Journal of
ELECTROCHEMICAL SCIENCE
www.electrochemsci.org
Conductometric and Spectroscopic Determination of
Mebeverine Hydrochloride and the Solubility Products of its Ion
Recognition Species
Marwa S. Elazazy*, Manal S. Elmasry, Wafaa S. Hassan
Analytical Chemistry Department, Faculty of Pharmacy, Zagazig University; Zagazig, Egypt *E-mail: [email protected]
Received: 28 August 2012 / Accepted: 18 Sepember 2012 / Published: 1 October 2012
Conductometric and spectroscopic determination of Mebeverine hydrochloride (MVH), a widely used
antispasmodic, with two precipitating reagents; phosphomolybdic acid (PMA) and silver nitrate
(AgNO3) has been investigated. Exploiting the conductometric procedure, the equilibrium constants
and other functions associated with the process of precipitating MVH were determined. Moreover, two
new maneuvers towards equivalence point detection were carried out. In this itinerary, data processing
was performed applying numerical derivatization (first and second derivatives) and Boltzmann
algorithm. The newly prescribed techniques were found to be more reasonable compared to the
classical routine in terms of impartiality and rationality. The described procedures allowed the
determination of MVH within the range of 2-15 mg using PMA and 1-20 mg using AgNO3
respectively. The molar ratio and as confirmed by the molar conductance – mole ratio plots, reveal that
(1:1) (drug: reagent) ion associates are formed for both reagents with MVH. Furthermore, the
precipitate obtained by ion pairing MVH with PMA has been spectroscopically characterized using IR
and 1H-NMR. The method was further applied successively to pharmaceutical formulations containing
MVH and the results obtained were favorably compared with those obtained using the official method.
Keywords: Conductometry; Mebeverine HCl; Solubility product; Differential conductivity,
Boltzmann sigmoid plot, Spectroscopy.
1. INTRODUCTION
Mebeverine hydrochloride (MVH) is chemically known as (RS)-4-(ethyl[1-(4-
methoxyphenyl)propan-2-yl]amino)butyl 3,4-dimethoxybenzoate hydrochloride “Scheme 1”.
Mebeverine belongs to a category of anti-spasmodics known as musculotropic drugs and is used
largely in treatment of irritable bowel syndrome and gastrointestinal spasm secondary to organic
disorder [1,2]. The official procedure described in B.P.2007
[2] depends on non-aqueous

Int. J. Electrochem. Sci., Vol. 7, 2012
9782
potentiometric titration with 0.1 M perchloric acid for the determination of MVH in its parent form.
Several methods have been reported in literature for the determination of this drug either per se or in
formulations. In this concern, the following techniques have been described: Spectrophotometric
methods [3-9], Electrochemical methods
[10-12] and Chromatographic methods [13-16].
Scheme1. Mebeverine HCl
Considering the widespread usage of MVH as an OTC drug in Egypt and many countries in the
area, there was a need to have a simple, cost-effective technique for the determination of MVH and its
formulations. In this course; interactions between MVH and two precipitating agents, AgNO3 and
PMA have been investigated both by spectroscopic and conductometric techniques. Both titrants have
been used for quantitative determination of many pharmaceutical compounds applying conductometric
procedure [17-22].
Moreover and bearing in mind that the sharpness of the endpoint is greatly dependent on the
solubility of the formed ion-pairs [22-25]; the conductance data were employed to calculate the
solubility products and so the equilibrium constant of the considered precipitation reactions.
A major concern that will be thoroughly considered through this article is the availability of an
accurate recipe for locating the endpoint and accordingly the corresponding drug concentration, an
issue that affects the validation of the studied procedure in terms of accuracy and reproducibility [26].
By and large, the endpoint is established via an experiential graphical process that depends the
intersection of two straight lines as the equivalence point. Generally, it is not easy to substantiate a
precise break point using this procedure and to a great extent it is human contingent. Analysis of
conductivity/concentration data employing the differential conductivity schemes [27-32] and the
integral of Boltzmann type sigmoid [27, 32] has been expansively inspected with the purpose of
locating an accurate cmc of drugs and surfactants.
The current paper implies the use of the differential conductivity methods and Boltzmann
model “without integration” for locating the equivalence point. The first derivative data were fitted to a
built-in non-linear regression model while approximations to Gaussians of the second derivative data
were followed to locate the endpoint. The rationale behind such exploitation of data is to surmount the
uncertainty coming up from establishing the endpoint as the break in the conductance-volume curves.
Additionally, structural elucidation of MVH-PMA ion associate was performed using IR and 1H-NMR.

Int. J. Electrochem. Sci., Vol. 7, 2012
9783
2. EXPERIMENTAL
2.1. Apparatus
HANNA Conductivity/TDS Meter (HI 8033), with a HANNA Conductivity Probe (HI
76301W) was used. FT-IR measurements were recorded as KBr disks using Mattson 1000
spectrophotometer, Micro analytical Center, Cairo University, Giza. 1H-NMR spectra were measured
in DMSO, using AvanceII 600 MHz NMR spectrometers.
2.2. Materials and reagents
All employed chemicals were of analytical grade and doubly distilled water was used
throughout the study. Mebeverine Hydrochloride (MVH) was provided by EIPICO, Egypt; (M.wt =
466.01 g/mol and its purity was found to be 99.83 % according to B.P. method [2]). Pharmaceutical
formulation (Spasmotaline® tablets; 100 mg of MVH/tablet), was obtained from local pharmacy stores.
Silver Nitrate (AgNO3), and Phosphomolybdic acid (PMA) were obtained from Aldrich. The 5 x 10⁻³
mol.l-1
and 0.1% (w/v) (drug and reagent) solutions were prepared in doubly distilled water.
2.3. Procedure for pure pharmaceuticals
Aliquots of the standard drug solution containing 1 – 20 mg of MVH were transferred into the
titration cell and the volume was made with water up to 50 ml. The conductivity cell was immersed in
and the solution was titrated with 5 x 10⁻³
M of the titrant using a microburette. The conductance was
measured 2 minutes subsequent to each addition of the reagent after thorough stirring. A conductivity
(corrected for dilution) vs volume plot for a particular titrant was constructed and the end point was
determined. The nominal content of MVH was calculated using the following equation:
Amount of the drug (mg) = VMR / N
where V = volume (mL) of the titrant consumed in the titration, M = relative molecular mass of
the analyte, R = molarity of the titrant, and N = number of moles of the titrant consumed per one mole
of the analyte.
2.4. Mole Ratio
Mole ratio was established using a fixed concentration of the drug and varying concentrations
of the titrants. The tested drug concentrations were (2 x 10⁻⁴
mol.l-1
and 5 x 10⁻⁴
mol.l-1
), while the
reagent concentrations were (0 – 6 x 10⁻⁴
mol.l-1
and 0 – 1 x 10⁻³
mol.l-1
) using PMA and AgNO3
respectively. The experimental data were fitted to a non-linear predefined fitting model (PSI Plot
software).

Int. J. Electrochem. Sci., Vol. 7, 2012
9784
2.5. Preparation of ion-associates
The ion associate with PMA was prepared by mixing solutions containing 10-2
M of PMA, and
the requisite amount of MVH. The precipitate obtained was filtered, thoroughly washed with water,
and dried at room temperature. The precipitate was subjected to IR and 1H-NMR spectroscopy [33].
2.6. Procedure for Tablets
An amount of pulverized tablets equivalent to 100 mg of the active ingredient were weighted
accurately and transferred into a 100 mL conical flask. The drug was extracted three times with 30 mL
of distilled water. After extraction, the flask was washed with a few mL of water, then, combined
washings, and extracts were filtered into a 100 mL volumetric flask. The volume was completed with
distilled water. The nominal content of the active component in tablets was determined as described in
the Procedure section.
2.7. Conductometric Determination of the Solubility Products for Ion-Exchangers:
The conductivities of solutions of different concentrations (C) were measured at 25˚C for
MVH, PMA and AgNO3. The specific conductivities (Ks), corrected for the effect of dilution, were
calculated and used to get the equivalent conductivities (Λ) of these solutions.
Plots of Λ vs. √C were constructed and ΛoMVH, ΛoPMA and ΛoAgNO3 were obtained from the
intercept of the respective straight lines with the Λ axis. The activity coefficients of the ions employed
were taken as unity because all the solutions were sufficiently dilute. The values of ΛoMVH-PMA and
ΛoMVH-AgNO3, were calculated using Kohlrausch's law of independent migration of ions [34]. The
solubility (S) and solubility product (Ksp) values of a particular ion associate were calculated using the
following equations;
S = Ks x 1000/ Λo “ion-associate” (1)
Ksp = S2 (for 1:1 Ion Associates) (2)
K = 1/ Ksp (3)
where, "Ks" are the specific conductivity of the saturated solution of the ion associate and Λo is
the intercept of the Λ vs. √C curve.
3. RESULTS AND DISCUSSION
3.1. Conductometric Procedure
In this paper, formation of ion- associates between two precipitating agents and MVH has been
shown. Both titrants were found to react with MVH forming stable ion pairs with different aqueous

Int. J. Electrochem. Sci., Vol. 7, 2012
9785
solubilities. The formed ion associate complexes, which can be perceived as a transition stage between
two different systems, create the featured shape of the titration curve. Accordingly, and following the
classical procedure, conductivity/volume plots show a linear behavior - with a smooth transition - prior
to and after the inflection point. The drug concentration can be determined at this point by intersecting
the two straight lines. A model titration curve is shown in Figure 1. Deeming that conductivity is a
linear function of dilution, dilution factor was calculated using the equation: Xcorr. = Xobs. [(v1 + v2) /
v1]; where Xcorr. and Xobs. are the corrected and observed conductance values, respectively; v1 is the
initial volume, and v2 is the volume of the added reagent [35].
Volume of Titrant (mL)
0.0 1.0 2.0 3.0 4.0 5.0 6.0 7.0 8.0 9.0 10.0 11.0 12.00
20
40
60
80
Con
du
ctiv
ity
(
S/cm
)
3.00
3.50
4.00
4.50
5.00
5.50
6.00
Silver Nitrate
Phosphomolybdic Acid
Figure 1. Conductometric titration curve of 15 mg MVH titrated with 0.005 mol/L of both reagents.
The endpoint is located following the conventional procedure.
3.2. Reaction Mechanism and Molar Ratio
Using PMA as a titrant and as shown in Figure 1, the investigated system showed a steady
increase in conductance values up to the equivalence point, where a gradual change in the slope
transpires. Subsequent to this point, the measured conductance halted to increase linearly and became
lower than anticipated. This divergence from linearity can be attributed to formation of an ion-
associate, presumably, by replacing the drug cations (MVH+) with the highly mobile H
+ ions, so the
conductivity increases. After the endpoint, more acid reagent is added and the conductivity increases
more rapidly [36]. A curve break is noted at a drug-reagent molar ratio of 1:1, for all curves
constructed using the conventional scheme, Figure 1. Plots of molar conductance – mole ratio, Figure
2, were used to confirm this finding. As seen in this figure, the molar conductance showed a regular
rise as the concentration of PMA increases. This increase starts to recede at the point where [D]/[R] is

Int. J. Electrochem. Sci., Vol. 7, 2012
9786
around unity. The following equation describes the reaction mechanism and the expected structure of
the ion pair is given in Scheme 2:
MVH+.Cl
- + H3(PMA) {[MVH] [H2(PMA)]}(s)+ H
+
When AgNO3 was used as a titrant, silver chloride precipitated and the first segment of the
titration curve was linear. The second part of the curve corresponded to the excess of AgNO3 [17, 18].
Monitoring the molar ratio against the molar conductance, Figure 2, showed that addition of AgNO3
resulted in almost no change in molar conductance. This comportment started to deviate at the point
where [D]/[R] comes to unity, confirming the 1:1 molar ratio. Right after this point the molar
conductance showed an increase demonstrating the presence of more mobile species compared to the
first segment. The reaction can be represented by the following equation:
MVH+.Cl
- + AgNO3 MVH
+.NO3 + AgCl(s)
[DT]/[RT]
-0 1 2 3 4 5 60
100
200
300
400
500
600
700
800
m
(S. c
m2. m
ol-1
)
16
26
36
46
56
66
AgNO3 - Experimental
AgNO3 - Calculated
PMA - Experimental
PMA - Calculated
Figure 2. Molar Conductance – Mole ratio plots for the complexes of PMA and AgNO3 with MVH in
pure water. Experimental values are represented by Close geometries while the calculated
values are represented by open ones. Calculated values are obtained by fitting the experimental
values using non-linear least squares fitting algorithm. Indistinguishable geometries indicate
that experimental and calculated points are the same within the resolution of the plot.
3.3. Conductivity – Volume Data Analysis:
The classical procedure for locating the endpoint has been described in the previous sections,
Figure 1. The chief intricacy encountered trailing this technique came from the weak curvature
observed around the intersection point of the two straight lines. Besides, a few number of data points

Int. J. Electrochem. Sci., Vol. 7, 2012
9787
affects to a great extent the value of the endpoint [27, 32]. Consequently, there was a need for a more
objective and a methodical prescription that prevails the negative features of the so-called conventional
procedure. In the present endeavor, two proposals were considered. The first plan depended on
numerical derivatization of the raw data, while in the second, experimental figures were implemented
into a Boltzmann type model.
One of the suggested schemes was the mathematical differentiation of the obtained
conductivity data against the corresponding reagent volume, Figure 3. Applying the first derivative
mode, the endpoint was located as the halfway point-on the fitted line-between two shoulders. For a
second derivative, data were fitted to Gaussian and the endpoint was located as the curve maximum
and as defined by the fitting parameters. Such maneuver provides an equitable and a procedural
protocol that prevails over the inadequacies of the classical procedure. Alternatively, the process of
numerical handling of data creates unusual behavior represented in a noisy first derivative sigmoid
(figure is not shown). Noticeably, this problem stems from consolidating the instinctive experimental
errors. These errors, in turn, are amplified after the numerical processing.
Volume of Silver Nitrate (mL)
1 2 3 4 5 6 7 8
/V
-0.60
-0.10
0.40
0.90
1.40
1.90
2.40
/V
2
-1.00
-0.50
0.00
0.50
1.00
1.50
2.00
2.50
3.005.11 mL
5 mL
First Derivative
Second Derivative - Fitted Line
Figure 3. Conductometric titration of 11.65 mg MVH with 5x10
-3 M AgNO3 applying the numerical
first derivative plot (Δκ/ΔV), fitted to a PSI-Plot predefined non-linear regression model and
numerical second derivative plot (Δ2κ/ΔV
2), fitted to Gaussian. Arrows denote the equivalence
points determined by each contrive.
The other proposal, Boltzmann paradigm, was suggested in an attempt to avoid the errors
encountered by the arithmetical derivatization of conductivity data. Besides, being a predefined model
in most of softwares, Boltzmann type sigmoid, provides a straightforward and simple correlation
between the function parameters and the conductivity-volume curve characters. This model has been
described by the following equation [27, 32]:

Int. J. Electrochem. Sci., Vol. 7, 2012
9788
The parameters A1 and A2 stand for the asymptotic value for small and large values of x
respectively, xo represents the endpoint and expressed as the central point of transition and Δx
corresponds to the width of the function. Figure 4 shows the determination of equivalence point
applying Boltzmann type sigmoid. The mathematical expression of Boltzmann shows the simplicity of
this model where the value of xo is simply obtained as f(xo) = (A1+ A2)/2.
An evaluation of the recovery percent and so the error encountered using the endpoint located
by each method is given in Table 1. The shown results do not represent the best case scenario in which
the same endpoint is obtained using the four techniques.
Volume of Silver Nitrate (mL)
0.0 2.0 4.0 6.0 8.0 10.0
(
S/ c
m)
5.0
10.0
15.0
20.0
f (X
)11.1
11.6
12.1
12.6
3 4 5 6 7
5 mL
X0 = 5.049 mL
Corrected Conductivity
f (X) - Fitted Line
A1 = 12.4
A2 = 11.5
Figure 4. Conductometric titration of 11.65 mg MVH with 5x10
-3 M AgNO3 applying the Boltzmann
sigmoid method f(x) compared to the conventional method. Value of x0 stands for the
equivalence point determined using Boltzmann model.
Table 1. A comparison between the four suggested procedures for conductivity – volume data
analysis. AgNO3 was used as a titrant for the determination of 11.65 mg of MVH.
Procedure Found (mg) Recovery % % Error
Conventional 11.65 100.00 0
First Derivative 11.65 100.00 0
Second Derivative 11.90 102.15 2.15
Boltzmann Sigmoid 11.76 100.94 0.94

Int. J. Electrochem. Sci., Vol. 7, 2012
9789
3.4. Determination of Solubility Product
Conductance of the investigated solutions has been employed to find out the solubility product
of the formed precipitates. The solubility products together with the parameters related to ion pairing
of MVH are listed in Table 2 and illustrated in Figure 5. The calculated equilibrium constant values
(K) are high enough to show the high degree of completeness of the ion pairing reactions. At
equilibrium, the solubility of the undissociated ion-associates in water (the intrinsic solubility) was
omitted as it has an insignificant contribution to the total solubility because the ion-associates are
sparingly soluble in water and their saturated solutions are consequently very dilute.
C0.5
[M]1/2
2 3 4 6
e
q (S
.cm
2.m
ol-1
)
-0.50
0.00
0.50
1.00
1.50
2.00
Before Addition of AgNO3
After addition of AgNO3
Figure 5. Equivalent conductance (Λeq.) vs. the square root of concentration C
0.5 for MVH (Before
and After addition of AgNO3). Data points are fitted to straight line described by the equation y
= ax + b.
Table 2. Solubility product constants and other functions related to precipitation of MVH using PMA
and AgNO3:
Ion Associate Solubility (S)
mol/L
KSP K = 1 / Ksp
MVH-PMA 2.73 x 10⁻⁸
7.45 x 10⁻¹⁶
1.34 x 10¹⁵
MVH-AgNO3 3.62 x10⁻¹⁰
1.31×10⁻¹⁹
7.64 x10¹⁸
3.5. IR and 1H-NMR Spectra
Ion pairing of MVH with PMA was investigated by comparing IR, and 1H-NMR spectra of the
formed ion associate with those of the free ligand.

Int. J. Electrochem. Sci., Vol. 7, 2012
9790
3.6. IR Spectra
The IR spectrum of MVH displays characteristic bands at 2945, 1717, 1265 and 1221 cm-1
assigned to νCH (aliphatic), νC₌O (ester) and νC-O (ether) for the last two peaks, respectively. On the other
hand, the IR spectrum of PMA as shown in Figure 6 has two characteristic bands at 1624 and 1065cm-1
due to νsym (P₌O) and νas (P₌O) and a strong, broad peak at 3406 cm-1
due to ν(OH) vibration; respectively.
The IR spectra of the formed ion associate shows a band corresponding to νCH (aliphatic) at nearly the
same frequency (2942 cm-1
) as that of MVH. The band corresponding to the stretching vibrations of
C=O shifted to a lower frequency by ~ 18 cm-1
. In addition, the peak due to νsym (P₌O) is shifted to a
lower frequency by 24 cm-1
. The above arguments indicate that an ion associate has been formed
between MVH and PMA.
Figure 6. IR spectra of MVH, PMA and their ion associate.

Int. J. Electrochem. Sci., Vol. 7, 2012
9791
3.7. 1
H-NMR Spectra
When the ion pair is formed during titration of MVH with PMA, the rapid exchange of MVH
between the ion pair sites and the bulk solution will cause the NMR peak of a set of equivalent protons
to be a collapsed singlet [37]. This is mostly obvious in the two multiples at 1.8 and 1.75 (H3 and H4)
in MVH spectra changed to one singlet at 1.78 in the ion pair spectra. Also the triplet at 1.29 (Hγ)
changed to singlet at 1.25, the doublet at 1.06 (Hα) changed to singlet at 1.05, Table 5. Based on the
above discussion, the following structure for the ion associate “Scheme 2” was suggested:
O O
OMe
OMe
N+
H
OMe
H
2"
3" 5"
6
5'
6' 2'
2
5
7
6"
. H2(Mo O3)12 PO4
Scheme 2. Mebeverine Phosphomolybdate (MVH-PMA) Ion Associate with NMR Numbering.
Table 3. Significant chemical shifts (ppm) of the formed MVH-PMA ion-associate compared to free
MVH:
MVH MVH-PMA
δ 1.88 (2H, m, H3)
δ 1.76 (2H, m, H4)
δ 1.29 (3H, t, Hγ)
δ 1.06 (3H, d, Hα)
δ 1.78 (4H, s, H3 and H4)
δ 1.25 (3H, s, Hγ)
δ 1.05 (3H, s, Hα)
3.8. Analytical Applications
The proposed methods were applied effectively for determination of MVH in its
pharmaceutical dosage forms. The results obtained were validated by comparison with the official
method [2]. No significant difference was found by applying t- and F-tests at 95% confidence level
indicating good accuracy and precision (Table 4). Recovery studies were also carried out. The results
in Tables 4 and 5 indicate good recoveries (99.75 to 100.28% for pure form and 99.68 to 100.03% for
formulations) and confirm that there is no interference from frequently encountered excipients or
additives.

Int. J. Electrochem. Sci., Vol. 7, 2012
9792
Table 4. Quantitative determination of MVH using the proposed PMA and AgNO3 methods compared
to the official method [2]:
Proposed Method
Official Method [2] PMA AgNO3
Taken,
mg
Found,
mg
Recovery
%*
Taken,
mg
Found,
mg
Recovery
%*
2
3
5
10
15
1.99
3.02
5.009
9.902
14.91
99.50
100.66
100.18
99.02
99.40
1
4
8
15
20
0.99
4.03
8.03
15.14
20.03
99.00
100.77
100.48
100.97
100.19
Mean ± SD = 99.75 ± 0.65
n = 5
RSD = 0.65
V = 0.42
SE = 0.29
t = 0.23 (1.83)a
F = 1.61 (5.19)b
Mean ± SD = 100.28 ± 0.77
n = 5
RSD = 0.77
V = 0.59
SE = 0.34
t = 1.16 (1.83)a
F = 2.25 (5.19)b
Mean ± SD = 99.83 ± 0.51
n = 6
RSD = 0.51
V = 0.26
SE = 0.21
a and
b are the Theoretical t-values and F-ratios at p = 0.05.
Table 5. Statistical analysis of results obtained by the proposed methods for the analysis of
Spasmotaline®
tablets (Amriya Co., Egypt) (100 mg of MVH/tablet).
PMA AgNO3
Taken, mg Found, mg Recovery %* Taken, mg Found, mg Recovery %*
1
4
8
15
20
1.001
4.007
7.92
14.91
19.92
100.19
100.19
99.02
99.41
99.60
2
3
5
10
15
2.01
2.98
4.96
10.019
15.14
100.50
99.33
99.20
100.19
100.93
Mean ± SD = 99.68 ± 0.51
n = 5
RSD = 0.51
V = 0.26
SE = 0.22
Mean ± SD = 100.03 ± 0.74
n = 5
RSD = 0.74
V = 0.55
SE = 0.33
4. CONCLUSION
In this work, we have shown by means of conductivity and spectral data that MVH forms 1:1
ion pair complexes with PMA and AgNO3. The proposed procedure is very simple, accurate and can
be readily adopted for routine analysis in quality control laboratories. Additionally, the proposed
methods can be easily applied for determination of MVH in pharmaceutical formulations.
Int. J. Electrochem. Sci., Vol. 7, 2012
9793
A comparison between the proposed models for data processing showed that fitting the
experimental data directly into the proposed Boltzmann model is more acceptable for data
manipulation compared to both the classical and the mathematical derivatization approaches. Provided
that the endpoint is directly defined in this model, Boltzmann type sigmoid can be viewed as a
technique of choice, particularly when transition occurs in a steady way. The errors encountered due to
proposing the fitting parameters were incomparable to those obtained by data processing.
With the small divergences observed between the conventional and numerical schemes, which
most probably come from data processing, it might seem more appropriate to have such figures
directly from the raw data without further processing, which finally brings in flawed results. However,
the availability of a systematic procedure that does not depend on the researcher’s decisive factors in
addition to having many processing schemes to select from outweighs these defects.
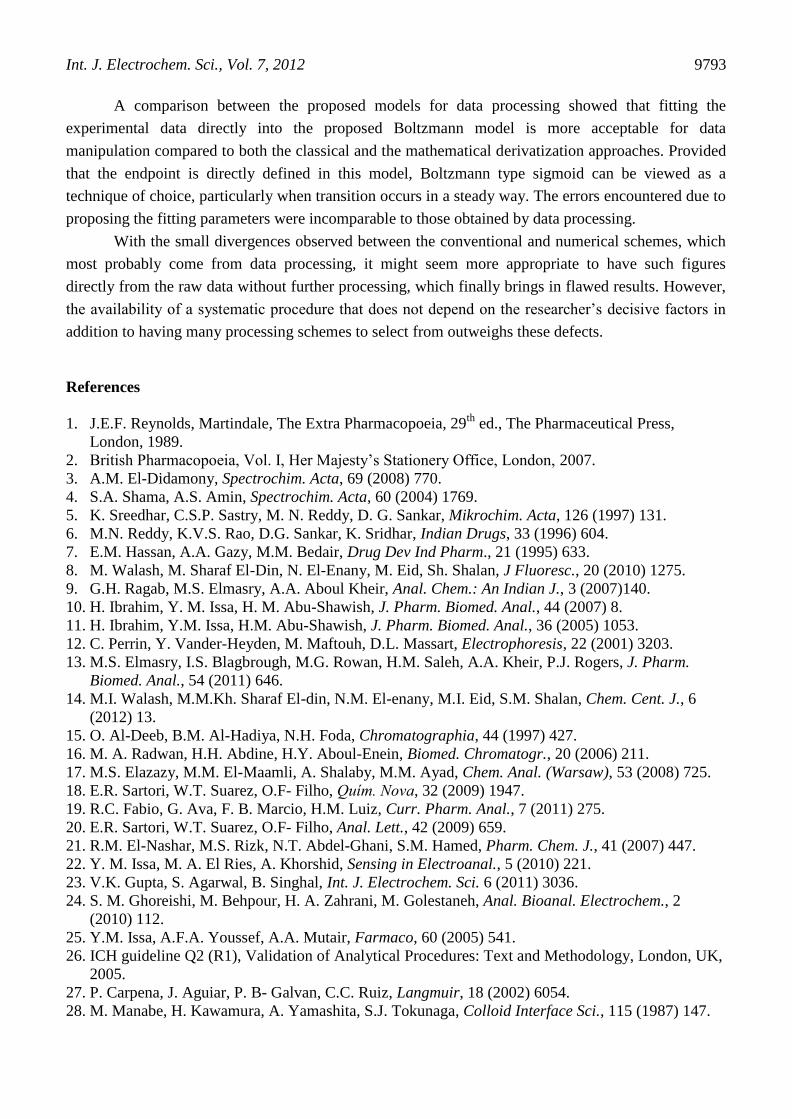
References
1. J.E.F. Reynolds, Martindale, The Extra Pharmacopoeia, 29th
ed., The Pharmaceutical Press,
London, 1989.
2. British Pharmacopoeia, Vol. I, Her Majesty’s Stationery Office, London, 2007.
3. A.M. El-Didamony, Spectrochim. Acta, 69 (2008) 770.
4. S.A. Shama, A.S. Amin, Spectrochim. Acta, 60 (2004) 1769.
5. K. Sreedhar, C.S.P. Sastry, M. N. Reddy, D. G. Sankar, Mikrochim. Acta, 126 (1997) 131.
6. M.N. Reddy, K.V.S. Rao, D.G. Sankar, K. Sridhar, Indian Drugs, 33 (1996) 604.
7. E.M. Hassan, A.A. Gazy, M.M. Bedair, Drug Dev Ind Pharm., 21 (1995) 633.
8. M. Walash, M. Sharaf El-Din, N. El-Enany, M. Eid, Sh. Shalan, J Fluoresc., 20 (2010) 1275.
9. G.H. Ragab, M.S. Elmasry, A.A. Aboul Kheir, Anal. Chem.: An Indian J., 3 (2007)140.
10. H. Ibrahim, Y. M. Issa, H. M. Abu-Shawish, J. Pharm. Biomed. Anal., 44 (2007) 8.
11. H. Ibrahim, Y.M. Issa, H.M. Abu-Shawish, J. Pharm. Biomed. Anal., 36 (2005) 1053.
12. C. Perrin, Y. Vander-Heyden, M. Maftouh, D.L. Massart, Electrophoresis, 22 (2001) 3203.
13. M.S. Elmasry, I.S. Blagbrough, M.G. Rowan, H.M. Saleh, A.A. Kheir, P.J. Rogers, J. Pharm.
Biomed. Anal., 54 (2011) 646.
14. M.I. Walash, M.M.Kh. Sharaf El-din, N.M. El-enany, M.I. Eid, S.M. Shalan, Chem. Cent. J., 6
(2012) 13.
15. O. Al-Deeb, B.M. Al-Hadiya, N.H. Foda, Chromatographia, 44 (1997) 427.
16. M. A. Radwan, H.H. Abdine, H.Y. Aboul-Enein, Biomed. Chromatogr., 20 (2006) 211.
17. M.S. Elazazy, M.M. El-Maamli, A. Shalaby, M.M. Ayad, Chem. Anal. (Warsaw), 53 (2008) 725.
18. E.R. Sartori, W.T. Suarez, O.F- Filho, Quím. Nova, 32 (2009) 1947.
19. R.C. Fabio, G. Ava, F. B. Marcio, H.M. Luiz, Curr. Pharm. Anal., 7 (2011) 275.
20. E.R. Sartori, W.T. Suarez, O.F- Filho, Anal. Lett., 42 (2009) 659.
21. R.M. El-Nashar, M.S. Rizk, N.T. Abdel-Ghani, S.M. Hamed, Pharm. Chem. J., 41 (2007) 447.
22. Y. M. Issa, M. A. El Ries, A. Khorshid, Sensing in Electroanal., 5 (2010) 221.
23. V.K. Gupta, S. Agarwal, B. Singhal, Int. J. Electrochem. Sci. 6 (2011) 3036.
24. S. M. Ghoreishi, M. Behpour, H. A. Zahrani, M. Golestaneh, Anal. Bioanal. Electrochem., 2
(2010) 112.
25. Y.M. Issa, A.F.A. Youssef, A.A. Mutair, Farmaco, 60 (2005) 541.
26. ICH guideline Q2 (R1), Validation of Analytical Procedures: Text and Methodology, London, UK,
2005.
27. P. Carpena, J. Aguiar, P. B- Galvan, C.C. Ruiz, Langmuir, 18 (2002) 6054.
28. M. Manabe, H. Kawamura, A. Yamashita, S.J. Tokunaga, Colloid Interface Sci., 115 (1987) 147.

Int. J. Electrochem. Sci., Vol. 7, 2012
9794
29. M. Fujiwara, T. Okano, T. -H. Nakashima, A. A. Nakamura, G. Sugihara, Colloid Polym. Sci., 275
(1997) 474.
30. C.C. Ruiz, Colloid Polym. Sci., 277 (1999) 701.
31. I. Garcı´a-Mateos, M.M. Vela´squez, L.J. Rodrı´guez, Langmuir, 6 (1990) 1078.
32. A.F.A. Youssef, R.A. Farghali, Canadian J. of Anal. Sci. and Spec., 51 (2006) 288.
33. Vogel’s ‘Textbook of Quantitative Chemical Analysis’, 5th
ed., Longman, London, 1989.
34. L. L. Andropov. Theoretical Electrochemistry, Izdatelstvo Mir: Moscow, 1977.
35. J. J. Lingane. Electroanalytical Chemistry, 2nd edition, Chapter 9, Interscience, New York 1958,
pp.188.
36. Y. M. Issa, A. F. Shoukry, R. M. El-Nashar, J. Pharm. Biomed. Anal., 26 (2001) 379.
37. D. W. Larsen, A. C. Wahl, Inorg. Chem.,4 (1965) 1281.
© 2012 by ESG (www.electrochemsci.org)


![Conductometric Study of Complex Formation Between Cu(II) Ion …downloads.hindawi.com/journals/jchem/2008/364510.pdf · Conductometric Study of Complex Formation 553 where [ML +],](https://img.dokumen.tips/doc/110x75/5e6821b14cfdc3147d3edc6d/conductometric-study-of-complex-formation-between-cuii-ion-conductometric-study.jpg)