Embed Size (px)
Citation preview

Document généré le 24 juin 2018 23:58
Géographie physique et Quaternaire
Conditions for Growth and Retreat of the LaurentideIce Sheet
William F. Budd et Ian N. Smith
La calotte glaciaire laurentidienneVolume 41, numéro 2, 1987
URI : id.erudit.org/iderudit/032683arDOI : 10.7202/032683ar
Aller au sommaire du numéro
Éditeur(s)
Les Presses de l'Université de Montréal
ISSN 0705-7199 (imprimé)
1492-143X (numérique)
Découvrir la revue
Citer cet article
Budd, W. & Smith, I. (1987). Conditions for Growth and Retreatof the Laurentide Ice Sheet. Géographie physique etQuaternaire, 41(2), 279–290. doi:10.7202/032683ar
Résumé de l'article
Les résultats obtenus à partir de la modélisation numériquetri-dimensionnelle des calottes glaciaires de l'Amérique duNord selon les variations de l'insolation des latitudes sontexaminés en fonction des conditions à l'origine de laformation et du retrait des inlandsis. L'existence du dernierinterglaciaire est nettement le résultat des hauts niveauxantérieurs d'insolation estivale et très peu celui desparamètres climatiques. L'ampleur et la durée du derniermaximum glaciaire permettent de préciser les paramètresclimatiques en cause. Entre ces deux périodes, l'importance dela progression des glaciers et de leur retrait subséquent estgrandement influencée par l'albédo de la calotte glaciaire. Leschangements temporels de l'insolation, du climat, de lacouverture de glace et de l'enfoncement du substratum sontdécalés les uns par rapport aux autres, résultant en undéséquilibre. La répartition des altitudes de la surface terrestrejoue un rôle clé dans le processus de formation de la calotteglaciaire, ainsi que des récurrences, de la coalescence et duretrait subséquents. On peut s'attendre à ce que le mode dedispersion des dépôts glaciaire expriment davantage lesphases de croissance et de récurrence de la calotte glaciaireque sa configuration maximale. En dernier lieu selon lemodèle, les cycles de glaciation au cours des 500 000 dernièresannées suivent l'apparition de niveaux extrêmes d'insolationle long d'une large bande de 40° à 80° de latitude, en raison del'obliquité de l'écliptique et des caractéristiques du périhéliesurimposés à l'effet d'hystéréris causé par la couverture deglace.
Ce document est protégé par la loi sur le droit d'auteur. L'utilisation des servicesd'Érudit (y compris la reproduction) est assujettie à sa politique d'utilisation que vouspouvez consulter en ligne. [https://apropos.erudit.org/fr/usagers/politique-dutilisation/]
Cet article est diffusé et préservé par Érudit.
Érudit est un consortium interuniversitaire sans but lucratif composé de l’Universitéde Montréal, l’Université Laval et l’Université du Québec à Montréal. Il a pourmission la promotion et la valorisation de la recherche. www.erudit.org
Tous droits réservés © Les Presses de l'Université deMontréal, 1987
Géographie physique et Quaternaire, 1987, vol. XLI, n° 2, p. 279-290, 8 fig.. 1 tabl.
CONDITIONS FOR GROWTH AND RETREAT OF THE LAURENTIDE ICE SHEET William F. BUDD and Ian N. SMITH, Department of Meteorology, University of Melbourne, Parkville, Victoria, Australia 3052.
ABSTRACT Results of three dimensional numerical modelling of the North American ice sheets in response to the Earth's orbital radiation variations are reviewed in relation to the conditions for formation and retreat of the ice sheets. The last interglacial develops as a clear result of the preceding high summer radiation levels and is not very dependent on the climatic paramaterisation. The magnitude and timing of the last glacial maximum provides a means of fine tuning the climatic par-ameterisation. In between these two periods the extent of ice sheet advances and retreat is strongly sensitive to the magnitude of the ice sheet albedo feedback parameter. The time changes of the radiation, climate, ice sheet cover and bedrock depression are out of phase and as a result equilibrium is not attained. The distribution of land surface elevation plays a key role in the pattern of seeding of the ice sheet growth and the subsequent advances, coalescence and retreat. The dispersal pattern of bedrock in till can be expected to reflect the growth and advance phases of the ice sheet development rather than the maximum configuration. Finally, the cycles of ice ages over the last 500,000 years from the modelling follows the occurrence of extreme summer radiation levels over a wide latitude band of 40-80°N due to coincidence of obliquity and perihelion features superimposed on the hysteresis effects of the ice cover.
RÉSUMÉ Conditions à l'origine de la croissance et du retrait de la calotte glaciaire laurentidienne. Les résultats obtenus à partir de la modélisation numérique tri-dimension-nelle des calottes glaciaires de l'Amérique du Nord selon les variations de l'insolation des latitudes sont examinés en fonction des conditions à l'origine de la formation et du retrait des inlandsis. L'existence du dernier interglaciaire est nettement le résultat des hauts niveaux antérieurs d'insolation estivale et très peu celui des paramètres climatiques. L'ampleur et la durée du dernier maximum glaciaire permettent de préciser les paramètres climatiques en cause. Entre ces deux périodes.l'importance de la progression des glaciers et de leur retrait subséquent est grandement influencée par l'albédo de la calotte glaciaire. Les changements temporels de l'insolation, du climat, de la couverture de glace et de l'enfoncement du substratum sont décalés les uns par rapport aux autres, résultant en un déséquilibre. La répartition des altitudes de la surface terrestre joue un rôle clé dans le processus de formation de la calotte glaciaire, ainsi que des récurrences, de la coalescence et du retrait subséquents. On peut s'attendre à ce que le mode de dispersion des dépôts glaciaire expriment davantage les phases de croissance et de récurrence de la calotte glaciaire que sa configuration maximale. En dernier lieu selon le modèle, les cycles de glaciation au cours des 500 000 dernières années suivent l'apparition de niveaux extrêmes d'insolation le long d'une large bande de 40° à 80° de latitude, en raison de l'obliquité de l'écliptique et des caractéristiques du périhélie surimposés à l'effet d'hystéréris causé par la couverture de glace.
ZUSAMMENFASSUNG Bedingungen fur das Anwachsen und den Rûckzug der lau-rentischen Eisdecke. Die Ergebnisse eines dreidimensionalen numerischen Modells der nordamerikanischen Eisdecken entsprechend den Variationen der Sonneneinstrahlung in verschiedenen Breiten werden in Bezug auf die Bedingungen fur die Bildung und den Riickzug der Eisdecken untersucht. Die letzte Interglazialzeit ist eine klare Folge der vor-hergehenden hohen sommerlichen Sonne-neinstrahlungen und ist nicht sehr abhângig von den klimatischen Parametern. Der Um-fang und die Dauer des letzten glazialen Maximums erlauben die klimatischen Parameter genau zu bestimmen. Zwischen die-sen beiden Perioden war der Umfang des Vorrùckens und Rùckzugs der Eisdecke stark beeinflupt vom Umfang der Albedo-Parameter der Eisdecke. Die zeitlichen Wechsel der Sonneneinstrahlung, des Klimas, der Eisdecke und der Senkung des Landes sind nicht phasengleich, und so wird kein Gleichgewicht erreicht. Die Verteilung der Erd-oberflàche-nerhebungen nimmt eine Schlùsselrolle ein in dér Verteilung des Wachsens der Eisdecke und den darauf folgenden Rùckphasen, dem Zusammenwachsen und dem Rùckzug. Es ist anzunehmen, dap die Art der Verteilung des Landes in der Grundmorâne eher das Anwachsen und die VorstoBphasen der Eisdecke spiegelt als ihre maximale Gestalt. Zu-letzt entsprechen dem Modell nach die Zyklen der Vereisung wàhrend der letzten 500,000 Jahre dem Vorkommen extremer sommer-licher Sonneneinstrahlung entlang eines breiten Gùrtels von 40-80" nôrdlicher Breite, infolge der Ùbereinstimmung von Neigung-swinkel und Charakteristika der Sonnennàhe, ùberlagert durch die Hysteresis-Wirkungen der Eisdecke.

280 W. F. BUDD and I. N. SMITH
BACKGROUND TO ICE SHEET AND CLIMATE MODELLING RELEVANT TO THE LAURENTIDE
ICE SHEET
This work focuses on the results of three dimensional dynamic ice sheet numerical modelling of the Laurentide Ice Sheet in response to the climatic changes being initially driven by the Earth's orbital radiation changes but with the ice sheet area changes themselves feeding back as a larger component of the total climatic change. Implications of the modelling results of BUDD and SMITH (1981. 1985) are examined and extended.
There have been many static or equilibrium reconstructions of the North American ice sheet, e.g. PATERSON (1972): SUGDEN (1977); SHILTS (1980); DENTON and HUGHES (1981); ANDREWS (1982): DYKE et al. (1982); BOULTON étal. (1985), FISHER et al. (1985).
The dynamic modelling of BUDD and SMITH (1981) indicated that an ice sheet occupying central, northern and eastern North America could never be expected to be in equilibrium because of the continually varying radiation forcing and the feedback with the climate. The delayed isostatic response of the bedrock accentuated the departures from equilibrium. It is therefore important to consider dynamic, non-equilibrium time dependent changes of both climate and the ice sheets.
A number of two-dimensional dynamic ice sheet models have been used to study the ice age climates and the ice sheet responses. The first study of this type, which was by WEERTMAN (1976), also used an equilibrium type model that varied with time but without ice sheet feedback on the climate system. Subsequently, both climate feedback and bedrock response have been included in these two-dimensional ice sheet models as well as dynamic flow depending on the stress and flow properties of ice, e.g., POLLARD (1978, 1982a and b, 1983, 1984), BIRCHFIELD and WEERTMAN (1978); BIRCHFIELD et al. (1981, 1982); BIRCHFIELD and GRUM-BINE (1985); OERLEMANS (1980a and b, 1983); OERLE-MANS and van der VEEN (1984).
Over this period there has also been considerable development in the modelling of the time dependent bedrock response to changing ice sheet and ocean loads, e.g. PELTIER (1982, 1986); PELTIER and HYDE (1984); YUEN et al. (1986). The two-dimensional types of ice sheet models usually make use of zonally averaged energy balance climate models to determine the interaction between the climate and the ice sheet including effects of the orbital radiation forcing.
Considerable progress has been made in the energy balance modelling as well as the ice sheet interaction, e.g. HELD and SUAREZ (1974,1978); SUAREZ and HELD (1976,1979); SCHNEIDER and THOMPSON (1979); POLLARD (1982a); Le TREUT and GHIL (1983) ; ROBOCK (1983) ; OERLEMANS (1980a); NORTH and COAKLEY (1979); POLLARD et al. (1980); NORTH et al. (1981); SELLERS (1984); FLANNERY (1984); BOWMAN (1982, 1985). The energy balance models can be tuned to the present day climate, but, for the climates of other periods with ice sheets or different radiation regimes,
they need to be checked against paleo-data and with global climate General Circulation Models (GCMs).
There have now been a large number of GCM simulations of ice ages and other past climates which provide useful calibrations for the climate ice sheet interactions, e.g. GATES (1976a and b); MANABE and HAHN (1977); MASON (1979); MANABE and BROCCOLI (1984, 1985a and b); ROYER and PESTIAUX (1984), ROYER etal. (1983, 1984), KUTZBACH and GUETTER (1984a and b).
These GCM studies use static ice sheets as constant boundary conditions. Because of the different time scales relevant to the flow of the atmosphere and the ice sheets, it has not been practical so far to run completely coupled ice sheet-atmosphere-ocean systems evolving continuously through varying ice age periods. Therefore the time varying ice sheet modelling has so far been carried out using a more parameterised climate specification than could be provided from a fully coupled atmosphere-ocean-ice GCM. Nevertheless the GCM results combined with the parameterised energy balance models have provided a valuable basis for checking and controlling the parameterisation of the interactive climate changes which drive the ice sheet changes. The paleo-evidence for the conditions of the ice sheet and climate over time then provide a check on both the climate and ice sheet modelling.
For the Laurentide Ice Sheet the distribution of surface topography forms a crucial element for the formation, growth and coalescence of the large ice sheets as well as the pattern of retreat and dispersal of the residual ice. The present topography and distribution of glacial ice provides an important starting point and control for modelling the ice age changes. An initial study with three-dimensional ice sheet modelling from existing ice on Baffin Island was carried out by ANDREWS and MAHAFFY (1976). This type of modelling has been extended by BUDD and SMITH (1981 ) to cover the period from the last interglaciation (about 120 ka BP) to the present using the orbital radiation changes as the primary driving force for the climate changes. The work was extended to cover the period from 500 ka BP to the present by BUDD and SMITH (1985).
Because of the importance of the non-steady state for both ice sheet and bedrock, and the actual pattern of the bedrock topography in the North American region for ice sheet formation, this paper will concentrate on results from time dependant three-dimensional ice sheet and climate modelling.
INTRODUCTION TO THREE DIMENSIONAL ICE SHEET CLIMATE MODELLING RESULTS
One feature which is now reasonably clear from the BUDD and SMITH (1981, 1985) results for the numerical modelling of ice sheets in response to the Earth's orbital radiation changes is that these radiation changes are the key triggering cause of the growth and retreat of the ice age ice sheets. Further results including the role of the Antarctic Ice Sheet in the global ice and climate system have been given by BUDD (1981), BUDD and SMITH (1982), and Smith (unpublished). It is also apparent that the magnitude of the radiation changes

CONDITIONS FOR GROWTH AND RETREAT 281
alone are too small in themselves to directly cause the large changes in climate and the ice cover without a number of strong feedbacks between the climate and other features, such as the area of the snow and ice cover, which amplify the magnitude of the climatic changes. Other factors which are also involved in the feedback interactions between the ice sheets and climate include : bedrock depression, sea level changes, surface albedo changes, atmospheric carbon dioxide changes, and the modification of precipitation patterns by the ice sheets.
The complexities of the feedbacks make it difficult to obtain clear results for some periods of the past history even though the periods of extreme conditions are well defined. For example, the period of the most recent major advance (30 to 18 ka BP) and retreat (18-8 ka BP) of the Laurentide Ice Sheet is now becoming well controlled by radiocarbon dating (BRYSON ef a/., 1969; PREST 1969,1984; DENTON and HUGHES, 1981). This period was therefore used by BUDD and SMITH (1981) as a primary source of comparison with the results of the three-dimensional ice sheet numerical modelling which was found to give quite a close representation of the proxy paleo-record.
A second feature which has shown up as a clear and robust result from the longer time period modelling (from 500 ka BP) of BUDD and SMITH (1985) is the distinct low ice volume interglacial period about 120 ka BP. The modelling so far gives a clear simulation of the last interglaciation and the most recent period of advance and retreat to the present low ice cover situation. In between these two periods the precise extent of the ice and the size of the climatic temperature deviations from the present are particularly sensitive to the ice sheet albedo feedback and other parameterisations used in the model.
A concentrated study is therefore required to compare field data and modelling results to determine more clearly the historical changes of the ice sheet and climate from the last interglaciation to the present. This paper therefore attempts to highlight those aspects of the modelling results which could be checked by and evaluated from further field data, e.g. as given by ANDREWS et al. (1983). In addition it may be possible to help distinguish between certain field data interpretations by further more specific future modelling studies.
RADIATION AND TEMPERATURE REGIMES
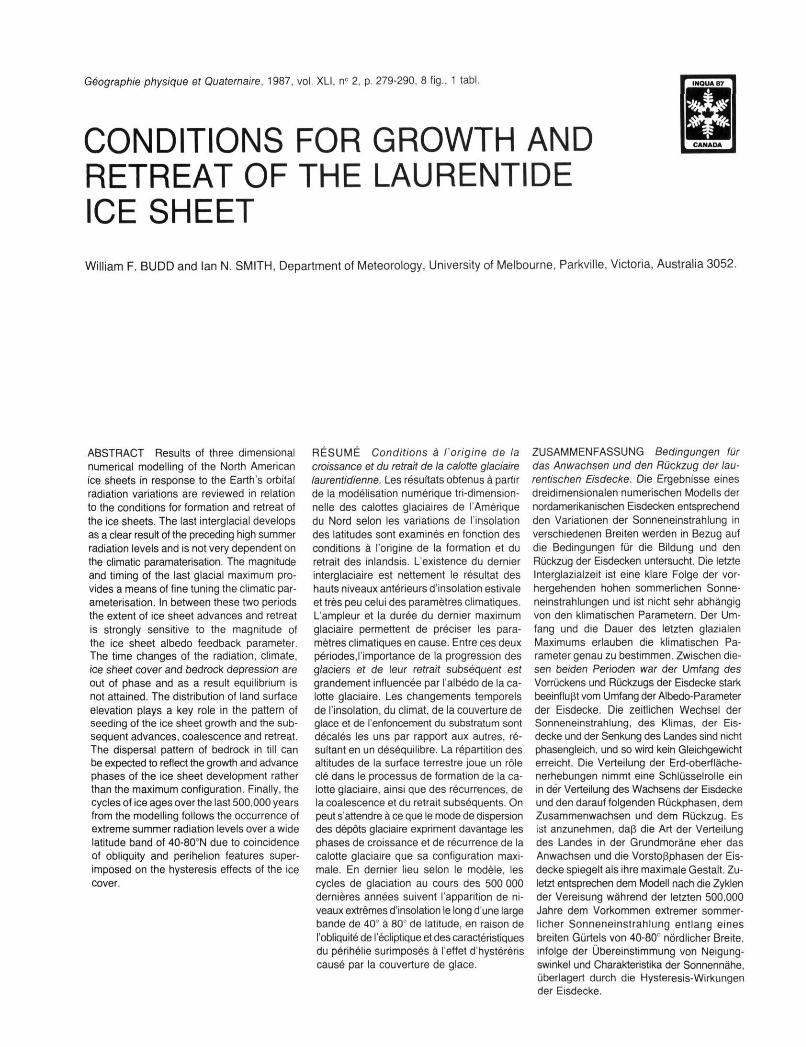
The Earth's orbital radiation changes provide a precise time scale of reference for the past history of other changes over the period. Figure 1 shows the summer and annual deviations of radiation levels as a function of latitude from the tables of VERNEKAR (1972). There are several points worth noting. Firstly the high values in the northern summer occur over a wide latitude range from about 130 ka BP. The modelling results indicate that these high values were responsible for the previous ice sheets disappearing thus leading to the last interglaciation. Note that a similar synchroneity of high radiation over the northern latitudes did not reoccur until about 15 ka BP. Again these high radiation values were necessary to cause the last large ice sheet to disappear. The
average summer radiation levels, particularly south of 600N in the northern hemisphere, have been generally higher than for the present, whereas the temperatures have been lower. This has been found to be due to the additional temperature lowering caused by the ice sheet albedo feedback. This is illustrated by the ice sheet response from radiation and feedback on temperature given by BUDD and SMITH (1981) and BUDD (1981 ) as shown in Figure 2. Note that the temperature curve is a result of both the direct radiation effect and the ice sheet albedo feedback which is related to the ice sheet area (approximately in phase with ice volume) as described in the section on albedo feedback below. The main influence of the ice sheet albedo feedback is to reduce the temperature further below present day values whereas the radiation deviates similarly above and below present levels.
The relation between the summer radiation deviations (AR) and the summer temperature changes (ABr) found by BUDD and SMITH (1981) for close matching of the model with the proxy evidence was
ABr = S1AR (1)
where B1 « 0.4°C/Wm 2
^0.2°C/lyday-1
(1Wm 2 = 2.07 Iy day 1)
This relation is similar to that which applies for the variation of summer temperatures with latitude and summer radiation over the range 30° to 8O0N at present viz.
~40°C/100Wm 2 « 0.4°C/Wm 2 (cf. Fig. 8 of BUDD and SMITH, 1981)
The ice sheet response to the radiation levels occurs primarily through changes in ablation rates resulting from changes in temperature. The direct radiation changes alone cannot account for large changes in ablation rates since an increase of 20 Wm 2 (== 40 Iy day 1) over half a year if converted totally into latent heat for melting would only amount to ~ 1 m of ice.
The main effect of the radiation is in changing the temperature and thereby the elevation of the O0C isotherm and consequently the time available for melting at the various elevations. The ablation rate curves for existing glaciers given by BUDD and SMITH (1981 ) show a very strong dependence on elevation (and mean summer temperature) especially at the higher ablation rates. For example, as described below an elevation change of 1 km at the levels with high ablation rates can result in a change in ablation in excess of 10 m a 1J cf. BUDD and SMITH (1981 ), and BUDD and ALLISON (1975). From the temperature radiation relation given above (equation 1) 20 Wm 2 with B1 = 0.4°C/Wm 2 gives =» 8°C. Thus with a temperature elevation lapse rate of - 6.5°C/km this corresponds to over 1200 m of effective elevation change for the atmospheric isotherms which could then result in more than a 10 ma 1 change in ablation rate for the low elevations with high ablation rates. A similar result applies to the variation in snowline with elevation and latitude. At present the summer temperatures vary with elevation and latitude such that a 1 km change in elevation corresponds to - 10° lat. change (cf. Fig. 8 of BUDD and SMITH, 1981). The ablation rates follow

282 W. F. BUDD and I. N. SMITH
ANNUAL INSOLATION
SUMMER INSOLATION
-160 -140 -120 -100 -80 "60
10 a BP
FIGURE 1. Deviations in annual ( ) and summer half-year ( ) totals of radiation received outside the Earth's atmosphere due to the variations in the Earth's orbital characteristics. The deviations are shown for 20" latitude intervals in the northern and southern hemisphere. The units shown are in Iy day and Wm 2 (1 W m 2 «• 2.07 ly/day). The data are from VERNEKAR (1972).
Écarts du total de l'insolation annuelle ( ) et semi-annuelle estivale ( ) reçu à l'extérieur de l'atmosphère de la Terre causés par les variations des caractéristiques de l'orbite de la Terre. Les écarts sont donnés à intervalle de 20° de latitude pour les hémisphères nord et sud. Les unités sont données en ly/jour et en Wm J
(IWm2-= 2,07 ly/jour). Les données proviennent de VERNEKAR (1972).
FIGURE 2. A sequence of radiation, climatic temperature, ice volume, and bedrock depression are shown for a model run by BUDD and SMITH (1981) to illustrate the progressively increasing phase lags from the radiation changes given here for 700N. The climate anomaly curve results from the radiation changes with feedback from the ice sheet area which varies similarly to the ice volume but with a slight lead. The temperature-elevation equivalence has been set by a lapse rate of -6,5°C/km. The 50C scales on the right show temperature change as a function of elevation.
La série des courbes de l'insolation, du climat, du volume de glace et de l'affaissement de Técorce terrestre, à partir du modèle élaboré par BUDD et SMITH (1981), illustrent l'augmentation progressive du temps de réponse aux changements du rayonnement au 700N. La courbe du climat est le résultat de la combinaison des changements de l'insolation et de Talbédo de l'inlandsis qui varie en fonction du volume de glace, mais avec une légère avance. L'équivalence température-altitude a été fixée selon un écart proportionnel à -6,50C/ km. Les échelles de 50C à droite montrent les changements de températures selon l'altitude.
a similar pattern of variation with latitude and elevation as shown by Figure 3.
ABLATION RATES
The ablation rate variation with elevation and latitude compiled by BUDD and ALLISON (1975) was parameterised by BUDD and SMITH (1981) to give a reasonable match to observed ablation rates on existing glaciers for the present climate.
For a particular latitude (<t>) where E0 (6) is the elevation of the 1 ma 1 ablation rate, the ablation rate A (in ma 1J at elevation E is given by
log10A = (1/m)<E0-
E> (2)
where m = 1200 m.
Using the lapse rate of -6.5°C/km this ablation elevation relation gives an ablation summer temperature relation similar to that given by KRENKE and KHODAKOV (1966) and KHO-DAKOV (1975) which is approximately represented by
A = a, (0S + 1O)3
where fls is the mean July-August surface air temperature (0C) and a, ~ 1 mm ice/°C3.
Table I shows the values of E0(c|>) which were used by BUDD and SMITH (1985) to obtain a close fit to the Laurentide advance and retreat based on the paleo-evidence of BRYSON er a/. (1969) and PREST (1969).
TABLE I
Elevation of 1 ma ' ablation rate versus latitude
Latitude 4>°N Elevation (m)
30 5100
40 4200
50 2600
60 1700
70 900 500
This ablation-elevation-latitude relation can be converted to an ablation-summer temperature relation by use of an atmospheric temperature elevation lapse rate. The surface temperature can then be regarded as the primary response to changes in the radiation regime. The temperature-elevation regime and the ablation-elevation regime then change accordingly.

CONDITIONS FOR GROWTH AND RETREAT 283
LATITUDE, 0N FIGURE 3. A projection for the elevations of the bedrock and ice sheet surfaces and the present net ablation rates (thick lines) as a function of latitude for the region of North America including Baffin Island and Labrador (from BUDD (1981). The ice sheet surfaces are shown for the existing ice sheets (thin full curves representing Barnes and Penny Ice Caps) and the modelled ice sheet growth by BUDD and SMITH (1981), from 120,000 years BP at intervals of 3, 6 and 9 ka from commencement. Projection des altitudes du substratum et de Ia surface des inlandsis et des taux d'ablation actuels (lignes grasses) selon la latitude, pour l'Amérique du Nord, y compris l'île de Baffin et le Labrador (de BUDD, 1981). Les surfaces des calottes glaciaires sont celles des glaciers existants (les courbes fines représentent les calottes glaciaires de Barnes et de Penny) et de la modélisation de la croissance des inlandsis de BUDD et SMITH (1981), à partir de 120 000 BP à intervalles de 3, 6 et 9 ka, à partir du début.
A secondary response is then the extent of the snow and ice cover or the surface albedo which can feedback in determining the surface temperature.
ALBEDO FEEDBACK
The ice sheet albedo feedback effect has been parame-terised by assuming firstly that the mean summer temperatures in the region near the ice sheet edge vary with the extent of global ice extent and secondly, that this extent can be considered to be proportional to the size of the Laurentide Ice Sheet. Information on the numerical values from the para-meterisation can be obtained from the results of the GCM ice age simulations (e.g. GATES, 1976a and MANABE and HAHN, 1977) and also from paleo proxy data as derived, for example, by CLIMAP (1976, 1981).
The albedo feedback between the snow and ice cover and the surface temperature was considered by BUDD and SMITH (1981) in two parts. Firstly, the perennial land surface snow and sea ice were included in the direct radiation-surface temperature relation
A6r = P1 AR ((M) (3)
where ABr is the summer temperature anomaly resulting from the summer radiation change AR as a function of latitude (<J>)
and time (t). This is because the perennial annual cycle of snow and sea ice keeps in phase with the long term radiation anomalies.
Secondly, the albedo feedback of the ice sheet was considered separately because it is significantly out of phase with and virtually independent of the synchronous radiation regime.
This was parameterised by a similar relation of the form
Aea = B2 | - (4)
where S is the ice sheet area for a temperature anomaly AB and Sm is the maximum area of ice sheet cover of the last ice age maximum.
The parameter B2 was considered as an unkown by BUDD and SMITH (1981) and a best fit value obtained from the modelling results by comparison with proxy evidence. The value of
B2 « 4.70C
found by BUDD and SMITH (1981) represents the net temperature lowering due to the ice sheet cover at maximum. This also was found to agree closely with the results from atmospheric General Circulation Models (GCMs) given by GATES (1976a) and MANABE and HAHN (1977), as discussed by BUDD (1981).
This temperature change can also be interpreted in terms of an elevation isotherm shift (e.g. for a lapse rate of X. = 6.50C/ km, AE = 720 m for maximum ice cover).
The two important consequences resulting from the ice sheet albedo feedback are illustrated by the ice volume and climate responses to the radiation changes shown in Figure 2. Firstly, there is a strong phase delay in the temperature relative to the radiation changes caused by the delayed response of the ice sheet area (and volume). Secondly, the cooling associated with the ice sheet cover causes the average temperature to be below that of the present, even though summer radiation levels in the northern hemisphere since the last interglaciation have been predominantly above the present level.
The modelled ice sheet advance and retreat for the last phase of the ice age is shown in Figure 4. Note that the high elevation regions as shown in Figure 4a, particularly at the high latitudes, play a key role in seeding the growth of the ice sheets and in maintaining the most persistent centres of flow during retreat. It should be noted that because of the coarse (200 km) resolution of the model, the ice cover appears to be too extensive in some areas where only high peaks would be covered. This is most noticeable in Figure 4e for the maximum extent where the ice cover can be interpreted with the topography of Figure 4a to indicate the elevation level reached by ice. Note also that the model edge occurs between the zero and 500 m thickness contours requiring sub-grid scale parameterisation for an exact location. The sensitivity of the model to the radiation parameter (P1) was indicated by BUDD and SMITH (1981). Figure 5 shows more

284 W. F. BUDD and I. N. SMITH
clearly the sensitivity to the ice sheet albedo feedback parameter (P2) around the best fit value.
In the interpretation of the radiation-temperature changes it is important to understand that other feedbacks may occur within the global climate system. For example, the results of the measurements of paleo CO2 levels in the ice cores reported by LORIUS et al. (1984) indicate that during the cold periods the atmospheric CO2 levels were lower. The lower CO2 levels should be expected to result from the increased sea ice providing greater flux into the deep ocean as described by BUDD (1980); cf. also SHACKLETON etal. (1983), BROECKER ef a/. (1985) and DUPLESSY and SHACKLETON (1985). The increased sea ice follows directly from the lower radiation levels with additional feedback from lower temperatures. The GCM modelling of MANABE and BROCCOLI (1984, 1985a and b) has shown how the reduced CO2 levels can then lead to lower temperatures and still greater sea ice coverage.
A similar feedback for the ice sheet albedo temperature decrease occurs with sea level lowering due to increased ice volume. For a fixed land surface location a sea level lowering of about 140 m or more (CHAPPELL and VEEH, 1978a and b; CHAPPELL, 1974; VEEH and VEEVERS, 1970) could add
FIGURE 4. Modelled ice sheet growth over North America at 200 km resolution. Contours of initial bedrock elevation (a) are given and
. subsequent ice thickness in decametres for the following times before present (BP): b) 36 ka; c) 30 ka; d) 22 ka; e) 18 ka; f) 12 ka; g) 10 ka;
. h) 8 ka ; i) 6 ka ; j) 4 ka. Note the actual edge of the ice sheet is located between the zero and 50 decametre ice thickness contours.
Modélisation de la croissance des calottes glaciaires en Amérique du Nord avec une précision de 200 km près. On donne les courbes de niveau du substratum initial (a) ainsi que celles de l'épaisseur de glace en décamètres pour les époques suivantes (BP): b) 36 ka; c) 30 ka; d) 22 ka; e) 18 ka; f) 12 ka; g) 10 ka; h) 8 ka; i) 6 ka; j) 4 ka. La limite glaciaire actuelle se situe entre 0 et 50 décamètres.
an additional temperature decrease over land of about TC depending on the lapse rate.
Both of these positive feedbacks need to be understood as included in the best fit parameters for the total temperature change relations derived by BUDD and SMITH (1981),
A8 = S1 AR + p2 S/Sm
PRECIPITATION
As indicated above the changes in ablation rates can be very large and in excess of 10 ma - \ By contrast, the absolute changes in precipitation can be expected to be much smaller although, in proportional terms, this can still be quite significant. Over the region of northeast North America including Baffin Island and Labrador the precipitation rates are generally in the range of 0.25 to 1 ma '. The sensitivity studies of BUDD and SMITH (1981) indicated that large changes in precipitation were not necessary to account for the growth or decay of the ice sheets within the times available. The most important feature, however, that needed to be included was the "elevation-desert" effect whereby the accumulation over the ice sheet decreased with increasing surface elevation (and

CONDITIONS FOR GROWTH AND RETREAT 285
ICE SHEET RESPONSES
FIGURE 5. The sensitivity of the model ice sheet to changes in the ice sheet albedo is illustrated by the ice volume changes following the growth from the last interglaciation with the albedo factor set for different runs at values from 4.68 to 5.20C for the temperature lowering at observed maximum ice cover.
La sensibilité du modèle glaciaire aux changements de l'albédo de l'inlandsis est illustrée par les changements du volume de glace, par suite de la croissance depuis le dernier interglaciaire. Le facteur albédo est programmé pour différentes applications selon des valeurs de baisse de température au maximum glaciaire variant entre 4,68 et 5,20C.
distance inland) as the ice sheet grows. This is in line with the characteristics of existing ice sheets and the decrease of water vapour available at higher elevations and lower temperatures (cf. SUGDEN, 1977; ROBIN, 1983).
Apart from this elevation effect, the sensitivity studies also indicated that it was not necessary to vary the basic precipitation rates from the present values except for perhaps higher rates at the southern margins of the ice sheet as could be expected from the GCM studies (cf. e.g. MANABE and HAHN 1977).
ICE THICKNESS AND BEDROCK DEPRESSION
It was pointed out by BUDD and SMITH (1981 ) that a time dependent bedrock depression response was an essential component of the glacial cycle. Figure 2 indicates that the phase delay in the bedrock depression contributes to an effective lowering of the ice sheet surface at the time when the summer radiation, ablation rate, and elevation of the firn line are all increasing. This results in a more rapid retreat of the ice sheet than would otherwise occur without bedrock depression.
A second important feature is that the ice sheet does not reach steady state because of the time scales associated with the varying radiation forcing, the ice sheet growth and decay, and the bedrock response. As a consequence, the bedrock depression does not reach equilibrium either and the amplitudes of the variations are much less than the equilibrium values corresponding to the ice thickness changes. For example, for the model run of Figure 2, the maximum ice thickness obtained was over 4,000 m but the bedrock depression maximum was only 700 m, compared to an equilibrium value which could be over 1,000 m.
The third major point worth noting is that although the situation at the end of the last interglaciation is not known with certainty, it appears likely that the areas presently still
depressed were higher. Consequently, an adjustment to the bedrock topography was made by BUDD and SMITH (1981) to take account of the residual depression for the initial zero load bedrock configuration.
Another consequence of bedrock depression involved a more rapid disappearance of ice from Hudson Bay due to the access of sea water causing the thinning ice to float. This was also shown by POLLARD (1984). Results of modelling and temperature analyses indicate that the basal ice of the central and southern part of the ice sheet could be expected to be near melting point for the bulk of the period. As a result, basal melt water would also be extensive and the flow of this water warrants further consideration. Numerical modelling of the basal melt flow, as described by BUDD and JENSSEN (1986), may be included in future studies of the ice sheet.
ICE VELOCITY AND BASAL SHEAR STRESS
The general model used by BUDD and SMITH (1981, 1982, 1985) and BUDD et al. (1984) for the ice dynamics and flux calculations takes the form
V = k, k £-k2 z\
(5)
where V is the average horizontal velocity through the thickness, Tb is the basal shear stress Z is the ice thickness Z* is the ice thickness above that which just grounds the ice k,, n are ice deformation parameters
and k2, p, q are ice sliding parameters (cf BUDD ef a/., 1979).
For West Antarctica where the bedrock is deep below sea level the above sliding formulation results in a much flatter

286 W. F. BUDD and I. N. SMITH
and lower surface profile upstream of the grounding line than would otherwise result from internal deformation above (cf. BUDD et al., 1984; McINNES and BUDD, 1984).
In the case of the North American ice sheet modelled with a coarse resolution of 200 km horizontal spacing, the predominance of the land surface above sea level for the grounded ice resulted in very little sliding. Under these circumstances the effects of additional sliding could not be easily distinguished from simply using higher values for the ice deformation flow parameter k,. Although an equivalent temperate ice type value of
ki = 0.1 bar-" a 1
was found to be satisfactory, the sensitivity of the model to the value of k, was not high.
The changes of the ice sheet in time are computed from the continuity equation
(6) £ =A-dt Hx + ay
(VZ)
where A is the net surface ice mass balance from accumulation and ablation, and basal melting is considered negligible.
The average velocity V is obtained from equation (5) where the basal shear stress is given by
Tb = pg«Z (7)
where a is the surface slope P is the ice density
and g is the gravitational acceleration. For n = 3 the expression for ice flux is given by VZ = k, (Pga)nZn-2 (8)
which produces only a weak dependence on k, for the resulting ice thickness.
With a higher resolution, the sliding formulation can be expected to become more important and would thus allow an improved simulation of ice stream formation in the low bedrock areas such as the St. Lawrence River region. The flow of ice into the depressed bedrock region of Hudson Bay could also be better simulated by the sliding formulation with higher resolution. The main result that occurs from changes to the velocity formulation, whether or not sliding is included, is that the higher the velocity the thinner the ice and the greater the ice area to thickness ratio. The results of BUDD and SMITH (1981 ) suggest that the flow and dynamics of the Laurentide Ice Sheet need not have been unlike those of the glaciers and ice sheets existing today.
Finally in regard to the velocities, some speculation has been made regarding the possibility of large-scale surging of the Laurentide Ice Sheet. BUDD and McINNES (1979) suggested that the basic characteristics of the Laurentide Ice Sheet (including: accumulation, flux, surface slope, ice thickness, basal shear stress and ice temperature) were such that surging should not be unexpected. The regions of primary interest for surging are the large southern lobes reaching south of the Great Lakes.
Preliminary modelling results by Mclnnes (unpublished) indicate that, for the type of model used for existing glaciers
and ice sheets [cf. BUDD and McINNES, 1974; BUDD, 1975; BUDD and McINNES, 1978), surging of the southern lobes of the Laurentide Ice Sheet would be quite likely with the following characteristics for the largest surge.
Period 3,500 years Duration 20 years Max. length change 400 km Max. ice thickness of
surged lobe 1,500 m
Such surge type lobe features could cause the southern edge of the ice sheet to reach further south in some locations than the broad scale model results of BUDD and SMITH (1981) indicate. Smaller surges could also be simulated with the model, in which case the length changes and periods were both less than those given above. Although this work is still preliminary, it does suggest that non-climatic induced fluctuations of the boundaries of the Laurentide Ice Sheet could have occurred and it also provides an indication of the time and space scales of the fluctuations which could have been expected.
BASAL MOVEMENT, EROSION AND TILL TRANSPORT
For existing ice sheets the regions of high shear stress and velocity are in the outer regions, towards the margins or the ablation zones. A similar pattern was found for the Laurentide Ice Sheet by BUDD and SMITH (1981). Vertical wear or erosion rates were studied in sliding experiments by BUDD et al. (1979). The general relation obtained was
w = c, TNV1 3 (9)
where w is the vertical erosion rate T is the basal shear stress N is the basal normal stress V is the sliding velocity
and c, is a constant.
In these tests the velocity was found to be a function of the stresses as follows:
V = k2-r3/N (10)
and so other forms for the erosion were obtained such as
W = C 2T 2N 2 3 (11)
or w = C3T4V 2 3 (12)
For the second relation C2 == 0.11 mm a 1 bars 8 3 and the erosion rate is governed primarily by the geometry of the ice sheet involving both the ice thickness and the surface slope.
At a dome summit of an ice sheet the surface slope decreases to zero. Consequently the basal shear stress and velocity there are also zero which means that around a central dome region the erosion and transport rates are very low. The active zones are predominantly the high stress regions further out which implies that most of the transport of material may take place during the growth and advance phases of the ice sheet development. Although the pattern of glacial till and erosion features represents net integral effects over many

CONDITIONS FOR GROWTH AND RETREAT 287
ice ages, the cycle of growth and decay since the last inter-glaciation could be considered as a typical sequence. To indicate the importance of the time variation on the ice flow patterns, as distinct from the flow patterns at maximum, Figure 6 shows the time averaged ice flow from the sequence shown in Figure 4 from 40 ka BP to 8 ka BP. It is quite clear that the independent centres of flow can be expected to have a strong influence on the residual pattern of flow characteristics portrayed by the basal material after the ice has disappeared. The pattern shown in Figure 6 from this model run is not unlike the pattern derived for the region from field surface observations by SHILTS (1980).
It is also apparent from these modelling results that the coalescence of the initial centres of flow to form a single dome centre of flow may be expected to result in relatively stagnant basal ice with little impact on the dispersal of basal debris. It therefore follows that evidence for the existence of a central dome from basal till may be difficult to find.
ADVANCE AND RETREAT RATES
The pattern of advance and retreat generated by the model is illustrated by the sequence shown in Figure 4 between 36 and 4 ka BP. This pattern shows a similar timing for advance and retreat as derived from the proxy field evidence, e.g. GOLDTHWAITE (1958); PREST (1969); BRYSON et al. (1969); DENTON and HUGHES (1981); PREST (1984).
It should be noted that there are progressive shifts in the centres of flow. Coalescence and separation of the different ice flow regions also strongly influence the nature and speed of the advancing or retreating fronts. As an example of the rates of change in the positions of the ice fronts, Figure 7a shows the separate time sequences of the change in position of those parts of the fronts south of Baffin Island (full curve) and south of Labrador (broken curve). The corresponding rates of change, shown in Figure 7b, are generally around 100 ma ' and reach a peak of the order 250 ma 1. These rates of advance or retreat do not entail any unusual features beyond the normal ice dynamics and ablation rates of existing glaciers.
It should be noted that in directions at an angle to the flow directions, the advancing or retreating ice boundaries can cover or expose larger distances in a short time. It is therefore important to consider advance and retreat rates primarily in directions of the ice flow.
LONG TERM CHANGES AND ICE AGE FREQUENCIES
The climate parameters for the radiation temperature relation (B1 = 0.4°C/WM 2) and the ice sheet albedo feedback (B2 = 4.70C) were derived from the matching of the timing for the last major advance and retreat of the Laurentide Ice Sheet as illustrated by Figures 4 and 5. A useful test of the model is then provided by keeping those parameters set at the same values for a longer period simulation. The results of the model runs for 500 ka with the summer radiation deviations tabulated by VERNEKAR (1972) were given by BUDD
FIGURE 6. Modelled ice sheet flow streamlines for the region surrounding Hudson Bay averaged over the period as depicted in Figure 4 (the last major advance and retreat of the ice sheets since 40 ka BP). Bedrock elevation contours are shown at 500 m intervals from 0 to 2,000 m as used in the model. Note that there appears to be very little indication in the average flow patterns of the central dome over Hudson Bay which formed for over 10 000 years in the model.
Modélisation du réseau d'écoulement glaciaire dans la région qui entoure la baie d'Hudson, établi selon une moyenne valable pour la période située entre la dernière progression majeure et le retrait des inlandsis, soit depuis 40 ka BP (voir la fig. 4). Les courbes de niveau du substratum sont à 500 m d'intervalle (de 0 à 2000 m). À noter qu'il y a peu d'indications sur le réseau d'écoulement du dôme central au-dessus de la baie d'Hudson, qui a existé durant 10 000 ans, selon le modèle.
and SMITH (1985). Figure 8b shows the ice volume response to the radiation changes shown in Figure 8a using the radiation-temperature parameter 31 = 0.4°C/Wm 2 and values for the albedo feedback factor ranging from S2 = 4.2 to 5.2°C
The results show relatively robust major interglaciations with the ice volumes at maxima depending on the degree of decrease of ice during interglaciations.
It appears that the ice sheets exhibit large hysteresis insofar as it takes a considerable change from the present radiation regime to form them, but then an even larger reverse change to make them disappear. The main cause of an apparent 100 ka cycle comes from the interaction of the cycles for obliquity (~ 40,000 a) and perihelion (~ 23,000 a) such that the extrema become in phase approximately each second or third cycles of the obliquity variations (Ae. 80,000 or 120,000 a). The time for growth and retreat of the ice sheet together with the hysteresis reduces the higher frequency components of the ice volume changes.
Finally, the changes in eccentricity (on the order of 100 ka) give rise to the greater amplitudes of some cycles over the

288 W. F. BUDD and I. N. SMITH
FIGURE 7. a) The advance and retreat of the southern margin of the Laurentide Ice Sheet is shown for the two regions: south of Labrador (dashed) and south of central Baffin Island (full) from the model run shown in Figure 4. b) The corresponding advance and retreat rates are shown as computed from the model run from 40 ka BP until the disappearance of the ice.
a) Courbes de la progression et du recul de la marge méridionale de la calotte glaciaire laurentidienne pour le sud du Labrador (ligne brisée) et le sud de la partie centrale de l'île de Baffin (ligne pleine), à partir du modèle illustré à la figure 4. b) Les taux de progression et de recul correspondants, tels qu'estimés par le modèle, à partir de 40 ka BP jusqu'à la disparition de la glace.
longer period, which results in variations in the maximum extents of the different ice age cycles.
CONCLUSIONS AND FUTURE OUTLOOK
The numerical modelling of the Laurentide Ice Sheet in response to the Earth's orbital variations provides a relatively clear simulation of the interglacial period around 120 ka BP. Field evidence, including radiocarbon dating, has delineated the timing and pattern of the most recent advance, peaking about 18 ka BP and the subsequent retreat. This seems to be also relatively clear from the modelling. In between these two periods however, the picture is not as clear, particularly with regard to the size of the ice cover peaks at about 110, 90 and 60 ka BP or the amount of ice remaining for the relative interstades at 40, 80 and 95 ka BP.
The timing of the ice sheet response for these extrema is not very sensitive to the parameterisation, as shown by the small phase shifts in Figure 5, so it appears that the times are rather well established relative to the radiation changes which provide a relatively firm reference time frame for these
FIGURE 8. a) The deviations in summer radiation from VERNEKAR (1972) are shown from 510 ka BP to 19 ka for 10° latitude intervals from 40° to 8O0N. The extreme radiation levels prior to the major glaciations and interglaciations are marked G (below) and I (above), b) The corresponding ice sheet volume response for the North American ice sheets from the numerical modelling of BUDD and SMITH (1985) are shown for three values of the albedo feedback equivalent to 4.16, 4.68 and 5.2°C temperature lowering for the ice area at maximum (observed).
a) Les écarts de l'insolation estivale selon VERNEKAR (1972), de 510 ka jusqu'à 19 ka BP à intervalle de 10° de latitude, du 40° au 80°N. Les niveaux extrêmes d'insolation estimés avant les importantes glaciations et les interglaciaires sont indiqués par les lettres G (en bas) et I (en haut), b) Les réponses correspondantes du volume de glace des inlandsis d'Amérique du Nord, à partir de la modélisation de BUDD et SMITH (1985) sont montrées pour trois valeurs o"albédo équivalentes à des baisses de température de 4,16, 4,68 et 5,20C dans la région englacée au pléniglaciaire.
events. Figure 5 also shows that the magnitudes of the ice extent for the stades and interstades between 100 ka and 20 ka BP depends strongly on the ice sheet area albedo feedback. Tuning the model to match the paleo-evidence for the extent over the period from say 30 ka to 10 ka BP still leaves some uncertainty of the extent for the earlier periods, e.g. the 40 ka and 80 ka minima and the 60 and 90 ka maxima. It is important to note however that the radiation levels vary with latitude and that the ice cover response and climatic

CONDITIONS FOR GROWTH AND RETREAT 289
temperature changes may be well displaced in time from the radiation changes. The modelling provides a useful background for the scale of these phase lags between different parts of the ice and climate system. This means that the modelling and field data collection could together focus on examining some aspects of the problem in detail.
From the modelling viewpoint it is possible to examine many other features, basal shear stress, erosion rates, till transport, etc., which may be of interest to the field investigators. Other new developments need to include higher resolution (say down to 50 or even 20 km), as well as explicit computation of ice temperatures and basal water flow. Specific modelling of the floating ice and ice calving could also be added. The variation of sea level can readily be included in the model as either a prescribed, prognostic or interactive variable. Finally, the ice sheets over the rest of the northern hemisphere could be modelled as part of an interactive ice sheet and climate system. In such a study the Antarctic Ice Sheet could also be included since it contributes to both sea level and total ice volume changes. The Antarctic however does not have a very strong influence on the northern hemisphere climate except indirectly through changes in the sea ice cover and carbon dioxide levels. In treating the complete northern hemisphere it will be important to also include an adequate formulation for floating ice shelves which could develop as an integral part of the interconnecting grounded ice sheets.
REFERENCES
ANDREWS, J. T. (1982): On the reconstruction of Pleistocene ice sheets: A review,
Quaternary Science Reviews. Vol. 1, p. 1-30.
ANDREWS, J. T. and MAHAFFY, M. A (1976): Growth rates of the Laurentide Ice Sheet and sea level lowering (with emphasis on the 115.000 BP sea level low). Quaternary Research. Vol. 6, p. 167-183.
ANDREWS, J. T., SHILTS, W. W., and MILLER. G H. (1983): Multiple déglaciations of the Hudson Bay Lowlands. Canada, since deposition of the Missinaibi (last-interglacial) Formation, Quaternary Research. Vol. 19. p. 18-37.
BIRCHFIELD, G. E. and GRUMBINE. R. W. (1985): "Slow" physics of large continental ice sheets and underlying bedrock and its relation to the Pleistocene Ice Ages, Journal of Geophysical Research. Vol 90, N. B13. p. 11294-11302
BIRCHFIELD, G. E. and WEERTMAN, J. (1978): A note on the spectral response of a model continental ice sheet. Journal Ol Geophysical Research. Vol. 83, p. 4123-4125.
BIRCHFIELD, G. E., WEERTMAN, J., and LUNDE, A. (1981): A paleochmate model of the Northern Hemisphere ice sheets. Quaternary Research, Vol. 15. p 126-142.
(1982): A model study of the role of high-latitude topography in the climate response to orbital insolation anomalies. Journal of Atmospheric Sciences. Vol 39, p. 71-87.
BOULTON, G. S.. SMITH, GY. D.. JONES, A. S.. and NEWSOME, J. (1985): Glacial geology and glaciology of the last mid-latitude ice sheets, Journal ol the Geological Society of London. Vol. 142. p. 447-474.
BOWMAN, K. P. (1982): Sensitivity of an annual mean diffusive energy balance model with an ice sheet. Journal of Geophysical Research. Vol. 87. p. 9667-9674.
( 1985) : Sensitivity of an energy balance climate model with predicted snowfall rates, Tellus, Vol 37A, p. 233-248
BROECKER, W. S., PENG, T. H., OSTLUND, G., and STUIVER, M. (1985C The distribution of bomb radiocarbon in the ocean, Journal of Geophysical Research, Vol. 90, No. C4. p. 6953-6970.
BRYSON, R A . , WENDLAND, W. M., IVES, J D . and ANDREWS, J T . (1969): Radiocarbon isochrones on the disintegration of the Laurentide ice sheet, Arctic and Alpine Research, Vol. 1, p. 1-13.
BUDD, W. F. (1975): A first simple model for periodically self-surging glaciers, Journal of Glaciology, Vol. 14, p. 3-21.
(1980): The importance of the polar regions for the atmospheric carbon dioxide concentrations, in G. I. Pearman, éd., Carbon Dioxide and Climate: Australian Research. Australian Academy of Science, p. 115-128.
(1981): The importance of ice sheets in long term changes of climate and sea level, in I. Allison, éd.. Sea Level, Ice. and Climatic Change. International Association of Hydrological Sciences, Pub. No. 131, p. 441-471
BUDD, W. F. and ALLISON, I. F (1975): An empirical scheme for estimating the dynamics of unmeasured glaciers, in Snow and Ice Symposium, International Association of Hydrological Sciences. Pub. No. 104, p. 246-256.
BUDD, W. F. and JENSSEN, D. (1986): Numerical modelling of large scale basal water flux under the West Antarctic Ice Sheet, in C. J. van der Veen and J Oerlemans, eds., Dynamics of the West Antarctic Ice Sheet, Reidel Publishing Company, Dordrecht, the Netherlands, p. 293-320.
BUDD, W. F., JENSSEN, D., and SMITH, I. N. (1984): A three dimensional time dependent model of the West Antarctic Ice Sheet, Annals of Glaciology, Vol. 5, p. 29-36.
BUDD. W. F., KEAGE, P. L, and BLUNDY, N. A. (1979): Empirical studies of ice
sliding, Journal of Glaciology. Vol. 23, p. 157-170.
BUDD, W. F. and McINNES, B.J. (1974): Modelling periodically surging glaciers,
Science. Vol. 186. No. 4167, p. 925-927.
(1978): The periodically surging Medvezhi Glacier matched with a general ice flow model, Data of Glaciological Studies, Chronicle. Discussion, Pub. No. 32, Academy of Sciences of the USSR, p. 147-161 and 247-260.
(1979): Periodic surging of the Antarctic ice sheet — an assessment by modelling, Hydrological Sciences Bulletin, Vol. 24, No. 1, p. 95-104.
BUDD, W. F. and SMITH, I. N (1981): The growth and retreat of ice sheets in response to orbital radiation changes, in I. Allison, éd.. Sea Level, Ice. and Climatic Change. International Association of Hydrological Sciences, Pub. No. 131, p. 369-409.
(1982): Large scale numerical modelling of the Antarctic Ice Sheet, Annals of Glaciology. Vol. 3. p. 42-53.
(1985): A 500 000 year simulation of the North American ice sheet and climate, in Australian Glaciological Research 1982-3, ANARE Research Notes 28, Antarctic Division, Hobart, p. 146-152
CHAPPELL, J. (1974): Geology and coral terraces, Huon Peninsula, New Guinea: a study of Quaternary tectonic movements and sea-level changes, Geological Society of America Bulletin, Vol. 85, p. 553-570.
CHAPPELL, J. and VEEH, H. H. (1978a): 2^ThZ234U age support of an interstadial sea level of 40 m at 30,000 yr BP. Nature. Vol. 276, p. 602-604.
(1978b): Late Quaternary tectonic movements and sea-level changes at Timor
and Altauro Island, Geological Society of America Bulletin, Vol. 89, p. 356-368.
CLIMAP (1976): The surface of the ice-age earth. Science. Vol. 191, p. 1131-1137.
(1981): Seasonal reconstruction of the earth's surface at the last glacial maximum, Geological Society of America Map. Chart Series, MC36.
DENTON, G. H. and HUGHES, T. J. (eds.) (1981 ): The Last Great Ice Sheets, Wiley, New York, 484 p.
DUPLESSY, J. C , and SHACKLETON, N (1985): Response of global deep-water circulation to earth's climatic change 135.000-107,000 years ago. Nature, Vol. 316, p. 500-507.
DYKE. A. S., DREDGE, L. A., and VINCENT, J-S. (1982): Configuration and dynamics of the Laurentide Ice Sheet during the Late Wisconsin maximum, Géographie physique et Quaternaire. Vol. 36, p. 5-14.
FISHER, D. A., REEH, N., and LANGLEY, K. (1985): Objective reconstructions of the Late Wisconsinan Laurentide Ice Sheet and the significance of deformable beds, Géographie physique et Quaternaire. Vol. 39, p. 229-238.
FLANNERY, B. P. (1984): Energy balance models incorporating transport of thermal
and latent energy, Journal of Atmospheric Sciences. Vol. 41 . No 3, p. 414-421
GATES, W L (1976a): The numerical simulation of ice-age climate with a general circulation model, Journal ol Atmospheric Sciences. Vol. 33, p. 1844-1873.
(1976b): Modelling the ice-age climate. Science. Vol 191. p. 1138-1141
GOLDTHWAITE, R. P. (1958): Wisconsin age forests in western Ohio: Ice Age and glacial events, Ohio Journal of Science. Vol 58, p. 209-219.

290 W. F. BUDD and I. N. SMITH
HELD, I. M. and SUAREZ, M.J. (1974): Simple albedo feedback models of the icecaps, Tellus. Vol. 26, p. 613-629.
(1978): A two-level primitive equation atmospheric model designed for climatic sensitivity experiments, Journal of Atmospheric Sciences. Vol. 35, p. 206-229
KHODAKOV, V. G. (1975): Glaciers as water resource indicators of the glacial area of the USSR, in Snow and Ice Symposium. International Association of Hydrological Sciences, Pub. No. 104, p. 22-29.
KRENKE, A. H. and KHODAKOV, V. G. (1966): The connection between surface melting of glaciers and air temperature, (in Russian) Mater, Glyatsiol. Issled. Khronika 12, p. 153-164.
KUTZBACK, J. E. and GUETTER, P. J. (1984a): The sensitivity of monsoon climates to orbital parameter changes for 9000 years B. P. : experiments with the NCAR General Circulation Model, in J. Imbrie and A. Berger, eds., Milankovitch and climate change. Elsevier, Amsterdam, p. 801-820.
(1984b): Sensitivity of late-glacial and holocene climates to the combined effects of orbital parameter changes and lower boundary condition changes: "snapshot" simulations with a general circulation model for 18, 9 and 6 ka BP, Annals ot Glaciology, Vol. 5, p. 85-94.
LE TREUT, H. and GHIL, M. (1983): Orbital forcing, climate interactions and glacial cycles, Journal of Geophysical Research. Vol. 88, No. 69, p. 5167-5190.
LORIUS, C, RAYNAUD, D.. PETIT, J.-R., JOUZEL, T. and MERLIVAT. L. (1984): Late-glacial maximum — Holocene atmospheric and ice thickness changes from Antartic ice-core studies, Annals of Glaciology, Vol. 5, p. 88-94.
MANABE, S. and BROCCOLI, A.J. (1984): Ice-age climate and continental ice sheets: some expenments with a general circulation model, Annals of Glaciology. Vol.5, p. 100-105.
(1985a): The influence of continental ice sheets on the climate of an ice age, Journal of Geophysical Research, Vol. 90, p. 2126-2190.
(1985b): A comparison of climate model sensitivity with data from the Last Glacial Maximum, Journal of Atmospheric Sciences. Vol. 42, No. 23, p 2643-2651.
MANABE, S. and HAHN, D. G. (1977): Simulation of the tropical climate of an Ice Age, Journal of Geophysical Research. Vol. 82, No. 27, p. 3889-3911.
MASON, B. J. (1979): Some results of climate experiments with numerical models. World Climate Conference. WMO Pub. No. 537, p. 210-242.
McINNES, B. J. and BUDD, W. F. (1984): Cross-sectional models for West Antarctica and Greenland. Annals of Glaciology. Vol. 5, p. 95-99.
NORTH, G. R. and COAKLEY, J. A. ( 1979) : Differences between seasonal and mean annual energy balance model calculations of climate and climate sensitivity, Journal of Atmospheric Sciences, Vol. 36. p, 1189-1203.
NORTH, G. R., CAHALAN. R. F. and COAKLEY. J. A. (1981): Energy balance climate models, Reviews of Geophysics and Space Physics, Vol. 19, p. 91-121.
OERLEMANS, J. (1980a): Model experiments on the 100,000-yr glacial cycle, Nature. Vol. 287, p. 430-432.
(1980b): Glacial cycles and ice sheet modelling. Climatic Change. Vol.4. p. 353-374.
(1983): A numerical study on cyclic behaviour of polar ice sheets, Tellus. Vol.35, p. 81-87.
OERLEMANS, J. and van der VEEN, C. J. (1984): Ice sheets and climate. Reidel Publishing Company, Dordrecht, The Netherlands, 217 p.
PATERSON, W. S. B. (1972): Laurentide Ice Sheet: estimated volumes during Late Wisconsin, Reviews of Geophysics and Space Physics. Vol. 10. p. 885-912.
PELTIER, W. R. (1982): Dynamics of the ice age earth. Advances in Geophysics, Vol.24, p. 1-146.
(1986): Deglaciation-induced vertical motion of the North American continent and transcient lower mantle rheology, Journal of Geophysical Research, vol. 91, no. 89, p. 9099-9123.
PELTIER, W. R. and HYDE, W. (1984): A model of the ice age cycle, in A. L. Berger, J, Imbrie, J. Hays. G. Kukla, and B. Saltzman, eds., Milankovitch and Climate. Part 2. NATO ASI Series. C126, Reidel Publishing Company, Dordrecht. The Netherlands, p. 565-597.
POLLARD, D. (1978): An investigation of the astronomical theory of the ice ages using a simple climate-ice sheet model. Nature, Vol. 272, p. 233-235.
(1982a): A simple ice sheet model yields realistic IOOKyr glacial cycles. Nature. Vol. 296, p. 334-338.
(1982b): Ice-age simulations with a calving ice sheet model, Climatic Research Institute, Oregon State University, Corvallis, Report No. 39. 35 p.
(1983): A coupled climate-ice sheet model applied to the Quaternary ice ages. Journal of Geophysical Research, Vol. 88. p. 7705-7718.
(1984): Some ice-age aspects of a calving ice-sheet model, in A. L. Berger, J. Imbrie, J. Hays, G. Kukla, and B. Saltzman, eds., Milankovitch and Climate, Part 2. NATO ASI Series, C126, Reidel Publishing Company. Dordrecht, The Netherlands, p. 541-564.
POLLARD, D., INGERSOLL, A. P., and LOCKWOOD, J. G. (1980): Response of a zonal climate-ice sheet model to the orbital perturbations during the Quaternary ice ages, Tellus. Vol. 32, p. 301-310.
PREST. V. K. (1969) : Retreat of Wisconsin and Recent ice in North America. Geological Survey of Canada, Map 1257A.
(1984): Late Wisconsinan Glacier Complex. Geological Survey of Canada, Map 1584A.
ROBIN, G. de Q.. ed. (1983): The climate record in polar ice sheets. Cambridge University Press, 212 p.
ROBOCK. A. (1983): Ice and snow feedbacks and the latitudinal and seasonal distribution of climate sensitivity, Journal of the Atmospheric Sciences. Vol. 40, p. 986-997.
ROYER, J. F„ DEQUE, M. and PESTIAUX, P. (1983): Orbital forcing of the inception of the Laurentide ice sheet, Nature. Vol. 304, p. 43-46.
(1984): A sensitivity experiment to astronomical forcing with a spectral GCM: simulation of the annual cycle at 125,000 BP and 115,000 BP, frl A. L. Berger, J, Imbrie, J. Hays, G. Kukla, and B. Saltzman, eds.. Milankovitch and Climate. Part 2. NATO ASI Series. C126. Reidel Publishing Company, Dordrecht, The Netherlands, p. 733-763.
ROYER. J F. and PESTIAUX, P (1984): A sensitivity experiment to astronomical forcing with a spectral GCM for the simulation of the July 125K years BP, in A. L. Berger and C. Nicolis, eds., New Perspectives in Climate Modelling. Developments in Atmospheric Science 16, Elsevier, p. 269-285.
SCHNEIDER, S. H. and THOMPSON, S. L. (1979): Ice ages and orbital variations some simple theory and modelling. Quaternary Research. Vol. 12, p. 188-203.
SELLERS, W. D. (1984): The response of a climate model to orbital variations, in A. L. Berger, J. Imbrie, J. Hays, G. Kukla and B. Saltzman, Milankovitch and Climate. Part 2. NATO ASI Series, C126. Reidel Publishing Company. Dordrecht, The Netherlands, p. 765-788.
SHACKLETON, N. J., HALL, M. A.. LINE, J. and SHUXI, C. (1983): Carbon isotope data in core V13- confirm reduced carbon dioxide concentration in the ice age atmosphere, Nature. Vol. 306, p. 319-322.
SUAREZ, M. J. and HELD, I. M. (1976): Modelling climatic response to orbital parameter variations. Nature, Vol. 263, p. 46-47.
(1979): The sensitivity of an energy balance climate model to variations in the orbital parameters, Journal of Geophysical Research, Vol. 84, No. C8, p. 4825-4836.
SHILTS, W. W. (1980): Flow patterns in the central North American ice sheet, Nature. Vol.280, p. 213-218.
SUGDEN, D. E. (1977): Reconstruction of the morphology, dynamics and thermal characteristics of the Laurentide ice sheet at its maximum. Arctic and Alpine Research. Vol. 9, p. 21-47.
VEEH, H. H. and VEEVERS. J. J. (1970): Sea level at -175 m off the Great Barrier Reef 13,600 to 17,000 years ago, Nature. Vol. 226, p. 536-537.
VERNEKAR, A. D. (1972): Long-period global variations of incoming solar radiation, Meteorological Monographs. Vol. 12, p. 34.
WEERTMAN, J. (1976) : Milankovitch solar radiation variations and ice-age ice sheet sizes, Nature, Vol. 261, p. 17-20.
YUEN, D. A., SABADINE, R. C. A., GASPERINI, P. and BOSCHI, E. (1986): On transient rheology and glacial isostasy, Journal of Geophysical Research. Vol 91, No. B11, p. 11420-11438.