Embed Size (px)
Citation preview

Condition Monitoring Applied to Industrial Machinery Beta Machinery Analysis
1
Condition Monitoring Applied to Industrial Machinery
How Condition Monitoring Programs Contribute to the Bottom Line
Bryan LongBeta Machinery Analysis
Calgary, Houston
INTRODUCTIONCondition monitoring tools and technologies are widely utilized in industry today. Structuredpredictive maintenance programs are implemented with the objective of implementing conditionbased maintenance. Other maintenance approaches, either run-to-breakdown or preventive(time-based), are generally more expensive for industrial machinery. Condition monitoring canreduce maintenance costs, increase reliability and increase availability. Properly executed, therecan be substantial economic benefit from such programs versus preventive or breakdownmaintenance.
This presentation provides an overview of existing, proven condition monitoring methods, withsome examples and illustrations. Limitations are indicated. Aligning the technical programs moredirectly with company financial objectives is discussed.
THE PROFIT CENTRE VIEWTo more clearly understand the role of condition monitoring, let us start by considering a machineas a profit center. This exercise is important since the purpose of starting and operatingproduction machinery is to make as much money as possible.
Profit = Revenue - Cost
Revenue is simply the throughput or units of production multiplied by the value added to each unitproduced. The amount of production from a machine will be the production rate (e.g. units perhour) times the number of hours run in the time period. The number of hours run is the totalnumber of hours in the period times the availability, assuming a continuous operation.
On the expense side, we will consider only the variable costs that we have a chance to control:maintenance, energy and operating costs. Cost of capital (or depreciation) is not really a variablefor our purposes. The profit equation becomes:
Profit = (availability x hours x production rate x unit value added) - energy costs- operating costs - maintenance costs
A better way of looking at the profit equation:
Profit = availability x hours x production rate x { unit value added- (unit energy costs + unit operating costs + unit maintenance costs ) }
“Unit” energy, operating and maintenance costs are defined as meaning the cost per unit ofproduction, such as energy cost per unit volume of gas compressed or per ton of pulp producedor per widget manufactured.
The key variables are:• availability• throughput rate (capacity utilization)• unit energy costs (efficiency)• unit maintenance costs• other operating costs (oil, filters, …) per unit of production
http://www.BetaMachinery.com
Condition Monitoring Applied to Industrial Machinery Beta Machinery Analysis
2
From these considerations, we can see that:- availability is more important than reliability; that is, we want to minimize the total of planned
and unplanned down time, not just the unplanned.- rather than minimizing maintenance costs, our objective should be to minimize maintenance
cost per unit of production; we should do the minimum amount of maintenance required toget the maximum units of production
- pursuit of reduced unit energy costs (improved efficiency) is valid- we should pursue a throughput rate (load level) which is the maximum sustainable without
causing disproportionate increases in maintenance costs or decreases in availability
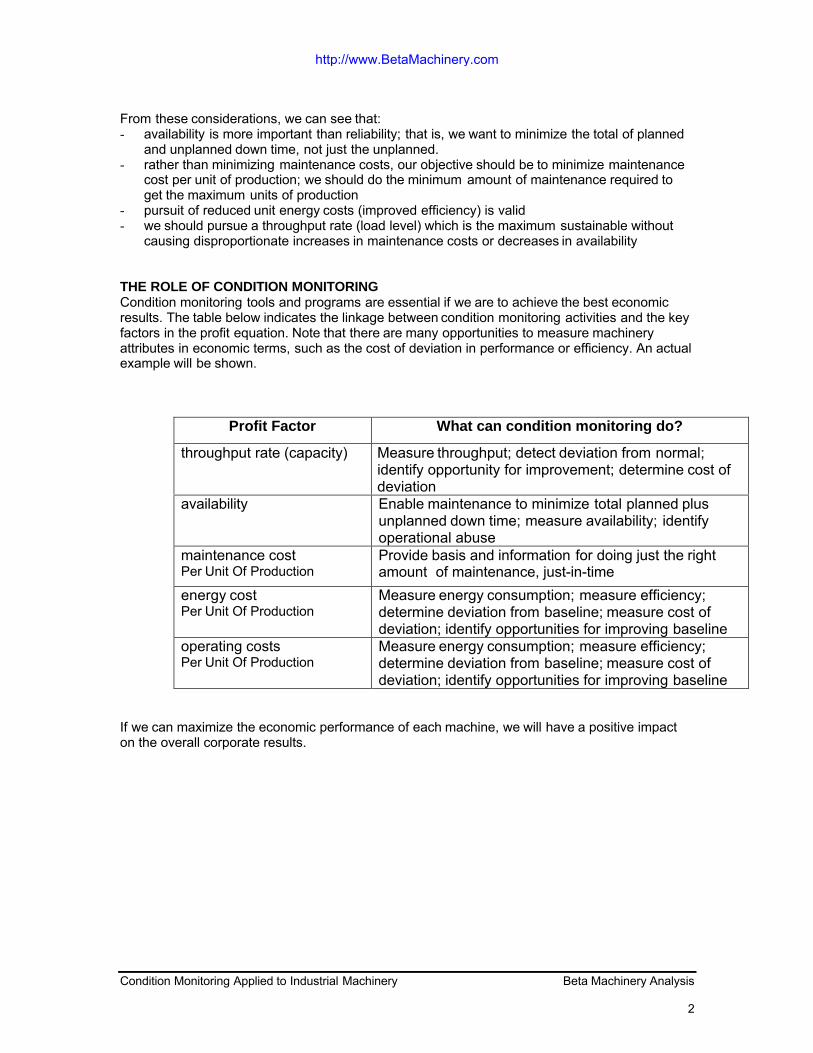
THE ROLE OF CONDITION MONITORINGCondition monitoring tools and programs are essential if we are to achieve the best economicresults. The table below indicates the linkage between condition monitoring activities and the keyfactors in the profit equation. Note that there are many opportunities to measure machineryattributes in economic terms, such as the cost of deviation in performance or efficiency. An actualexample will be shown.
Profit Factor What can condition monitoring do?
throughput rate (capacity) Measure throughput; detect deviation from normal;identify opportunity for improvement; determine cost ofdeviation
availability Enable maintenance to minimize total planned plusunplanned down time; measure availability; identifyoperational abuse
maintenance costPer Unit Of Production
Provide basis and information for doing just the rightamount of maintenance, just-in-time
energy costPer Unit Of Production
Measure energy consumption; measure efficiency;determine deviation from baseline; measure cost ofdeviation; identify opportunities for improving baseline
operating costsPer Unit Of Production
Measure energy consumption; measure efficiency;determine deviation from baseline; measure cost ofdeviation; identify opportunities for improving baseline
If we can maximize the economic performance of each machine, we will have a positive impacton the overall corporate results.
http://www.BetaMachinery.com
Condition Monitoring Applied to Industrial Machinery Beta Machinery Analysis
3
MACHINERY ATTRIBUTES WE NEED TO MEASUREProfit considerations tell us we need to measure and optimize:• throughput and capacity utilization• performance including outputs, inputs, efficiencies and waste• mechanical condition and risk of failure• economic consequences of deviations in mechanical condition and performance
Measuring and evaluating performance and capacity utilization is generally reasonablystraightforward, though not trivial. For gas compression machinery with varying operatingconditions, identifying deviations in performance or efficiency requires normalizing measuredperformance data and comparison with baselines - preferably test-based baselines.
The more difficult area is that of mechanical condition. The measures are necessarily lessobjective. When we see an indication of a fault, everyone wants to know how much longer themachine can be run. It is impossible to know with precision. (However, monitoring for rate ofchange is a big help in making decisions.)
The need to minimize maintenance cost per unit of production implies minimizing maintenanceresources consumed, but this must be balanced against ensuring throughput, efficiency andavailability. So the challenge is applying just the right amount of maintenance at just the righttime. Condition monitoring can help develop the maintenance program to achieve this end andcan help manage individual incidents to the same end.
MACHINERY MONITORING PROGRAMSThis section will present an overview of the most common condition monitoring programs forindustrial machinery:- lube oil analysis- vibration spectrum analysis- reciprocating engine/compressor analysis- analysis of operating parameters- ultrasonics- thermographyThese programs are generally complementary, not overlapping. Monitoring all aspects ofcondition and performance often requires all of the above.
Lube oil analysisAnalysis of lubricating oils has three main aspects:1. Detection of abnormal concentrations of wear particles, usually metals, which would indicateaccelerated wear of the machine.2. Analysis of the physical and chemical properties of the lubricant to ensure that it can performits job and determining any corrections required. This contributes to prolonged machine life.3. Detection of contaminants such as dirt and glycol which contribute to accelerated wear andcan also indicate problems such as a leak.
Lube oil analysis is carried out most commonly by periodic sampling and laboratory analysis.Some field analysis may be practical and economic; e.g. hard particle concentration, moisturelevels and viscosity. Information from oil sample analysis can be used to contribute to conditionbased maintenance, to prolong machine life and to reduce lubricant costs.
Practical difficulties and limitations include: difficulty in getting reliably representative samples;time delay when using outside laboratories; difficulty in verifying anomalous results.
http://www.BetaMachinery.com

Condition Monitoring Applied to Industrial Machinery Beta Machinery Analysis
4
Vibration spectrum analysis
Vibration-based predictive maintenance is based on the fact that in rotating machines, manymachine faults create increased vibration levels. Monitoring overall or band-filtered vibration levelprovides an alert mechanism for machinery protection. For condition monitoring and diagnosticpurposes, more detailed analysis of vibration signals is required.
Predictive maintenance programs generallyinvolve analysis of vibration spectra, such asthe example to the left. The distinct peaks inthe vibration patterns at certain frequenciesare due to machine behaviour; the challengeis to determine whether the behaviour isproblematic. Notice in this case that there hasbeen a large increase in some componentscompared to the 22-Nov-96 baseline.
Vibration-based predictive maintenance iswidely applied to rotating equipment. Benefitsrealized include extended machinery life,reduced catastrophic failures and secondarydamage, and increased availability.
Practical problems/limitations:• making valid decisions is as much art as science• periodic type programs are (skilled) manpowerintensive• continuous diagnostic systems are expensive toimplement and not always reliable• some faults do not affect vibration significantly
Some software tools are available to help the useridentify the characteristic “fault” frequencies in thespectrum. In this case, we see that the peaks at 1Xand 2X (running speed and twice running speed)have increased compared to their 22-Nov-96 baselineamplitudes. This is an axial vibration measurement asdenoted by the testpoint label “1A”. The symptomsare typical of misalignment.
Reciprocating engine/compressor analysisCondition analysis of reciprocating compressors and engines requires a different approach.Because of the normal vibration of these machines, vibration spectrum analysis is of limitedvalue. Instead, vibration is filtered to remove the low frequency shaking components. Theremaining signal, possibly with further filtering, is analyzed as a function of crankshaft angle.Where in-cylinder pressure can be measured, it is also captured with respect to crankshaft angle.
The above data is supplemented by some basic operating data, such as gas temperatures andrunning speed. Spectrum analysis can be beneficially applied to rotating accessories like
http://www.BetaMachinery.com

Condition Monitoring Applied to Industrial Machinery Beta Machinery Analysis
5
turbochargers. Using a modern engine/compressor analyzer, a skilled analyst can identify a widerange of incipient failures and performance anomalies.
This illustration shows reciprocating compressordata from an engine analyzer. The upper rightshows a pressure-time curve for the head end(solid curve), with filtered vibration traces fromeach valve cap overlaid. The crank endpressure-time curve is shown dotted forreference. The lower right is the same picture forthe crank end.
At the lower left, pressure-volume curves forboth head and crank ends are shown. Anexperienced analyst would recognize that thishead end curve is abnormal, and also that thehead end valve cap filtered vibration patternsare not what we would expect. The problem is aleaking discharge valve - specifically, the valvelabelled 4HD4.
At the upper left is a rod load plot calculatedfrom head and crank end pressures.
This data can reveal problems such as: leaking valves, leaking rings, excessive HP losses, rodoverload, lack of sufficient rod load reversal, crosshead looseness, poor valve dynamics.Some application software is available to assist with detection of problems and to provide someeconomic measures, such as the excess cost caused by a leak.
Power cylinder condition and performance canbe evaluated from filtered vibration readings andin-cylinder pressure versus crankshaft angle.High speed engines (900 RPM and up)generally do not have provision for measuringfiring pressures, so vibration patterns are usedto evaluate mechanical condition. In theexample at the left there is a pressure-timecurve, a filtered vibration pattern (lower) and anultrasonics pattern (upper).
Analysis of this type of data can reveal: ringblowby, leaking power valves, worn/scoredliners, excessive wrist pin clearance, valve trainlooseness, worn guides, incorrect valve timing,poor combustion. Operating parameters alsoshould be included in the analysis: air manifoldpressures, air manifold temperatures, ignitiontiming, fuel flow rate or pressure. Measuringcrankcase blowby through a venturii meter isworthwhile.
Analysis of operating parametersA large amount of operational data is already being collected in most facilities; typically on logsheets or by a control system. This process is not generally regarded as part of a conditionmonitoring or predictive maintenance program. However, there is usually a lot of valuable
http://www.BetaMachinery.com
Condition Monitoring Applied to Industrial Machinery Beta Machinery Analysis
6
machinery performance and condition information buried in this operational data. In practice, thechallenge is filtering out the useful information.
What data is useful is very machine and application dependent. For example, for a reciprocatingcompressor in a very stable service, we could closely watch for any increase in dischargetemperature to detect internal leaks; ring or valve. But the same machine in a pipeline applicationwith widely varying operating conditions would require that we normalize the dischargetemperature. Operational data often is adequate to allow for calculations of efficiency anddetection of deviations in efficiency, which can then be extended to calculate the cost of suchdeviations. On a gas turbine driver, this type of monitoring and analysis can be used to determinewhen it is most cost effective to perform blade washes.
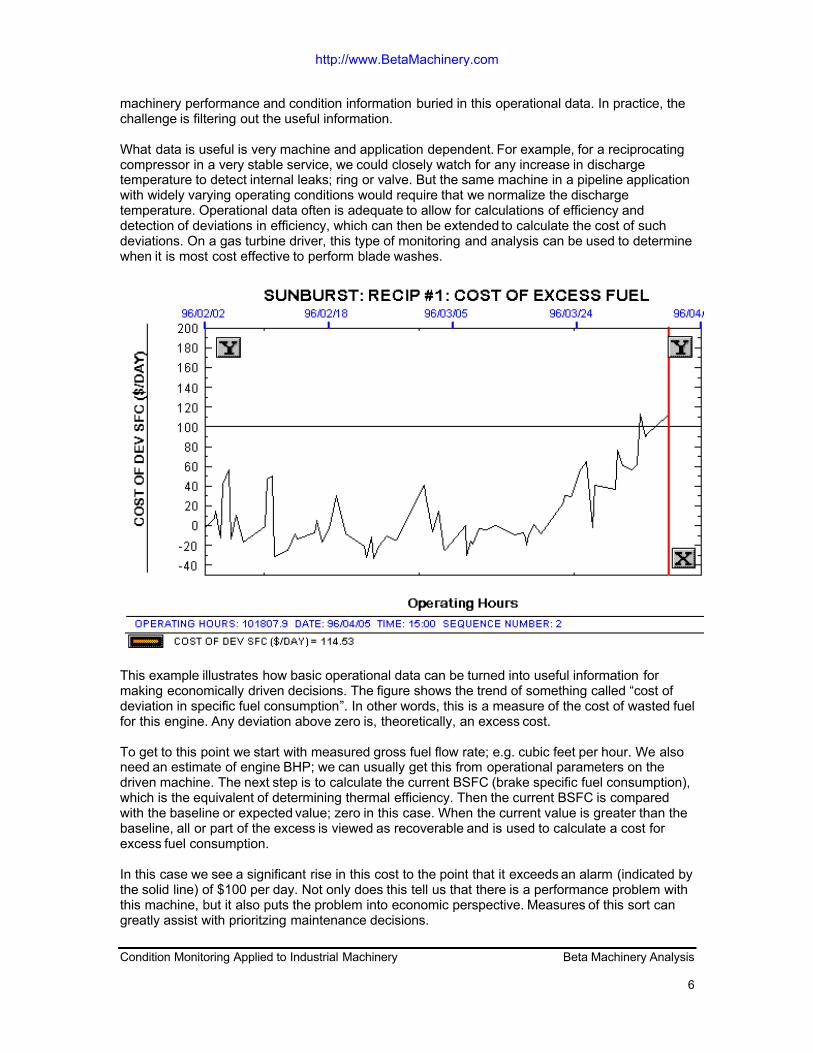
This example illustrates how basic operational data can be turned into useful information formaking economically driven decisions. The figure shows the trend of something called “cost ofdeviation in specific fuel consumption”. In other words, this is a measure of the cost of wasted fuelfor this engine. Any deviation above zero is, theoretically, an excess cost.
To get to this point we start with measured gross fuel flow rate; e.g. cubic feet per hour. We alsoneed an estimate of engine BHP; we can usually get this from operational parameters on thedriven machine. The next step is to calculate the current BSFC (brake specific fuel consumption),which is the equivalent of determining thermal efficiency. Then the current BSFC is comparedwith the baseline or expected value; zero in this case. When the current value is greater than thebaseline, all or part of the excess is viewed as recoverable and is used to calculate a cost forexcess fuel consumption.
In this case we see a significant rise in this cost to the point that it exceeds an alarm (indicated bythe solid line) of $100 per day. Not only does this tell us that there is a performance problem withthis machine, but it also puts the problem into economic perspective. Measures of this sort cangreatly assist with prioritzing maintenance decisions.
http://www.BetaMachinery.com

Condition Monitoring Applied to Industrial Machinery Beta Machinery Analysis
7
UltrasonicsHere we refer to ultrasonics applied to condition monitoring of machinery. Other applications,such as evaluating corrosion in piping, are also worthwhile.For rotating and reciprocating machinery, ultrasonics is a specialized measurement used todetect energy from mechanical impacts or high velocity gas flow. Generally, ultrasonicsmeasurements look for acoustical or mechanical energy above about 20k Hz. There are anumber of fault conditions that will produce energy above this frequency:• leaking valves in reciprocating compressors• worn gears or gears with improper mesh• improper lubrication• rolling element bearing faults
Ultrasonics is more a sensing technology than a condition monitoring program. It is usually usedalong with other sensing and analysis techniques to form a more comprehensive program.
ThermographyMeasurement of temperature can detect some machinery abnormalities. Such measurements areusually carried out with non-contacting, infra-red technology. One approach is to use an infra-redcamera, though this equipment is more commonly applied to non-machinery applications; e.g.electrical switch gear. A second approach is to use an infra-red temperature transducer whichgives a temperature readout for a point or small area.
Temperature surveys can be used to detect abnormalities in components such as rolling elementbearings, compressor valves, electric motors, engine fuel valves; basically any situation in whicha developing fault will result in a significantly increased temperature at some accessible surface.Infra-red temperature measurement is a significant supporting technology but is not by itself anadequate condition monitoring program for machinery.
TURNING DATA INTO INFORMATION (THE DRIP PROBLEM):Successful application of condition monitoring requires overcoming obstacles including:• a large amount of data• transforming data into information; overcoming DRIP (data rich/information poor)• a comprehensive program is made up of several technologies or sub-programs; each existing inisolation from the others; result: islands of information• typical condition monitoring programs have no explicit economic thrust
To turn data into information:1) We must process the raw data in order to extract needed characteristics or measures2) It is essential to reduce the large volume of raw data to a few key measures3) It is important to automate the process as much as possible
Some methods of data analysis:• filters or extractions; e.g. amplitude at 1X in vibration spectrum• models; e.g. efficiency calculations• statistics; e.g. peak firing pressure average and standard deviation• ratios; especially current level to baseline level• spread ratio; high minus low divided by average; e.g. gas turbine temps• deviation from some reference:
• a baseline determined with the machine in as-new condition, perhaps involvinga carefully executed test program.• theoretical value or level• benchmark; compare with the same measure from other, comparable machinesor machine components
http://www.BetaMachinery.com
Condition Monitoring Applied to Industrial Machinery Beta Machinery Analysis
8
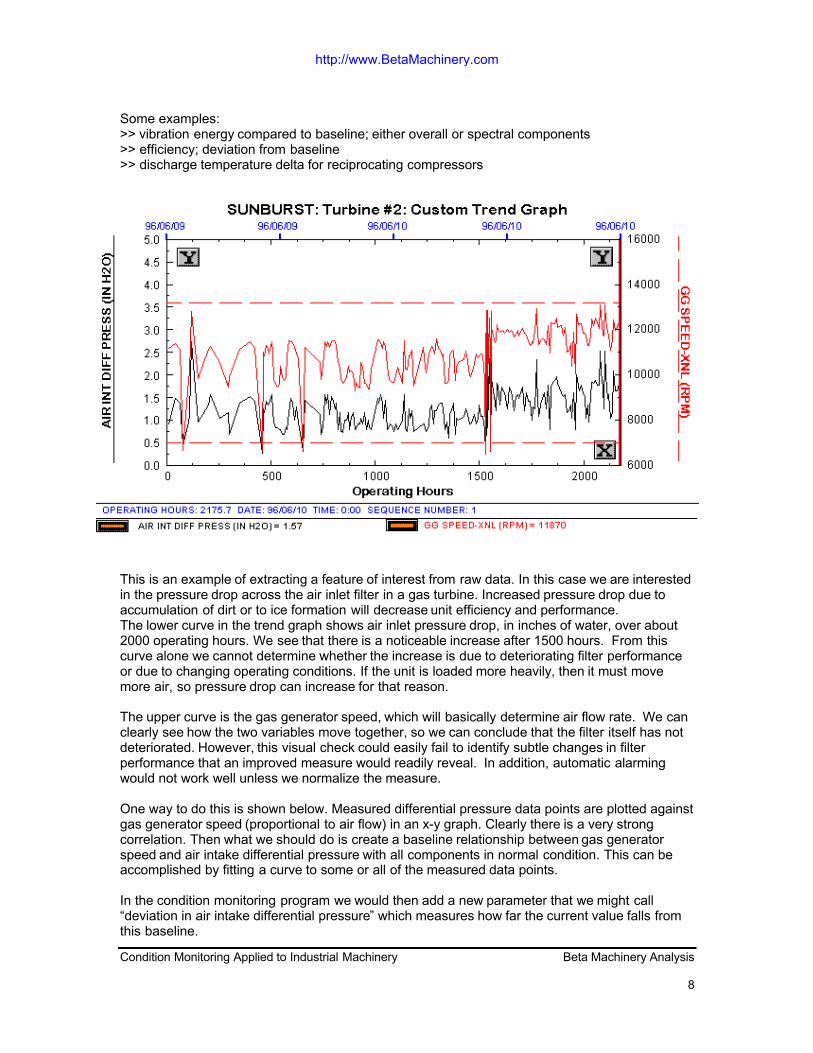
Some examples:>> vibration energy compared to baseline; either overall or spectral components>> efficiency; deviation from baseline>> discharge temperature delta for reciprocating compressors
This is an example of extracting a feature of interest from raw data. In this case we are interestedin the pressure drop across the air inlet filter in a gas turbine. Increased pressure drop due toaccumulation of dirt or to ice formation will decrease unit efficiency and performance.The lower curve in the trend graph shows air inlet pressure drop, in inches of water, over about2000 operating hours. We see that there is a noticeable increase after 1500 hours. From thiscurve alone we cannot determine whether the increase is due to deteriorating filter performanceor due to changing operating conditions. If the unit is loaded more heavily, then it must movemore air, so pressure drop can increase for that reason.
The upper curve is the gas generator speed, which will basically determine air flow rate. We canclearly see how the two variables move together, so we can conclude that the filter itself has notdeteriorated. However, this visual check could easily fail to identify subtle changes in filterperformance that an improved measure would readily reveal. In addition, automatic alarmingwould not work well unless we normalize the measure.
One way to do this is shown below. Measured differential pressure data points are plotted againstgas generator speed (proportional to air flow) in an x-y graph. Clearly there is a very strongcorrelation. Then what we should do is create a baseline relationship between gas generatorspeed and air intake differential pressure with all components in normal condition. This can beaccomplished by fitting a curve to some or all of the measured data points.
In the condition monitoring program we would then add a new parameter that we might call“deviation in air intake differential pressure” which measures how far the current value falls fromthis baseline.
http://www.BetaMachinery.com

Condition Monitoring Applied to Industrial Machinery Beta Machinery Analysis
9
Note that there is potential to go a step further. We should be able to estimate from existing datathe amount of efficiency loss for a given increase in intake pressure drop. This would enable thecalculation of extra fuel cost, thereby supporting an economically driven decision on filtercleaning/replacement.
SUMMARY AND CONCLUSIONS:Properly applied and selectively applied, the condition monitoring programs that have beendescribed here can return benefits well beyond the cost of the programs. There is a substantialamount of experience and judgement involved; the programs are not automatic, nor are they“pure science”.
Experienced specialists should be involved in the design, implementation and execution ofcondition monitoring programs.
http://www.BetaMachinery.com