Embed Size (px)
Citation preview

Maerz, H., Chepur, P., Myers, J., Linz, J, “Concrete Roughness Characterization Using Laser Profilometry for Fiber-Reinforced Polymer Sheet Application,” Transportation Research Board, 80th Annual Meeting, January 7-11, 2001,Washington, D.C., Paper No. 01-0139
1
Concrete Roughness Characterization Using Laser Profilometry for Fiber-Reinforced Polymer Sheet Application
Norbert H. Maerz, University of Missouri-Rolla, 1006 Kingshighway, Rolla MO, 65409-0660, USA. Tel: (573) 341-6714, Fax: (573) 341-4368, e-mail: [email protected]. Poornima Chepur, M.S., Software Engineer, ISSD Department, Sprint – LTD, Kansas City, MO, 64131, USA. Tel: (816)765-7056, Fax: (816) 756-7056, e-mail: [email protected] John J. Myers, Ph.D., P.E., Assistant Professor of Civil Engineering, Center for Infrastructures Engineering Studies, University of Missouri-Rolla, 218 Engineering Research Laboratory, Rolla MO, 65409-0710, USA. Tel: (573) 341-6618, Fax: (573) 341-6215, e-mail: [email protected]. Justin Linz, University of Missouri-Rolla, 1006 Kingshighway, Rolla MO, 65409-0660, USA. Tel: (573) 341-6714, Fax: (573) 341-4368, e-mail: [email protected].
ABSTRACT
The failure of a reinforced concrete member strengthened with FRP laminates may be caused by crushing of concrete, rupture of FRP laminates, or by the de-lamination of the FRP sheet. Therefore, the effectiveness and failure mode of fiber-reinforced polymer (FRP) sheets applied to beams and columns is related to the degree of adhesion of the epoxy to the concrete surface. When a peeling or de-lamination failure can be avoided, a more effective engagement of the FRP sheet occurs which results in more efficient use of material.
One of the principal factors affecting the bond behavior between the concrete and epoxy is the roughness of the concrete substrate. To prepare the bond surface, sand blasting or grinding is typically used to roughen the concrete. To that end, a portable device has been developed to measure the roughness of concrete surfaces. This device can be used as a quality control tool to characterize surface roughness and identify when an adequate surface preparation has been attained. The method uses laser striping and image analysis.
The method was tested on 6 slabs of sand blasted concrete, which were sandblasted to varying degrees of surface roughness, and a series of 9 plastic model concrete surface profiles.
KEYWORDS
Fiber reinforced polymers, FRP, de-lamination, concrete, surface roughness.
INTRODUCTION
FRP Material Application to Highway Structures
The use of fiber reinforced polymers (FRP) for reinforcement of concrete members has emerged as one of the most promising technologies in materials and structural engineering to repair and strengthen our nation’s infrastructure (1,2,3,4,5,6,7). Current Federal Highway Administration (FHWA) statistics indicate that approximately one-fifth of our nation’s bridges constructed between 1950 and 1960 are structurally deficient (8). Of these, the vast majority are composed of reinforced or pre-stressed concrete. Much of the deterioration is attributed to aggressive environments and durability related issues. In particular, for highway structures where de-icing salts are predominantly used, corrosion related problems associated with mild steel reinforcing or pre-stressing strands has stood out as a major contributor to the deterioration.
Fiber reinforced polymers are ideally suited for repair and strengthening of concrete structures in aggressive environments due to their non-corrosive, non-magnetic characteristics. They have high tensile

Maerz, H., Chepur, P., Myers, J., Linz, J, “Concrete Roughness Characterization Using Laser Profilometry for Fiber-Reinforced Polymer Sheet Application,” Transportation Research Board, 80th Annual Meeting, January 7-11, 2001,Washington, D.C., Paper No. 01-0139
2
Figure 1, left: Application of FRP sheet on one-way joist. Figure 2, right: De-lamination of externally bonded FRP sheets. strength to weight ratio and high elastic limit. Externally applied FRP sheets or laminates (Figure 1) are bonded directly to a concrete surface with an epoxy providing additional flexural or shear strength capacity depending on the application and fiber alignment. This significantly increases the load carrying ability of a structural component and/or structural system.
Although durability-related concerns for new structures can be addressed using modern techniques that include cathodic protection, epoxy-coated reinforcing, and non-corrosive materials, existing deficient structures must be rehabilitated and upgraded in a cost effective way with minimal disruption to service. Research has shown that repair of concrete structures with FRP products including externally applied FRP materials has proved to be a viable and cost effective alternative to traditional repair and strengthening techniques to upgrade deficient structures to meet today’s design standards (3,4,5,6,7,9).
Substrate Roughness, Bond Strength, and FRP Performance
The load carrying ability of FRP reinforced members, and their long-term durability performance is very much related to the bonding characteristics of the epoxy to the concrete substrate. Experience has shown that when de-lamination of the FRP sheets occurs (Figure 2), the load bearing capability of the strengthened member is greatly reduced since the FRP sheet is no longer fully engaged to the concrete. Research conducted has indicated that the bond strength between the FRP-epoxy matrix and the concrete depends on a number of factors including the material properties of the epoxy as well as the properties of the concrete substrate (10,11,12). The epoxy-concrete bond strength is affected by the s trength, roughness, and cleanliness of the prepared concrete surface.
The effectiveness of any externally bonded FRP reinforcement is affected by the quality of the bond between the reinforcement and the concrete surface to which it is applied and also by the strength of the concrete substrate. Improper bonding may cause failure resulting from the FRP reinforcement detaching or peeling from the concrete substrate.
Observations of de-lamination of the FRP sheets have led to the speculation that the roughness of the concrete surface is an important factor for obtaining the best bond strength of the concrete and FRP (10,11,12). If surface roughness were measured accurately and controlled during the installation process, more reliable bond strength and bond failure mode could be predicted.
Surface characterization of concrete surfaces requires that a surface or surface profile can be measured and characterized in terms of its roughness. The focus of this paper is on the development of a laser-based device designed to measure the roughness of prepared concrete surfaces prior to the application of FRP sheets.

Maerz, H., Chepur, P., Myers, J., Linz, J, “Concrete Roughness Characterization Using Laser Profilometry for Fiber-Reinforced Polymer Sheet Application,” Transportation Research Board, 80th Annual Meeting, January 7-11, 2001,Washington, D.C., Paper No. 01-0139
3
Figure 3: Plastic model concrete surface profiles. The profiles are ordered 1 to 9 in order of increasing roughness, and correspond to acid etching, grinding, light shotblast, light scarification, medium shotblast, medium scarification, heavy abrasive blast, scabbing, and heavy scarification.
CONCRETE SURFACE ROUGHNESS
State of the Art
There is currently no means to effectively measure roughness of concrete. The state of the art is to subjectively compare the concrete surface to concrete surface profiles (CSP) in the form of 9 plastic model surfaces produced by the International Concrete Repair Institute (13) (Figure 3).
Surface Roughness Measurements in Other Fields
According to American National Standards Institute (ANSI) (14), the methods for measuring roughness and surface texture can be classified into three types: contacting methods, taper sectioning, and optical methods.
Among the contacting methods (14), stylus type profilometers give precise measurements along a linear traverse. Usually the vertical deflection of the stylus is recorded as a function of position. Other contacting methods include tactile tests, measurement of kinetic friction, measurement of static friction, use of rolling ball measurements, and measurement of the compliance of a metal sphere with a rough surface (15).
Taper sectioning is used in metallurgy and consists of cutting across a surface at a low angle α to physically amplify the height of asperities by cot α (15).
Non-contacting (14) or optical methods include optical reflecting instruments, light microscopy, electron microscopy, speckle metrology, interferometry, and laser profilometry. Light section microscopy (16) illuminates a rough surface with a thin slit of light at an angle of 45°. The surface is observed at an angle of 90° from the direction of illumination. The projected slit appears as a straight line if the surface is flat and as a progressively more undulating line as the roughness of the surface increases.
Interferometry and speckle interferometry (16) make use of interference fringes produced when monochromatic or laser light is reflected off a rough surface and a flat reference surface. The fringes are contours of roughness of about one-half the wavelength of the light used. This method is thus applicable only to surfaces with roughness of small amplitudes.
In civil engineering, the traditional method for measuring surface quality has been to place a 3-meter straightedge on the surface and to measure the maximum deviation between the straightedge and the

Maerz, H., Chepur, P., Myers, J., Linz, J, “Concrete Roughness Characterization Using Laser Profilometry for Fiber-Reinforced Polymer Sheet Application,” Transportation Research Board, 80th Annual Meeting, January 7-11, 2001,Washington, D.C., Paper No. 01-0139
4
surface (17). This measurement can then be compared to a specification of finishing tolerances. The difficulty with this method is that this measures not roughness but rather the maximum amplitude of the surface, typically at a large wavelength.
In rock mechanics, where roughness of discontinuity surfaces plays a vital role in the stability of rock slopes, a pragmatic approach has typically been applied. As with measuring roughness of concrete on bridges and other structures, the techniques are oriented to fieldwork rather than laboratory investigations.
Barton & Choubey (18) developed a Joint Roughness Coefficient (JRC) scale to quantify roughness of a 100-mm surface profile. The values for the smoothest to the roughest discontinuities range from a value of 1 to 20, and type profiles can be subjectively compared to actual surfaces.
Franklin (19) developed a photographic technique, using the principles of the Schmaltz microscope (20), for obtaining a shadow profile by casting a shadow with a straight edge, keeping the light source at 45 degrees to the joint surface to avoid distortion. Maerz (16) used shadow profilometry to measure the roughness of rock discontinuity surfaces, for the purpose of predicting rock stability, deformity, and hydraulic conductivity.
PRINCIPLE OF LASER PROFILING
Introduction
A new portable concrete roughness testing device, an optical laser–based imaging system has been developed along the principles of Schmaltz microscope (20) and the method of shadow profilometry (16), that uses a laser profiling line rather than a shadow edge. This procedure is called ‘laser striping’. The laser used has a multiple line generator that produces a non-gaussian, i.e., uniform distribution of light intensity along the line. This new device is a portable imaging device that can be used to measure roughness in both research and production environments.
Imaging Principles
Using laser striping, a rough concrete surface is illuminated with thin slits of red laser light at an angle of 45 degrees, and the surface is observed at 90 degrees (Figures 4 -8). The projected slit of light appears as a straight line if the surface is flat, and as a progressively more undulating line as the roughness of the surface increases. A 20-mw 678-nm striping laser with eleven stripes is mounted at 45 degrees with a standoff distance of about 170 mm to the surface. Lasers with one, five or eleven stripes were used.
A high-resolution (tiny) board CCD camera with a 7.5-mm lens is mounted vertically in the housing with a standoff distance of about 150-mm.
A 678 nm bandpass filter is placed over the camera lens that rejects both high frequency and low frequency light and allows only the laser light to pass through to the camera.
The video image of the laser stripes is digitized with a PCMCIA framegrabber on a laptop computer, at a resolution of 640 by 480 picture elements (pixels) color image.
Image Processing Principles
Classical image processing techniques are used to transform the image of the laser stripes into a series of profiles in x-y space, using a c++ development environment. The following are the image processing steps:
1. The image is transformed from a 24-bit color image to an 8-bit graytone image by isolating the red
color information in the picture. 2. A 5 by 1 pixel de-speckling (median) filter is applied in a horizontal direction to remove noise.
Applying it parallel to the laser stripes makes it most efficient in terms increasing the signal to noise ratio.
3. A low pass (gaussian) filter is applied to further remove unwanted noise from the image. 4. A thresholding filter is used to isolate the leading edge of each of the stripes. 5. A “line walking” technique is used to walk the edge of each stripe, and record the x-y coordinates
of each stripe.

Maerz, H., Chepur, P., Myers, J., Linz, J, “Concrete Roughness Characterization Using Laser Profilometry for Fiber-Reinforced Polymer Sheet Application,” Transportation Research Board, 80th Annual Meeting, January 7-11, 2001,Washington, D.C., Paper No. 01-0139
5
Figure 4, left: Schematic representation of the laser profiling equipment. Figure 5, right: Prototype of the laser profiling device.
Figure 6, left: CCD camera. Figure 7, center: Line laser. Figure 8, right: Image of a concrete surface being illuminated by an 11-line generator.
Analysis Principles
The profiles in x-y space are analyzed to provide various statistics. The most useful of the statistic are the Z2, Rp, and iA parameters:
The root mean square of the first derivative of the profile (21) is a single parameter measure that characterizes a profile based on its average slope:
∑=
=n
i
dydxn
Z1
222 )(
)(1
[1]
where n = number of evenly spaced sampling points; dx = distance between points along sampling line;
dy = distance between points normal to sampling line. The roughness profile index (Rp) is defined as the ratio of the true length of a fracture surface trace to its
projected length in the fracture plane (22). The micro-average inclination angle (iA) (16), is the average of the pixel to pixel angles of the stripe
profile:

Maerz, H., Chepur, P., Myers, J., Linz, J, “Concrete Roughness Characterization Using Laser Profilometry for Fiber-Reinforced Polymer Sheet Application,” Transportation Research Board, 80th Annual Meeting, January 7-11, 2001,Washington, D.C., Paper No. 01-0139
6
∑=
=n
ijA I
ni
1
1 [2]
where n = number of evenly spaced sampling points; I = inclination angle between points along sampling line.
Figure 8: Manufactured concrete surface profiles.
Maerz, H., Chepur, P., Myers, J., Linz, J, “Concrete Roughness Characterization Using Laser Profilometry for Fiber-Reinforced Polymer Sheet Application,” Transportation Research Board, 80th Annual Meeting, January 7-11, 2001,Washington, D.C., Paper No. 01-0139
7
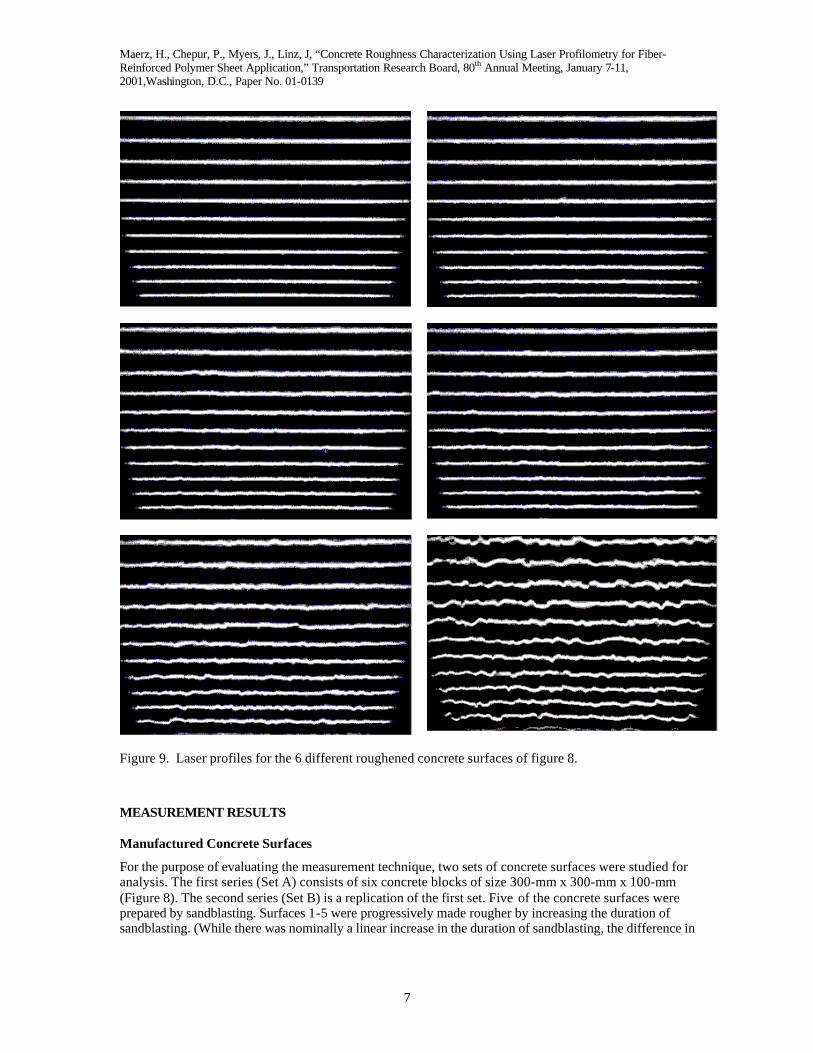
Figure 9. Laser profiles for the 6 different roughened concrete surfaces of figure 8.
MEASUREMENT RESULTS
Manufactured Concrete Surfaces
For the purpose of evaluating the measurement technique, two sets of concrete surfaces were studied for analysis. The first series (Set A) consists of six concrete blocks of size 300-mm x 300-mm x 100-mm (Figure 8). The second series (Set B) is a replication of the first set. Five of the concrete surfaces were prepared by sandblasting. Surfaces 1-5 were progressively made rougher by increasing the duration of sandblasting. (While there was nominally a linear increase in the duration of sandblasting, the difference in

Maerz, H., Chepur, P., Myers, J., Linz, J, “Concrete Roughness Characterization Using Laser Profilometry for Fiber-Reinforced Polymer Sheet Application,” Transportation Research Board, 80th Annual Meeting, January 7-11, 2001,Washington, D.C., Paper No. 01-0139
8
4
5
6
7
8
9
10
11
12
13
14
0 1 2 3 4 5
Concrete Block #
Ave
rage
Incl
inat
ion
Ang
le (d
egre
es)
Figure 10. Roughness measurement results for the 6 concrete surfaces in terms of the average inclination angle of the profiles. roughness between samples was found to be decidedly non-linear). Surface 0 was made smooth by grinding. (The two sets were originally manufactured as 600-mm by 300-mm slabs and then cut in half.
For the purpose of characterizing the surfaces, for each of the surfaces, measurements were taken at three different orientations, two different positions, with two r eplicates for each measurement. In total 144 measurements were taken. All measurements were taken with an 11-line laser at a 100 mm base length.
The result of the analysis (Figure 10) reveals that the surfaces can be characterized in terms of the average inclination angle of the profiles. While surfaces 0 and 1, and surfaces 5 and 6 are very distinctive, surfaces 2 and 3 are very similar to each other. This reflects the fact that the actual roughness of the two surfaces is very similar.
Statistical Results:
The experimental design was set up so that the following factors, which may influence the measurement, were considered:
1. Surface roughness (the desired parameter); 2. Set (2 sets of surfaces were analyzed); 3. Profile orientation (to determine anisotropy); 4. Profile position (to determine homogeneity); 5. Control (replicates to test the variability in the method).
Analysis of variance was performed on the experiments using Split-Split-Plot design, producing the
following results: 1. The different blocks within each series were of significantly different roughness (Figure 10). (The
results for both the series indicated that the roughness of the blocks did not increase linearly.) 2. There was a two-way interaction effect of the set within the blocks, for Set A and Set B.

Maerz, H., Chepur, P., Myers, J., Linz, J, “Concrete Roughness Characterization Using Laser Profilometry for Fiber-Reinforced Polymer Sheet Application,” Transportation Research Board, 80th Annual Meeting, January 7-11, 2001,Washington, D.C., Paper No. 01-0139
9
3. The orientation of the profile lines was not very significant. 4. The position of the profile lines was significant.
Conclusions:
From these results the following conclusions can be drawn: 1. Laser profilometry is capable of measuring differences in roughness. 2. The sample surfaces, prepared by sand blasting with manual control, were inhomogeneous,
indicating that for characterizing this type of process multiple measurements at different locations may be needed.
3. The sample surfaces were isotropic, indicating that multiple measurements at different orientations may not be needed.
Standard Concrete Type Surfaces
The third series consists of plastic models of nine different concrete surface profiles (CSP) prepared by the International Concrete Repair Institute (13) (Figure 3). These profiles replicate the degree of roughness, which were considered for the purpose of application of coatings and sealers up to a thickness of 6.35-mm. Each profile carries a CSP number ranging from a base line of 1 (nearly smooth) through CSP 9 (very rough).
Figure 11. Examples of laser profiles for the 9 different plastic type profiles of Figure 3.

Maerz, H., Chepur, P., Myers, J., Linz, J, “Concrete Roughness Characterization Using Laser Profilometry for Fiber-Reinforced Polymer Sheet Application,” Transportation Research Board, 80th Annual Meeting, January 7-11, 2001,Washington, D.C., Paper No. 01-0139
10
0.20
0.25
0.30
0.35
0.40
0.45
0.50
0.55
0.60
0.65
0 2 4 6 8 10
PLastic Model #
Z2
Figure 12. Roughness measurement results for the 6 plastic type profiles in terms of the average inclination angle of the profiles.
For the purpose of evaluating the measurement technique, the laser striping technique was applied directly to the plastic models. For each plastic model, three different threshold values for the thresholding filter were selected, and three replicate measurements were taken. In total, eighty-one measurements were analyzed at a 100 mm base length.
The results of the analysis (Figure 12) reveal that the surfaces can be characterized in terms of the Z2 parameter. With the exception of surface 8, the plastic model surfaces are in order of ascending roughness, while not being completely linear, are nevertheless fairly evenly spaced. Surface 8 is clearly much rougher than the other surfaces.
Statistical Results:
The experimental design was set up such that the following factors, which may influence the measurement, were considered:
1. Surface roughness (the desired parameter); 2. Threshold value (the user selectable parameter used in the threshold filter); 3. Control (replicates to test the variability in the method).
Analysis of variance tests produced the following results:
1. The different CSP plastic models were of significantly different roughness. 2. Threshold values of 125 and 150 produced results that were not significantly different. 3. A Threshold value of 175 produced results that were significantly different.
Maerz, H., Chepur, P., Myers, J., Linz, J, “Concrete Roughness Characterization Using Laser Profilometry for Fiber-Reinforced Polymer Sheet Application,” Transportation Research Board, 80th Annual Meeting, January 7-11, 2001,Washington, D.C., Paper No. 01-0139
11
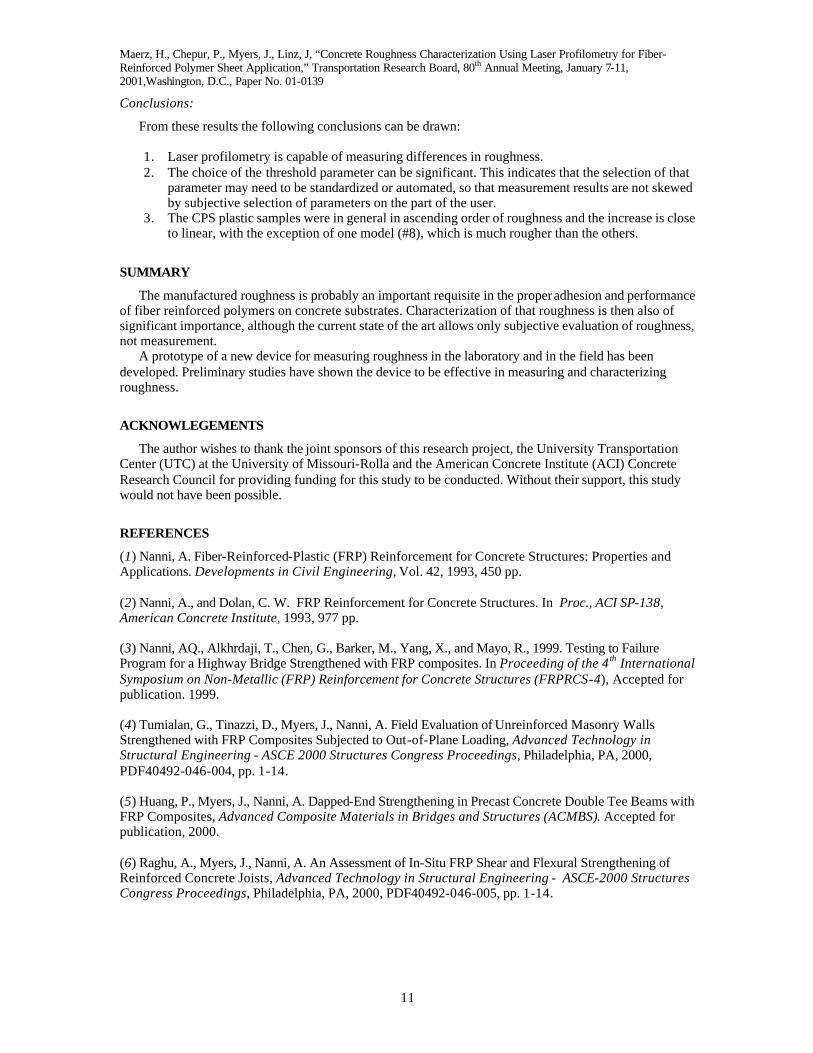
Conclusions:
From these results the following conclusions can be drawn: 1. Laser profilometry is capable of measuring differences in roughness. 2. The choice of the threshold parameter can be significant. This indicates that the selection of that
parameter may need to be standardized or automated, so that measurement results are not skewed by subjective selection of parameters on the part of the user.
3. The CPS plastic samples were in general in ascending order of roughness and the increase is close to linear, with the exception of one model (#8), which is much rougher than the others.
SUMMARY
The manufactured roughness is probably an important requisite in the proper adhesion and performance of fiber reinforced polymers on concrete substrates. Characterization of that roughness is then also of significant importance, although the current state of the art allows only subjective evaluation of roughness, not measurement.
A prototype of a new device for measuring roughness in the laboratory and in the field has been developed. Preliminary studies have shown the device to be effective in measuring and characterizing roughness.
ACKNOWLEGEMENTS
The author wishes to thank the joint sponsors of this research project, the University Transportation Center (UTC) at the University of Missouri-Rolla and the American Concrete Institute (ACI) Concrete Research Council for providing funding for this study to be conducted. Without their support, this study would not have been possible.
REFERENCES
(1) Nanni, A. Fiber-Reinforced-Plastic (FRP) Reinforcement for Concrete Structures: Properties and Applications. Developments in Civil Engineering, Vol. 42, 1993, 450 pp. (2) Nanni, A., and Dolan, C. W. FRP Reinforcement for Concrete Structures. In Proc., ACI SP-138, American Concrete Institute, 1993, 977 pp. (3) Nanni, AQ., Alkhrdaji, T., Chen, G., Barker, M., Yang, X., and Mayo, R., 1999. Testing to Failure Program for a Highway Bridge Strengthened with FRP composites. In Proceeding of the 4 th International Symposium on Non-Metallic (FRP) Reinforcement for Concrete Structures (FRPRCS-4), Accepted for publication. 1999. (4) Tumialan, G., Tinazzi, D., Myers, J., Nanni, A. Field Evaluation of Unreinforced Masonry Walls Strengthened with FRP Composites Subjected to Out-of-Plane Loading, Advanced Technology in Structural Engineering - ASCE 2000 Structures Congress Proceedings, Philadelphia, PA, 2000, PDF40492-046-004, pp. 1-14. (5) Huang, P., Myers, J., Nanni, A. Dapped-End Strengthening in Precast Concrete Double Tee Beams with FRP Composites, Advanced Composite Materials in Bridges and Structures (ACMBS). Accepted for publication, 2000. (6) Raghu, A., Myers, J., Nanni, A. An Assessment of In-Situ FRP Shear and Flexural Strengthening of Reinforced Concrete Joists, Advanced Technology in Structural Engineering - ASCE-2000 Structures Congress Proceedings, Philadelphia, PA, 2000, PDF40492-046-005, pp. 1-14.

Maerz, H., Chepur, P., Myers, J., Linz, J, “Concrete Roughness Characterization Using Laser Profilometry for Fiber-Reinforced Polymer Sheet Application,” Transportation Research Board, 80th Annual Meeting, January 7-11, 2001,Washington, D.C., Paper No. 01-0139
12
(7) Myers, J., Yan, X., Nanni, A., 2000. An Assessment of Flexural Behavior of CFRP Prestressed Beams Subjected to Incremental Static Loading, American Society of Civil Engineers, ASCE Materials Journal, Submitted for Review June 2000. (8) Federal Highway Administration (FHWA). National Bridge Inventory Data Base, Washington, D.C. Data Inclusive to 1994. (9) Crasto, A., Kim, R. Y., Fowler, C., and Mistretta, J.P. Rehabilitation of Concrete Bridges Beams with Externally Bonded Composite Plates, Part 1. In Proceeding of the 1st International Conference on Composites in Infrastructure (ICCI096), Tucson, Arizona, 1996, pp. 857-869. (10) Miller, B., Nanni, A., and Bakis, C. E. Analytical Model for CFRP Sheets Bonded to Concrete. In Structural Faults + Repair-99, London, UK, 1999. (11) Miller, B. Bond Between Carbon Fiber Reinforced Polymer Sheets and Concrete. MS. Thesis, Department of Civil Engineering, University of Missouri-Rolla, Rolla, MO., 1999. (12) Miller, B., Nanni, A. Bond Between CFRP Sheets and Concrete. In Proceedings ASCE 5 th Materials Congress, Cincinnati, Ohio, 1999, pp. 240-247. (13) ICRI (International Concrete Repair Institute). Selecting and specifying concrete surface preparation for sealers, coating, and polymer overlays. Technical Guideline No. 03732, 1997, 41 pp. (14) ASME (American Society of Mechanical Engineers). American National Standard, Surface Texture, Waviness and Lay, New York, 1978. (15) Thomas T. R. Rough Surfaces, Published London, New York: Longman, 1982. (16) Maerz, N. Photoanalysis of Rock Fabric, Ph.D. Thesis, University of Waterloo, 1990, 230 pp. (17) Loov, R. E., and Rodway, L. E.. Determination of Elevation, Slope and Waviness of Surfaces Using the Procedures of CAN/CSA-A23.1-M90 Appendix E: 1990, 675p. (18) Barton, N. & Choubey, V. The Shear Strength of Rock Joints in Theory and in Practice. In Rock Mechanics. Vol. 10, 1977, pp. 1-54. (19) Franklin, J. A. & Maerz, N. & Bennet, C. P. Rock mass characterization using photoanalysis. International Journal of Mining and Geological Engineering, Vol. 6, 1988, pp. 97-112. (20) Schmaltz, G. Technishe Oberflächenkunde. Springer, Berlin, 1936, 286 pp. (21) Myers, M. O. Characterization of surface roughness. In Wear, Vol. 5, 1962, pp. 182-189. (22) El-Soundani, S. M. Profilometric Analysis of Fractures. In Metallography, Vol. 11, 1978, pp. 247-336.