Embed Size (px)
Citation preview
CONAGRA FOODS 2009 ANNUAL REPORT
CON
AGR
A FOO
DS, IN
C., 2011 ANN
UAL R
EPOR
T
117276_CVRS 1 7/25/11 3:38 PM

David W. K. Acheson, Ph.D.Glenelg, Md.Managing director, Food and Import Safety Leavitt Partners LLC
Robert E. Brackett, Ph.D.Bedford Park, Ill. Vice president and director,Institute for Food Safety and Health,Illinois Institute of Technology,Moffett Campus
Robert L. Buchanan, Ph.D. College Park, Md. Director and professor, Center for Food Safety and Security SystemsUniversity of Maryland
Michael P. Doyle, Ph.D. Griffin, Ga. Regents professor and director, University of Georgia Center for Food Safety
Craig Hedberg, Ph.D. Minneapolis, Minn.Professor, Division of Environmental Health Sciences, School of Public Health University of Minnesota
Jean D. Kinsey, Ph.D. St. Paul, Minn. Professor emeritus, Department of Applied Economics, and Director emeritus, The Food Industry CenterUniversity of Minnesota
David R. Lineback, Ph.D.Southport, N.C. Senior fellow,Joint Institute for Food Safety and Applied Nutrition (JIFSAN) University of Maryland
Martin Philbert, Ph.D. Northville, Mich. Dean of the School of Public Health and professor of Toxicology University of Michigan, Ann Arbor
Steve L. Taylor, Ph.D. Lincoln, Neb.Professor and director,Food Allergy Research & Resource Program, Dept. of Food Science & Technology University of Nebraska
FOOD SAFETY COUNCIL SCIENTIFIC ADVISORY BOARD
Susan I. Barr, Ph.D., R.D. Professor of NutritionThe University of British Columbia
Dennis M. Bier, M.D. Professor of PediatricsDirector, USDA/ARS Children’s Nutrition Research CenterBaylor College of Medicine
Fergus M. Clydesdale, Ph.D. Distinguished professor and directorof Food Science Policy AllianceUniversity of Massachusetts, Amherst
Johanna T. Dwyer, D.Sc., R.D. Director, Frances Stern Nutrition Center, Tufts Medical Center,Professor, School of Medicine and Friedman School of NutritionTufts University, Boston
Gary D. Foster, Ph.D.Professor of Medicine and Public Health, director of the Center for Obesity Research and EducationTemple University
Nancy Green, Ph.D. Retired professor, Nutrition Florida State University Vice president, Health and Wellness Policy (Retired), PepsiCo
Janet C. King, Ph.D.Senior scientist,Children’s HospitalOakland Research Institute,and professor, University ofCalifornia, Berkeley & Davis
David A. McCarron, M.D.Adjunct professor Department of Nutrition University of California, Davis
Sylvia Rowe PresidentSR Strategy
Mark A. Uebersax, Ph.D.Professor emeritus of Food Science and Human Nutrition Michigan State University
Sources: Above estimates were made using the Environmental Paper Network Paper Calculator v3.0 and the U.S. EPA’s Power Profiler.
ConAgra Foods is committed to reducing its impact on the environment. By producing our printed report using 169,675 pounds of paper made from 10 percent post-consumer recycled fiber as opposed to 100 percent virgin wood fiber, and printing with 100 percent renewable wind energy (RECs) we lessened the impact on the environment in the following ways:
521 trees preserved for the future
204 million BTUs of energy conserved
9,900 kWh of electricity offset
50,821 pounds of greenhouse gas reduced
229,170 gallons of water waste eliminated
14,516 pounds of solid waste eliminated
The paper, paper mills and the printers for this publication are all FSC® certified and meet the strict standards of the Forest Stewardship Council,TM which promotes environmentally appropriate, socially beneficial and economically viable management of the world’s forests.
This is a greener annual report.
our operatingprinciplessimplicityaccountabilitycollaborationimagination
Financial HighlightsDollars in millions, except per-share amounts MAY 29, 2011 MAY 30, 2010
Net sales 1 $ 12,303 $ 12,015
Gross profit 1,2 $ 2,913 $ 3,061
Operating profit 1,3 $ 1,649 $ 1,648
Income from continuing operations before income taxes and equity method investment earnings $ 1,225 $ 1,081
Income from continuing operations $ 830 $ 743
Income attributable to ConAgra Foods, Inc., common stockholders $ 817 $ 726
Diluted earnings per share from continuing operations
attributable to ConAgra Foods, Inc., common stockholders $ 1.90 $ 1.66
Diluted earnings per share from discontinued operations
attributable to ConAgra Foods, Inc., common stockholders $ (0.02) $ (0.04)
Diluted earnings per share $ 1.88 $ 1.62
Common stock price at year-end $ 25.04 $ 24.18
Annualized common stock dividend rate at year-end $ 0.92 $ 0.80
Employees at year-end 23,200 24,400
1 Amounts exclude the impact of discontinued operations of the frozen handhelds operations, the trading and merchandising operations, the Gilroy Foods & Flavors™ operations and the Fernando’s® operations. 2 Gross profit is defined as net sales less cost of goods sold. 3 Operating profit is defined as income from continuing operations before general corporate expense, interest expense (net), income tax expense, and equity method investment earnings. Refer to Note 22 to the Consolidated Financial Statements for a reconciliation of operating profit to income from continuing operations.
117276_CVRS 2 7/27/11 10:08 AM

CONAGRA FOODS 2011 ANNUAL REPORT 1
There’s no question: these are challenging times. But even in a high-inflation environment we grew EPS in fiscal 2011. We also: • Generated more than $1.3 billion in cash flows from operations,
ending our fourth quarter with $972 million of cash on hand and no outstanding commercial paper borrowings.
• Realized $280 million of cost savings in our Consumer Foods supply chain, in addition to what we saved in selling, general and administrative expenses.
• Raised our annualized dividend 15 percent and returned an additional $825 million to our shareholders through share repurchases.
• Opened our new state-of-the-art sweet potato processing facility in Delhi, La. — the first frozen food manufacturing plant in the world to earn LEED® Platinum certification from the U.S. Green Building Council.1
• Continued realizing the benefits of our strong innovation pipeline by introducing difference-makers like Orville Redenbacher’s® Pop Up Bowl® popcorn and Marie Callender’s® Bakes.
Over the last several years, we’ve built a strong foundation and an integrated operating platform. Now we’re aligning our resources to accelerate growth with renewed purpose and ambition.
Fellow shareholders,
Gary M. RodkinChief executive officer
We are aligningour resources toaccelerate growth
1 U.S. Green Building Council. usgbc.org. USGBC In the News. Jan. 26, 2011. “LEED” stands for “Leadership in Energy and Environmental Design.” LEED Platinum certification is the nationally accepted benchmark for the design, construction and operation of high-performance green buildings.
117276_TXT.indd 1 7/25/11 11:34 PM

2 CONAGRA FOODS 2011 ANNUAL REPORT
Marie Callender,s®
desserts posted double -digit
top-line growth in their first year
under our control.
117276_TXT.indd 2 7/25/11 11:34 PM
CONAGRA FOODS 2011 ANNUAL REPORT 3
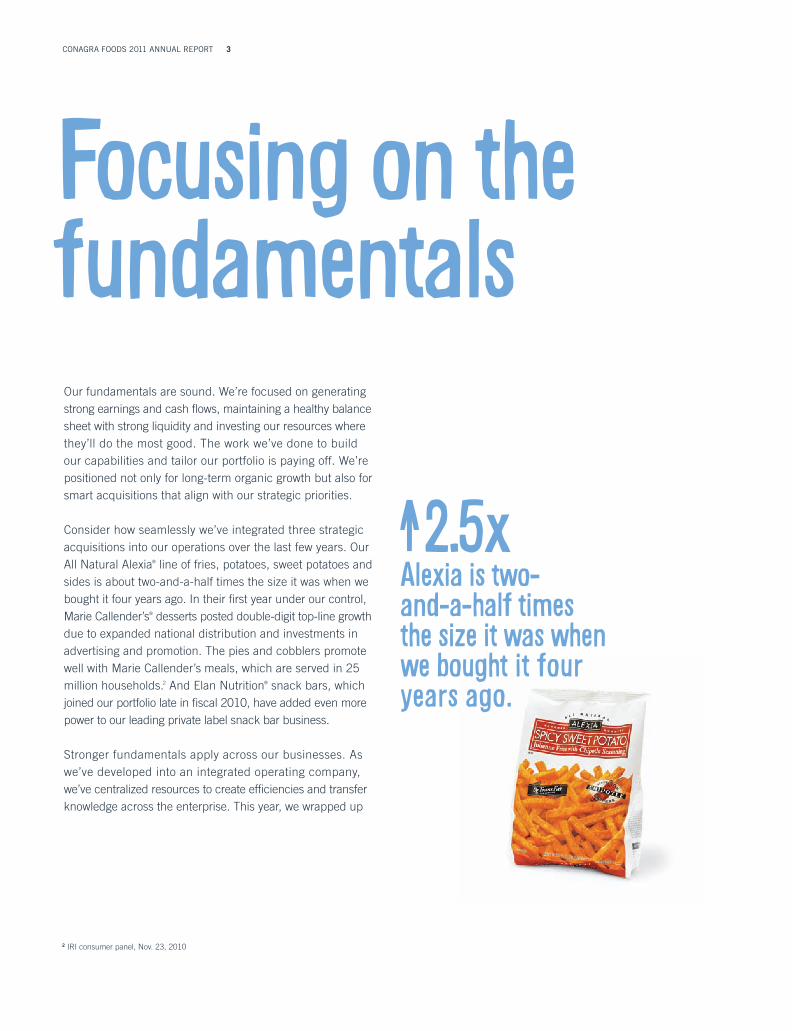
Our fundamentals are sound. We’re focused on generating strong earnings and cash flows, maintaining a healthy balance sheet with strong liquidity and investing our resources where they’ll do the most good. The work we’ve done to build our capabilities and tailor our portfolio is paying off. We’re positioned not only for long-term organic growth but also for smart acquisitions that align with our strategic priorities.
Consider how seamlessly we’ve integrated three strategic acquisitions into our operations over the last few years. Our All Natural Alexia® line of fries, potatoes, sweet potatoes and sides is about two-and-a-half times the size it was when we bought it four years ago. In their first year under our control, Marie Callender’s® desserts posted double-digit top-line growth due to expanded national distribution and investments in advertising and promotion. The pies and cobblers promote well with Marie Callender’s meals, which are served in 25 million households.2 And Elan Nutrition® snack bars, which joined our portfolio late in fiscal 2010, have added even more power to our leading private label snack bar business.
Stronger fundamentals apply across our businesses. As we’ve developed into an integrated operating company, we’ve centralized resources to create efficiencies and transfer knowledge across the enterprise. This year, we wrapped up
2 IRI consumer panel, Nov. 23, 2010
Focusing on the fundamentals
Alexia is two-and-a-half times the size it was when we bought it four years ago.
2.5xlv
117276_TXT.indd 3 7/26/11 2:43 PM

4 CONAGRA FOODS 2011 ANNUAL REPORT
The unique Slim Jim® 16-stick gable top carton
replaced a 16 -count canister,reducing packaging
materials by 325,600 pounds
per year.
We,ve generated $1.4 billion in savings in just five years through Consumer Foods supply chain productivity improvements.
Fuel for growth
our SAP implementation in the Consumer Foods segment and are using the new systems to optimize processes and extract value. Implementation is now under way and on schedule in the Commercial Foods segment.
The performance of our supply chain remains one of the best tools in our arsenal to combat cost inflation. In just five years, Consumer Foods supply chain productivity improvements have generated about $1.4 billion in savings, which we’ve used to fuel growth. There are plenty of savings to come, too, as we continue to develop a demand-driven supply chain, reduce complexity and achieve plant and network optimization. In no small measure, our supply chain successes can be traced to our ability to spread technology and best practices across geographies and lines of business. Last year alone, for example, our Sustainable Development program decreased our carbon footprint by 30,000 metric tonnes, reduced landfill waste by 51,000 tons, conserved 137 million gallons of water and generated $18 million of cost savings.
Harnessing the power of our people across several manufacturing platforms is making a big difference in driving productivity. Back in March, the nearly 2,500 employees in 15 plants across our Consumer Foods segment’s Snacks platform worked nine straight weeks — nearly a million hours — without a single recordable injury. Across the entire Consumer Foods organization, we decreased the Total Incident Rate, which measures incidents that require lost work time or restricted duty, by 16 percent last year. Our company’s safety principles empower employees (who know their equipment better than anyone) to recognize potential safety issues and act quickly to prevent or address them. Beyond ensuring a safe work environment, the company’s safety programs have a positive effect on productivity and quality — factors that help us grow.
117276_TXT.indd 4 7/25/11 11:34 PM

CONAGRA FOODS 2011 ANNUAL REPORT 5
117276_TXT.indd 5 7/26/11 3:26 PM

6 CONAGRA FOODS 2011 ANNUAL REPORT
Consumers trust Hunt,s® and many
other ConAgra Foods brands to make more
affordable meals at home.
117276_TXT.indd 6 7/25/11 11:35 PM
CONAGRA FOODS 2011 ANNUAL REPORT 7
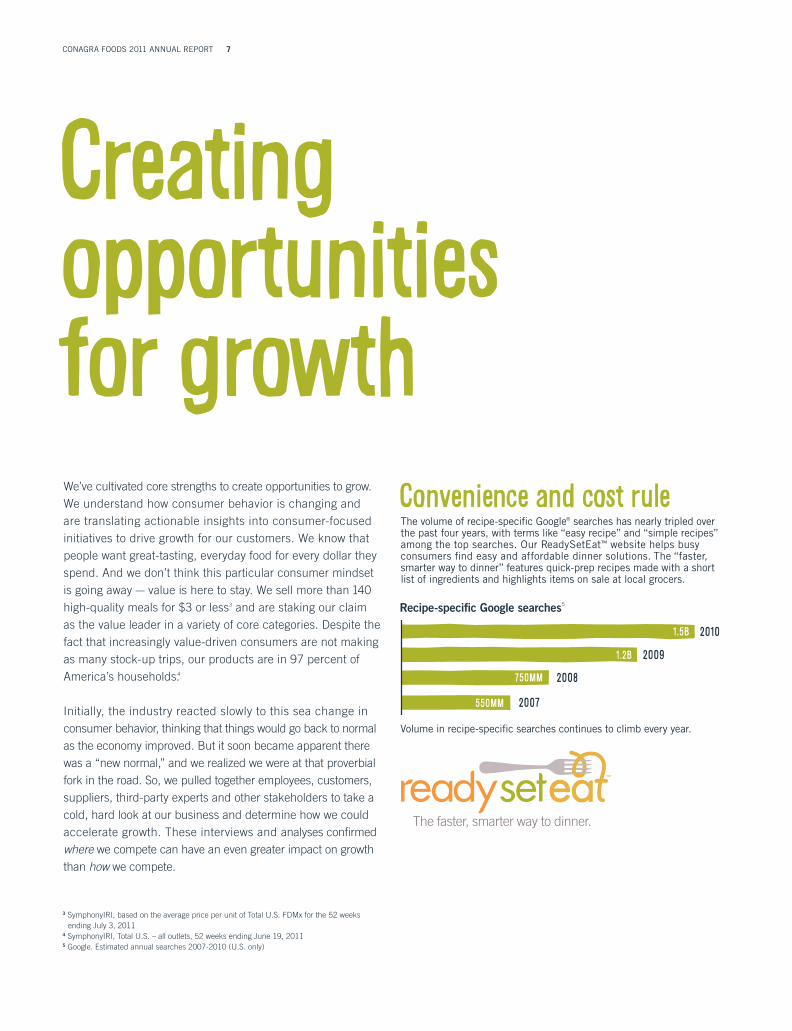
We’ve cultivated core strengths to create opportunities to grow. We understand how consumer behavior is changing and are translating actionable insights into consumer-focused initiatives to drive growth for our customers. We know that people want great-tasting, everyday food for every dollar they spend. And we don’t think this particular consumer mindset is going away — value is here to stay. We sell more than 140 high-quality meals for $3 or less3 and are staking our claim as the value leader in a variety of core categories. Despite the fact that increasingly value-driven consumers are not making as many stock-up trips, our products are in 97 percent of America’s households.4
Initially, the industry reacted slowly to this sea change in consumer behavior, thinking that things would go back to normal as the economy improved. But it soon became apparent there was a “new normal,” and we realized we were at that proverbial fork in the road. So, we pulled together employees, customers, suppliers, third-party experts and other stakeholders to take a cold, hard look at our business and determine how we could accelerate growth. These interviews and analyses confirmed where we compete can have an even greater impact on growth than how we compete.
3 SymphonyIRI, based on the average price per unit of Total U.S. FDMx for the 52 weeks ending July 3, 2011 4 SymphonyIRI, Total U.S. – all outlets, 52 weeks ending June 19, 20115 Google. Estimated annual searches 2007-2010 (U.S. only)
Convenience and cost rule
Creating opportunities for growth
The volume of recipe-specific Google® searches has nearly tripled over the past four years, with terms like “easy recipe” and “simple recipes” among the top searches. Our ReadySetEat™ website helps busy consumers find easy and affordable dinner solutions. The “faster, smarter way to dinner” features quick-prep recipes made with a short list of ingredients and highlights items on sale at local grocers.
Recipe-specific Google searches5
Volume in recipe-specific searches continues to climb every year.
0.0 0.3 0.6 0.9 1.2 1.5
117276_TXT.indd 7 7/26/11 10:42 AM

8 CONAGRA FOODS 2011 ANNUAL REPORT
We are making smart choices about where we compete by investing in faster-growing, strategic, adjacent categories to grow our core businesses, as we did when we purchased Marie Callender’s dessert pies, introduced Banquet® fruit pies, bought Elan Nutrition’s snack bars and expanded in sweet potatoes. We are aligning our organization with growingmarkets, such as Asia and Latin America, where we have a
stake in consumer and commercial foods businesses. In fiscal 2011, our international business represented about 10 percent of our sales. International highlights include:• Net sales growth of 11 percent in Lamb Weston’s
international business, driven by our ability to capitalize on the global expansion of quick-serve restaurants while strengthening our footprint in foodservice and retail in Asia, Latin America and the Middle East.
• An exceptional year for our Canadian business, which posted top-line net sales growth of 5 percent versus the same period a year ago. ConAgra Foods is the only major food company whose dollar growth is outpacing its volume growth in the price-competitive Complete Frozen Meal category in Canada.
• The introduction of an innovative, new direct sales model in Mexico, aimed at improving distribution and execution in the traditional channel (mom and pop stores), which represents approximately 80 percent of salty snack volume.7 Now serving 45,000 customers in seven cities, this model is focused primarily on ACT II® popcorn.
We are also pursuing growth in private label, where we have a significant presence already. Private label has a strong future, one where we can use our core capabilities to generate growth — and we intend to grow in private label.
6 AC Nielsen Market Track. All channels. Latest 52 weeks ending June 4, 20117 AC Nielsen – Retail Enhancement. All channels. Latest 52 weeks ending June 30, 20118 FDMx + Walmart, 52 weeks ending June 26, 2011
VH Steamers and Healthy Choice Gourmet SteamersTM helped ConAgra Foods post sales growth of 58 percent6 in the Complete Frozen Meal category in Canada over the past year.
l
v
58%R
R
117276_TXT.indd 8 7/26/11 6:24 PM

CONAGRA FOODS 2011 ANNUAL REPORT 9 Health and nutrition bars make up the fastest -growing
segment in the bar category.8 Strategic acquisitions, such as
Elan Nutrition, expand our capacity to fuel
short - and long- term growth opportunities.
117276_TXT.indd 9 7/25/11 11:35 PM

10 CONAGRA FOODS 2011 ANNUAL REPORT
Our customers and consumers look to us for innovation. You could say that it’s become an essential part of our DNA. Innovation is so important to our long-term growth strategy that we’ve introduced a new core operating principle — imagination — to drive innovation and breakthrough thinking throughout every part of the organization. We define “imagination” as “constantly thinking of new ways to do our job better no matter where we sit within ConAgra Foods.” Imagination illustrates our capacity for innovative problem-solving, which others are noticing, too.
Refrigerated & Frozen Foods magazine named our new sweet potato processing facility in Delhi, La., its Food Plant of the Year in the Fruits and Vegetables category, noting many innovations throughout the plant, including equipment specifically designed to optimize sweet potato processing. Recognized as the industry leader in whole grain innovation and premium multi-use flours, ConAgra Mills® was named the No. 1 Grain Products Supplier in Food Processing magazine’s Reader’s Choice Awards for the fourth year in a row. What’s remarkable about ConAgra Mills — in addition to its ability to put together a string of very profitable quarters (and years) — is the way it differentiates its products and services to add value for customers. With great-tasting, pioneering whole grain products, such as Ultragrain® whole wheat flour and Sustagrain® ultra-
high fiber barley, ConAgra Mills is at the forefront as consumers increasingly demand whole grain nutrition in a wide variety of foods. These grain-based innovations will be a key contributor to the company’s future growth. We’re innovating in our communication with consumers, too. From 2007 through 2010, Hebrew National® hot dogs bumped up its share of the beef hot dog category by two points with advertising focused on gaining household penetration.9 Its 2011 “Better-than-a-hot-dog hot dog” campaign drove a 19 percent increase in dollar sales over year-ago figures in the three weeks leading up to this year’s Super Bowl.®10
Innovating for growth
9 SymphonyIRI FDMx Scanner data for the 52 weeks ending Dec. 30, 2007, and the 52 weeks ending Dec. 26, 2010 10 SymphonyIRI FDMx Scanner data for the three weeks ending Feb. 6, 2011 11 NPD PotatoTrack, 12 months ending May 2011
Lamb Weston is the frozen sweet potato category leader, with
its Sweet Things® brand maintaining more
than a 66 percent share in foodservice.11
117276_TXT.indd 10 7/25/11 11:35 PM

CONAGRA FOODS 2011 ANNUAL REPORT 11
117276_TXT.indd 11 7/25/11 11:35 PM

12 CONAGRA FOODS 2011 ANNUAL REPORT
You can see plenty of new product innovation from ConAgra Foods, too. Consumers first heard about Orville Redenbacher’s new Pop Up Bowl microwave popcorn package in a Jan. 24 USA Today article that named it one of the top 10 consumer product trends for 2011. Early indications12 are that the Pop Up Bowl package is bringing momentum to the brand and setting the stage for a much-needed turnaround in the category.
Another top trend of 2011 identified by USA Today in that Jan. 24 article is sweet potatoes. “If 2011 is the year of anything, it’s the year of the sweet potato,” wrote the newspaper. U.S. per-capita consumption of sweet potato products grew more than 39 percent from 1998 through 2009,13 while servings of sweet potato products sold in restaurants have increased by 135 percent over the past four years.14 In fact, sweet potato products are now on the menu at 17 percent of all U.S. chains and independent restaurants, up from 15 percent just a year ago.15 On the retail side, our Alexia brand has a 43 percent share of the sweet potato category.16 In the frozen aisle, we’ve strengthened our reputation for innovation and staked out a position in frozen multi-serve meals with Marie Callender’s Bakes, using MicroRite®17 tray technology. MicroRite trays heat food evenly from the inside out. Plus, the trays allow food to brown and crisp in the microwave and cook up to 80 percent faster than it would cook in a conventional oven. Driven by innovation, such as
Marie Callender,s Bakes, volume for Marie Callender,s single-serve and multi-serve meals is up 21 percent since 2007.18
21%l
v
12 SymphonyIRI, Total U.S. FDMx, for the 4 weeks ending June 19, 2011 13 USDA Economic Research Service, 200914 NPD Crest, year ending May 201115 Datassential’s U.S. Chains & Independents MenuTrends Database, 201116 SymphonyIRI, Total U.S. FDMx for the 52 weeks ending July 10, 201117 MicroRite is a registered trademark of Graphic Packaging, Inc.18 SymphonyIRI, Total U.S. FDMx Scanner data for the 52 weeks ending May 29, 2011 (excludes desserts)
117276_TXT.indd 12 7/26/11 1:00 PM

CONAGRA FOODS 2011 ANNUAL REPORT 13
117276_TXT.indd 13 7/26/11 3:26 PM

14 CONAGRA FOODS 2011 ANNUAL REPORTThis year ,s Child Hunger Ends Here® campaign included a cal l to action on packages and our
first-ever employee Day of Service week.
117276_TXT.indd 14 7/26/11 10:43 AM

CONAGRA FOODS 2011 ANNUAL REPORT 15
Innovation is certainly one of the things that set us apart from the pack, but there’s more. For nearly a century, in one form or another, consumers have invited us into their homes, trusting brands such as Healthy Choice, Hebrew National, Reddi-wip,® and many more. Our purpose is to deliver everyday food in extraordinary ways. We make the food you count on — food that is approachable, accessible and affordable.
Unfortunately, for some, access to food isn’t always consistent, and people are usually shocked to find out that nearly 25 percent of American children don’t know where their next meal is coming from. That’s why ConAgra Foods and the ConAgra Foods Foundation have donated more than $40 million, more than 260 million pounds of food and funding for everything from delivery trucks to computer software to help fight hunger in the United States for nearly 20 years.
Now in its second year, Child Hunger Ends Here is the company’s biggest, most integrated cause-marketing campaign yet, pulling together consumers, customers, employees and Feeding America® (the nation’s largest network of food banks) to create a community of people passionate about fighting a problem that has only gotten worse during the economic downturn. This year’s campaign included a call to action on the packages of participating brands that will direct additional money to provide even more meals to Feeding America. We also launched a Day of Service during National Volunteer Week on which thousands of our employees banded together to help end child hunger in the communities where they live and work.
Once again this year, Corporate Responsibility Magazine named ConAgra Foods to its list of the 100 Best Corporate Citizens. The 100 Best Corporate Citizens List is known as one of the world’s top corporate responsibility rankings based on publicly available information and is recognized by PR Week as one of America’s top three most important business rankings. The list is based on more than 320 data points of publicly available information in seven categories, including environment, climate change, human rights, philanthropy, employee relations, financial performance and governance.
When it comes right down to it, our people set us apart. Whether they’re imagining better ways to drive business results or donating their own time and money to help in their communities, they have a generosity of spirit and a unity of purpose that have enabled us to align our resources to accelerate growth.
With that purpose and focus, we believe there are many more good things to come from ConAgra Foods. I’m excited about the prospects ahead. Thank you for your continued support.
Sincerely,
Gary M. RodkinChief executive officer
Everyday food in extraordinary ways
117276_TXT.indd 15 7/25/11 11:36 PM

16 CONAGRA FOODS 2011 ANNUAL REPORT
ConAgraFoodsisaprogressive,value-addedfoodcompanyfocusedondeliveringsustainable,profitablegrowth. ConAgra Foods is one of North America’s leading food companies and is the trusted name behind many leading branded and private label consumer food products. ConAgra Foods also has a strong business-to-business presence providing commercial food products to restaurants and other foodservice establishments.
ConAgra Foods reports its operations in two segments: Consumer Foods and Commercial Foods.
2011 CONTINUING OPERATIONS NET SALES65%ConsumerFoods35%CommercialFoods35% Commercial Foods
Our Consumer Foods segment manufactures and markets leading branded, private label and customized food products to retail and foodservice channels, principally in North America. With such major brands as ACT II,® Alexia,® Banquet,® Blue Bonnet,® Chef Boyardee,® Crunch ’n Munch,® DAVID,® Egg Beaters,® Fleischmann’s,® Healthy Choice,® Hebrew National,® Hunt’s,® Kid Cuisine,® Manwich,® Marie Callender’s,® Orville Redenbacher’s,® PAM,® Parkay,® Peter Pan,® Reddi-wip,® Rosarita,® Ro*Tel,® Slim Jim,® Snack Pack,® Swiss Miss,® Wesson,® and more, it’s no surprise that ConAgra Foods products are found in 97 percent of America’s households.
Consumer Foods
Commercial FoodsOur Commercial Foods segment manufactures and sells a variety of specialty products principally to foodservice, food manufacturing and industrial customers worldwide. Major brands include Lamb Weston,® a leading producer of quality frozen potato and sweet potato products and other vegetables, and a top supplier to foodservice and retail customers worldwide, and ConAgra Mills,® a top provider of premium multi-use flours with the broadest portfolio of whole grain ingredients in the industry, including such innovations as Ultragrain® whole wheat flour and Sustagrain® ultra-high fiber barley. Our Spicetec Flavors & Seasonings™ business creates value by selling a portfolio of flavors and seasoning blends, and J.M. Swank® is a national leader in food ingredient sourcing and distribution.
117276_TXT.indd 16 7/26/11 1:00 PM

UNITED STATESSECURITIES AND EXCHANGE COMMISSION
Washington, D.C. 20549
FORM 10-K(Mark One)
¥ ANNUAL REPORT PURSUANT TO SECTION 13 OR 15 (d) OF THE SECURITIESEXCHANGE ACT OF 1934
For the fiscal year ended May 29, 2011or
n TRANSITION REPORT PURSUANT TO SECTION 13 OR 15 (d) OF THE SECURITIESEXCHANGE ACT OF 1934For the transition period from to
Commission File No. 1-7275
CONAGRA FOODS, INC.(Exact name of registrant as specified in its charter)
Delaware 47-0248710(State or other jurisdiction ofincorporation or organization)
(I.R.S. EmployerIdentification No.)
One ConAgra DriveOmaha, Nebraska
(Address of principal executive offices)68102-5001
(Zip Code)
Registrant’s telephone number, including area code (402) 240-4000
Securities registered pursuant to section 12(b) of the Act:Title of each class Name of each exchange on which registered
Common Stock, $5.00 par value New York Stock ExchangeSecurities registered pursuant to section 12(g) of the Act: None
Indicate by check mark if the registrant is a well-known seasoned issuer, as defined in Rule 405 of the SecuritiesAct. Yes ¥ No n
Indicate by check mark if the registrant is not required to file reports pursuant to Section 13 or Section 15(d) of theAct. Yes n No ¥
Indicate by check mark whether the registrant (1) has filed all reports required to be filed by Section 13 or 15(d) of the SecuritiesExchange Act of 1934 during the preceding 12 months (or for such shorter period that the registrant was required to file such reports), and(2) has been subject to such filing requirements for the past 90 days. Yes ¥ No n
Indicate by check mark whether the registrant has submitted electronically and posted on its corporate Website, if any, everyInteractive Data File required to be submitted and posted pursuant to Rule 405 of Regulation S-T (232.405 of this chapter) during thepreceding 12 months (or for such shorter period that the registrant was required to submit and post such files). Yes ¥ No n
Indicate by check mark if disclosure of delinquent filers pursuant to Item 405 of Regulation S-K (229.405 of this chapter) is notcontained herein, and will not be contained, to the best of registrant’s knowledge, in definitive proxy or information statementsincorporated by reference in Part III of this Form 10-K or any amendment to this Form 10-K. n
Indicate by check mark whether the registrant is a large accelerated filer, an accelerated filer, a non-accelerated filer, or a smallerreporting company. See the definitions of “large accelerated filer,” “accelerated filer” and “smaller reporting company” in Rule 12b-2 ofthe Exchange Act. (Check one):
Large accelerated filer ¥ Accelerated filer n
Non-accelerated filer n (Do not check if a smaller reporting company) Smaller reporting company n
Indicate by check mark whether the registrant is a shell company (as defined in Rule 12b-2 of the Act). Yes n No ¥
The aggregate market value of the voting common stock of ConAgra Foods, Inc. held by non-affiliates on November 26, 2010 (thelast business day of the Registrant’s most recently completed second fiscal quarter) was approximately $9,415,620,630 based upon theclosing sale price on the New York Stock Exchange on such date.
At June 26, 2011, 410,795,628 common shares were outstanding.Documents incorporated by reference are listed on page 1.
Documents Incorporated by ReferencePortions of the Registrant’s definitive Proxy Statement for the Registrant’s 2011 Annual Meeting of Stockholders (the “2011 Proxy
Statement”) are incorporated into Part III.

TABLE OF CONTENTS
Page
PART I . . . . . . . . . . . . . . . . . . . . . . . . . . . . . . . . . . . . . . . . . . . . . . . . . . . . . . . . . . . . . . . . . . . . . . 3
Item 1 Business . . . . . . . . . . . . . . . . . . . . . . . . . . . . . . . . . . . . . . . . . . . . . . . . . . . . 3
Executive Officers of the Registrant . . . . . . . . . . . . . . . . . . . . . . . . . . . . . . . . 6
Item 1A Risk Factors . . . . . . . . . . . . . . . . . . . . . . . . . . . . . . . . . . . . . . . . . . . . . . . . . 9
Item 1B Unresolved Staff Comments . . . . . . . . . . . . . . . . . . . . . . . . . . . . . . . . . . . . . . 11
Item 2 Properties . . . . . . . . . . . . . . . . . . . . . . . . . . . . . . . . . . . . . . . . . . . . . . . . . . . 11
Item 3 Legal Proceedings . . . . . . . . . . . . . . . . . . . . . . . . . . . . . . . . . . . . . . . . . . . . . 12
Item 4 (Removed and Reserved) . . . . . . . . . . . . . . . . . . . . . . . . . . . . . . . . . . . . . . . . 13
PART II. . . . . . . . . . . . . . . . . . . . . . . . . . . . . . . . . . . . . . . . . . . . . . . . . . . . . . . . . . . . . . . . . . . . . . 13
Item 5 Market for Registrant’s Common Equity, Related Stockholder Matters andIssuer Purchases of Equity Securities . . . . . . . . . . . . . . . . . . . . . . . . . . . . . 13
Item 6 Selected Financial Data . . . . . . . . . . . . . . . . . . . . . . . . . . . . . . . . . . . . . . . . . 15Item 7 Management’s Discussion and Analysis of Financial Condition and Results of
Operations . . . . . . . . . . . . . . . . . . . . . . . . . . . . . . . . . . . . . . . . . . . . . . . . . 16Item 7A Quantitative and Qualitative Disclosures About Market Risk . . . . . . . . . . . . . . 34
Item 8 Financial Statements and Supplementary Data . . . . . . . . . . . . . . . . . . . . . . . . 36
Consolidated Statements of Earnings for the Fiscal Years Ended May 2011,2010, and 2009 . . . . . . . . . . . . . . . . . . . . . . . . . . . . . . . . . . . . . . . . . . . . . 36
Consolidated Statements of Comprehensive Income for the Fiscal Years EndedMay 2011, 2010, and 2009 . . . . . . . . . . . . . . . . . . . . . . . . . . . . . . . . . . . . . 37
Consolidated Balance Sheets as of May 29, 2011 and May 30, 2010 . . . . . . . . 38
Consolidated Statements of Common Stockholders’ Equity for the FiscalYears Ended May 2011, 2010, and 2009 . . . . . . . . . . . . . . . . . . . . . . . . . . . 39
Consolidated Statements of Cash Flows for the Fiscal Years Ended May 2011,2010, and 2009 . . . . . . . . . . . . . . . . . . . . . . . . . . . . . . . . . . . . . . . . . . . . . 40
Notes to Consolidated Financial Statements . . . . . . . . . . . . . . . . . . . . . . . . . . 41
Item 9 Changes in and Disagreements with Accountants on Accounting and FinancialDisclosure . . . . . . . . . . . . . . . . . . . . . . . . . . . . . . . . . . . . . . . . . . . . . . . . . 85
Item 9A Controls and Procedures. . . . . . . . . . . . . . . . . . . . . . . . . . . . . . . . . . . . . . . . . 85
Item 9B Other Information . . . . . . . . . . . . . . . . . . . . . . . . . . . . . . . . . . . . . . . . . . . . . 87
PART III . . . . . . . . . . . . . . . . . . . . . . . . . . . . . . . . . . . . . . . . . . . . . . . . . . . . . . . . . . . . . . . . . . . . . 87
Item 10 Directors, Executive Officers and Corporate Governance . . . . . . . . . . . . . . . . . 87
Item 11 Executive Compensation . . . . . . . . . . . . . . . . . . . . . . . . . . . . . . . . . . . . . . . . 87
Item 12 Security Ownership of Certain Beneficial Owners and Management andRelated Stockholder Matters . . . . . . . . . . . . . . . . . . . . . . . . . . . . . . . . . . . . 87
Item 13 Certain Relationships and Related Transactions, and Director Independence. . . 88
Item 14 Principal Accountant Fees and Services . . . . . . . . . . . . . . . . . . . . . . . . . . . . . 88
PART IV . . . . . . . . . . . . . . . . . . . . . . . . . . . . . . . . . . . . . . . . . . . . . . . . . . . . . . . . . . . . . . . . . . . . . 88
Item 15 Exhibits and Financial Statement Schedules . . . . . . . . . . . . . . . . . . . . . . . . . . 88
Signatures . . . . . . . . . . . . . . . . . . . . . . . . . . . . . . . . . . . . . . . . . . . . . . . . . . . . . . . . . . . 90
Schedule II . . . . . . . . . . . . . . . . . . . . . . . . . . . . . . . . . . . . . . . . . . . . . . . . . . . . . . . . . . 92
Exhibit Index. . . . . . . . . . . . . . . . . . . . . . . . . . . . . . . . . . . . . . . . . . . . . . . . . . . . . . . . . 94
2

PART I
ITEM 1. BUSINESS
a) General Development of Business
ConAgra Foods, Inc. (“ConAgra Foods”, “Company”, “we”, “us”, or “our”) is one of North America’s leadingfood companies, with consumer brands in 97% of America’s households sold in grocery, convenience, massmerchandise and club stores. ConAgra Foods also has a strong business-to-business presence, supplying frozenpotato and sweet potato products, as well as other vegetable, spice, and grain products to a variety of well-knownrestaurants, foodservice operators, and commercial customers.
The Company began as a flour-milling company and entered other commodity-based businesses. Over time,through various acquisitions and divestitures, we significantly changed our portfolio of businesses, focusing on addingbranded, value-added opportunities, while strategically divesting commodity-based businesses to become one of NorthAmerica’s leading food companies. Executing this strategy involved the acquisition over time of a number of brands suchas Banquet», Chef Boyardee», PAM», Marie Callenders», and Alexia». More notable divestitures have included adehydrated garlic, onion, capsicum and fresh vegetable operation, a trading and merchandising business, packaged meatand cheese operations, a poultry business, beef and pork businesses, and various other businesses. For more informationabout our more recent acquisitions and divestitures, see “Acquisitions” and “Divestitures” below. Our development overtime has also been aided by innovation and organic growth. Recent successes include: Healthy Choice» Café SteamersTM,Healthy Choice» Fresh MixersTM, Healthy Choice» All Natural Entrées, Marie Callender’s» Pasta Al Dente, and others.
We are focused on growing our core operations, expanding into adjacent categories, and increasing ourpresence in private label and international operations. Our core operations include the strategic product groups ofconvenient meals, potatoes, snacks, meal enhancers, and specialty items. We are also focused on sustainable salesand profit growth with strong and improving returns on invested capital. As part of continually strengthening ouroperating foundation, our major profit-enhancing initiatives have centered on and continue to include:
• Enhancing our portfolio by developing through innovation and acquiring of products that resonate withconsumers;
• Implementing high-impact, insights-based marketing programs;
• Partnering strategically with customers to improve linkage, strengthen relationships, and capitalize ongrowth opportunities;
• Improving trade spending effectiveness and pricing analytics;
• Achieving cost savings throughout the supply chain with continuous efficiency improvementprograms; and
• Implementing efficiency initiatives throughout the selling, general, and administrative functions.
The Company’s growth, efficiency, and portfolio improvement initiatives continue to be implemented withhigh standards of customer service, product safety, and product quality.
We were initially incorporated as a Nebraska corporation in 1919 and were reincorporated as a Delawarecorporation in December 1975.
b) Financial Information about Reporting Segments
We report our operations in two reporting segments: Consumer Foods and Commercial Foods. The contri-butions of each reporting segment to net sales, operating profit, and the identifiable assets are set forth in Note 22“Business Segments and Related Information” to the consolidated financial statements.
3

c) Narrative Description of Business
We compete throughout the food industry and focus on adding value for customers who operate in the retailfood, foodservice, and ingredients channels.
Our operations, including our reporting segments, are described below. Our locations, including distributionfacilities, within each reporting segment, are described in Item 2.
Consumer Foods
The Consumer Foods reporting segment includes branded, private label, and customized food products, whichare sold in various retail and foodservice channels, principally in North America. The products include a variety ofcategories (meals, entrées, condiments, sides, snacks, and desserts) across frozen, refrigerated, and shelf-stabletemperature classes.
Major brands include: Alexia», ACT II», Banquet», Blue Bonnet», Chef Boyardee», DAVID», Egg Beaters»,Healthy Choice», Hebrew National», Hunt’s», Marie Callender’s», Orville Redenbacher’s», PAM», Peter Pan»,Reddi-wip», Slim Jim», Snack Pack», Swiss Miss», Van Camp’s», and Wesson».
Commercial Foods
The Commercial Foods reporting segment includes commercially branded foods and ingredients, which aresold principally to foodservice, food manufacturing, and industrial customers. The segment’s primary productsinclude: specialty potato products, milled grain ingredients, a variety of vegetable products, seasonings, blends, andflavors which are sold under brands such as ConAgra Mills», Lamb Weston», and Spicetec Flavors & SeasoningsTM.
Unconsolidated Equity Investments
We have a number of unconsolidated equity investments. Significant affiliates produce and market potatoproducts for retail and foodservice customers.
Acquisitions
In June 2011, subsequent to the end of our fiscal 2011, we purchased the Marie Callender’s» brand trademarkfrom Marie Callender Pie Shops, Inc.
During fiscal 2011, we acquired the assets of American Pie, LLC, a manufacturer of frozen fruit pies, thaw andserve pies, fruit cobblers, and pie crusts under the licensed Marie Callender’s» and Claim Jumper» trade names, aswell as frozen dinners, pot pies, and appetizers under the Claim Jumper» trade name. This business is included inthe Consumer Foods segment.
During fiscal 2010, we acquired Elan Nutrition, Inc., a privately held formulator and manufacturer of privatelabel snack and nutrition bars. This business is included in the Consumer Foods segment.
During fiscal 2009, we acquired Saroni Sugar & Rice, Inc., a distribution company included in the CommercialFoods segment.
Also during fiscal 2009, we acquired a 49.99% interest in Lamb Weston BSW, LLC (“Lamb Weston BSW” orthe “venture”), a potato processing joint venture with Ochoa Ag Unlimited Foods, Inc. (“Ochoa”). This venture isconsidered a variable interest entity for which we are the primary beneficiary and is consolidated in our financialstatements. This business is included in the Commercial Foods segment.
Divestitures
In May 2011, we completed the sale of substantially all of the assets of our frozen handhelds operations. Wereflected the results of these operations as discontinued operations for all periods presented. The assets of thediscontinued frozen handhelds operations have been reclassified as assets held for sale within our consolidatedbalance sheets for all periods presented prior to divestiture.
4

In the first quarter of fiscal 2011, we completed the sale of substantially all of the assets of Gilroy Foods & FlavorsTM
dehydrated garlic, onion, capsicum and Controlled MoistureTM, GardenFrost», Redi-MadeTM, and fresh vegetableoperations. We reflected the results of these operations as discontinued operations for all periods presented. The assetsand liabilities of the discontinued Gilroy Foods & FlavorsTM dehydrated vegetable business have been reclassified asassets and liabilities held for sale within our consolidated balance sheets for the period prior to divestiture.
During fiscal 2010, we completed the divestiture of the Fernando’s» foodservice brand. We reflected theresults of these operations as discontinued operations for all periods presented.
During fiscal 2009, we completed the sale of our Pemmican» beef jerky business. Due to our continuinginvolvement with the business through providing sales and distribution support to the buyer, the results ofoperations of the Pemmican» business have not been reclassified as discontinued operations.
During fiscal 2009, we completed the sale of our trading and merchandising operations (previously principallyreported as the Trading and Merchandising segment). We reflected the results of these operations as discontinuedoperations for all periods presented.
General
The following comments pertain to both of our reporting segments.
ConAgra Foods is a food company that operates in many sectors of the food industry, with a significant focuson the sale of branded and value-added consumer products, as well as foodservice products and ingredients. We alsomanufacture and sell private label products. We use many different raw materials, the bulk of which arecommodities. The prices paid for raw materials used in our products generally reflect factors such as weather,commodity market fluctuations, currency fluctuations, tariffs, and the effects of governmental agricultural pro-grams. Although the prices of raw materials can be expected to fluctuate as a result of these factors, we believe suchraw materials to be in adequate supply and generally available from numerous sources. We have faced increasedcosts for many of our significant raw materials, packaging, and energy inputs in the last twelve months. We seek tomitigate the higher input costs through productivity and pricing initiatives, and through the use of derivativeinstruments used to economically hedge a portion of forecasted future consumption.
We experience intense competition for sales of our principal products in our major markets. Our productscompete with widely advertised, well-known, branded products, as well as private label and customized products.Some of our competitors are larger and have greater resources than we have. We compete primarily on the basis ofquality, value, customer service, brand recognition, and brand loyalty.
Demand for certain of our products may be influenced by holidays, changes in seasons, or other annual events.
We manufacture primarily for stock and fill customer orders from finished goods inventories. While at anygiven time there may be some backlog of orders, such backlog is not material in respect to annual net sales, and thechanges of backlog orders from time to time are not significant.
Our trademarks are of material importance to our business and are protected by registration or other means inthe United States and most other markets where the related products are sold. Some of our products are sold underbrands that have been licensed from others. We also actively develop and maintain a portfolio of patents, althoughno single patent is considered material to the business as a whole. We have proprietary trade secrets, technology,know-how, processes, and other intellectual property rights that are not registered.
Many of our facilities and products are subject to various laws and regulations administered by theUnited States Department of Agriculture, the Federal Food and Drug Administration, the Occupational Safetyand Health Administration, and other federal, state, local, and foreign governmental agencies relating to the qualityand safety of products, sanitation, safety and health matters, and environmental control. We believe that we complywith such laws and regulations in all material respects, and that continued compliance with such regulations will nothave a material effect upon capital expenditures, earnings, or our competitive position.
Our largest customer, Wal-Mart Stores, Inc. and its affiliates, accounted for approximately 18%, 18%, and17% of consolidated net sales for fiscal 2011, 2010, and 2009, respectively.
5

At May 29, 2011, ConAgra Foods and its subsidiaries had approximately 23,200 employees, primarily in theUnited States. Approximately 48% of our employees are parties to collective bargaining agreements. Of theemployees subject to collective bargaining agreements, approximately 40% are parties to collective bargainingagreements that are scheduled to expire during fiscal 2012. We believe that our relationships with employees andtheir representative organizations are good.
Research and Development
We employ processes at our principal manufacturing locations that emphasize applied research and technicalservices directed at product improvement and quality control. In addition, we conduct research activities related tothe development of new products. Research and development expense was $81 million, $78 million, and $78 millionin fiscal 2011, 2010, and 2009, respectively.
EXECUTIVE OFFICERS OF THE REGISTRANT AS OF JULY 19, 2011
Name Title & Capacity Age
Year FirstAppointed an
ExecutiveOfficer
Gary M. Rodkin . . . . . . . . . . . . President and Chief Executive Officer 59 2005John F. Gehring . . . . . . . . . . . . Executive Vice President, Chief Financial
Officer50 2004
Colleen R. Batcheler . . . . . . . . Executive Vice President, General Counsel andCorporate Secretary
37 2008
André J. Hawaux . . . . . . . . . . . President, Consumer Foods 50 2006Brian L. Keck . . . . . . . . . . . . . Executive Vice President and Chief
Administrative Officer58 2010
Patrick D. Linehan . . . . . . . . . . Senior Vice President, Corporate Controller 42 2009Paul T. Maass . . . . . . . . . . . . . President, Commercial Foods 45 2010Scott E. Messel . . . . . . . . . . . . Senior Vice President, Treasurer and
Assistant Corporate Secretary 52 2001
Gary M. Rodkin joined ConAgra Foods as Chief Executive Officer in October 2005. Prior to joining ConAgraFoods, he was Chairman and Chief Executive Officer of PepsiCo Beverages and Foods North America (a division ofPepsiCo, Inc., a global snacks and beverages company) from February 2003 to June 2005. He was named Presidentand Chief Executive Officer of PepsiCo Beverages and Foods North America in 2002. Prior to that, he was Presidentand Chief Executive Officer of Pepsi-Cola North America from 1999 to 2002, and President of Tropicana NorthAmerica from 1995 to 1998.
John F. Gehring has served ConAgra Foods as Executive Vice President, Chief Financial Officer since January2009. Mr. Gehring joined ConAgra Foods as Vice President of Internal Audit in 2002, became Senior Vice Presidentin 2003, and most recently served as Senior Vice President and Corporate Controller from July 2004 to January2009. He served as ConAgra Foods’ interim Chief Financial Officer from October 2006 to November 2006. Prior tojoining ConAgra Foods, Mr. Gehring was a partner at Ernst & Young LLP (an accounting firm) from 1997 to 2001.
Colleen R. Batcheler joined ConAgra Foods in June 2006 as Vice President, Chief Securities Counsel andAssistant Corporate Secretary. In September 2006, she was appointed Corporate Secretary, in February 2008, shewas named Senior Vice President, General Counsel and Corporate Secretary, and in September 2009, she wasnamed Executive Vice President, General Counsel and Corporate Secretary. From 2003 until joining ConAgraFoods, Ms. Batcheler was Vice President and Corporate Secretary of Albertson’s, Inc. (a retail food and drug chain).
André J. Hawaux joined ConAgra Foods in November 2006 as Executive Vice President, Chief FinancialOfficer. Prior to joining ConAgra Foods, Mr. Hawaux served as Senior Vice President, Worldwide Strategy &Corporate Development, PepsiAmericas, Inc. (a manufacturer and distributor of a broad portfolio of beverageproducts) from May 2005. Previously, from 2000 until May 2005, Mr. Hawaux served as Vice President and ChiefFinancial Officer for Pepsi-Cola North America (a division of PepsiCo, Inc.). Mr. Hawaux serves as a member ofthe Board of Trustees of the Southern New Hampshire University.
6

Brian L. Keck joined ConAgra Foods in September 2010 as Executive Vice President and Chief Adminis-trative Officer. In this role, he is responsible for Human Resources, Facilities and Real Estate, and Communi-cation & External Relations. Prior to ConAgra Foods, Mr. Keck was President and Chief Operating Officer ofMacy’s Inc.’s Midwest Division where he was responsible for sales, customer service, store operations, finance,distribution, human resources, IT, design and construction, and community affairs. Prior to that, Mr. Keck heldmultiple senior leadership responsibilities at the May Department Stores Company (acquired by Macy’s) in bothoperating divisions and corporate-wide roles. From 2000 to 2005, he led May’s Human Resources function afterhaving served as chairman of Meier & Frank Department Stores, a division of May.
Patrick D. Linehan has served ConAgra Foods as Senior Vice President, Corporate Controller since January2009. Mr. Linehan joined ConAgra Foods in August 1999 and held various positions of increasing responsibility,including Director, Financial Reporting, Vice President, Assistant Corporate Controller, and most recently as VicePresident, Finance from September 2006 until January 2009. Mr. Linehan briefly left ConAgra Foods to serve asController of a financial institution in April 2006 and returned to ConAgra Foods in September 2006. Prior tojoining ConAgra Foods, Mr. Linehan was with Deloitte LLP (an accounting firm).
Paul T. Maass was named President of the Commercial Foods business for ConAgra Foods in October 2010.Mr. Maass joined ConAgra Foods in 1988 as a commodity merchandiser in the trading business and quicklyprogressed through several roles at ConAgra Foods. In 2003, Mr. Maass was named President and General Managerof ConAgra Mills. He assumed responsibility for J.M. Swank in 2007 and for Spicetec Flavors & Seasonings in2010.
Scott E. Messel joined ConAgra Foods in August 2001 as Vice President and Treasurer, and in July 2004 wasnamed to his current position.
OTHER SENIOR OFFICERS OF THE REGISTRANT AS OF JULY 19, 2011
Name Title & Capacity Age
Albert D. Bolles . . . . . . . . . . . . . . . . . Executive Vice President, Research, Quality & Innovation 53Douglas A. Knudsen . . . . . . . . . . . . . . President, ConAgra Foods Sales 56Gregory L. Smith . . . . . . . . . . . . . . . . Executive Vice President, Supply Chain 47Joan K. Chow . . . . . . . . . . . . . . . . . . . Executive Vice President, Chief Marketing Officer 51Allen J. Cooper . . . . . . . . . . . . . . . . . . Vice President, Internal Audit 47Nicole B. Theophilus . . . . . . . . . . . . . . Senior Vice President, Human Resources 41
Albert D. Bolles joined ConAgra Foods in March 2006 as Executive Vice President, Research & Development,and Quality. He was named to his current position in June 2007. Prior to joining the Company, he was Senior VicePresident, Worldwide Research and Development for PepsiCo Beverages and Foods from 2002 to 2006. From 1993to 2002, he was Senior Vice President, Global Technology and Quality for Tropicana Products Incorporated.
Douglas A. Knudsen joined ConAgra Foods in 1977. He was named to his current position in May 2006. Hepreviously served the Company as President, Retail Sales Development from 2003 to 2006, President, Retail Salesfrom 2001 to 2003, and President, Grocery Product Sales from 1995 to 2001.
Gregory L. Smith joined ConAgra Foods in August 2001 as Vice President, Manufacturing. He previouslyserved the Company as President, Grocery Foods Group, Executive Vice President, Operations, Grocery FoodsGroup, and Senior Vice President, Supply Chain. He was named to his current position in December 2007. Prior tojoining ConAgra Foods, he served as Vice President, Supply Chain for United Signature Foods from 1999 to 2001and Vice President for VDK Frozen Foods from 1996 to 1999. Before that, he was with The Quaker Oats Companyfor eleven years in various operations, supply chain, and marketing positions.
Joan K. Chow joined ConAgra Foods in February 2007 as Executive Vice President, Chief Marketing Officer.Prior to joining ConAgra Foods, she served Sears Holding Corporation (retailing) as Senior Vice President andChief Marketing Officer, Sears Retail from July 2005 until January 2007 and as Vice President, Marketing Servicesfrom April 2005 until July 2005. From 2002 until April 2005, Ms. Chow served Sears, Roebuck and Co. as VicePresident, Home Services Marketing.
7

Allen J. Cooper joined ConAgra Foods in March 2003 and has held various finance and internal auditleadership positions with the Company, including Director, Internal Audit from 2003 until 2005; Vice President,Finance from 2005 until 2006; Vice President, Supply Chain Finance from 2006 until 2007; Senior Director,Finance; and most recently as Senior Director, Internal Audit. He was named to his current position in February2009. Prior to joining the Company, he was with Ernst & Young LLP (an accounting firm).
Nicole B. Theophilus joined ConAgra Foods in April 2006 as Vice President, Chief Employment Counsel. In2008, in addition to her legal duties, she assumed the role of Vice President, Human Resources for CommercialFoods. In November 2009, she was named to her current position. Prior to joining ConAgra Foods, she was anattorney and partner with Blackwell Sanders Peper Martin LLP (a law firm) from 1999 until 2006.
d) Foreign Operations
Foreign operations information is set forth in Note 22 “Business Segments and Related Information” to theconsolidated financial statements.
e) Available Information
We make available, free of charge through the “Our Company—Investors—Financial Reports & Filings” linkon our Internet website at http://www.conagrafoods.com, our annual report on Form 10-K, quarterly reports onForm 10-Q, current reports on Form 8-K, and amendments to those reports filed or furnished pursuant toSection 13(a) or 15(d) of the Securities Exchange Act of 1934, as soon as reasonably practicable after suchmaterial is electronically filed with or furnished to the Securities and Exchange Commission. We use our Internetwebsite, through the “Our Company—Investors” link, as a channel for routine distribution of important informa-tion, including news releases, analyst presentations, and financial information.
We have also posted on our website our (1) Corporate Governance Principles, (2) Code of Conduct, (3) Code ofEthics for Senior Corporate Officers, and (4) Charters for the Audit Committee, Nominating and GovernanceCommittee, and Human Resources Committee. Shareholders may also obtain copies of these items at no charge bywriting to: Corporate Secretary, ConAgra Foods, Inc., One ConAgra Drive, Omaha, NE, 68102-5001.
8

ITEM 1A. RISK FACTORS
The following risks and uncertainties could affect our operating results and should be considered in evaluatingus. While we believe we have identified and discussed below the key risk factors affecting our business, there maybe additional risks and uncertainties that are not presently known or that are not currently believed to be significantthat may adversely affect our business, performance, or financial condition in the future.
Deterioration of general economic conditions could harm our business and results of operations.
Our business and results of operations may be adversely affected by changes in national or global economicconditions, including inflation, interest rates, availability of capital markets, consumer spending rates, energyavailability and costs (including fuel surcharges), and the effects of governmental initiatives to manage economicconditions.
Volatility in financial markets and deterioration of national and global economic conditions could impact ourbusiness and operations in a variety of ways, including as follows:
• consumers may shift purchases to lower-priced private label or other value offerings, or may forego certainpurchases altogether during economic downturns, which may adversely affect the results of our ConsumerFoods operations;
• decreased demand in the restaurant business, particularly casual and fine dining, may adversely affect ourCommercial Foods operations;
• volatility in commodity and other input costs could substantially impact our result of operations;
• volatility in the equity markets or interest rates could substantially impact our pension costs and requiredpension contributions; and
• it may become more costly or difficult to obtain debt or equity financing to fund operations or investmentopportunities, or to refinance our debt in the future, in each case on terms and within a time periodacceptable to us.
Increases in commodity costs may have a negative impact on profits.
We use many different commodities such as wheat, corn, oats, soybeans, beef, pork, poultry, and energy.Commodities are subject to price volatility caused by commodity market fluctuations, supply and demand, currencyfluctuations, and changes in governmental agricultural programs. Commodity price increases will result inincreases in raw material costs and operating costs. We may not be able to increase our product prices andachieve cost savings that fully offset these increased costs; and increasing prices may result in reduced sales volumeand profitability. We have experience in hedging against commodity price increases; however, these practices andexperience reduce, but do not eliminate, the risk of negative profit impacts from commodity price increases.
Increased competition may result in reduced sales or profits.
The food industry is highly competitive, and increased competition can reduce our sales due to loss of marketshare or the need to reduce prices to respond to competitive and customer pressures. Competitive pressures also mayrestrict our ability to increase prices, including in response to commodity and other cost increases. In most productcategories, we compete not only with other widely advertised branded products, but also with private label productsthat are generally sold at lower prices. A strong competitive response from one or more of our competitors to ourmarketplace efforts, or a consumer shift towards private label offerings, could result in us reducing pricing,increasing marketing or other expenditures, or losing market share. Our profits could decrease if a reduction inprices or increased costs are not counterbalanced with increased sales volume.
9

The sophistication and buying power of our customers could have a negative impact on profits.
Many of our customers, such as supermarkets, warehouse clubs, and food distributors, have consolidated inrecent years and consolidation is expected to continue. These consolidations and the growth of supercenters haveproduced large, sophisticated customers with increased buying power and negotiating strength who are morecapable of resisting price increases and operating with reduced inventories. These customers may also in the futureuse more of their shelf space, currently used for our products, for their private label products. We continue toimplement initiatives to counteract these pressures. However, if the larger size of these customers results inadditional negotiating strength and/or increased private label competition, our profitability could decline.
We must identify changing consumer preferences and develop and offer food products to meet theirpreferences.
Consumer preferences evolve over time and the success of our food products depends on our ability to identifythe tastes and dietary habits of consumers and to offer products that appeal to their preferences, including concernsof consumers regarding health and wellness, obesity, product attributes, and ingredients. Introduction of newproducts and product extensions requires significant development and marketing investment. If our products fail tomeet consumer preference, or we fail to introduce new and improved products on a timely basis, then the return onthat investment will be less than anticipated and our strategy to grow sales and profits with investments in marketingand innovation will be less successful. Similarly, demand for our products could be affected by consumer concernsregarding the health effects of ingredients such as sodium, trans fats, sugar, processed wheat, or other productingredients or attributes.
If we do not achieve the appropriate cost structure in the highly competitive food industry, our profitabilitycould decrease.
Our success depends in part on our ability to achieve the appropriate cost structure and operate efficiently in thehighly competitive food industry, particularly in an environment of volatile input costs. We continue to implementprofit-enhancing initiatives that impact our supply chain and general and administrative functions. These initiativesare focused on cost-saving opportunities in procurement, manufacturing, logistics, and customer service, as well asgeneral and administrative overhead levels. If we do not continue to effectively manage costs and achieve additionalefficiencies, our competitiveness and our profitability could decrease.
We may be subject to product liability claims and product recalls, which could negatively impact ourprofitability.
We sell food products for human consumption, which involves risks such as product contamination orspoilage, product tampering, and other adulteration of food products. We may be subject to liability if theconsumption of any of our products causes injury, illness, or death. In addition, we will voluntarily recall products inthe event of contamination or damage. We have issued recalls and have from time to time been and currently areinvolved in lawsuits relating to our food products. A significant product liability judgment or a widespread productrecall may negatively impact our sales and profitability for a period of time depending on product availability,competitive reaction, and consumer attitudes. Even if a product liability claim is unsuccessful or is not fullypursued, the negative publicity surrounding any assertion that our products caused illness or injury could adverselyaffect our reputation with existing and potential customers and our corporate and brand image.
We may not successfully complete proposed acquisitions or divestitures or integrate acquired businesses.
From time to time, we evaluate acquisition candidates that may strategically fit our business objectives. If weare unable to complete acquisitions or to successfully integrate and develop acquired businesses, our financialresults could be materially and adversely affected. In addition, we may divest businesses that do not meet ourstrategic objectives, or do not meet our growth or profitability targets. We may not be able to complete desired orproposed divestitures on terms favorable to us. Gains or losses on the sales of, or lost operating income from, thosebusinesses may affect our profitability. Moreover, we may incur asset impairment charges related to acquisitions ordivestitures that reduce our profitability.
10

Our acquisition or divestiture activities may present financial, managerial, and operational risks. Those risksinclude diversion of management attention from existing businesses, difficulties integrating or separating personneland financial and other systems, effective and immediate implementation of control environment processes acrossour employee population, adverse effects on existing business relationships with suppliers and customers,inaccurate estimates of fair value made in the accounting for acquisitions and amortization of acquired intangibleassets which would reduce future reported earnings, potential loss of customers or key employees of acquiredbusinesses, and indemnities and potential disputes with the buyers or sellers. Any of these factors could affect ourproduct sales, financial condition and results of operations.
If we fail to comply with the many laws applicable to our business, we may face lawsuits or incur significantfines and penalties.
Our facilities and products are subject to many laws and regulations administered by the United StatesDepartment of Agriculture, the Federal Food and Drug Administration, the Occupational Safety and HealthAdministration, and other federal, state, local, and foreign governmental agencies relating to the processing,packaging, storage, distribution, advertising, labeling, quality, and safety of food products, the health and safety ofour employees, and the protection of the environment. Our failure to comply with applicable laws and regulationscould subject us to lawsuits, administrative penalties and injunctive relief, civil remedies, including fines,injunctions, and recalls of our products. Our operations are also subject to extensive and increasingly stringentregulations administered by the Environmental Protection Agency, which pertain to the discharge of materials intothe environment and the handling and disposition of wastes. Failure to comply with these regulations can haveserious consequences, including civil and administrative penalties and negative publicity. Changes in applicablelaws or regulations or evolving interpretations thereof, including increased government regulations to limit carbondioxide and other greenhouse gas emissions as a result of concern over climate change, may result in increasedcompliance costs, capital expenditures, and other financial obligations for us, which could affect our profitability orimpede the production or distribution of our products, which could affect our net operating revenues.
Our information technology resources must provide efficient connections between our business functions, orour results of operations will be negatively impacted.
Each year we engage in billions of dollars of transactions with our customers and vendors. Because the amountof dollars involved is so significant, our information technology resources must provide connections among ourmarketing, sales, manufacturing, logistics, customer service, and accounting functions. If we do not allocate andeffectively manage the resources necessary to build and sustain the proper technology infrastructure and to maintainthe related automated and manual control processes, we could be subject to billing and collection errors, businessdisruptions, or damage resulting from security breaches. We began implementing new financial and operationalinformation technology systems in fiscal 2008 and placed systems into production during fiscal 2008, 2009, 2010,and 2011. If future implementation problems are encountered, our results of operations could be negativelyimpacted.
ITEM 1B. UNRESOLVED STAFF COMMENTS
None.
ITEM 2. PROPERTIES
Our headquarters are located in Omaha, Nebraska. In addition, certain shared service centers are located inOmaha, Nebraska, including a product development facility, supply chain center, business services center, and aninformation technology center. The general offices and location of principal operations are set forth in the followingsummary of our locations. We also lease many sales offices mainly in the United States.
We maintain a number of stand-alone distribution facilities. In addition, there is warehouse space available atsubstantially all of our manufacturing facilities.
11

Utilization of manufacturing capacity varies by manufacturing plant based upon the type of products assignedand the level of demand for those products. Management believes that our manufacturing and processing plants arewell maintained and are generally adequate to support the current operations of the business.
We own most of the manufacturing facilities. However, a limited number of plants and parcels of land with therelated manufacturing equipment are leased. Substantially all of our transportation equipment and forward-positioned distribution centers and most of the storage facilities containing finished goods are leased or operated bythird parties. Information about the properties supporting our two business segments follows.
CONSUMER FOODS REPORTING SEGMENT
General offices in Omaha, Nebraska, Naperville, Illinois, Miami, Florida, Toronto, Canada, Mexico City,Mexico, San Juan, Puerto Rico, Shanghai, China, Panama City, Panama, and Bogota, Colombia.
As of July 19, 2011, thirty-nine domestic manufacturing facilities in Arkansas, California, Georgia, Illinois,Indiana, Iowa, Massachusetts, Michigan, Minnesota, Missouri, Nebraska, Ohio, Pennsylvania, Tennessee, andWisconsin. Three international manufacturing facilities in Canada and Mexico (one 50% owned) and one in ArroyoDulce, Argentina.
COMMERCIAL FOODS REPORTING SEGMENT
Domestic general, marketing, and administrative offices in Omaha, Nebraska, Eagle, Idaho, and Tri-Cities,Washington. International general and merchandising offices in Beijing, China, Shanghai, China, Tokyo, Japan, andSingapore.
As of July 19, 2011, forty-one domestic production facilities in Alabama, California, Colorado, Florida, Georgia,Idaho, Illinois, Louisiana, Minnesota, Nebraska, New Jersey, Ohio, Oregon, Pennsylvania, Texas, and Washington;one international production facility in Guaynabo, Puerto Rico; one manufacturing facility in Taber, Canada; one 50%owned manufacturing facility in each of Colorado, Minnesota, Washington, and the United Kingdom; one 67% ownedmanufacturing facility in Puerto Rico; and three 50% owned manufacturing facilities in the Netherlands.
ITEM 3. LEGAL PROCEEDINGS
In fiscal 1991, we acquired Beatrice Company (“Beatrice”). As a result of the acquisition and the significantpre-acquisition contingencies of the Beatrice businesses and its former subsidiaries, our consolidated post-acquisition financial statements reflect liabilities associated with the estimated resolution of these contingencies.These include various litigation and environmental proceedings related to businesses divested by Beatrice prior toits acquisition by us. The litigation includes suits against a number of lead paint and pigment manufacturers,including ConAgra Grocery Products and the Company as alleged successors to W. P. Fuller Co., a lead paint andpigment manufacturer owned and operated by Beatrice until 1967. Although decisions favorable to us have beenrendered in Rhode Island, New Jersey, Wisconsin, and Ohio, we remain a defendant in active suits in Illinois andCalifornia. The Illinois suit seeks class-wide relief in the form of medical monitoring for elevated levels of lead inblood. In California, a number of cities and counties have joined in a consolidated action seeking abatement of thealleged public nuisance.
The environmental proceedings include litigation and administrative proceedings involving Beatrice’s statusas a potentially responsible party at 37 Superfund, proposed Superfund, or state-equivalent sites. These sites involvelocations previously owned or operated by predecessors of Beatrice that used or produced petroleum, pesticides,fertilizers, dyes, inks, solvents, PCBs, acids, lead, sulfur, tannery wastes, and/or other contaminants. Beatrice haspaid or is in the process of paying its liability share at 34 of these sites. Reserves for these matters have beenestablished based on our best estimate of the undiscounted remediation liabilities, which estimates includeevaluation of investigatory studies, extent of required clean-up, the known volumetric contribution of Beatriceand other potentially responsible parties, and its experience in remediating sites. The reserves for Beatrice-relatedenvironmental matters totaled $68.5 million as of May 29, 2011, a majority of which relates to the Superfund andstate-equivalent sites referenced above. The reserve for Beatrice-related environmental matters reflects a reductionin pre-tax expense of $15.4 million made in the third quarter of fiscal 2010 due to favorable regulatory
12

developments at one of the sites. We expect expenditures for Beatrice-related environmental matters to continue forup to 19 years.
We are a party to a number of lawsuits and claims arising out of the operation of our business, includinglawsuits and claims related to the February 2007 recall of our peanut butter products and litigation we initiatedagainst an insurance carrier to recover our settlement expenditures and defense costs. We recognized a charge of$24.8 million during the third quarter of fiscal 2009 in connection with the disputed coverage with this insurancecarrier. During the second quarter of fiscal 2010, a Delaware state court rendered a decision on certain matters in ourclaim for the disputed coverage favorable to the insurance carrier. We appealed this decision and, during the fourthquarter of fiscal 2011, we received a favorable opinion related to our defense costs and the claim for disputedcoverage was remanded to the state court. We continue to vigorously pursue our claim for the disputed coverage.Subsequent to the end of the third quarter of fiscal 2011, we received formal requests from the U.S. Attorney’s officein Georgia seeking a variety of records and information related to the operations of our peanut butter manufacturingfacility in Sylvester, Georgia. The Company believes these requests are related to the previously disclosed June2007 execution of a search warrant at the facility following the February 2007 recall of our peanut butter products.The Company is cooperating with officials in regard to the requests.
On June 9, 2009, an accidental explosion occurred at our manufacturing facility in Garner, North Carolina (the“Garner accident”). This facility was the primary production facility for our Slim Jim» branded meat snacks. OnJune 13, 2009, the U.S. Bureau of Alcohol, Tobacco, Firearms and Explosives announced its determination that theexplosion was the result of an accidental natural gas release, and not a deliberate act. During the fourth quarter offiscal 2011, Jacobs Engineering Group Inc., our engineer and project manager at the site filed a declaratoryjudgment action against us seeking indemnity for personal injury claims brought against it as a result of theaccident. We intend to defend this action vigorously. During the fourth quarter of fiscal 2011, we settled ourproperty and business interruption claims related to the Garner accident with our insurance providers.
We are a party to several lawsuits concerning the use of diacetyl, a butter flavoring ingredient that was added toour microwave popcorn until late 2007. The cases are primarily consumer personal injury suits claiming respiratoryillness allegedly due to exposures to vapors from microwaving popcorn. Another case involved a putative classaction contending that our packaging information with respect to diacetyl is false and misleading. Through the thirdquarter of fiscal 2011, we have received a favorable verdict, summary judgment ruling, and two dismissals inconnection with these suits, and the class action motion in the packaging suit was denied. The verdict and thefavorable summary judgment ruling were appealed and the summary judgment was affirmed in the fourth quarter offiscal 2011. We do not believe these cases possess merit and continue to vigorously defend them.
After taking into account liabilities recognized for all of the foregoing matters, management believes theultimate resolution of such matters should not have a material adverse effect on our financial condition, results ofoperations, or liquidity.
ITEM 4. (REMOVED AND RESERVED)
PART II
ITEM 5. MARKET FOR REGISTRANT’S COMMON EQUITY, RELATED STOCKHOLDERMATTERS, AND ISSUER PURCHASES OF EQUITY SECURITIES
Our common stock is listed on the New York Stock Exchange where it trades under the ticker symbol: CAG. AtJune 26, 2011, there were approximately 23,500 shareholders of record.
Quarterly sales price and dividend information is set forth in Note 23 “Quarterly Financial Data (Unaudited)”to the consolidated financial statements and incorporated herein by reference.
Purchases of Equity Securities by the Issuer and Affiliated Purchasers
The following table presents the total number of shares of common stock purchased during the fourth quarterof fiscal 2011, the average price paid per share, the number of shares that were purchased as part of a publicly
13

announced repurchase program, and the approximate dollar value of the maximum number of shares that may yet bepurchased under the share repurchase program:
Period
Total Numberof Shares (or
Units)Purchased
AveragePrice Paidper Share(or Unit)
Total Number of SharesPurchased as Part ofPublicly Announced
Plans or Programs (1)
Maximum Number (orApproximate DollarValue) of Shares thatmay yet be Purchasedunder the Program (1)
February 28 through March 27, 2011 . . . 5,965,929 23.15 5,965,929 $ 129,284,000
March 28 through April 24, 2011 . . . . . . — — — $ 129,284,000
April 25 through May 29, 2011 . . . . . . . — — — $ 129,284,000
Total Fiscal 2011 Fourth Quarter . . . . . . 5,965,929 23.15 5,965,929 $ 129,284,000
(1) Pursuant to publicly announced share repurchase programs from December 2003, we have repurchasedapproximately 146.7 million shares at a cost of $3.4 billion through May 29, 2011. During the third quarter offiscal 2011, the Board of Directors approved a $554.2 million increase to the share repurchase program. Thecurrent program has no expiration date.
14

ITEM 6. SELECTED FINANCIAL DATA
For the Fiscal Years Ended May 2011 2010 2009 2008 2007
Dollars in millions, except per share amounts
Net sales (1) . . . . . . . . . . . . . . . . . . . . . . . . . . . $ 12,303.1 $ 12,014.9 $ 12,348.6 $ 11,173.1 $ 10,102.2
Income from continuing operations (1) . . . . . . . . $ 830.3 $ 742.6 $ 615.2 $ 489.7 $ 448.3
Net income attributable to ConAgra Foods,Inc. . . . . . . . . . . . . . . . . . . . . . . . . . . . . . . . $ 817.0 $ 725.8 $ 978.4 $ 930.6 $ 764.6
Basic earnings per share:
Income from continuing operationsattributable to ConAgra Foods, Inc.common stockholders (1) . . . . . . . . . . . . $ 1.92 $ 1.68 $ 1.36 $ 1.00 $ 0.89
Net income attributable to ConAgra Foods,Inc. common stockholders . . . . . . . . . . . $ 1.90 $ 1.63 $ 2.16 $ 1.91 $ 1.52
Diluted earnings per share:
Income from continuing operationsattributable to ConAgra Foods, Inc.common stockholders (1) . . . . . . . . . . . . $ 1.90 $ 1.66 $ 1.35 $ 1.00 $ 0.88
Net income attributable to ConAgra Foods,Inc. common stockholders . . . . . . . . . . . $ 1.88 $ 1.62 $ 2.15 $ 1.90 $ 1.51
Cash dividends declared per share of commonstock. . . . . . . . . . . . . . . . . . . . . . . . . . . . . . . $ 0.89 $ 0.79 $ 0.76 $ 0.75 $ 0.72
At Year-EndTotal assets . . . . . . . . . . . . . . . . . . . . . . . . . . . . $ 11,408.7 $ 11,738.0 $ 11,073.3 $ 13,682.5 $ 11,835.5
Senior long-term debt (noncurrent) . . . . . . . . . . . $ 2,674.4 $ 3,030.5 $ 3,259.5 $ 3,180.4 $ 3,211.7
Subordinated long-term debt (noncurrent) . . . . . . $ 195.9 $ 195.9 $ 195.9 $ 200.0 $ 200.0
(1) Amounts exclude the impact of discontinued operations of the packaged meats and cheese operations, theKnott’s Berry Farm» operations, the trading and merchandising operations, the Fernando’s» operations, theGilroy Foods & FlavorsTM operations, and the frozen handhelds operations.
15

ITEM 7. MANAGEMENT’S DISCUSSION AND ANALYSIS OF FINANCIAL CONDITION ANDRESULTS OF OPERATIONS
The following discussion and analysis is intended to provide a summary of significant factors relevant to ourfinancial performance and condition. The discussion should be read together with our consolidated financialstatements and related notes in Item 8, Financial Statements and Supplementary Data. Results for the fiscal yearended May 29, 2011 are not necessarily indicative of results that may be attained in the future.
Executive Overview
ConAgra Foods, Inc. (NYSE: CAG) is one of North America’s leading food companies, with brands in 97% ofAmerica’s households. Consumers find Banquet», Chef Boyardee», Egg Beaters», Healthy Choice», HebrewNational», Hunt’s», Marie Callender’s», Orville Redenbacher’s», PAM», Peter Pan», Reddi-wip», and many otherConAgra Foods brands in grocery, convenience, mass merchandise, and club stores. We also have a strongbusiness-to-business presence, supplying frozen potato and sweet potato products, as well as other vegetable, spice,and grain products to a variety of well-known restaurants, foodservice operators, and commercial customers.
Fiscal 2011 diluted earnings per share were $1.88, including $1.90 per diluted share of income from continuingoperations and a loss of $0.02 per diluted share from discontinued operations. Fiscal 2010 diluted earnings per sharewere $1.62, including income from continuing operations of $1.66 per diluted share and a loss of $0.04 per dilutedshare from discontinued operations. Several significant items affect the comparability of year-over-year results ofcontinuing operations (see “Items Impacting Comparability” below).
Items Impacting Comparability
Items of note impacting comparability for fiscal 2011 included the following:
Reported within Continuing Operations
• a gain of $105 million ($66 million after-tax) from the settlement of an insurance claim related to theGarner accident,
• charges totaling $56 million ($35 million after-tax) under our restructuring plans, and
• a gain of $25 million ($16 million after-tax) from the receipt, as payment in full of all principal andinterest due on the remaining payment-in-kind notes received in connection with the divestiture of thetrading and merchandising operations in fiscal 2009 (the “Notes”), in advance of the scheduledmaturity dates.
Reported within Discontinued Operations
• Losses totaling $22 million ($14 million after-tax) due to the write-down of the carrying value of theassets of a small business.
Items of note impacting comparability for fiscal 2010 included the following:
Reported within Continuing Operations
• charges totaling $40 million ($25 million after-tax) under our restructuring plans,
• charges totaling $33 million ($21 million after-tax) related to an impairment of a partially completedproduction facility,
• a benefit of $15 million ($9 million after-tax) from a favorable adjustment relating to an environ-mental liability,
• charges totaling $14 million ($9 million after-tax) for transaction-related costs associated withsecuring federal tax benefits related to the Delhi, LA sweet potato production facility,
• a gain of $14 million ($9 million after-tax) from the sale of the Luck’s» brand, and
• a benefit of $20 million from a lower-than-planned income tax rate.
16

Reported within Discontinued Operations
• Charges totaling $59 million ($40 million after-tax) primarily representing a write-down of thecarrying value of the assets of the Company’s discontinued dehydrated vegetable operations.
Settlement of Insurance Claim related to Garner, North Carolina Accident
On June 9, 2009, an accidental explosion occurred at our manufacturing facility in Garner, North Carolina (the“Garner accident”). This facility was the primary production facility for our Slim Jim» branded meat snacks. OnJune 13, 2009, the U.S. Bureau of Alcohol, Tobacco, Firearms and Explosives announced its determination that theexplosion was the result of an accidental natural gas release, and not a deliberate act.
In the fourth quarter of fiscal 2011, we reached a settlement of this matter with our insurance providers, and werecognized a gain, net of fiscal 2011 expenditures related to this matter, of approximately $105 million.
The costs incurred and insurance recoveries recognized, in fiscal 2011 and 2010, are reflected in ourconsolidated financial statements, as follows:
ConsumerFoods Corporate Total
ConsumerFoods Corporate Total
Year Ended May 29, 2011 Year Ended May 30, 2010
Cost of goods sold:Inventory write-downs and other
costs . . . . . . . . . . . . . . . . . . . . . . . $ 1 $ — $ 1 $ 12 $ — $ 12
Selling, general and administrativeexpenses:
Fixed asset impairments, clean-upcosts, etc. . . . . . . . . . . . . . . . . . . . $ 3 $ — $ 3 $ 47 $ 3 $ 50
Insurance recoveries recognized . . . . (109) — (109) (58) — (58)
Total selling, general andadministrative expenses . . . . . . . . . $ (106) $ — $ (106) $ (11) $ 3 $ (8)
Net loss (gain) . . . . . . . . . . . . . . . . . $ (105) $ — $ (105) $ 1 $ 3 $ 4
The amounts in the table above exclude actual lost profits due to the interruption of the meat snacks business inthe periods presented, but do reflect the recovery of the related business interruption insurance claim in the fourthquarter of fiscal 2011.
Restructuring Plans
In February 2011, our Board of Directors approved a plan recommended by executive management designed tooptimize our manufacturing and distribution networks (the “Network Optimization Plan”, which we previouslyreferred to as the “2011 plan”). The Network Optimization Plan consists of projects that involve, among otherthings, the exit of certain manufacturing facilities, the disposal of underutilized manufacturing assets, and actionsdesigned to optimize our distribution network. Implementation of the plan is expected to continue through fiscal2013 and is intended to improve the efficiency of our manufacturing operations and reduce costs.
In connection with the Network Optimization Plan, we currently estimate we will incur aggregate pre-tax costsof approximately $55 million, including approximately $22 million of cash charges. In fiscal 2011, we recognizedcharges of $31 million in relation to the Network Optimization Plan.
In March 2010, we announced a plan, authorized by our Board of Directors, related to the long-term productionof our meat snack products. The plan provides for the closure of our meat snacks production facility in Garner,North Carolina, and the movement of production to our existing facility in Troy, Ohio. Since the Garner accident,the Troy facility has been producing a portion of our meat snack products. Upon substantial completion of the plan’simplementation by the end of fiscal 2011, the Troy facility has become our primary meat snacks production facility.
17

In May 2010, we made a decision to consolidate certain administrative functions from Edina, Minnesota, toNaperville, Illinois. The transition of these functions was completed in the first half of fiscal 2011. This plan,together with the plan to move production of our meat snacks from Garner, North Carolina to Troy, Ohio, arecollectively referred to as the 2010 restructuring plan (the “2010 plan”). In connection with the 2010 plan, we expectto incur pre-tax cash and non-cash charges of $68 million. In fiscal 2011 and 2010, we recognized charges ofapproximately $26 million and $39 million, respectively, in relation to these plans.
As part of a focus on cost reduction, we previously carried out a restructuring plan focused on streamlining oursupply chain and reducing selling, general, and administrative costs (the “2006-2008 restructuring plan”). As part ofthe 2006-2008 restructuring plan, we began construction of a new production facility in fiscal 2007. As a result of anupdated assessment of manufacturing strategies and the related impact on this partially completed productionfacility, we decided to divest this facility. Accordingly, in fiscal 2010, we recognized a non-cash impairment chargeof $33 million, representing a write-down of the carrying value of the assets to fair value based on anticipatedproceeds from the sale. This charge is reflected in selling, general and administrative expenses within the ConsumerFoods segment.
The Network Optimization Plan and the 2010 plan are collectively referred to as our restructuring plans.
Management continues to evaluate our manufacturing footprint and potential opportunities to generate costsavings. If such opportunities are identified, the Network Optimization Plan will be amended accordingly, and thiscould lead to significant additional restructuring expenses.
Acquisitions
In June 2010, we acquired the assets of American Pie, LLC, a manufacturer of frozen fruit pies, thaw and servepies, fruit cobblers, and pie crusts under the licensed Marie Callender’s» and Claim Jumper» trade names, as well asfrozen dinners, pot pies, and appetizers under the Claim Jumper» trade name. We paid $131 million in cash plusassumed liabilities for this business. This business is included in the Consumer Foods segment.
During fiscal 2010, we completed the acquisition of Elan Nutrition (“Elan”), a privately held formulator andmanufacturer of private label snack and nutrition bars, for approximately $103 million in cash. This business isincluded in the Consumer Foods segment.
In June 2011, we purchased various Marie Callender’s» brand trademarks from Marie Callender Pie Shops,Inc., for approximately $58 million.
Divestitures
In July 2010, we completed the sale of substantially all of the assets of Gilroy Foods & FlavorsTM dehydratedgarlic, onion, capsicum and Controlled MoistureTM, GardenFrost», Redi-MadeTM, and fresh vegetable operations for$246 million in cash. Based on our estimate of proceeds from the sale of this business, we recognized impairmentand related charges totaling $59 million ($40 million after-tax) in the fourth quarter of fiscal 2010. We reflected theresults of these operations as discontinued operations for all periods presented.
In May 2011, we completed the sale of the assets of our frozen handhelds operations for approximately$10 million. We recognized charges totaling $22 million ($14 million after-tax) relating to the impairment of thelong-lived assets of the business. We reflected the results of these operations as discontinued operations for allperiods presented.
Capital Allocation
During fiscal 2011, we received $554 million as payment in full of all principal and interest due on theremaining Notes received in connection with the divestiture of the trading and merchandising operations in fiscal2009, in advance of the scheduled maturity dates.
During fiscal 2011, we repurchased approximately 36 million shares of our common stock for $825 million,and we repaid the entire principal balance of $248 million of our 7.875% senior notes, which were dueSeptember 15, 2010. During fiscal 2010, we repurchased 4 million shares of our common stock for $100 million.
18

During fiscal 2011, we paid dividends of $375 million.
SEGMENT REVIEW
We report our operations in two reporting segments: Consumer Foods and Commercial Foods.
Consumer Foods
The Consumer Foods reporting segment includes branded and private label food products that are sold invarious retail and foodservice channels, principally in North America. The products include a variety of categories(meals, entrees, condiments, sides, snacks, and desserts) across frozen, refrigerated, and shelf-stable temperatureclasses.
In May 2011, we completed the sale of the assets of our frozen handhelds operations for approximately$10 million. We recognized charges totaling $22 million ($14 million after-tax) relating to the impairment of thelong-lived assets of the business. We reflected the results of these operations as discontinued operations for allperiods presented.
In February 2010, we completed the sale of our Luck’s» brand for proceeds of approximately $22 million incash, resulting in a pre-tax gain of $14 million ($9 million after-tax), reflected in selling, general and administrativeexpenses.
In June 2009, we completed the divestiture of the Fernando’s» foodservice business for proceeds of $6 millionin cash. We reflected the results of these operations as discontinued operations for all periods presented. The assetsand liabilities of the divested Fernando’s» business have been reclassified as assets and liabilities held for salewithin our consolidated balance sheets for all periods prior to divestiture.
Commercial Foods
The Commercial Foods reporting segment principally includes commercially branded foods and ingredients,which are sold primarily to foodservice, food manufacturing, and industrial customers. The segment’s primaryproducts include: specialty potato products, milled grain ingredients, and a variety of vegetable products,seasonings, blends, and flavors, which are sold under brands such as ConAgra Mills», Lamb Weston», andSpicetec Flavors & SeasoningsTM.
As discussed above, we reflected the results of the Gilroy Foods & FlavorsTM operations as discontinuedoperations for all periods presented. The assets and liabilities of the divested Gilroy Foods & FlavorsTM dehydratedvegetable business have been reclassified as assets and liabilities held for sale within our consolidated balancesheets for all periods presented prior to divestiture.
Presentation of Derivative Gains (Losses) for Economic Hedges of Forecasted Cash Flows in Segment Results
Derivatives used to manage commodity price risk and foreign currency risk are not designated for hedgeaccounting treatment. We believe these derivatives provide economic hedges of certain forecasted transactions. Assuch, these derivatives (except those related to our milling operations, see Note 19 to our Consolidated FinancialStatements) are recognized at fair market value with realized and unrealized gains and losses recognized in generalcorporate expenses. The gains and losses are subsequently recognized in the operating results of the reportingsegments in the period in which the underlying transaction being economically hedged is included in earnings.
19

The following table presents the net derivative gains (losses) from economic hedges of forecasted commodityconsumption and the foreign currency risk of certain forecasted transactions, under this methodology (in millions):
May 29,2011
May 30,2010
Fiscal Year Ended
Net derivative gains (losses) incurred . . . . . . . . . . . . . . . . . . . . . . $ 35.1 $ (16.9)
Less: Net derivative gains (losses) allocated to reportingsegments . . . . . . . . . . . . . . . . . . . . . . . . . . . . . . . . . . . . . . . . . 0.6 (19.3)
Net derivative gains recognized in general corporateexpenses . . . . . . . . . . . . . . . . . . . . . . . . . . . . . . . . . . . . $ 34.5 $ 2.4
Net derivative gains (losses) allocated to Consumer Foods . . . . . . $ 3.6 $ (14.3)
Net derivative losses allocated to Commercial Foods . . . . . . . . . . (3.0) (5.0)
Net derivative gains (losses) included in segment operatingprofit . . . . . . . . . . . . . . . . . . . . . . . . . . . . . . . . . . . . . . . $ 0.6 $ (19.3)
Based on our forecasts of the timing of recognition of the underlying hedged items, we expect to reclassifygains of $34 million and losses of $2 million to segment operating results in fiscal 2012 and 2013 and thereafter,respectively. Amounts allocated, or to be allocated, to segment operating results during fiscal 2011 and thereafterinclude net losses of $3 million recognized within corporate expense prior to fiscal 2011.
2011 vs. 2010
Net Sales($ in millions)
Reporting SegmentFiscal 2011Net Sales
Fiscal 2010Net Sales
% Increase/(Decrease)
Consumer Foods . . . . . . . . . . . . . . . . . . . . . . . . . . . . . . . . . . . . . $ 8,002 $ 7,940 1%
Commercial Foods . . . . . . . . . . . . . . . . . . . . . . . . . . . . . . . . . . . 4,301 4,075 6%
Total . . . . . . . . . . . . . . . . . . . . . . . . . . . . . . . . . . . . . . . . . . $ 12,303 $ 12,015 2%
Overall, our net sales increased $288 million to $12.3 billion in fiscal 2011, reflecting a 1% increase in ourConsumer Foods segment and a 6% increase in our Commercial Foods segment relative to results in fiscal 2010.
Consumer Foods net sales for fiscal 2011 were $8.0 billion, an increase of 1% as compared to fiscal 2010.Results reflected a 2% benefit from acquisitions, net of divestitures, a 1% decrease in volume from existingbusinesses, and essentially unchanged net pricing and mix. The decrease in volume from existing businessesreflected highly competitive pricing for some products, as well as lower consumption in certain product categories.The net pricing impacts for fiscal 2011 were not significant, reflecting the fact that price increases in the second halfof the year were offset by pricing reductions earlier in the year related to competitive pressures.
Sales of products associated with some of our most significant brands, including Blue Bonnet», MarieCallender’s», Peter Pan», Reddi-wip», Ro*Tel», Slim Jim», Snack Pack», and Wesson», grew in fiscal 2011.Significant brands that experienced sales declines in fiscal 2011 included ACT II», Banquet», Chef Boyardee», EggBeaters», Healthy Choice», Hunt’s», Libby’s», Orville Redenbacher’s», PAM», Swiss Miss», and Van Camp’s ».
Commercial Foods net sales were $4.3 billion in fiscal 2011, an increase of $226 million, or 6% compared tofiscal 2010. Net sales in our flour milling business were approximately $107 million higher in fiscal 2011 than infiscal 2010, principally reflecting the pass-through of higher wheat prices. Results also reflected a $98 millionincrease in sales in our Lamb Weston» specialty potato products business, reflecting higher volume of approx-imately 4% and flat net pricing and mix. The increase in sales volume included significant growth in sales of sweetpotato products.
20

Selling, General and Administrative Expenses (includes General Corporate Expense) (“SG&A”)
SG&A expenses totaled $1.51 billion for fiscal 2011, a decrease of $308 million, or 17%, compared to fiscal2010.
Selling, general and administrative expenses for fiscal 2011 reflected the following:
• a decrease in incentive compensation expense of $130 million,
• a net benefit of $105 million in connection with the settlement of insurance claims, net of expensesincurred, related to the Garner accident,
• charges totaling $35 million in connection with our restructuring plans,
• a decrease in advertising and promotion expense of $37 million,
• an increase in salaries and labor expense of $26 million,
• a gain of $25 million from the receipt, as payment in full of all principal and interest due on the remainingNotes received in connection with the divestiture of the trading and merchandising operations in fiscal2009, in advance of the scheduled maturity dates,
• a decrease in charitable donations of $13 million,
• a decrease in stock-based compensation expense of $11 million,
• an increase in self-insured medical expense of $10 million, and
• a decrease in property, sales, and use taxes of $10 million.
Selling, general and administrative expenses for fiscal 2010 included the following:
• charges totaling $36 million in connection with the 2010 plan, consisting of charges related to our decisionto move manufacturing activities in Garner, North Carolina to Troy, Ohio, and our decision to moveadministrative functions in Edina, Minnesota to Naperville, Illinois,
• a charge of $33 million in connection with the impairment of a partially completed production facility,
• a benefit of $15 million associated with a favorable adjustment to an environmental-related liability,
• transaction-related costs of $14 million associated with securing federal tax benefits related to the Delhi,LA sweet potato production facility (the associated income tax benefits will be recognized in futureperiods),
• a $14 million gain on the sale of the Luck’s» brand, and
• a net benefit of $8 million, representing SG&A expenses associated with the Garner accident that weremore than offset by insurance recoveries (related charges of $12 million were recognized in cost of goodssold).
Operating Profit(Earnings before general corporate expense, interest expense (net), income taxes, and equity method investmentearnings)($ in millions)
Reporting Segment
Fiscal 2011Operating
Profit
Fiscal 2010Operating
Profit% Increase/(Decrease)
Consumer Foods . . . . . . . . . . . . . . . . . . . . . . . . . . . . . . . . . . . . . $ 1,144 $ 1,110 3%
Commercial Foods . . . . . . . . . . . . . . . . . . . . . . . . . . . . . . . . . . . 505 539 (6)%
Consumer Foods operating profit increased $34 million in fiscal 2011 versus the prior year to $1.14 billion.Gross profits were $156 million lower in fiscal 2011 than in fiscal 2010 driven by the impact of higher commodity
21

input costs that were not fully offset by the benefit of price increases and supply chain cost savings initiatives. Otheritems that significantly impacted Consumer Foods operating profit in fiscal 2011 included:
• a net benefit of $105 million in connection with the settlement of insurance claims, net of expensesincurred, related to the Garner accident,
• a decrease in incentive compensation expense of $48 million,
• a decrease in advertising and promotion expense of $42 million,
• charges totaling $45 million in connection with the Company’s restructuring plans, and
• the impact of foreign currencies, including related economic hedges, resulted in an increase of operatingprofit of approximately $27 million in fiscal 2011, as compared to fiscal 2010.
Items that significantly impacted Consumer Foods operating profit in fiscal 2010 included:
• charges totaling $36 million in connection with our restructuring plans,
• a charge of $33 million in connection with the impairment of a partially completed production facility, and
• a $14 million gain on the sale of the Luck’s» brand.
Commercial Foods operating profit decreased $34 million in fiscal 2011 versus the prior year to $505 million.Gross profits in our Lamb Weston» specialty potato business were negatively impacted in fiscal 2011 by significantincreases in input costs which more than offset the benefit of increased sales volumes and a higher quality potatocrop than that which was processed in fiscal 2010 and the first half of fiscal 2011. Gross profits in our flour millingbusiness improved in fiscal 2011 due to effective management of margins in a volatile wheat market, which morethan offset the decrease in sales volumes. SG&A expenses were lower in the Commercial Foods segment in fiscal2011 as compared to fiscal 2010, largely due to a $13 million decrease in incentive compensation expense. TheCommercial Foods segment also recognized charges of $11 million in fiscal 2011 in connection with ourrestructuring plans.
Interest Expense, Net
In fiscal 2011, net interest expense was $178 million, an increase of $17 million, or 11%, from fiscal 2010.Included in net interest expense was $42 million and $85 million of interest income in fiscal 2011 and 2010,respectively, principally from the Notes received in connection with the divestiture of the trading and merchan-dising business in June 2008. Interest expense in fiscal 2011 also reflected a net benefit of $13 million primarilyresulting from interest rate swaps used to effectively convert the interest rates of certain outstanding debtinstruments from fixed to variable (this hedge was terminated in fiscal 2011) and the benefit of the repaymentof $248 million of debt in September 2010.
During fiscal 2010, we received $115 million as payment in full of all principal and interest due on a portion ofthe Notes, in advance of the scheduled maturity date. In December 2010, we received $554 million as payment infull of all principal and interest due on the remaining Notes, in advance of the scheduled maturity dates. We expectnet interest expense to be significantly higher in fiscal 2012 than in fiscal 2011, reflecting lower interest income.
Income Taxes
Our income tax expense was $421 million and $361 million in fiscal 2011 and 2010, respectively. The effectivetax rate (calculated as the ratio of income tax expense to pre-tax income from continuing operations, inclusive ofequity method investment earnings) was 34% for fiscal 2011 and 33% in fiscal 2010. The lower effective tax rate infiscal 2010 was reflective of favorable changes in estimates and audit settlements, as well as certain income taxcredits and deductions identified in fiscal 2010 that related to prior periods. These benefits were offset, in part, byunfavorable tax consequences of the Patient Protection and Affordable Care Act and the Health Care and EducationReconciliation Act of 2010.
We expect our effective tax rate in fiscal 2012, exclusive of any unusual transactions or tax events, to beapproximately 34%.
22

Equity Method Investment Earnings
We include our share of the earnings of certain affiliates based on our economic ownership interest in theaffiliates. Significant affiliates produce and market potato products for retail and foodservice customers. Our shareof earnings from our equity method investments was $26 million ($6 million in the Consumer Foods segment and$20 million in the Commercial Foods segment) and $22 million ($5 million in the Consumer Foods segment and$17 million in the Commercial Foods segment) in fiscal 2011 and 2010, respectively. Equity method investmentearnings in the Commercial Foods segment reflected improving market conditions in a foreign potato processingventure and continued difficult market conditions for our domestic potato ventures.
Results of Discontinued Operations
Our discontinued operations generated after-tax losses of $12 million and $19 million in fiscal 2011 and 2010,respectively. In fiscal 2011, we completed the sale of the assets of a small frozen foods business for approximately$10 million. We recognized after-tax impairment charges totaling $14 million in connection with this sale. In fiscal2010, we decided to divest our dehydrated vegetable operations. As a result of this decision, we recognized an after-tax impairment charge of $40 million in fiscal 2010, representing a write-down of the carrying value of the relatedlong-lived assets to fair value, based on the anticipated sales proceeds. The sale of this business for $246 million incash was completed in July 2010. Operating results of discontinued operations in fiscal 2011 include the favorableresolution of a foreign tax matter relating to a divested business. Operating results of discontinued operations infiscal 2010 include charges related to certain legal and environmental matters of divested businesses.
Earnings Per Share
Our diluted earnings per share in fiscal 2011 were $1.88 (including earnings of $1.90 per diluted share fromcontinuing operations and a loss of $0.02 per diluted share from discontinued operations). Our diluted earnings pershare in fiscal 2010 were $1.62 (including earnings of $1.66 per diluted share from continuing operations and lossesof $0.04 per diluted share from discontinued operations). See “Items Impacting Comparability” above as severalsignificant items affected the comparability of year-over-year results of operations.
2010 vs. 2009
Net Sales($ in millions)
Reporting SegmentFiscal 2010Net Sales
Fiscal 2009Net Sales
% Increase/(Decrease)
Consumer Foods . . . . . . . . . . . . . . . . . . . . . . . . . . . . . . . . . . . . . $ 7,940 $ 7,904 —%
Commercial Foods . . . . . . . . . . . . . . . . . . . . . . . . . . . . . . . . . . . 4,075 4,445 (8)%
Total . . . . . . . . . . . . . . . . . . . . . . . . . . . . . . . . . . . . . . . . . . $ 12,015 $ 12,349 (3)%
Overall, our net sales decreased $334 million to $12.02 billion in fiscal 2010, primarily driven by fiscal 2009including 53 weeks, as well as lower flour milling net sales in fiscal 2010 resulting from lower underlying wheatcosts passed on to customers. This decrease was partially offset by improved pricing and mix in the ConsumerFoods segment and the Lamb Weston» specialty potato products business in the Commercial Foods segment.Volume reflected a benefit of approximately 2% in fiscal 2009 due to the inclusion of the additional week of results.
Consumer Foods net sales for fiscal 2010 were $7.94 billion, basically flat as compared to fiscal 2009. Resultsreflected flat volume and essentially unchanged net pricing and mix. Volume reflected a benefit of approximately2% in fiscal 2009 due to the inclusion of the additional week of results. Excluding the impact of the additional week,volume increased 2% in fiscal 2010, reflecting successful innovation and marketing.
Sales of products associated with some of our other most significant brands, including Chef Boyardee»,Healthy Choice», Hunt’s», Marie Callender’s», Orville Redenbacher’s», Reddi-wip», and Snack Pack» grew infiscal 2010. Sales of Blue Bonnet» and Wesson» declined by 19% and 7%, respectively, in fiscal 2010, as comparedto fiscal 2009, largely due to the impact of passing through lower vegetable oil costs. Other significant brands whose
23

products experienced sales declines in fiscal 2010 include ACT II», Banquet», Egg Beaters», Kid Cuisine»,Libby’s», PAM», and Slim Jim».
Commercial Foods net sales were $4.08 billion in fiscal 2010, a decrease of $370 million, or 8%, compared tofiscal 2009. Net sales in our flour milling business were approximately $330 million lower in fiscal 2010 than infiscal 2009, principally reflecting the pass-through of lower wheat prices. Results also reflected a slight decrease insales in our Lamb Weston» specialty potato products business, reflecting lower volume of approximately 2%,partially offset by increased pricing. Volume reflected a benefit of approximately 2% in fiscal 2009 due to theinclusion of the additional week of results. Excluding the impact of the additional week, volume was essentiallyunchanged in fiscal 2010, as compared to fiscal 2009.
SG&A Expenses (includes General Corporate Expense) (“SG&A”)
SG&A expenses totaled $1.82 billion for fiscal 2010, an increase of 8% compared to fiscal 2009. We estimatethat the inclusion of the extra week in the fiscal 2009 results increased SG&A expenses by approximately 2% in thatfiscal year.
Selling, general and administrative expenses for fiscal 2010 reflected the following:
• an increase in incentive compensation expense of $99 million,
• charges totaling $36 million in connection with the 2010 plan, consisting of charges related to theCompany’s decision to move manufacturing activities in Garner, North Carolina to Troy, Ohio, and theCompany’s decision to move administrative functions in Edina, Minnesota to Naperville, Illinois,
• a charge of $33 million in connection with the impairment of a partially completed production facility,
• an increase in advertising and promotion expense of $29 million,
• an increase in self-insured medical expense of $15 million,
• a benefit of $15 million associated with a favorable adjustment to an environmental-related liability,
• transaction-related costs of $14 million associated with securing federal tax benefits related to the Delhi,LA sweet potato production facility (the associated income tax benefits will be recognized in futureperiods),
• a $14 million gain on the sale of the Luck’s» brand,
• increase in stock-based compensation expense of $13 million,
• a decrease in charitable donations of $9 million, and
• a net benefit of $8 million, representing SG&A expenses associated with the Garner accident that weremore than offset by insurance recoveries.
Selling, general and administrative expenses for fiscal 2009 reflected the following:
• a charge of $50 million representing the net premium and fees paid to retire certain debt instruments prior tomaturity,
• a charge of $25 million related to a coverage dispute with an insurer,
• a gain of $19 million from the sale of the Pemmican» brand,
• charges related to peanut butter and pot pie recalls of $11 million,
• charges of $10 million related to the execution of our restructuring plans, and
• $5 million of income, net of direct pass-through costs, for reimbursement of expenses related to transitionservices provided to the buyers of certain divested businesses.
24

Operating Profit(Earnings before general corporate expense, interest expense (net), income taxes, and equity method investmentearnings)($ in millions)
Reporting Segment
Fiscal 2010Operating
Profit
Fiscal 2009Operating
Profit% Increase/(Decrease)
Consumer Foods . . . . . . . . . . . . . . . . . . . . . . . . . . . . . . . . . . . . . $ 1,110 $ 946 17%
Commercial Foods . . . . . . . . . . . . . . . . . . . . . . . . . . . . . . . . . . . 539 542 (1)%
Consumer Foods operating profit increased $164 million in fiscal 2010 versus the prior year to $1.1 billion.Gross profits were $262 million higher in fiscal 2010 than in fiscal 2009 driven by the impact of lower commodityinput costs, and the benefit of supply chain cost savings initiatives. Consumer Foods SG&A expenses were higher infiscal 2010 than in fiscal 2009, reflecting a $34 million increase in incentive compensation expenses and a$22 million increase in advertising and promotion expenses. The Consumer Foods segment recognized a$14 million gain on the sale of the Luck’s» brand in fiscal 2010. Charges totaling $36 million were recognizedin the Consumer Foods segment in fiscal 2010 in connection with the 2010 plan, including charges related to ourdecision to move manufacturing activities in Garner, North Carolina to Troy, Ohio, and our decision to moveadministrative functions in Edina, Minnesota to Naperville, Illinois. An additional charge of $33 million wasrecognized in connection with the impairment of a production facility, as we made a decision to divest the partiallycompleted facility. The Consumer Foods segment recognized a $19 million gain on the sale of the Pemmican»
brand, incurred costs of product recalls classified as SG&A expense of $11 million, and incurred costs of $8 millionin connection with our restructuring plans in fiscal 2009. The impact of foreign currencies, including relatedeconomic hedges, resulted in a reduction of operating profit of approximately $9 million in fiscal 2010, as comparedto fiscal 2009.
The Garner accident in June 2009 resulted in charges within SG&A totaling $47 million for the impairment ofproperty, plant and equipment, workers’ compensation, site clean-up, and other related costs in fiscal 2010 (inaddition to inventory write-downs and other related costs of $12 million recognized in cost of goods sold). Theimpact of these charges was offset by insurance recoveries of $58 million in fiscal 2010 for the involuntaryconversion of assets. Gross profits from Slim Jim» branded products were $25 million and $51 million in fiscal 2010and 2009, respectively, reflecting the impact of the disruption of production due to the accident.
Commercial Foods operating profit decreased $3 million in fiscal 2010 versus the prior year to $539 million.Improved gross profits in the flour milling business were partially offset by reduced gross profits in the specialtyblends and flavorings business and the specialty potato business. Gross profits continued to be negatively impactedby challenging conditions in the foodservice channel as well as high production costs associated with a high costand poor quality potato crop in our specialty potato business. Commercial Foods SG&A expenses were higher infiscal 2010 than in fiscal 2009, reflecting a $5 million increase in incentive compensation expenses. CommercialFoods operating profit for fiscal 2009 reflected the benefit of the additional week of operations.
Interest Expense, Net
In fiscal 2010, net interest expense was $160 million, a decrease of $26 million, or 14%, from fiscal 2009. Thereduction in net interest expense is primarily the result of increased capitalized interest and increased interestincome in fiscal 2010. Interest income includes $83 million and $73 million in fiscal 2010 and 2009, respectively,from the payment-in-kind notes received in June 2008 in connection with the divestiture of our trading andmerchandising operations.
Income Taxes
Our income tax expense was $361 million and $317 million in fiscal 2010 and 2009, respectively. The effectivetax rate (calculated as the ratio of income tax expense to pre-tax income from continuing operations, inclusive ofequity method investment earnings) was 33% for fiscal 2010 and 34% in fiscal 2009. The lower effective tax rate infiscal 2010 was reflective of favorable changes in estimates and audit settlements, as well as certain income tax
25

credits and deductions identified in fiscal 2010 that related to prior periods. These benefits were offset, in part, byunfavorable tax consequences of the Patient Protection and Affordable Care Act and the Health Care and EducationReconciliation Act of 2010.
Equity Method Investment Earnings
We include our share of the earnings of certain affiliates based on our economic ownership interest in theaffiliates. Significant affiliates produce and market potato products for retail and foodservice customers. Our shareof earnings from our equity method investments was $22 million ($5 million in the Consumer Foods segment and$17 million in the Commercial Foods segment) and $24 million ($5 million in the Consumer Foods segment and$19 million in the Commercial Foods segment) in fiscal 2010 and 2009, respectively. Equity method investmentearnings in the Commercial Foods segment reflected continued difficult market conditions for our foreign anddomestic potato ventures.
Results of Discontinued Operations
Our discontinued operations generated an after-tax loss of $19 million in fiscal 2010 and earnings of$364 million in fiscal 2009. In fiscal 2010, we decided to divest our dehydrated vegetable operations. As a resultof this decision, we recognized an after-tax impairment charge of $40 million in fiscal 2010, representing a write-down of the carrying value of the related long-lived assets to fair value, based on the anticipated sales proceeds. Infiscal 2009, we completed the sale of the trading and merchandising operations and recognized an after-tax gain onthe disposition of approximately $301 million. In the fourth quarter of fiscal 2009, we decided to sell certain smallfoodservice brands. The sale of these brands was completed in June 2009. We recognized after-tax impairmentcharges of $6 million in fiscal 2009, in anticipation of this divestiture.
Earnings Per Share
Our diluted earnings per share in fiscal 2010 were $1.62 (including earnings of $1.66 per diluted share fromcontinuing operations and a loss of $0.04 per diluted share from discontinued operations). Our diluted earnings pershare in fiscal 2009 were $2.15 (including earnings of $1.35 per diluted share from continuing operations and $0.80per diluted share from discontinued operations), respectively. See “Items Impacting Comparability” above asseveral other significant items affected the comparability of year-over-year results of operations.
LIQUIDITY AND CAPITAL RESOURCES
Sources of Liquidity and Capital
Our primary financing objective is to maintain a prudent capital structure that provides us flexibility to pursueour growth objectives. If necessary, we use short-term debt principally to finance ongoing operations, including ourseasonal requirements for working capital (accounts receivable, prepaid expenses and other current assets, andinventories, less accounts payable, accrued payroll, and other accrued liabilities) and a combination of equity andlong-term debt to finance both our base working capital needs and our noncurrent assets.
At May 29, 2011, we had a $1.5 billion revolving credit facility with a syndicate of financial institutions, whichmatures in December 2011. We expect to refinance the facility prior to maturity at terms that will enable us tomaintain sufficient liquidity to support our business needs. The facility has historically been used principally as aback-up facility for our commercial paper program. As of May 29, 2011, there were no outstanding borrowingsunder the facility. We did not draw upon this facility or the commercial paper program during fiscal 2011.Borrowings under the facility bear interest at or below prime rate and may be prepaid without penalty. The facilityrequires that our consolidated funded debt not exceed 65% of our consolidated capital base, and that our fixedcharges coverage ratio be greater than 1.75 to 1.0. As of May 29, 2011, we were in compliance with these financialcovenants.
As of the end of fiscal 2011, our senior long-term debt ratings were all investment grade. A significantdowngrade in our credit ratings would not affect our ability to borrow amounts under the revolving credit facility,although borrowing costs would increase. A downgrade of our short-term credit ratings would impact our ability to
26

borrow under our commercial paper program by negatively impacting borrowing costs and causing shorterdurations, as well as making access to commercial paper more difficult.
In connection with the divestiture of the trading and merchandising operations in fiscal 2009, we received$550 million (face value) of the Notes issued by the purchaser of the divested business. During fiscal 2010, wereceived $115 million as payment in full of all principal and interest due on a portion of the Notes, in advance of thescheduled maturity date. During fiscal 2011, we received $554 million as payment in full of all principal and interestdue on the remaining Notes, in advance of the scheduled maturity dates.
We repurchase our shares of common stock from time to time after considering market conditions and inaccordance with repurchase limits authorized by our Board of Directors. In February 2010, our Board of Directorsapproved a $500 million share repurchase program with no expiration date. We repurchased approximately4 million shares of our common stock for approximately $100 million under this program in the fourth quarter offiscal 2010. In December 2010, our Board of Directors increased the Company’s share repurchase authorization by$554 million, the amount of the early repayment of the remaining Notes. We repurchased approximately 36 millionshares of our common stock for $825 million under this program in fiscal 2011. The Company’s total remainingshare repurchase authorization was $129 million as of the end of fiscal 2011.
In July 2010, we completed the sale of substantially all of the assets of Gilroy Foods & FlavorsTM dehydratedgarlic, onion, capsicum and Controlled MoistureTM, GardenFrost», Redi-MadeTM, and fresh vegetable operations for$246 million in cash.
On September 15, 2010, we repaid the entire principal balance of $248 million of our 7.875% senior notes, dueon that date.
We expect to repay the entire principal balance of $343 million of our 6.75% senior notes, due September 15,2011, with cash on hand.
Cash Flows
In fiscal 2011, we generated $19 million of cash, which was the net result of $1.35 billion generated fromoperating activities, $89 million generated from investing activities, $1.43 billion used in financing activities, andan increase of $10 million in cash and cash equivalents due to the effect of changes in foreign currency exchangerates.
Cash generated from operating activities of continuing operations totaled $1.34 billion for fiscal 2011 ascompared to $1.43 billion generated in fiscal 2010. Results reflect increased income from continuing operations infiscal 2011. Improvement in our accounts payable balance largely offset increases in the inventory balance,reflecting the impact of higher commodity costs in our flour milling business. The year-over-year decrease inoperating cash flows also reflects higher incentive payments made in fiscal 2011 (earned in fiscal 2010), than thosemade in fiscal 2010 (related to fiscal 2009 performance). We also contributed $129 million and $123 million to ourCompany-sponsored pension plans in fiscal 2011 and 2010, respectively. Cash payments of income taxes were$172 million and $291 million in fiscal 2011 and 2010, respectively, reflecting the benefit of changes in certainfederal income tax laws that will allow us to defer the payment of a significant amount of income taxes recognizedin fiscal 2011 until future years. Fiscal 2011 operating cash flows also reflect the receipt of $142 million of interestdue on the remaining Notes received in connection with the divestiture of the trading and merchandising operationsin fiscal 2009, and insurance advances of $65 million for reimbursement of out-of-pocket expenses and foregoneprofits associated with the Garner accident. Cash generated from operating activities of discontinued operations was$12 million and $43 million in fiscal 2011 and 2010, respectively, primarily reflecting income from operations ofthe discontinued Gilroy Foods & FlavorsTM dehydrated vegetable business and reduced inventory balances withinthat business.
Cash used in investing activities of continuing operations totaled $166 million in fiscal 2011 and $352 millionin fiscal 2010. Investing activities of continuing operations in fiscal 2011 consisted primarily of capital expendituresof $466 million and acquisitions of businesses and intangibles (including American Pie») totaling $149 million,partially offset by the receipt of $413 million, as payment in full of all amounts due on the remaining Notes receivedin connection with the divestiture of the trading and merchandising operations in fiscal 2009 (receipt of interest due
27

is reflected in operating cash flows), and sales of property, plant and equipment of $19 million. Investing activitiesof continuing operations in fiscal 2010 included capital expenditures of $482 million and acquisitions of businessesand intangibles (including Elan) totaling $107 million, partially offset by sales of businesses and brands (includingthe Luck’s» brand) of $22 million and sales of property, plant, and equipment of $88 million. Also included ininvesting activities of continuing operations in fiscal 2010 was a cash inflow of $92 million (of the total receipt of$115 million) representing the payment in full of all principal and interest due on the first tranche of the Notes, inadvance of the scheduled maturity date (the remaining $23 million is reflected as cash generated from operatingactivities of continuing operations), and insurance advances of $35 million for the replacement of property, plantand equipment destroyed in the Garner accident. We generated $255 million of cash from investing activities ofdiscontinued operations in fiscal 2011 from the disposition of the Gilroy Foods & FlavorsTM dehydrated vegetablebusiness.
Cash used in financing activities totaled $1.43 billion in fiscal 2011, as compared to cash used in financingactivities of $405 million in fiscal 2010. During fiscal 2011, we repurchased approximately 36 million shares of ourcommon stock for $825 million, we paid dividends of $375 million, and we decreased our debt by $294 million,including the repayment of the entire principal balance of $248 million of our 7.875% senior notes on September 15,2010, due on that date, as well as the repayment of $35 million of bank borrowings by our Lamb Weston BSWpotato processing venture. During fiscal 2011, we also received net proceeds of $60 million from employeesexercising stock options, net of tax payments we made related to issuance of stock awards. During fiscal 2010, wepaid dividends of $347 million, we repurchased $100 million of our common stock as part of our share repurchaseprogram, and we reduced our long-term debt by $16 million. During fiscal 2010, we also received net proceeds of$55 million from employees exercising stock options, net of tax payments related to issuance of stock awards.
We estimate our capital expenditures in fiscal 2012 will be approximately $475 million. Management believesthat existing cash balances, cash flows from operations, existing credit facilities, and access to capital markets willprovide sufficient liquidity to meet our working capital needs, planned capital expenditures, and payment ofanticipated quarterly dividends for at least the next twelve months.
OFF-BALANCE SHEET ARRANGEMENTS
We use off-balance sheet arrangements (e.g., leases accounted for as operating leases) where sound businessprinciples warrant their use. We also periodically enter into guarantees and other similar arrangements as part oftransactions in the ordinary course of business. These are described further in “Obligations and Commitments,”below.
Variable Interest Entities Not Consolidated
We have variable interests in certain entities that we have determined to be variable interest entities, but forwhich we are not the primary beneficiary. We do not consolidate the financial statements of these entities.
We hold a 50% interest in Lamb Weston RDO, a potato processing venture. We provide all sales and marketingservices to Lamb Weston RDO. We receive a fee for these services based on a percentage of the net sales of theventure. We reflect the value of our ownership interest in this venture in other assets in our consolidated balancesheets, based upon the equity method of accounting. The balance of our investment was $14 million at both May 29,2011 and May 30, 2010, representing our maximum exposure to loss as a result of our involvement with thisventure. The capital structure of Lamb Weston RDO includes owners’ equity of $27 million and term borrowingsfrom banks of $50 million as of May 29, 2011. We have determined that we do not have the power to direct theactivities that most significantly impact the economic performance of this venture.
We lease certain office buildings from entities that we have determined to be variable interest entities. Thelease agreements with these entities include fixed-price purchase options for the assets being leased, representingour only variable interest in these lessor entities. These leases are accounted for as operating leases, and accordingly,there are no material assets or liabilities associated with these entities included in our balance sheets. We have nomaterial exposure to loss from our variable interests in these entities. We have determined that we do not have thepower to direct the activities that most significantly impact the economic performance of these entities. In making
28

this determination, we have considered, among other items, the terms of the lease agreements, the expectedremaining useful lives of the assets leased, and the capital structure of the lessor entities.
OBLIGATIONS AND COMMITMENTS
As part of our ongoing operations, we enter into arrangements that obligate us to make future payments undercontracts such as debt agreements, lease agreements, and unconditional purchase obligations (i.e., obligations totransfer funds in the future for fixed or minimum quantities of goods or services at fixed or minimum prices, such as“take-or-pay” contracts). The unconditional purchase obligation arrangements are entered into in the normal courseof business in order to ensure adequate levels of sourced product are available. Of these items, debt and capital leaseobligations, which totaled $3.3 billion as of May 29, 2011, were recognized as liabilities in our consolidated balancesheet. Operating lease obligations and unconditional purchase obligations, which totaled approximately $946 mil-lion as of May 29, 2011, were not recognized as liabilities in our consolidated balance sheet, in accordance withgenerally accepted accounting principles.
A summary of our contractual obligations at the end of fiscal 2011 was as follows (including obligations ofdiscontinued operations):
($ in millions)
Contractual Obligations TotalLess than
1 Year 1-3 Years 3-5 YearsAfter 5Years
Payments Due by Period
Long-term debt . . . . . . . . . . . . . . . $ 3,236.3 $ 356.7 $ 532.8 $ 76.9 $ 2,269.9
Capital lease obligations . . . . . . . . 61.8 5.5 9.1 5.2 42.0
Operating lease obligations . . . . . . 367.0 65.5 102.9 66.6 132.0
Purchase obligations . . . . . . . . . . . 578.5 489.8 40.3 21.8 26.6
Total . . . . . . . . . . . . . . . . . . . $ 4,243.6 $ 917.5 $ 685.1 $ 170.5 $ 2,470.5
The purchase obligations noted in the table above do not reflect open purchase orders of approximately$475 million, some of which are not legally binding. These purchase orders are expected to be settled in the ordinarycourse of business in less than one year.
We are also contractually obligated to pay interest on our long-term debt and capital lease obligations. Theweighted average interest rate of the long-term debt obligations outstanding as of May 29, 2011 was approximately6.4%.
As part of our ongoing operations, we also enter into arrangements that obligate us to make future cashpayments only upon the occurrence of a future event (e.g., guarantees of debt or lease payments of a third partyshould the third party be unable to perform). In accordance with generally accepted accounting principles, thefollowing commercial commitments are not recognized as liabilities in our consolidated balance sheet. A summaryof our commitments, including commitments associated with equity method investments, as of the end of fiscal2011, is as follows:
($ in millions)
Other Commercial Commitments TotalLess than
1 Year 1-3 Years 3-5 YearsAfter 5Years
Amount of Commitment Expiration per Period
Guarantees . . . . . . . . . . . . . . . . . . $ 94.1 $ 39.7 $ 10.9 $ 12.0 $ 31.5Other Commitments . . . . . . . . . . . 0.4 0.4 — — —
Total . . . . . . . . . . . . . . . . . . . $ 94.5 $ 40.1 $ 10.9 $ 12.0 $ 31.5
In certain limited situations, we will guarantee an obligation of an unconsolidated entity. We guarantee certainleases and other commercial obligations resulting from the 2002 divestiture of our fresh beef and pork operations.The remaining terms of these arrangements do not exceed five years and the maximum amount of future paymentswe have guaranteed was approximately $13 million, included in the table above, as of May 29, 2011.
We have also guaranteed the performance of the divested business with respect to a hog purchase contract. Thehog purchase contract requires the divested fresh beef and pork business to purchase a minimum of approximately
29

1.2 million hogs annually through 2014. The contract stipulates minimum price commitments, based in part onmarket prices, and in certain circumstances also includes price adjustments based on certain inputs.
We are a party to various potato supply agreements. Under the terms of certain such potato supply agreements,we have guaranteed repayment of short-term bank loans of the potato suppliers, under certain conditions. AtMay 29, 2011, the amount of supplier loans effectively guaranteed by us was approximately $34 million, includedin the table above. We have not established a liability for these guarantees, as we have determined that the likelihoodof our required performance under the guarantees is remote.
We are a party to various agreements with an onion processing company. We have guaranteed, under certainconditions, repayment of a portion of the loan held by this supplier for its onion processing related operations. AtMay 29, 2011, the amount of our guarantee was $25 million, included in the table above. In the event of default onthis loan by the supplier, we have the contractual right to purchase the loan from the lender, thereby giving ussecured rights to the underlying collateral. We have not established a liability in connection with this guarantee, aswe believe the likelihood of financial exposure to us under this guarantee is remote.
Federal income tax credits were generated related to the construction of our sweet potato production facility inDelhi, Louisiana. Third parties invested in certain of these income tax credits. We have guaranteed these thirdparties the face value of these income tax credits over their statutory lives, a period of seven years, in the event thatthe income tax credits are recaptured or reduced. The face value of the income tax credits was $21 million as ofMay 29, 2011. We believe the likelihood of the recapture or reduction of the income tax credits is remote, andtherefore we have not established a liability in connection with this guarantee.
The obligations and commitments tables above do not include any reserves for income taxes, as we are unableto reasonably estimate the ultimate amount or timing of settlement of our reserves for income taxes. The liability forgross unrecognized tax benefits at May 29, 2011 was approximately $56 million. The net amount of unrecognizedtax benefits at May 29, 2011, that, if recognized, would impact our effective tax rate was approximately $36 million.Recognition of this tax benefit would have a favorable impact on our effective tax rate.
CRITICAL ACCOUNTING ESTIMATES
The process of preparing financial statements requires the use of estimates on the part of management. Theestimates used by management are based on our historical experiences combined with management’s understandingof current facts and circumstances. Certain of our accounting estimates are considered critical as they are bothimportant to the portrayal of our financial condition and results and require significant or complex judgment on thepart of management. The following is a summary of certain accounting estimates considered critical bymanagement.
Our Audit Committee has reviewed management’s development, selection, and disclosure of the criticalaccounting estimates.
Marketing Costs—We incur certain costs to promote our products through marketing programs, which includeadvertising, customer incentives, and consumer incentives. We recognize the cost of each of these types ofmarketing activities as incurred in accordance with generally accepted accounting principles. The judgmentrequired in determining when marketing costs are incurred can be significant. For volume-based incentivesprovided to customers, management must continually assess the likelihood of the customer achieving the specifiedtargets. Similarly, for consumer coupons, management must estimate the level at which coupons will be redeemedby consumers in the future. Estimates made by management in accounting for marketing costs are based primarilyon our historical experience with marketing programs with consideration given to current circumstances andindustry trends. As these factors change, management’s estimates could change and we could recognize differentamounts of marketing costs over different periods of time.
We have recognized reserves of approximately $128 million for these marketing costs as of May 29, 2011.Changes in the assumptions used in estimating the cost of any individual customer marketing program would notresult in a material change in our results of operations or cash flows.
30

Advertising and promotion expenses of continuing operations totaled $372 million, $409 million, and$381 million in fiscal 2011, 2010, and 2009, respectively.
Income Taxes—Our income tax expense is based on our income, statutory tax rates, and tax planningopportunities available in the various jurisdictions in which we operate. Tax laws are complex and subject todifferent interpretations by the taxpayer and respective governmental taxing authorities. Significant judgment isrequired in determining our income tax expense and in evaluating our tax positions, including evaluatinguncertainties. Management reviews tax positions at least quarterly and adjusts the balances as new informationbecomes available. Deferred income tax assets represent amounts available to reduce income taxes payable ontaxable income in future years. Such assets arise because of temporary differences between the financial reportingand tax bases of assets and liabilities, as well as from net operating loss and tax credit carryforwards. Managementevaluates the recoverability of these future tax deductions by assessing the adequacy of future expected taxableincome from all sources, including reversal of taxable temporary differences, forecasted operating earnings, andavailable tax planning strategies. These estimates of future taxable income inherently require significant judgment.Management uses historical experience and short and long-range business forecasts to develop such estimates.Further, we employ various prudent and feasible tax planning strategies to facilitate the recoverability of futuredeductions. To the extent management does not consider it more likely than not that a deferred tax asset will berecovered, a valuation allowance is established.
Further information on income taxes is provided in Note 16 to the consolidated financial statements.
Environmental Liabilities—Environmental liabilities are accrued when it is probable that obligations havebeen incurred and the associated amounts can be reasonably estimated. Management works with independent third-party specialists in order to effectively assess our environmental liabilities. Management estimates our environ-mental liabilities based on evaluation of investigatory studies, extent of required clean-up, our known volumetriccontribution, other potentially responsible parties, and our experience in remediating sites. Environmental liabilityestimates may be affected by changing governmental or other external determinations of what constitutes anenvironmental liability or an acceptable level of clean-up. Management’s estimate as to our potential liability isindependent of any potential recovery of insurance proceeds or indemnification arrangements. Insurance com-panies and other indemnitors are notified of any potential claims and periodically updated as to the general status ofknown claims. We do not discount our environmental liabilities as the timing of the anticipated cash payments is notfixed or readily determinable. To the extent that there are changes in the evaluation factors identified above,management’s estimate of environmental liabilities may also change.
We have recognized a reserve of approximately $70 million for environmental liabilities as of May 29, 2011.The reserve for each site is determined based on an assessment of the most likely required remedy and a relatedestimate of the costs required to effect such remedy. Historically, the underlying assumptions utilized in estimatingthis reserve have been appropriate as actual payments have neither differed materially from the previouslyestimated reserve balances, nor have significant adjustments to this reserve balance been necessary. In fiscal 2010,based on changes in the regulatory environment applicable to a particular site, we reduced the recognizedenvironmental liability by approximately $15 million.
Employment-Related Benefits—We incur certain employment-related expenses associated with pensions,postretirement health care benefits, and workers’ compensation. In order to measure the annual expense associatedwith these employment-related benefits, management must make a variety of estimates including, but not limited to,discount rates used to measure the present value of certain liabilities, assumed rates of return on assets set aside tofund these expenses, compensation increases, employee turnover rates, anticipated mortality rates, anticipatedhealth care costs, and employee accidents incurred but not yet reported to us. The estimates used by managementare based on our historical experience as well as current facts and circumstances. We use third-party specialists toassist management in appropriately measuring the expense associated with these employment-related benefits.Different estimates used by management could result in us recognizing different amounts of expense over differentperiods of time. We had recognized a pension liability of $352 million and $470 million, a postretirement liability of$322 million and $321 million, and a workers’ compensation liability of $74 million and $73 million, as of the endof fiscal 2011 and 2010, respectively. We also had recognized a pension asset of $15 million as of the end of fiscal2011, as certain individual plans of the Company had a positive funded status.
31

We recognized pension expense from Company plans of $55 million, $47 million, and $38 million in fiscalyears 2011, 2010, and 2009, respectively, which reflected expected returns on plan assets of $173 million,$161 million, and $159 million, respectively. We contributed $129 million, $123 million, and $112 million to ourpension plans in fiscal years 2011, 2010, and 2009, respectively. We anticipate contributing approximately$80 million to our pension plans in fiscal 2012.
One significant assumption for pension plan accounting is the discount rate. We select a discount rate each year(as of our fiscal year-end measurement date) for our plans based upon a hypothetical bond portfolio for which thecash flows from coupons and maturities match the year-by-year projected benefit cash flows for our pension plans.The hypothetical bond portfolio is comprised of high-quality fixed income debt instruments (usually Moody’s Aa)available at the measurement date. Based on this information, the discount rate selected by us for determination ofpension expense was 5.8% for fiscal year 2011, 6.9% for fiscal 2010, and 6.6% for fiscal 2009. We selected adiscount rate of 5.3% for determination of pension expense for fiscal 2012. A 25 basis point increase in our discountrate assumption as of the beginning of fiscal 2011 would decrease pension expense for our pension plans by$8 million for the year. A 25 basis point decrease in our discount rate assumption as of the beginning of fiscal 2011would increase pension expense for our pension plans by $9 million for the year. A 25 basis point increase in thediscount rate would decrease pension expense by approximately $9 million for fiscal 2012. A 25 basis pointdecrease in the discount rate would increase pension expense by approximately $10 million for fiscal 2012. For ouryear-end pension obligation determination, we selected a discount rate of 5.3% and 5.8% for fiscal years 2011 and2010, respectively.
Another significant assumption used to account for our pension plans is the expected long-term rate of returnon plan assets. In developing the assumed long-term rate of return on plan assets for determining pension expense,we consider long-term historical returns (arithmetic average) of the plan’s investments, the asset allocation amongtypes of investments, estimated long-term returns by investment type from external sources, and the currenteconomic environment. Based on this information, we selected 7.75% for the long-term rate of return on plan assetsfor determining our fiscal 2011 pension expense. A 25 basis point increase/decrease in our expected long-term rateof return assumption as of the beginning of fiscal 2011 would decrease/increase annual pension expense for ourpension plans by approximately $5 million. We selected an expected rate of return on plan assets of 7.75% to beused to determine our pension expense for fiscal 2012. A 25 basis point increase/decrease in our expected long-termrate of return assumption as of the beginning of fiscal 2012 would decrease/increase annual pension expense for ourpension plans by approximately $6 million.
When calculating expected return on plan assets for pension plans, we use a market-related value of assets thatspreads asset gains and losses (differences between actual return and expected return) over five years. The market-related value of assets used in the calculation of expected return on plan assets for fiscal 2011 was $63 millionhigher than the actual fair value of plan assets.
The rate of compensation increase is another significant assumption used in the development of accountinginformation for pension plans. We determine this assumption based on our long-term plans for compensationincreases and current economic conditions. Based on this information, we selected 4.25% for fiscal years 2011 and2010 as the rate of compensation increase for determining our year-end pension obligation. We selected 4.25% forthe rate of compensation increase for determination of pension expense for fiscal 2011, 2010, and 2009. A 25 basispoint increase in our rate of compensation increase assumption as of the beginning of fiscal 2011 would increasepension expense for our pension plans by approximately $1 million for the year. A 25 basis point decrease in our rateof compensation increase assumption as of the beginning of fiscal 2011 would decrease pension expense for ourpension plans by approximately $1 million for the year. We selected a rate of 4.25% for the rate of compensationincrease to be used to determine our pension expense for fiscal 2012. A 25 basis point increase/decrease in our rateof compensation increase assumption as of the beginning of fiscal 2012 would increase/decrease pension expensefor our pension plans by approximately $1 million for the year.
We also provide certain postretirement health care benefits. We recognized postretirement benefit expense of$12 million, $9 million, and $15 million in fiscal 2011, 2010, and 2009, respectively. We reflected liabilities of$322 million and $321 million in our balance sheets as of May 29, 2011 and May 30, 2010, respectively. Weanticipate contributing approximately $32 million to our postretirement health care plans in fiscal 2012.
32

The postretirement benefit expense and obligation are also dependent on our assumptions used for theactuarially determined amounts. These assumptions include discount rates (discussed above), health care cost trendrates, inflation rates, retirement rates, mortality rates, and other factors. The health care cost trend assumptions aredeveloped based on historical cost data, the near-term outlook, and an assessment of likely long-term trends.Assumed inflation rates are based on an evaluation of external market indicators. Retirement and mortality rates arebased primarily on actual plan experience. The discount rate we selected for determination of postretirementexpense was 5.4% for fiscal 2011, 6.6% for fiscal 2010, and 6.4% for fiscal 2009. We have selected a discount rateof 4.9% for determination of postretirement expense for fiscal 2012. A 25 basis point increase/decrease in ourdiscount rate assumption as of the beginning of fiscal 2011 would not have resulted in a material change topostretirement expense for our plans. We have assumed the initial year increase in cost of health care to be 7.5%,with the trend rate decreasing to 5.0% by 2016. A one percentage point change in the assumed health care cost trendrate would have the following effect:
($ in millions)One Percent
IncreaseOne Percent
Decrease
Effect on total service and interest cost . . . . . . . . . . . . . . . . . . . . . . . . . . $ 1 $ (1)
Effect on postretirement benefit obligation . . . . . . . . . . . . . . . . . . . . . . . . 24 (22)
We provide workers’ compensation benefits to our employees. The measurement of the liability for our cost ofproviding these benefits is largely based upon actuarial analysis of costs. One significant assumption we make is thediscount rate used to calculate the present value of our obligation. The discount rate used at May 29, 2011 was 3.4%.A 25 basis point increase/decrease in the discount rate assumption would not have a material impact on workers’compensation expense.
Impairment of Long-Lived Assets (including property, plant and equipment), Goodwill, and IdentifiableIntangible Assets—We reduce the carrying amounts of long-lived assets, goodwill, and identifiable intangibleassets to their fair values when the fair value of such assets is determined to be less than their carrying amounts (i.e.,assets are deemed to be impaired). Fair value is typically estimated using a discounted cash flow analysis, whichrequires us to estimate the future cash flows anticipated to be generated by the particular asset(s) being tested forimpairment as well as to select a discount rate to measure the present value of the anticipated cash flows. Whendetermining future cash flow estimates, we consider historical results adjusted to reflect current and anticipatedoperating conditions. Estimating future cash flows requires significant judgment by management in such areas asfuture economic conditions, industry-specific conditions, product pricing, and necessary capital expenditures. Theuse of different assumptions or estimates for future cash flows could produce different impairment amounts (or noneat all) for long-lived assets, goodwill, and identifiable intangible assets.
We utilize a “relief from royalty” methodology in evaluating impairment of our indefinite lived brands/trademarks. The methodology determines the fair value of each brand through use of a discounted cash flow modelthat incorporates an estimated “royalty rate” we would be able to charge a third party for the use of the particularbrand. When determining the future cash flow estimates, we must estimate future net sales and a fair market royaltyrate for each applicable brand and an appropriate discount rate to measure the present value of the anticipated cashflows. Estimating future net sales requires significant judgment by management in such areas as future economicconditions, product pricing, and consumer trends.
In determining an appropriate discount rate to apply to the estimated future cash flows, we consider the currentinterest rate environment and our estimated cost of capital. As the calculated fair value of our goodwill and otheridentifiable intangible assets generally significantly exceeds the carrying amount of these assets, a one percentagepoint increase in the discount rate assumptions used to estimate the fair values of our goodwill and other identifiableintangible assets would not result in a material impairment charge.
OTHER MATTERS
From time to time, one of our business units has engaged an environmental and agricultural engineeringservices firm. The firm is a subsidiary of an entity whose chief executive officer serves on our Board of Directors.Payments to this firm for environmental and agricultural engineering services and structures acquired totaled$0.3 million in both fiscal 2011 and 2010.
33

FORWARD-LOOKING STATEMENTS
This report, including Management’s Discussion and Analysis of Financial Condition and Results of Oper-ations, contains forward-looking statements within the meaning of the Private Securities Litigation Reform Act of1995. These statements are based on management’s current views and assumptions of future events and financialperformance and are subject to uncertainty and changes in circumstances. Readers of this report should understandthat these statements are not guarantees of performance or results. Many factors could affect our actual financialresults and cause them to vary materially from the expectations contained in the forward-looking statements,including those set forth in this report. These factors include, among other things: availability and prices of rawmaterials, including the impact of inflation; the impact of the 2009 accident at the Garner, North Carolinamanufacturing facility, including the ultimate costs incurred versus the amounts received under insurance policies;the effectiveness of our product pricing, including our ability to timely increase prices; future economic circum-stances; industry conditions; our ability to execute our operating and network optimization plans; the success of ourinnovation, marketing, and cost-savings initiatives; the amount and timing of repurchases of our common stock, ifany; the competitive environment and related market conditions; operating efficiencies; the ultimate impact ofrecalls; access to capital; actions of governments and regulatory factors affecting our businesses, including thePatient Protection and Affordable Care Act; and other risks described in our reports filed with the Securities andExchange Commission. We caution readers not to place undue reliance on any forward-looking statements includedin this report, which speak only as of the date of this report.
ITEM 7A. QUANTITATIVE AND QUALITATIVE DISCLOSURES ABOUT MARKET RISK
The principal market risks affecting us during fiscal 2011 and 2010 were exposures to price fluctuations ofcommodity and energy inputs, interest rates, and foreign currencies. These fluctuations impacted all reportingsegments, as well as our trading and merchandising activities, which are presented as discontinued operations for allperiods presented in our financial statements.
Commodity Market Risk—We purchase commodity inputs such as wheat, corn, oats, soybean meal, soybeanoil, meat, dairy products, sugar, natural gas, electricity, and packaging materials to be used in our operations. Thesecommodities are subject to price fluctuations that may create price risk. We enter into commodity hedges to managethis price risk using physical forward contracts or derivative instruments. We have policies governing the hedginginstruments our businesses may use. These policies include limiting the dollar risk exposure for each of ourbusinesses. We also monitor the amount of associated counter-party credit risk for all non-exchange-tradedtransactions. In addition, during our ownership of the trading and merchandising business (divested during quarterone of fiscal 2009), we purchased and sold certain commodities, such as wheat, corn, soybeans, soybean meal,soybean oil, oats, natural gas, and crude oil (presented in discontinued operations).
Interest Rate Risk—From time to time, we use interest rate swaps to manage the effect of interest rate changeson the fair value of our existing debt as well as the forecasted interest payments for the anticipated issuance of debt.During the fourth quarter of fiscal 2010, we entered into interest rate swap contracts used to effectively convert theinterest rates of certain outstanding debt instruments from fixed to variable. During the second quarter of fiscal2011, we terminated these interest rate swap contracts. As a result of this termination, we received proceeds of$32 million. The cumulative adjustment to the fair value of the debt instruments being hedged, $35 million, wasincluded in long-term debt and is being amortized as a reduction of interest expense over the remaining lives of thedebt instruments (through fiscal 2014).
During the third quarter of fiscal 2011, we entered into interest rate swap contracts to hedge the interest raterisk related to our forecasted issuance of long-term debt in 2014 (based on the anticipated refinancing of the seniorlong-term debt maturing at that time). The net notional amount of these interest rate derivatives at May 29, 2011 was$250 million. The maximum potential loss associated with these interest rate swap contracts from a hypotheticalchange of 1% in interest rates is approximately $53 million. Any such gain or loss would be deferred in accumulatedother comprehensive income and recognized in earnings over the life of the forecasted interest payments associatedwith the anticipated debt refinancing. At May 29, 2011, we had recognized an unrealized loss of $12 million inaccumulated other comprehensive income for these derivative instruments.
34

As of May 29, 2011 and May 30, 2010, the fair value of our fixed rate debt was estimated at $3.6 billion and$4.1 billion, respectively, based on current market rates primarily provided by outside investment advisors. As ofMay 29, 2011 and May 30, 2010, a one percentage point increase in interest rates would decrease the fair value ofour fixed rate debt by approximately $208 million and $234 million, respectively, while a one percentage pointdecrease in interest rates would increase the fair value of our fixed rate debt by approximately $232 million and$256 million, respectively.
Foreign Currency Risk—In order to reduce exposures for our processing activities related to changes in foreigncurrency exchange rates, we may enter into forward exchange or option contracts for transactions denominated in acurrency other than the functional currency for certain of our operations. This activity primarily relates toeconomically hedging against foreign currency risk in purchasing inventory and capital equipment, sales offinished goods, and future settlement of foreign denominated assets and liabilities.
Value-at-Risk (VaR)—We employ various tools to monitor our derivative risk, including value-at-risk (“VaR”)models. We perform simulations using historical data to estimate potential losses in the fair value of currentderivative positions. We use price and volatility information for the prior 90 days in the calculation of VaR that isused to monitor our daily risk. The purpose of this measurement is to provide a single view of the potential risk ofloss associated with derivative positions at a given point in time based on recent changes in market prices. Ourmodel uses a 95 percent confidence level. Accordingly, in any given one day time period, losses greater than theamounts included in the table, below, are expected to occur only 5 percent of the time. We include commodityswaps, futures, and options and foreign exchange forwards, swaps, and options in this calculation. The followingtable provides an overview of our average daily VaR for our energy, agriculture, and other commodities as well asthe average daily foreign exchange VaR. Other commodities may include items such as packaging, livestock, and/ormetals.
AverageDuring Fifty-two Weeks
Ended May 29, 2011
AverageDuring Fifty-two Weeks
Ended May 30, 2010
Fair Value Impact (in millions)
Energy Commodities . . . . . . . . . . . . . . . . . . . . . . . . . $ 1.8 $ 1.3
Agriculture Commodities . . . . . . . . . . . . . . . . . . . . . . $ 3.2 $ 1.5
Other Commodities . . . . . . . . . . . . . . . . . . . . . . . . . . $ — $ 0.1
Foreign Exchange . . . . . . . . . . . . . . . . . . . . . . . . . . . $ 1.3 $ 0.9
Prior to fiscal 2011, we presented analyses of market risk using a sensitivity analysis methodology. Duringfiscal 2011, we began using a VaR methodology for purposes of this presentation, as this is a methodology used bymanagement in monitoring market risk, and we believe this is a more useful presentation to readers.
35

ITEM 8. FINANCIAL STATEMENTS AND SUPPLEMENTARY DATA
CONSOLIDATED STATEMENTS OF EARNINGS
CONAGRA FOODS, INC. AND SUBSIDIARIES
Dollars in millions except per share amounts
2011 2010 2009For the Fiscal Years Ended May
Net sales . . . . . . . . . . . . . . . . . . . . . . . . . . . . . . . . . . . . . . . . $ 12,303.1 $ 12,014.9 $ 12,348.6
Costs and expenses:
Cost of goods sold . . . . . . . . . . . . . . . . . . . . . . . . . . . . . 9,389.6 8,953.7 9,571.1
Selling, general and administrative expenses . . . . . . . . . . 1,511.1 1,819.4 1,683.2
Interest expense, net . . . . . . . . . . . . . . . . . . . . . . . . . . . . 177.5 160.4 186.0
Income from continuing operations before income taxes andequity method investment earnings . . . . . . . . . . . . . . . . . . . 1,224.9 1,081.4 908.3
Income tax expense . . . . . . . . . . . . . . . . . . . . . . . . . . . . . . . . 421.0 360.9 317.1
Equity method investment earnings . . . . . . . . . . . . . . . . . . . . 26.4 22.1 24.0
Income from continuing operations. . . . . . . . . . . . . . . . . . . . . 830.3 742.6 615.2
Income (loss) from discontinued operations, net of tax . . . . . . (11.5) (19.3) 363.8
Net income . . . . . . . . . . . . . . . . . . . . . . . . . . . . . . . . . . . . . . $ 818.8 $ 723.3 $ 979.0
Less: Net income (loss) attributable to noncontrollinginterests . . . . . . . . . . . . . . . . . . . . . . . . . . . . . . . . . . . . . . . 1.8 (2.5) 0.6
Net income attributable to ConAgra Foods, Inc. . . . . . . . . $ 817.0 $ 725.8 $ 978.4
Earnings per share—basicIncome from continuing operations attributable to ConAgra
Foods, Inc. common stockholders . . . . . . . . . . . . . . . . . . . . $ 1.92 $ 1.68 $ 1.36
Income (loss) from discontinued operations attributable toConAgra Foods, Inc. common stockholders . . . . . . . . . . . . . (0.02) (0.05) 0.80
Net income attributable to ConAgra Foods, Inc. commonstockholders . . . . . . . . . . . . . . . . . . . . . . . . . . . . . . . . . . . $ 1.90 $ 1.63 $ 2.16
Earnings per share—dilutedIncome from continuing operations attributable to ConAgra
Foods, Inc. common stockholders . . . . . . . . . . . . . . . . . . . . $ 1.90 $ 1.66 $ 1.35
Income (loss) from discontinued operations attributable toConAgra Foods, Inc. common stockholders . . . . . . . . . . . . . (0.02) (0.04) 0.80
Net income attributable to ConAgra Foods, Inc. commonstockholders . . . . . . . . . . . . . . . . . . . . . . . . . . . . . . . . . . . $ 1.88 $ 1.62 $ 2.15
The accompanying Notes are an integral part of the consolidated financial statements.
36

CONSOLIDATED STATEMENTS OF COMPREHENSIVE INCOME
CONAGRA FOODS, INC. AND SUBSIDIARIES
Dollars in millions
2011 2010 2009For the Fiscal Years Ended May
Net income . . . . . . . . . . . . . . . . . . . . . . . . . . . . . . . . . . . . . . . $ 818.8 $ 723.3 $ 979.0Other comprehensive income (loss):
Derivative adjustments, net of tax . . . . . . . . . . . . . . . (7.2) 0.2 (0.7)Unrealized gains and losses on available-for-sale
securities, net of tax:Unrealized net holding losses . . . . . . . . . . . . . . (0.1) — (0.4)Reclassification adjustment for losses included
in net income . . . . . . . . . . . . . . . . . . . . . . . . — — 0.3Currency translation adjustment:
Unrealized translation gains (losses) . . . . . . . . . 47.3 (3.7) (72.1)Reclassification adjustment for losses (gains)
included in net income . . . . . . . . . . . . . . . . . (1.6) — 2.0Pension and postretirement healthcare liabilities, net
of tax . . . . . . . . . . . . . . . . . . . . . . . . . . . . . . . . . . 24.2 (178.1) (319.3)
Comprehensive income . . . . . . . . . . . . . . . . . . . . . . . . . . . . . . 881.4 541.7 588.8Comprehensive income (loss) attributable to
noncontrolling interests . . . . . . . . . . . . . . . . . . . . . . . . 1.8 (2.5) 0.6
Comprehensive income attributable to ConAgra Foods, Inc. . . $ 879.6 $ 544.2 $ 588.2
The accompanying Notes are an integral part of the consolidated financial statements.
37

CONSOLIDATED BALANCE SHEETS
CONAGRA FOODS, INC. AND SUBSIDIARIES
Dollars in millions except share dataMay 29, 2011 May 30, 2010
ASSETSCurrent assets
Cash and cash equivalents . . . . . . . . . . . . . . . . . . . . . . . . . . . . . . . . . . . . $ 972.4 $ 953.2Receivables, less allowance for doubtful accounts of $7.8 and $8.5 . . . . . . 849.4 849.6Inventories . . . . . . . . . . . . . . . . . . . . . . . . . . . . . . . . . . . . . . . . . . . . . . . 1,803.4 1,597.9Prepaid expenses and other current assets . . . . . . . . . . . . . . . . . . . . . . . . . 274.1 307.3Current assets held for sale . . . . . . . . . . . . . . . . . . . . . . . . . . . . . . . . . . . — 252.1
Total current assets . . . . . . . . . . . . . . . . . . . . . . . . . . . . . . . . . . . . . 3,899.3 3,960.1Property, plant and equipment
Land and land improvements . . . . . . . . . . . . . . . . . . . . . . . . . . . . . . . . . . 201.3 168.6Buildings, machinery and equipment . . . . . . . . . . . . . . . . . . . . . . . . . . . . 4,440.1 4,093.0Furniture, fixtures, office equipment and other . . . . . . . . . . . . . . . . . . . . . 871.9 843.0Construction in progress . . . . . . . . . . . . . . . . . . . . . . . . . . . . . . . . . . . . . 184.8 248.0
5,698.1 5,352.6Less accumulated depreciation . . . . . . . . . . . . . . . . . . . . . . . . . . . . . . . . . (3,028.0) (2,750.2)
Property, plant and equipment, net . . . . . . . . . . . . . . . . . . . . . . . . . . 2,670.1 2,602.4Goodwill . . . . . . . . . . . . . . . . . . . . . . . . . . . . . . . . . . . . . . . . . . . . . . . . . . . . 3,609.4 3,549.9Brands, trademarks and other intangibles, net . . . . . . . . . . . . . . . . . . . . . . . . . 936.3 874.8Other assets . . . . . . . . . . . . . . . . . . . . . . . . . . . . . . . . . . . . . . . . . . . . . . . . . . 293.6 695.6Noncurrent assets held for sale . . . . . . . . . . . . . . . . . . . . . . . . . . . . . . . . . . . . — 55.2
$ 11,408.7 $ 11,738.0
LIABILITIES AND COMMON STOCKHOLDERS’ EQUITYCurrent liabilities
Notes payable . . . . . . . . . . . . . . . . . . . . . . . . . . . . . . . . . . . . . . . . . . . . . $ — $ 0.6Current installments of long-term debt . . . . . . . . . . . . . . . . . . . . . . . . . . . 363.5 260.2Accounts payable . . . . . . . . . . . . . . . . . . . . . . . . . . . . . . . . . . . . . . . . . . 1,083.7 919.1Accrued payroll . . . . . . . . . . . . . . . . . . . . . . . . . . . . . . . . . . . . . . . . . . . 124.1 263.9Other accrued liabilities . . . . . . . . . . . . . . . . . . . . . . . . . . . . . . . . . . . . . . 554.3 579.0Current liabilities held for sale . . . . . . . . . . . . . . . . . . . . . . . . . . . . . . . . . — 13.4
Total current liabilities . . . . . . . . . . . . . . . . . . . . . . . . . . . . . . . . . . . 2,125.6 2,036.2Senior long-term debt, excluding current installments . . . . . . . . . . . . . . . . . . . 2,674.4 3,030.5Subordinated debt . . . . . . . . . . . . . . . . . . . . . . . . . . . . . . . . . . . . . . . . . . . . . . 195.9 195.9Other noncurrent liabilities . . . . . . . . . . . . . . . . . . . . . . . . . . . . . . . . . . . . . . . 1,704.3 1,541.3Noncurrent liabilities held for sale . . . . . . . . . . . . . . . . . . . . . . . . . . . . . . . . . — 5.2
Total liabilities . . . . . . . . . . . . . . . . . . . . . . . . . . . . . . . . . . . . . . . . . 6,700.2 6,809.1Commitments and contingencies (Notes 17 and 18)Common stockholders’ equity
Common stock of $5 par value, authorized 1,200,000,000 shares; issued567,907,172 . . . . . . . . . . . . . . . . . . . . . . . . . . . . . . . . . . . . . . . . . . . . 2,839.7 2,839.7
Additional paid-in capital . . . . . . . . . . . . . . . . . . . . . . . . . . . . . . . . . . . . 899.1 897.5Retained earnings . . . . . . . . . . . . . . . . . . . . . . . . . . . . . . . . . . . . . . . . . . 4,853.6 4,417.1Accumulated other comprehensive loss . . . . . . . . . . . . . . . . . . . . . . . . . . (222.7) (285.3)Less treasury stock, at cost, common shares 157,412,899 and
125,637,495 . . . . . . . . . . . . . . . . . . . . . . . . . . . . . . . . . . . . . . . . . . . . (3,668.2) (2,945.1)Total ConAgra Foods common stockholders’ equity . . . . . . . . . . . . . 4,701.5 4,923.9
Noncontrolling interests . . . . . . . . . . . . . . . . . . . . . . . . . . . . . . . . . . . . . . 7.0 5.0Total common stockholders’ equity. . . . . . . . . . . . . . . . . . . . . . . . . . 4,708.5 4,928.9
$ 11,408.7 $ 11,738.0
The accompanying Notes are an integral part of the consolidated financial statements.
38

CONSOLIDATED STATEMENTS OF COMMON STOCKHOLDERS’ EQUITY
CONAGRA FOODS, INC. AND SUBSIDIARIES
FOR THE FISCAL YEARS ENDED MAY
Dollars in millions except per share amounts
CommonShares
CommonStock
AdditionalPaid-inCapital
RetainedEarnings
AccumulatedOther
ComprehensiveIncome (Loss)
TreasuryStock
NoncontrollingInterests
TotalEquity
ConAgra Foods, Inc. Stockholders’ Equity
Balance at May 25, 2008 . . . . . . . 566.7 $ 2,833.4 $ 866.9 $ 3,409.5 $ 286.5 $ (2,058.9) $ — $ 5,337.4
Stock option and incentive plans . . . 0.5 2.5 17.5 (0.6) 20.7 40.1Currency translation adjustment, net
of reclassification adjustment . . . . (70.1) (70.1)Repurchase of common shares . . . . (900.0) (900.0)Unrealized loss on securities, net of
reclassification adjustment . . . . . (0.1) (0.1)Derivative adjustment, net of
reclassification adjustment . . . . . (0.7) (0.7)Adoption of new deferred
compensation accountingguidance . . . . . . . . . . . . . . . . . (3.9) (3.9)
Pension and postretirementhealthcare benefits . . . . . . . . . . (319.3) (319.3)
Dividends declared on commonstock; $0.76 per share . . . . . . . . (340.9) (340.9)
Net income attributable to ConAgraFoods, Inc. . . . . . . . . . . . . . . . 978.4 978.4
Balance at May 31, 2009 . . . . . . . 567.2 2,835.9 884.4 4,042.5 (103.7) (2,938.2) — 4,720.9
Stock option and incentive plans . . . 0.7 3.8 15.1 (1.3) 93.1 110.7Currency translation adjustment . . . . (3.7) (3.7)Repurchase of common shares . . . . (100.0) (100.0)Derivative adjustment, net of
reclassification adjustment . . . . . 0.2 0.2Activities of noncontrolling
interests . . . . . . . . . . . . . . . . . (2.0) 5.0 3.0Pension and postretirement
healthcare benefits . . . . . . . . . . (178.1) (178.1)Dividends declared on common
stock; $0.79 per share . . . . . . . . (349.9) (349.9)Net income attributable to ConAgra
Foods, Inc. . . . . . . . . . . . . . . . 725.8 725.8
Balance at May 30, 2010 . . . . . . . 567.9 2,839.7 897.5 4,417.1 (285.3) (2,945.1) 5.0 4,928.9
Stock option and incentive plans . . . 3.5 (0.4) 101.9 105.0Currency translation adjustment, net
of reclassification adjustment . . . . 45.7 45.7Repurchase of common shares . . . . (825.0) (825.0)Unrealized loss on securities . . . . . . (0.1) (0.1)Derivative adjustment, net of
reclassification adjustment . . . . . (7.2) (7.2)Activities of noncontrolling
interests . . . . . . . . . . . . . . . . . (1.9) 2.0 0.1Pension and postretirement
healthcare benefits . . . . . . . . . . 24.2 24.2Dividends declared on common
stock; $0.89 per share . . . . . . . . (380.1) (380.1)Net income attributable to ConAgra
Foods, Inc. . . . . . . . . . . . . . . . 817.0 817.0
Balance at May 29, 2011 . . . . . . . 567.9 $ 2,839.7 $ 899.1 $ 4,853.6 $ (222.7) $ (3,668.2) $ 7.0 $ 4,708.5
The accompanying Notes are an integral part of the consolidated financial statements.
39

CONSOLIDATED STATEMENTS OF CASH FLOWS
CONAGRA FOODS, INC. AND SUBSIDIARIES
FOR THE FISCAL YEARS ENDED MAY
Dollars in millions2011 2010 2009
Cash flows from operating activities:Net income . . . . . . . . . . . . . . . . . . . . . . . . . . . . . . . . . . . . . . . . . . . . . . . . . . . . . $ 818.8 $ 723.3 $ 979.0Income from discontinued operations . . . . . . . . . . . . . . . . . . . . . . . . . . . . . . . . . . . . . (11.5) (19.3) 363.8
Income from continuing operations . . . . . . . . . . . . . . . . . . . . . . . . . . . . . . . . . . . . . . . 830.3 742.6 615.2Adjustments to reconcile income from continuing operations to net cash flows from
operating activities:Depreciation and amortization . . . . . . . . . . . . . . . . . . . . . . . . . . . . . . . . . . . . 360.9 324.1 304.9Gain on sale of businesses . . . . . . . . . . . . . . . . . . . . . . . . . . . . . . . . . . . . . . — (14.3) (19.7)Asset impairment charges. . . . . . . . . . . . . . . . . . . . . . . . . . . . . . . . . . . . . . . 19.8 64.4 5.3Impairment charges related to Garner accident . . . . . . . . . . . . . . . . . . . . . . . . . . — 31.5 —Insurance recoveries recognized related to Garner accident . . . . . . . . . . . . . . . . . . (109.4) (58.1) —Receipts from insurance carriers related to Garner accident . . . . . . . . . . . . . . . . . . 64.5 50.2 —Distributions from affiliates greater (less) than current earnings . . . . . . . . . . . . . . . (13.1) 8.5 17.4Share-based payments expense . . . . . . . . . . . . . . . . . . . . . . . . . . . . . . . . . . . 44.8 55.8 45.9Loss on retirement of debt . . . . . . . . . . . . . . . . . . . . . . . . . . . . . . . . . . . . . . — — 49.2Proceeds from settlement of interest rate swaps . . . . . . . . . . . . . . . . . . . . . . . . . 31.5 — —Non-cash interest income on payment-in-kind notes . . . . . . . . . . . . . . . . . . . . . . — (67.9) (41.1)Receipt of interest on payment-in-kind notes earned in prior years . . . . . . . . . . . . . 102.8 6.2 —Gain on collection of payment-in-kind notes . . . . . . . . . . . . . . . . . . . . . . . . . . . (25.0) — (3.6)Contributions to Company pension plans . . . . . . . . . . . . . . . . . . . . . . . . . . . . . (129.4) (122.6) (112.0)Other items (including noncurrent deferred income taxes) . . . . . . . . . . . . . . . . . . . 267.5 89.7 12.8Change in operating assets and liabilities excluding effects of business acquisitions and
dispositions:Accounts receivable . . . . . . . . . . . . . . . . . . . . . . . . . . . . . . . . . . . . . . . 2.8 (90.1) 74.8Inventories . . . . . . . . . . . . . . . . . . . . . . . . . . . . . . . . . . . . . . . . . . . . . (190.7) 199.6 (47.0)Prepaid expenses and other current assets . . . . . . . . . . . . . . . . . . . . . . . . . . 31.6 (20.0) 170.8Accounts payable . . . . . . . . . . . . . . . . . . . . . . . . . . . . . . . . . . . . . . . . . 185.0 73.9 17.5Accrued payroll . . . . . . . . . . . . . . . . . . . . . . . . . . . . . . . . . . . . . . . . . . (139.2) 96.9 (61.3)Other accrued liabilities . . . . . . . . . . . . . . . . . . . . . . . . . . . . . . . . . . . . . 5.3 59.6 (49.3)
Net cash flows from operating activities—continuing operations . . . . . . . . . . . . . . . 1,340.0 1,430.0 979.8Net cash flows from operating activities—discontinued operations . . . . . . . . . . . . . 12.3 42.7 (855.8)
Net cash flows from operating activities . . . . . . . . . . . . . . . . . . . . . . . . . . . . . . 1,352.3 1,472.7 124.0
Cash flows from investing activities:Additions to property, plant and equipment . . . . . . . . . . . . . . . . . . . . . . . . . . . . . . . (466.2) (482.3) (428.9)Receipts from insurance carriers related to Garner accident . . . . . . . . . . . . . . . . . . . . . 18.0 34.8 —Sale of businesses . . . . . . . . . . . . . . . . . . . . . . . . . . . . . . . . . . . . . . . . . . . . . . — 21.7 29.7Sale of property, plant and equipment . . . . . . . . . . . . . . . . . . . . . . . . . . . . . . . . . . 18.9 88.4 17.7Purchase of businesses and intangible assets . . . . . . . . . . . . . . . . . . . . . . . . . . . . . . (149.1) (106.5) (80.3)Proceeds from collection of payment-in-kind notes . . . . . . . . . . . . . . . . . . . . . . . . . . 412.5 91.9 —Other items . . . . . . . . . . . . . . . . . . . . . . . . . . . . . . . . . . . . . . . . . . . . . . . . . . — — 1.9
Net cash flows from investing activities—continuing operations . . . . . . . . . . . . . . . (165.9) (352.0) (459.9)Net cash flows from investing activities—discontinued operations . . . . . . . . . . . . . . 254.8 (3.3) 2,251.1
Net cash flows from investing activities . . . . . . . . . . . . . . . . . . . . . . . . . . . . . . 88.9 (355.3) 1,791.2
Cash flows from financing activities:Net short-term borrowings . . . . . . . . . . . . . . . . . . . . . . . . . . . . . . . . . . . . . . . . . — — (578.3)Issuance of long-term debt . . . . . . . . . . . . . . . . . . . . . . . . . . . . . . . . . . . . . . . . . — — 1,030.1Repayment of long-term debt . . . . . . . . . . . . . . . . . . . . . . . . . . . . . . . . . . . . . . . (294.3) (15.8) (1,015.7)Repurchase of ConAgra Foods common shares . . . . . . . . . . . . . . . . . . . . . . . . . . . . (825.0) (100.0) (900.0)Cash dividends paid . . . . . . . . . . . . . . . . . . . . . . . . . . . . . . . . . . . . . . . . . . . . . (374.5) (346.7) (348.2)Return of cash to minority interest holder . . . . . . . . . . . . . . . . . . . . . . . . . . . . . . . . — — (20.0)Exercise of stock options and issuance of other stock awards . . . . . . . . . . . . . . . . . . . . 59.7 54.7 6.1Other items . . . . . . . . . . . . . . . . . . . . . . . . . . . . . . . . . . . . . . . . . . . . . . . . . . 2.1 3.9 (1.1)
Net cash flows from financing activities—continuing operations . . . . . . . . . . . . . . . (1,432.0) (403.9) (1,827.1)Net cash flows from financing activities—discontinued operations . . . . . . . . . . . . . (0.1) (0.6) 0.1
Net cash flows from financing activities . . . . . . . . . . . . . . . . . . . . . . . . . . . . . . (1,432.1) (404.5) (1,827.0)
Effect of exchange rate changes on cash and cash equivalents . . . . . . . . . . . . . . . . . . . . . . 10.1 (2.9) (16.7)Net change in cash and cash equivalents . . . . . . . . . . . . . . . . . . . . . . . . . . . . . . . . . . . 19.2 710.0 71.5Discontinued operations cash activity included above:
Add: Cash balance included in assets held for sale at beginning of year . . . . . . . . . . . . . — — 30.8Less: Cash balance included in assets held for sale at end of year . . . . . . . . . . . . . . . . . — — —
Cash and cash equivalents at beginning of year . . . . . . . . . . . . . . . . . . . . . . . . . . . . . . . 953.2 243.2 140.9
Cash and cash equivalents at end of year . . . . . . . . . . . . . . . . . . . . . . . . . . . . . . . . . . . $ 972.4 $ 953.2 $ 243.2
The accompanying Notes are an integral part of the consolidated financial statements.
40

NOTES TO CONSOLIDATED FINANCIAL STATEMENTS
Fiscal years ended May 29, 2011, May 30, 2010, and May 31, 2009
Columnar Amounts in Millions Except Per Share Amounts
1. SUMMARY OF SIGNIFICANT ACCOUNTING POLICIES
Fiscal Year—The fiscal year of ConAgra Foods, Inc. (“ConAgra Foods”, “Company”, “we”, “us”, or “our”)ends the last Sunday in May. The fiscal years for the consolidated financial statements presented consist of 52-weekperiods for fiscal years 2011 and 2010 and a 53-week period for fiscal year 2009.
Basis of Consolidation—The consolidated financial statements include the accounts of ConAgra Foods, Inc.and all majority-owned subsidiaries. In addition, the accounts of all variable interest entities for which we have beendetermined to be the primary beneficiary are included in our consolidated financial statements from the date suchdetermination is made. All significant intercompany investments, accounts, and transactions have been eliminated.
Investments in Unconsolidated Affiliates—The investments in, and the operating results of, 50%-or-less-owned entities not required to be consolidated are included in the consolidated financial statements on the basis ofthe equity method of accounting or the cost method of accounting, depending on specific facts and circumstances.
We review our investments in unconsolidated affiliates for impairment whenever events or changes in businesscircumstances indicate that the carrying amount of the investments may not be fully recoverable. Evidence of a lossin value that is other than temporary include, but are not limited to, the absence of an ability to recover the carryingamount of the investment, the inability of the investee to sustain an earnings capacity which would justify thecarrying amount of the investment, or, where applicable, estimated sales proceeds which are insufficient to recoverthe carrying amount of the investment. Management’s assessment as to whether any decline in value is other thantemporary is based on our ability and intent to hold the investment and whether evidence indicating the carryingvalue of the investment is recoverable within a reasonable period of time outweighs evidence to the contrary.Management generally considers our investments in equity method investees to be strategic long-term investments.Therefore, management completes its assessments with a long-term viewpoint. If the fair value of the investment isdetermined to be less than the carrying value and the decline in value is considered to be other than temporary, anappropriate write-down is recorded based on the excess of the carrying value over the best estimate of fair value ofthe investment.
Cash and Cash Equivalents—Cash and all highly liquid investments with an original maturity of three monthsor less at the date of acquisition, including short-term time deposits and government agency and corporateobligations, are classified as cash and cash equivalents.
Inventories—We principally use the lower of cost (determined using the first-in, first-out method) or marketfor valuing inventories other than merchandisable agricultural commodities. Grain, flour, and major feed ingredientinventories are principally stated at market value.
Property, Plant and Equipment—Property, plant and equipment are carried at cost. Depreciation has beencalculated using the straight-line method over the estimated useful lives of the respective classes of assets asfollows:
Land improvements . . . . . . . . . . . . . . . . . . . . . . . . . . . . . . . . . . . . . . . . . . 1 - 40 years
Buildings. . . . . . . . . . . . . . . . . . . . . . . . . . . . . . . . . . . . . . . . . . . . . . . . . . 15 - 40 years
Machinery and equipment . . . . . . . . . . . . . . . . . . . . . . . . . . . . . . . . . . . . . 3 - 20 years
Furniture, fixtures, office equipment and other . . . . . . . . . . . . . . . . . . . . . . 5 - 15 years
We review property, plant and equipment for impairment whenever events or changes in business circum-stances indicate that the carrying amount of the assets may not be fully recoverable. Recoverability of an assetconsidered “held-and-used” is determined by comparing the carrying amount of the asset to the undiscounted netcash flows expected to be generated from the use of the asset. If the carrying amount is greater than the undiscountednet cash flows expected to be generated by the asset, the asset’s carrying amount is reduced to its estimated fairvalue. An asset considered “held-for-sale” is reported at the lower of the asset’s carrying amount or fair value.
41

Goodwill and Other Identifiable Intangible Assets—Goodwill and other identifiable intangible assets withindefinite lives (e.g., brands or trademarks) are not amortized and are tested annually for impairment of value andwhenever events or changes in circumstances indicate the carrying amount of the asset may be impaired.Impairment of identifiable intangible assets with indefinite lives occurs when the fair value of the asset is lessthan its carrying amount. If impaired, the asset’s carrying amount is reduced to its fair value. Goodwill is evaluatedusing a two-step impairment test at a reporting unit level. A reporting unit can be an operating segment or a businesswithin an operating segment. The first step of the test compares the carrying value of a reporting unit, includinggoodwill, with its fair value. We estimate the fair value using level 3 inputs as defined by the fair value hierarchy.Refer to Note 21 for the definition of the levels in the fair value hierarchy. The inputs used to calculate the fair valueinclude a number of subjective factors, such as estimates of future cash flows, estimates of our future cost structure,discount rates for our estimated cash flows, required level of working capital, assumed terminal value, and timehorizon of cash flow forecasts. If the carrying value of a reporting unit exceeds its fair value, we complete thesecond step of the test to determine the amount of goodwill impairment loss to be recognized. In the second step, weestimate an implied fair value of the reporting unit’s goodwill by allocating the fair value of the reporting unit to allof the assets and liabilities other than goodwill (including any unrecognized intangible assets). The impairment lossis equal to the excess of the carrying value of the goodwill over the implied fair value of that goodwill. Our annualimpairment testing is performed during the fourth quarter using a discounted cash flow-based methodology.
Identifiable intangible assets with definite lives (e.g., licensing arrangements with contractual lives orcustomer relationships) are amortized over their estimated useful lives and tested for impairment whenever eventsor changes in circumstances indicate the carrying amount of the asset may be impaired. Identifiable intangibleassets with definite lives are evaluated for impairment using a process similar to that used in evaluating elements ofproperty, plant and equipment. If impaired, the asset is written down to its fair value.
Fair Values of Financial Instruments—Unless otherwise specified, we believe the carrying value of financialinstruments approximates their fair value.
Environmental Liabilities—Environmental liabilities are accrued when it is probable that obligations havebeen incurred and the associated amounts can be reasonably estimated. We use third-party specialists to assistmanagement in appropriately measuring the obligations associated with environmental liabilities. Such liabilitiesare adjusted as new information develops or circumstances change. We do not discount our environmental liabilitiesas the timing of the anticipated cash payments is not fixed or readily determinable. Management’s estimate of ourpotential liability is independent of any potential recovery of insurance proceeds or indemnification arrangements.We do not reduce our environmental liabilities for potential insurance recoveries.
Employment-Related Benefits—Employment-related benefits associated with pensions, postretirementhealth care benefits, and workers’ compensation are expensed as such obligations are incurred. The recognitionof expense is impacted by estimates made by management, such as discount rates used to value these liabilities,future health care costs, and employee accidents incurred but not yet reported. We use third-party specialists toassist management in appropriately measuring the obligations associated with employment-related benefits.
Revenue Recognition—Revenue is recognized when title and risk of loss are transferred to customers upondelivery based on terms of sale and collectibility is reasonably assured. Revenue is recognized as the net amount tobe received after deducting estimated amounts for discounts, trade allowances, and returns of damaged andout-of-date products. Changes in the market value of inventories of merchandisable agricultural commodities,forward cash purchase and sales contracts, and exchange-traded futures and options contracts are recognized inearnings immediately.
Shipping and Handling—Amounts billed to customers related to shipping and handling are included in netsales. Shipping and handling costs are included in cost of goods sold.
42
NOTES TO CONSOLIDATED FINANCIAL STATEMENTS — (Continued)
Fiscal years ended May 29, 2011, May 30, 2010, and May 31, 2009
Columnar Amounts in Millions Except Per Share Amounts

Marketing Costs—We promote our products with advertising, consumer incentives, and trade promotions.Such programs include, but are not limited to, discounts, coupons, rebates, and volume-based incentives. Adver-tising costs are expensed as incurred. Consumer incentives and trade promotion activities are recorded as areduction of revenue or as a component of cost of goods sold based on amounts estimated as being due to customersand consumers at the end of the period, based principally on historical utilization and redemption rates. Advertisingand promotion expenses totaled $371.9 million, $409.1 million, and $380.6 million in fiscal 2011, 2010, and 2009,respectively, and are included in selling, general and administrative expenses.
Research and Development—We incurred expenses of $81.4 million, $77.9 million, and $78.0 million forresearch and development activities in fiscal 2011, 2010, and 2009, respectively.
Comprehensive Income—Comprehensive income includes net income, currency translation adjustments,certain derivative-related activity, changes in the value of available-for-sale investments, and changes in priorservice cost and net actuarial gains/losses from pension and postretirement health care plans. We generally deemour foreign investments to be essentially permanent in nature and, as such, we do not provide for taxes on currencytranslation adjustments arising from converting the investment in a foreign currency to U.S. dollars. When wedetermine that a foreign investment, as well as undistributed earnings, are no longer permanent in nature, estimatedtaxes are provided for the related deferred taxes, if any, resulting from currency translation adjustments. Wereclassified $1.6 million of foreign currency translation net gains to net income due to the disposal or substantialliquidation of foreign subsidiaries in fiscal 2011. We reclassified $2.0 million of foreign currency translation netlosses to net income due to the disposal or substantial liquidation of foreign subsidiaries and equity methodinvestments in fiscal 2009.
The following is a rollforward of the balances in accumulated other comprehensive income (loss), net of tax(except for currency translation adjustment):
CurrencyTranslationAdjustment,
Net ofReclassification
Adjustments
NetDerivative
Adjustment, Netof Reclassification
Adjustments
UnrealizedLoss on
Available-For-Sale
Securities, Netof
ReclassificationAdjustments
Pension andPostretirementAdjustments
AccumulatedOther
ComprehensiveIncome (Loss)
Balance at May 25, 2008 . . $ 122.7 $ (0.5) $ (1.1) $ 165.4 $ 286.5Current-period change . . . . (70.1) (0.7) (0.1) (319.3) (390.2)
Balance at May 31, 2009 . . 52.6 (1.2) (1.2) (153.9) (103.7)Current-period change . . . . (3.7) 0.2 — (178.1) (181.6)
Balance at May 30, 2010 . . 48.9 (1.0) (1.2) (332.0) (285.3)Current-period change . . . . 45.7 (7.2) (0.1) 24.2 62.6
Balance at May 29, 2011 . . $ 94.6 $ (8.2) $ (1.3) $ (307.8) $ (222.7)
The following details the income tax expense (benefit) on components of other comprehensive income (loss):
2011 2010 2009
Net derivative adjustment . . . . . . . . . . . . . . . . . . . . . . . . . . . . . . $ (4.2) $ 0.1 $ (0.4)
Unrealized losses on available-for-sale securities . . . . . . . . . . . . . (0.1) — (0.3)
Reclassification adjustment for losses included in net income . . . . — — 0.2
Pension and postretirement healthcare liabilities . . . . . . . . . . . . . . 16.3 (108.5) (178.4)
43
NOTES TO CONSOLIDATED FINANCIAL STATEMENTS — (Continued)
Fiscal years ended May 29, 2011, May 30, 2010, and May 31, 2009
Columnar Amounts in Millions Except Per Share Amounts

Foreign Currency Transaction Gains and Losses—We recognized net foreign currency transaction gains(losses) from continuing operations of $3.9 million, $(6.2) million, and $0.7 million in fiscal 2011, 2010, and 2009,respectively, in selling, general and administrative expenses.
Use of Estimates—Preparation of financial statements in conformity with generally accepted accountingprinciples requires management to make estimates and assumptions. These estimates and assumptions affectreported amounts of assets, liabilities, revenues, and expenses as reflected in the consolidated financial statements.Actual results could differ from these estimates.
Reclassifications—Certain prior year amounts have been reclassified to conform with current yearpresentation.
Accounting Changes—In June 2009, the Financial Accounting Standards Board (“FASB”) amended itsguidance on the consolidation of variable interest entities. This guidance requires an enterprise to perform ananalysis to determine whether the enterprise’s variable interest or interests give it a controlling financial interest in avariable interest entity. This analysis identifies the primary beneficiary of a variable interest entity as the enterprisethat has both of the following characteristics: the power to direct the activities of a variable interest entity that mostsignificantly impact the entity’s economic performance and the obligation to absorb losses of the entity that couldpotentially be significant to the variable interest entity or the right to receive benefits from the entity that couldpotentially be significant to the variable interest entity. We adopted the provisions of this guidance effective as of thebeginning of our fiscal 2011. The impact of the adoption of this guidance was not material to our financialstatements.
2. DISCONTINUED OPERATIONS AND DIVESTITURES
Frozen Handhelds Operations
In May 2011, we completed the sale of substantially all of the assets of our frozen handhelds operations for$9.5 million in cash, subject to final working capital adjustments. We recognized impairment and related chargestotaling $21.7 million ($14.2 million after-tax) in fiscal 2011. We reflected the results of these operations asdiscontinued operations for all periods presented. The assets of the discontinued frozen handhelds operations havebeen reclassified as assets held for sale within our consolidated balance sheets for all periods presented prior todivestiture.
Gilroy Foods & FlavorsTM Operations
During the first quarter of fiscal 2011, we completed the sale of substantially all of the assets of Gilroy Foods &FlavorsTM dehydrated garlic, onion, capsicum and Controlled MoistureTM, GardenFrost», Redi-MadeTM, and freshvegetable operations for $245.7 million in cash. Based on our estimate of proceeds from the sale of this business, werecognized impairment and related charges totaling $59.2 million ($39.9 million after-tax) in the fourth quarter offiscal 2010. We reflected the results of these operations as discontinued operations for all periods presented. Theassets and liabilities of the discontinued Gilroy Foods & FlavorsTM dehydrated vegetable business have beenreclassified as assets and liabilities held for sale within our consolidated balance sheets for the period prior todivestiture.
In connection with the sale of this business, we entered into agreements to purchase certain ingredients fromthe divested business for a period of five years. The continuing cash flows related to these agreements are notsignificant, and accordingly, are not deemed to be direct cash flows of the divested business.
44
NOTES TO CONSOLIDATED FINANCIAL STATEMENTS — (Continued)
Fiscal years ended May 29, 2011, May 30, 2010, and May 31, 2009
Columnar Amounts in Millions Except Per Share Amounts

Fernando’s» Operations
In June 2009, we completed the divestiture of the Fernando’s» foodservice brand for proceeds of approx-imately $6.4 million in cash. Based on our estimate of proceeds from the sale of this business, we recognizedimpairment charges totaling $8.9 million in the fourth quarter of fiscal 2009. We reflected the results of theseoperations as discontinued operations for all periods presented.
Trading and Merchandising Operations
On March 27, 2008, we entered into an agreement with affiliates of Ospraie Special Opportunities Fund to sellour commodity trading and merchandising operations conducted by ConAgra Trade Group (previously principallyreported as the Trading and Merchandising segment). The operations included the domestic and international grainmerchandising, fertilizer distribution, agricultural and energy commodities trading and services, and grain, animal,and oil seed byproducts merchandising and distribution business. In June 2008, the sale of the trading andmerchandising operations was completed for before-tax proceeds of: 1) approximately $2.2 billion in cash, net oftransaction costs (including incentive compensation amounts due to employees due to accelerated vesting),2) $550.0 million (face value) of payment-in-kind debt securities issued by the purchaser (the “Notes”) whichwere recorded at an initial estimated fair value of $479.4 million, 3) a short-term receivable of $37.2 million duefrom the purchaser, and 4) a four-year warrant to acquire approximately 5% of the issued common equity of theparent company of the divested operations, which was recorded at an estimated fair value of $1.8 million. Werecognized an after-tax gain on the disposition of approximately $301.2 million in fiscal 2009.
During fiscal 2009, we collected the $37.2 million short-term receivable due from the purchaser. See Note 4 forfurther discussion on the Notes.
We reflected the results of the divested trading and merchandising operations as discontinued operations for allperiods presented.
The results of the aforementioned businesses which have been divested are included within discontinuedoperations. The summary comparative financial results of discontinued operations were as follows:
2011 2010 2009
Net sales . . . . . . . . . . . . . . . . . . . . . . . . . . . . . . . . . . . . . . . . . . . $ 92.4 $ 355.2 $ 632.3
Long-lived asset impairment charge . . . . . . . . . . . . . . . . . . . . . . . (21.7) (58.3) (8.9)
Income (loss) from operations of discontinued operations beforeincome taxes . . . . . . . . . . . . . . . . . . . . . . . . . . . . . . . . . . . . . . (18.6) (38.9) 105.9
Net gain from disposal of businesses . . . . . . . . . . . . . . . . . . . . . . — — 490.0
Income (loss) before income taxes . . . . . . . . . . . . . . . . . . . . . . . . (18.6) (38.9) 595.9
Income tax (expense) benefit . . . . . . . . . . . . . . . . . . . . . . . . . . . . 7.1 19.6 (232.1)
Income (loss) from discontinued operations, net of tax . . . . . . . . . $ (11.5) $ (19.3) $ 363.8
The effective tax rate for discontinued operations varies significantly from the statutory rate in certain yearsdue to the non-deductibility of a portion of the goodwill of divested businesses and changes in estimates of incometaxes.
45
NOTES TO CONSOLIDATED FINANCIAL STATEMENTS — (Continued)
Fiscal years ended May 29, 2011, May 30, 2010, and May 31, 2009
Columnar Amounts in Millions Except Per Share Amounts
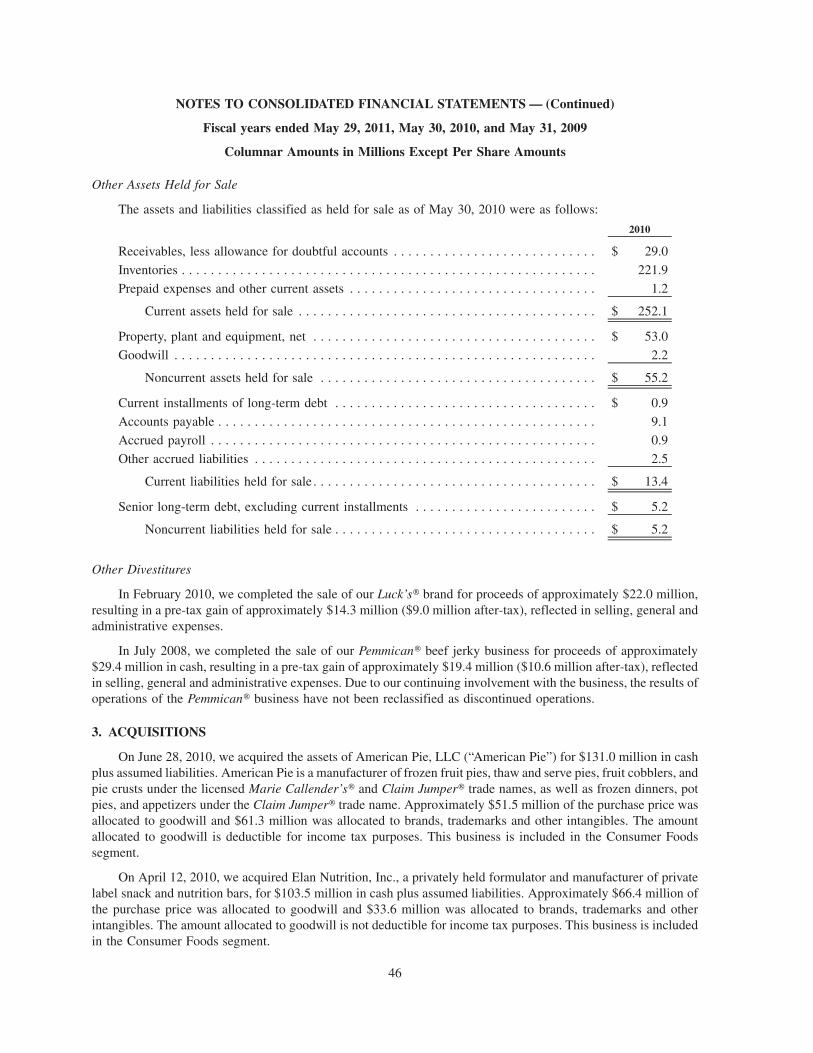
Other Assets Held for Sale
The assets and liabilities classified as held for sale as of May 30, 2010 were as follows:
2010
Receivables, less allowance for doubtful accounts . . . . . . . . . . . . . . . . . . . . . . . . . . . . $ 29.0
Inventories . . . . . . . . . . . . . . . . . . . . . . . . . . . . . . . . . . . . . . . . . . . . . . . . . . . . . . . . . 221.9
Prepaid expenses and other current assets . . . . . . . . . . . . . . . . . . . . . . . . . . . . . . . . . . 1.2
Current assets held for sale . . . . . . . . . . . . . . . . . . . . . . . . . . . . . . . . . . . . . . . . . $ 252.1
Property, plant and equipment, net . . . . . . . . . . . . . . . . . . . . . . . . . . . . . . . . . . . . . . . $ 53.0
Goodwill . . . . . . . . . . . . . . . . . . . . . . . . . . . . . . . . . . . . . . . . . . . . . . . . . . . . . . . . . . 2.2
Noncurrent assets held for sale . . . . . . . . . . . . . . . . . . . . . . . . . . . . . . . . . . . . . . $ 55.2
Current installments of long-term debt . . . . . . . . . . . . . . . . . . . . . . . . . . . . . . . . . . . . $ 0.9
Accounts payable . . . . . . . . . . . . . . . . . . . . . . . . . . . . . . . . . . . . . . . . . . . . . . . . . . . . 9.1
Accrued payroll . . . . . . . . . . . . . . . . . . . . . . . . . . . . . . . . . . . . . . . . . . . . . . . . . . . . . 0.9
Other accrued liabilities . . . . . . . . . . . . . . . . . . . . . . . . . . . . . . . . . . . . . . . . . . . . . . . 2.5
Current liabilities held for sale . . . . . . . . . . . . . . . . . . . . . . . . . . . . . . . . . . . . . . . $ 13.4
Senior long-term debt, excluding current installments . . . . . . . . . . . . . . . . . . . . . . . . . $ 5.2
Noncurrent liabilities held for sale . . . . . . . . . . . . . . . . . . . . . . . . . . . . . . . . . . . . $ 5.2
Other Divestitures
In February 2010, we completed the sale of our Luck’s» brand for proceeds of approximately $22.0 million,resulting in a pre-tax gain of approximately $14.3 million ($9.0 million after-tax), reflected in selling, general andadministrative expenses.
In July 2008, we completed the sale of our Pemmican» beef jerky business for proceeds of approximately$29.4 million in cash, resulting in a pre-tax gain of approximately $19.4 million ($10.6 million after-tax), reflectedin selling, general and administrative expenses. Due to our continuing involvement with the business, the results ofoperations of the Pemmican» business have not been reclassified as discontinued operations.
3. ACQUISITIONS
On June 28, 2010, we acquired the assets of American Pie, LLC (“American Pie”) for $131.0 million in cashplus assumed liabilities. American Pie is a manufacturer of frozen fruit pies, thaw and serve pies, fruit cobblers, andpie crusts under the licensed Marie Callender’s» and Claim Jumper» trade names, as well as frozen dinners, potpies, and appetizers under the Claim Jumper» trade name. Approximately $51.5 million of the purchase price wasallocated to goodwill and $61.3 million was allocated to brands, trademarks and other intangibles. The amountallocated to goodwill is deductible for income tax purposes. This business is included in the Consumer Foodssegment.
On April 12, 2010, we acquired Elan Nutrition, Inc., a privately held formulator and manufacturer of privatelabel snack and nutrition bars, for $103.5 million in cash plus assumed liabilities. Approximately $66.4 million ofthe purchase price was allocated to goodwill and $33.6 million was allocated to brands, trademarks and otherintangibles. The amount allocated to goodwill is not deductible for income tax purposes. This business is includedin the Consumer Foods segment.
46
NOTES TO CONSOLIDATED FINANCIAL STATEMENTS — (Continued)
Fiscal years ended May 29, 2011, May 30, 2010, and May 31, 2009
Columnar Amounts in Millions Except Per Share Amounts

On September 22, 2008, we acquired a 49.99% interest in Lamb Weston BSW, LLC (“Lamb Weston BSW” orthe “venture”), a potato processing joint venture with Ochoa Ag Unlimited Foods, Inc. (“Ochoa”), for approx-imately $46.2 million in cash. Lamb Weston BSW subsequently distributed $20.0 million of our initial investmentto us. This venture is considered a variable interest entity and is consolidated in our financial statements (seeNote 7). Approximately $18.8 million of the purchase price was allocated to goodwill and approximately$11.1 million was allocated to brands, trademarks and other intangibles. The amount allocated to goodwill isdeductible by the entity for income tax purposes. This business is included in the Commercial Foods segment.
During fiscal 2009, we completed other various individually immaterial acquisitions of businesses and otheridentifiable intangible assets for approximately $18.4 million in cash plus assumed liabilities. Approximately$15.1 million of the purchase price was allocated to goodwill, brands, trademarks and other intangibles.
For each of these acquisitions, the amounts allocated to goodwill were primarily attributable to anticipatedsynergies, product portfolios, and other intangibles that do not qualify for separate recognition.
Under the acquisition method of accounting, the assets acquired and liabilities assumed in these acquisitionswere recorded at their respective estimated fair values at the date of acquisition.
The pro forma effect of the acquisitions mentioned above was not material.
4. PAYMENT-IN-KIND NOTES RECEIVABLE
In connection with the divestiture of the trading and merchandising operations in fiscal 2009, we received$550.0 million (face value) of payment-in-kind debt securities (the “Notes”) issued by the purchaser of the divestedbusiness. The Notes were recorded at an initial estimated fair value of $479.4 million.
The Notes were issued in three tranches: $99,990,000 original principal amount of 10.5% notes due June 19,2010; $200,035,000 original principal amount of 10.75% notes due June 19, 2011; and $249,975,000 originalprincipal amount of 11.0% notes due June 19, 2012. The Notes permitted payment of interest in cash or additionalnotes.
During fiscal 2010, we received $115.4 million as payment in full of all principal and interest due on the firsttranche of the Notes, in advance of the scheduled maturity date. During fiscal 2011, we received $554.2 million aspayment in full of all principal and interest due on the second and third tranches of the Notes, in advance of thescheduled maturity dates. As a result, we recognized a gain of $25.0 million in fiscal 2011.
At May 30, 2010, the second and third tranches of the Notes, which were classified as other assets in ourconsolidated balance sheet, had an aggregate carrying value of $490.2 million.
5. GARNER, NORTH CAROLINA ACCIDENT
On June 9, 2009, an accidental explosion occurred at our manufacturing facility in Garner, North Carolina (the“Garner accident”). This facility was the primary production facility for our Slim Jim» branded meat snacks. OnJune 13, 2009, the U.S. Bureau of Alcohol, Tobacco, Firearms and Explosives announced its determination that theexplosion was the result of an accidental natural gas release, and not a deliberate act.
47
NOTES TO CONSOLIDATED FINANCIAL STATEMENTS — (Continued)
Fiscal years ended May 29, 2011, May 30, 2010, and May 31, 2009
Columnar Amounts in Millions Except Per Share Amounts

The costs incurred and insurance recoveries recognized, for fiscal 2011 and 2010, were reflected in ourconsolidated financial statements as follows:
ConsumerFoods Corporate Total
ConsumerFoods Corporate Total
Fiscal Year Ended May 29, 2011 Fiscal Year Ended May 30, 2010
Cost of goods sold:Inventory write-downs
and other costs . . . . . . . $ 0.9 $ — $ 0.9 $ 11.9 $ — $ 11.9
Selling, general andadministrativeexpenses:
Fixed asset impairments,clean-up costs, etc. . . . $ 2.6 $ 0.6 $ 3.2 $ 47.5 $ 2.6 $ 50.1
Insurance recoveriesrecognized . . . . . . . . . . (109.4) — (109.4) (58.1) — (58.1)
Total selling, general andadministrativeexpenses . . . . . . . . . . . $ (106.8) $ 0.6 $ (106.2) $ (10.6) $ 2.6 $ (8.0)
Net loss (gain) . . . . . . . . . $ (105.9) $ 0.6 $ (105.3) $ 1.3 $ 2.6 $ 3.9
The amounts in the table above exclude actual lost profits due to the interruption of the meat snacks business inthe periods presented, but do reflect the recovery of the related business interruption insurance claim in the fourthquarter of fiscal 2011.
During the fourth quarter of fiscal 2011, the Company settled its property and business interruption claimsrelated to the accident with our insurance providers. Through May 29, 2011, the total payments received from theinsurers was $167.5 million and all previously deferred balances have now been recognized. The insurancerecoveries recognized in fiscal 2011, included in selling, general and administrative expenses, totaled $109.4 mil-lion, representing $84.0 million of reimbursement for business interruption, a $21.3 million gain on involuntaryconversion of property, plant and equipment, and recovery of other expenses incurred of $4.1 million.
6. RESTRUCTURING ACTIVITIES
Network Optimization Plan
During the third quarter of fiscal 2011, our Board of Directors approved a plan recommended by executivemanagement designed to optimize our manufacturing and distribution networks. The plan consists of projects thatinvolve, among other things, the exit of certain manufacturing facilities, the disposal of underutilized manufacturingassets, and actions designed to optimize our distribution network. The plan is expected to be implemented by theend of fiscal 2013 and is intended to improve the efficiency of our manufacturing operations and reduce costs. Thisplan is referred to as the Network Optimization Plan, which we previously referred to as the 2011 plan.
In connection with the Network Optimization Plan, we expect to incur pre-tax cash and non-cash charges forasset impairments, accelerated depreciation, severance, relocation, and site closure costs of $54.9 million. We haverecognized, and/or expect to recognize, expenses associated with the Network Optimization Plan, including but notlimited to, impairments of property, plant and equipment, accelerated depreciation, severance and related costs, andplan implementation costs (e.g., consulting, employee relocation, etc.). We anticipate that we will recognize the
48
NOTES TO CONSOLIDATED FINANCIAL STATEMENTS — (Continued)
Fiscal years ended May 29, 2011, May 30, 2010, and May 31, 2009
Columnar Amounts in Millions Except Per Share Amounts

following pre-tax expenses associated with the Network Optimization Plan in the fiscal 2011 to 2013 timeframe(amounts include charges recognized in fiscal 2011):
ConsumerFoods
CommercialFoods Total
Accelerated depreciation . . . . . . . . . . . . . . . . . . . . . . . . . . . . . . . $ 12.5 $ — $ 12.5
Inventory write-offs and related costs . . . . . . . . . . . . . . . . . . . . . . 3.2 0.3 3.5
Total cost of goods sold . . . . . . . . . . . . . . . . . . . . . . . . . . . . 15.7 0.3 16.0
Asset impairment . . . . . . . . . . . . . . . . . . . . . . . . . . . . . . . . . . . . 8.6 10.4 19.0
Severance and related costs . . . . . . . . . . . . . . . . . . . . . . . . . . . . . 7.6 0.1 7.7
Other, net . . . . . . . . . . . . . . . . . . . . . . . . . . . . . . . . . . . . . . . . . . 9.2 3.0 12.2
Total selling, general and administrative expenses . . . . . . . . . 25.4 13.5 38.9
Consolidated total . . . . . . . . . . . . . . . . . . . . . . . . . . . . . $ 41.1 $ 13.8 $ 54.9
Included in the above estimates are $22.3 million of charges which have resulted or will result in cash outflowsand $32.6 million of non-cash charges.
During fiscal 2011, we recognized the following pre-tax charges in our consolidated statement of earnings forthe Network Optimization Plan:
ConsumerFoods
CommercialFoods Total
Accelerated depreciation . . . . . . . . . . . . . . . . . . . . . . . . . . . . . . . $ 5.0 $ — $ 5.0
Inventory write-offs and related costs . . . . . . . . . . . . . . . . . . . . . . 0.2 0.3 0.5
Total cost of goods sold . . . . . . . . . . . . . . . . . . . . . . . . . . . . 5.2 0.3 5.5
Asset impairment . . . . . . . . . . . . . . . . . . . . . . . . . . . . . . . . . . . . 8.6 10.4 19.0
Severance and related costs . . . . . . . . . . . . . . . . . . . . . . . . . . . . . 5.2 0.1 5.3
Other, net . . . . . . . . . . . . . . . . . . . . . . . . . . . . . . . . . . . . . . . . . . 0.7 0.1 0.8
Total selling, general and administrative expenses . . . . . . . . . 14.5 10.6 25.1
Consolidated total . . . . . . . . . . . . . . . . . . . . . . . . . . . . . $ 19.7 $ 10.9 $ 30.6
Liabilities recorded for the various initiatives and changes therein for fiscal 2011 under the NetworkOptimization Plan were as follows:
Balance atMay 30,
2010
Costs Incurredand Chargedto Expense
Costs Paidor Otherwise
SettledChanges inEstimates
Balance atMay 29,
2011
Severance and related costs . . . . . . . . . $ — $ 5.3 $ (0.5) $ — $ 4.8
Plan implementation costs. . . . . . . . . . — 0.8 (0.8) — —
Total . . . . . . . . . . . . . . . . . . . . . . $ — $ 6.1 $ (1.3) $ — $ 4.8
2010 Restructuring Plan
During the fourth quarter of fiscal 2010, our Board of Directors approved a plan recommended by executivemanagement related to the long-term production of our meat snack products. The plan provides for the closure ofour meat snacks production facility in Garner, North Carolina, and the movement of production to our existing
49
NOTES TO CONSOLIDATED FINANCIAL STATEMENTS — (Continued)
Fiscal years ended May 29, 2011, May 30, 2010, and May 31, 2009
Columnar Amounts in Millions Except Per Share Amounts

facility in Troy, Ohio. Since the Garner accident, the Troy facility has been producing a portion of our meat snackproducts. By the end of fiscal 2011, with the plan substantially implemented, the facility has become our primarymeat snacks production facility.
Also in the fourth quarter of fiscal 2010, we made a decision to consolidate certain administrative functionsfrom Edina, Minnesota, to Naperville, Illinois. We completed the transition of these functions in fiscal 2011. Thisplan, together with the plan to move production of our meat snacks from Garner, North Carolina to Troy, Ohio, iscollectively referred to as the 2010 restructuring plan (“2010 plan”).
In connection with the 2010 plan, we expect to incur pre-tax cash and non-cash charges for asset impairments,accelerated depreciation, severance, relocation, and site closure costs of $68.0 million, of which $25.7 million wasrecognized in fiscal 2011 and $39.2 million was recognized in fiscal 2010. We have recognized expenses associatedwith the 2010 plan, including but not limited to, impairments of property, plant and equipment, accelerateddepreciation, severance and related costs, and plan implementation costs (e.g., consulting, employee relocation,etc.). We anticipate that we will recognize the following pre-tax expenses associated with the 2010 plan in the fiscal2010 to 2012 timeframe (amounts include charges recognized in fiscal 2010 and 2011):
ConsumerFoods Corporate Total
Accelerated depreciation . . . . . . . . . . . . . . . . . . . . . . . . . . . . . . . $ 19.0 $ — $ 19.0
Inventory write-offs . . . . . . . . . . . . . . . . . . . . . . . . . . . . . . . . . . . 0.7 — 0.7
Total cost of goods sold . . . . . . . . . . . . . . . . . . . . . . . . . . . . 19.7 — 19.7
Asset impairment . . . . . . . . . . . . . . . . . . . . . . . . . . . . . . . . . . . . 16.5 — 16.5
Severance and related costs . . . . . . . . . . . . . . . . . . . . . . . . . . . . . 17.0 — 17.0
Other, net . . . . . . . . . . . . . . . . . . . . . . . . . . . . . . . . . . . . . . . . . . 11.2 3.6 14.8
Total selling, general and administrative expenses . . . . . . . . . 44.7 3.6 48.3
Consolidated total . . . . . . . . . . . . . . . . . . . . . . . . . . . . . $ 64.4 $ 3.6 $ 68.0
Included in the above estimates are $29.7 million of charges which have resulted or will result in cash outflowsand $38.3 million of non-cash charges.
During fiscal 2011, we recognized the following pre-tax charges in our consolidated statement of earnings forthe 2010 plan:
ConsumerFoods Corporate Total
Accelerated depreciation . . . . . . . . . . . . . . . . . . . . . . . . . . . . . . . $ 15.6 $ — $ 15.6
Inventory write-offs . . . . . . . . . . . . . . . . . . . . . . . . . . . . . . . . . . . 0.7 — 0.7
Total cost of goods sold . . . . . . . . . . . . . . . . . . . . . . . . . . . . 16.3 — 16.3
Severance and related costs . . . . . . . . . . . . . . . . . . . . . . . . . . . . . 2.8 — 2.8
Other, net . . . . . . . . . . . . . . . . . . . . . . . . . . . . . . . . . . . . . . . . . . 6.5 0.1 6.6
Total selling, general and administrative expenses . . . . . . . . . 9.3 0.1 9.4
Consolidated total . . . . . . . . . . . . . . . . . . . . . . . . . . . . . $ 25.6 $ 0.1 $ 25.7
50
NOTES TO CONSOLIDATED FINANCIAL STATEMENTS — (Continued)
Fiscal years ended May 29, 2011, May 30, 2010, and May 31, 2009
Columnar Amounts in Millions Except Per Share Amounts

We recognized the following cumulative (plan inception to May 29, 2011) pre-tax charges related to the 2010plan in our consolidated statement of earnings:
ConsumerFoods Corporate Total
Accelerated depreciation . . . . . . . . . . . . . . . . . . . . . . . . . . . . . . . $ 19.0 $ — $ 19.0
Inventory write-offs . . . . . . . . . . . . . . . . . . . . . . . . . . . . . . . . . . . 0.7 — 0.7
Total cost of goods sold . . . . . . . . . . . . . . . . . . . . . . . . . . . . 19.7 — 19.7
Asset Impairment . . . . . . . . . . . . . . . . . . . . . . . . . . . . . . . . . . . . 16.5 — 16.5
Severance and related costs . . . . . . . . . . . . . . . . . . . . . . . . . . . . . 17.0 — 17.0
Other, net . . . . . . . . . . . . . . . . . . . . . . . . . . . . . . . . . . . . . . . . . . 8.1 3.6 11.7
Total selling, general and administrative expenses . . . . . . . . . 41.6 3.6 45.2
Consolidated total . . . . . . . . . . . . . . . . . . . . . . . . . . . . . $ 61.3 $ 3.6 $ 64.9
Liabilities recorded for the various initiatives and changes therein for fiscal 2011 under the 2010 plan were asfollows:
Balance atMay 30,
2010
Costs Incurredand Chargedto Expense
Costs Paidor Otherwise
SettledChanges inEstimates
Balance atMay 29,
2011
Severance and related costs . . . . . . . . . $ 14.2 $ 2.8 $ (11.1) $ (0.7) $ 5.2
Plan implementation costs. . . . . . . . . . 1.0 5.3 (5.4) 0.1 1.0
Other costs . . . . . . . . . . . . . . . . . . . . . 3.5 0.1 (0.9) — 2.7
Total . . . . . . . . . . . . . . . . . . . . . . $ 18.7 $ 8.2 $ (17.4) $ (0.6) $ 8.9
7. VARIABLE INTEREST ENTITIES
Variable Interest Entities Consolidated
We own a 49.99% interest in Lamb Weston BSW, LLC (“Lamb Weston BSW”), a potato processing venturewith Ochoa Ag Unlimited Foods, Inc. (“Ochoa”). We provide all sales and marketing services to Lamb WestonBSW. Under certain circumstances, we could be required to compensate the other equity owner of Lamb WestonBSW for lost profits resulting from significant production shortfalls (“production shortfalls”). Commencing onJune 1, 2018, or on an earlier date under certain circumstances, we have a contractual right to purchase theremaining equity interest in Lamb Weston BSW from Ochoa (the “call option”). Commencing on July 30, 2011, oron an earlier date under certain circumstances, we are subject to a contractual obligation to purchase all of Ochoa’sequity investment in Lamb Weston BSW at the option of Ochoa (the “put option”). The purchase prices under thecall option and the put option (the “options”) are based on the book value of Ochoa’s equity interest at the date ofexercise, as modified by an agreed-upon rate of return for the holding period of the investment balance. Theagreed-upon rate of return varies depending on the circumstances under which any of the options are exercised. Wehave determined that Lamb Weston BSW is a variable interest entity and that we are the primary beneficiary of theentity. Accordingly, we consolidate the financial statements of Lamb Weston BSW.
As of May 29, 2011, we provided lines of credit of up to $15.0 million to Lamb Weston BSW. Borrowingsunder the lines of credit bear interest at a rate of LIBOR plus 200 basis points with a floor of 3.25%. In the firstquarter of fiscal 2011, we repaid $35.4 million of bank borrowings of Lamb Weston BSW and took assignment of apromissory note from the joint venture, the balance of which was $36.1 million at May 29, 2011. The promissorynote is due in December 2015. The promissory note is currently accruing interest at a rate of LIBOR plus 200 basis
51
NOTES TO CONSOLIDATED FINANCIAL STATEMENTS — (Continued)
Fiscal years ended May 29, 2011, May 30, 2010, and May 31, 2009
Columnar Amounts in Millions Except Per Share Amounts

points with a floor of 3.25%. The amounts owed by Lamb Weston BSW to the Company are not reflected in ourbalance sheets, as they are eliminated in consolidation.
Our variable interests in Lamb Weston BSW include an equity investment in the venture, the options, thepromissory note, certain fees paid to us by Lamb Weston BSW for sales and marketing services, the contingentobligation related to production shortfalls, and the lines of credit advanced to Lamb Weston BSW. Our maximumexposure to loss as a result of our involvement with this venture is equal to our equity investment in the venture, thebalance of the promissory note extended to the venture, the amount, if any, advanced under the lines of credit, andthe amount, if any, by which the put option exercise price exceeds the fair value of the noncontrolling interest inLamb Weston BSWon, or after, the put option exercise date. Also, in the event of a production shortfall, we could berequired to compensate the other equity owner of Lamb Weston BSW for lost profits. It is not possible to determinethe maximum exposure to losses from the potential exercise of the put option or from potential productionshortfalls. However, we do not expect to incur material losses resulting from these exposures.
We also consolidate the assets and liabilities of several entities from which we lease corporate aircraft. Each ofthese entities has been determined to be a variable interest entity and we have been determined to be the primarybeneficiary of each of these entities. Under the terms of the aircraft leases, we provide guarantees to the owners ofthese entities of a minimum residual value of the aircraft at the end of the lease term. We also have fixed pricepurchase options on the aircraft leased from these entities. Our maximum exposure to loss from our involvementwith these entities is limited to the difference between the fair value of the leased aircraft and the amount of theresidual value guarantees at the time we terminate the leases (the leases expire between December 2011 andOctober 2012). The total amount of the residual value guarantees for these aircraft at the end of the respective leaseterms is $38.4 million.
Due to the consolidation of these variable interest entities, we reflected in our consolidated balance sheets:
May 29,2011
May 30,2010
Cash and cash equivalents . . . . . . . . . . . . . . . . . . . . . . . . . . . . . . . . . . $ 5.3 $ —
Receivables, less allowance for doubtful accounts . . . . . . . . . . . . . . . . . 18.9 16.9
Inventories . . . . . . . . . . . . . . . . . . . . . . . . . . . . . . . . . . . . . . . . . . . . . 1.5 1.4
Prepaid expenses and other current assets . . . . . . . . . . . . . . . . . . . . . . . 0.3 0.3
Property, plant and equipment, net . . . . . . . . . . . . . . . . . . . . . . . . . . . . 91.8 96.5
Goodwill . . . . . . . . . . . . . . . . . . . . . . . . . . . . . . . . . . . . . . . . . . . . . . . 18.8 18.8
Brands, trademarks and other intangibles, net . . . . . . . . . . . . . . . . . . . . 9.0 9.8
Total assets . . . . . . . . . . . . . . . . . . . . . . . . . . . . . . . . . . . . . . . . . . . $ 145.6 $ 143.7
Current installments of long-term debt . . . . . . . . . . . . . . . . . . . . . . . . . $ 13.4 $ 6.4
Accounts payable . . . . . . . . . . . . . . . . . . . . . . . . . . . . . . . . . . . . . . . . 13.1 12.2
Accrued payroll . . . . . . . . . . . . . . . . . . . . . . . . . . . . . . . . . . . . . . . . . . 0.4 0.3
Other accrued liabilities . . . . . . . . . . . . . . . . . . . . . . . . . . . . . . . . . . . . 0.7 0.7
Senior long-term debt, excluding current installments . . . . . . . . . . . . . . 30.1 76.8
Other noncurrent liabilities (minority interest). . . . . . . . . . . . . . . . . . . . 26.7 24.8
Total liabilities . . . . . . . . . . . . . . . . . . . . . . . . . . . . . . . . . . . . . . . . . $ 84.4 $ 121.2
The liabilities recognized as a result of consolidating the Lamb Weston BSW entity do not represent additionalclaims on our general assets. The creditors of Lamb Weston BSW have claims only on the assets of Lamb Weston
52
NOTES TO CONSOLIDATED FINANCIAL STATEMENTS — (Continued)
Fiscal years ended May 29, 2011, May 30, 2010, and May 31, 2009
Columnar Amounts in Millions Except Per Share Amounts

BSW. The assets recognized as a result of consolidating Lamb Weston BSW are the property of the venture and arenot available to us for any other purpose, other than as a secured lender under the promissory note and lines of credit.
Variable Interest Entities Not Consolidated
We also have variable interests in certain other entities that we have determined to be variable interest entities,but for which we are not the primary beneficiary. We do not consolidate the financial statements of these entities.
We hold a 50% interest in Lamb Weston RDO, a potato processing venture. We provide all sales and marketingservices to Lamb Weston RDO. We receive a fee for these services based on a percentage of the net sales of theventure. We reflect the value of our ownership interest in this venture in other assets in our consolidated balancesheets, based upon the equity method of accounting. The balance of our investment was $13.6 million and$13.8 million at May 29, 2011 and May 30, 2010, respectively, representing our maximum exposure to loss as aresult of our involvement with this venture. The capital structure of Lamb Weston RDO includes owners’ equity of$27.3 million and term borrowings from banks of $49.5 million as of May 29, 2011. We have determined that we donot have the power to direct the activities that most significantly impact the economic performance of this venture.
We lease certain office buildings from entities that we have determined to be variable interest entities. Thelease agreements with these entities include fixed-price purchase options for the assets being leased, representingour only variable interest in these lessor entities. These leases are accounted for as operating leases, and accordingly,there are no material assets or liabilities associated with these entities included in our balance sheets. We have nomaterial exposure to loss from our variable interests in these entities. We have determined that we do not have thepower to direct the activities that most significantly impact the economic performance of these entities. In makingthis determination, we have considered, among other items, the terms of the lease agreements, the expectedremaining useful lives of the assets leased, and the capital structure of the lessor entities.
8. GOODWILL AND OTHER IDENTIFIABLE INTANGIBLE ASSETS
The change in the carrying amount of goodwill for fiscal 2011 and 2010 was as follows:
ConsumerFoods
CommercialFoods Total
Balance as of May 31, 2009 . . . . . . . . . . . . . . . . . . . . . $ 3,352.1 $ 129.3 $ 3,481.4
Acquisitions . . . . . . . . . . . . . . . . . . . . . . . . . . . . . . . . . 66.4 — 66.4
Translation and other . . . . . . . . . . . . . . . . . . . . . . . . . . 2.8 (0.7) 2.1
Balance as of May 30, 2010 . . . . . . . . . . . . . . . . . . . . . $ 3,421.3 $ 128.6 $ 3,549.9
Acquisitions . . . . . . . . . . . . . . . . . . . . . . . . . . . . . . . . . 51.5 — 51.5
Translation and other . . . . . . . . . . . . . . . . . . . . . . . . . . 6.9 1.1 8.0
Balance as of May 29, 2011 . . . . . . . . . . . . . . . . . . . . . $ 3,479.7 $ 129.7 $ 3,609.4
Other identifiable intangible assets were as follows:
GrossCarryingAmount
AccumulatedAmortization
GrossCarryingAmount
AccumulatedAmortization
2011 2010
Non-amortizing intangible assets . . . . . . . . . . . . . . $ 771.2 $ — $ 771.2 $ —
Amortizing intangible assets . . . . . . . . . . . . . . . . . 213.9 48.8 134.8 31.2
Total . . . . . . . . . . . . . . . . . . . . . . . . . . . . . . . $ 985.1 $ 48.8 $ 906.0 $ 31.2
53
NOTES TO CONSOLIDATED FINANCIAL STATEMENTS — (Continued)
Fiscal years ended May 29, 2011, May 30, 2010, and May 31, 2009
Columnar Amounts in Millions Except Per Share Amounts

Non-amortizing intangible assets are comprised of brands and trademarks.
Amortizing intangible assets, carrying a weighted average life of approximately 13 years, are principallycomposed of licensing arrangements and customer relationships. For fiscal 2011, 2010, and 2009, we recognizedamortization expense of $17.8 million, $7.8 million, and $6.6 million, respectively. Based on amortizing assetsrecognized in our balance sheet as of May 29, 2011, amortization expense is estimated to average approximately$16.5 million for each of the next five years, with a high expense of $18.3 million in fiscal year 2012 and decreasingto a low expense of $14.4 million in fiscal year 2016.
In connection with the acquisition of American Pie LLC in fiscal 2011, we allocated approximately$51.5 million of the purchase price to deductible goodwill and approximately $61.3 million to intangible assets(all of which is presented in the Consumer Foods segment). In fiscal 2011, we also acquired $18.0 million ofintangible assets in support of manufacturing reliability and other process technologies.
In connection with the acquisition of Elan in fiscal 2010, we allocated approximately $66.4 million of thepurchase price to non-deductible goodwill and approximately $33.6 million to intangible assets (all of which ispresented in the Consumer Foods segment).
In connection with the acquisition of Lamb Weston BSW in fiscal 2009, we allocated approximately$18.8 million of the purchase price to deductible goodwill and approximately $11.1 million to intangible assets(all of which is presented in the Commercial Foods segment).
9. EARNINGS PER SHARE
Basic earnings per share is calculated on the basis of weighted average outstanding common shares. Dilutedearnings per share is computed on the basis of basic weighted average outstanding common shares adjusted for thedilutive effect of stock options, restricted stock awards, and other dilutive securities.
The following table reconciles the income and average share amounts used to compute both basic and dilutedearnings per share:
2011 2010 2009
Net Income available to ConAgra Foods, Inc. commonstockholders:
Income from continuing operations attributable to ConAgraFoods, Inc. common stockholders . . . . . . . . . . . . . . . . . . . . . . . $ 828.5 $ 745.1 $ 614.6
Income (loss) from discontinued operations, net of tax,attributable to ConAgra Foods, Inc. common stockholders . . . . (11.5) (19.3) 363.8
Net income attributable to ConAgra Foods, Inc. commonstockholders . . . . . . . . . . . . . . . . . . . . . . . . . . . . . . . . . . . . . . $ 817.0 $ 725.8 $ 978.4
Less: Increase in redemption value of noncontrolling interests inexcess of earnings allocated . . . . . . . . . . . . . . . . . . . . . . . . . . . (1.9) (1.5) —
Net income available to ConAgra Foods, Inc. commonstockholders . . . . . . . . . . . . . . . . . . . . . . . . . . . . . . . . . . . . . . $ 815.1 $ 724.3 $ 978.4
Weighted Average Shares Outstanding:Basic weighted average shares outstanding . . . . . . . . . . . . . . . . . . 429.7 443.6 452.9
Add: Dilutive effect of stock options, restricted stock awards, andother dilutive securities . . . . . . . . . . . . . . . . . . . . . . . . . . . . . . 4.6 3.5 2.5
Diluted weighted average shares outstanding . . . . . . . . . . . . . . . . 434.3 447.1 455.4
54
NOTES TO CONSOLIDATED FINANCIAL STATEMENTS — (Continued)
Fiscal years ended May 29, 2011, May 30, 2010, and May 31, 2009
Columnar Amounts in Millions Except Per Share Amounts

At the end of fiscal 2011, 2010, and 2009, there were 15.8 million, 18.8 million, and 33.3 million stock optionsoutstanding, respectively, that were excluded from the computation of shares contingently issuable upon exercise ofthe stock options because exercise prices exceeded the annual average market value of our common stock.
10. INVENTORIES
The major classes of inventories are as follows:2011 2010
Raw materials and packaging . . . . . . . . . . . . . . . . . . . . . . . . . . . . . . . . . . . . . . $ 639.5 $ 477.8
Work in progress . . . . . . . . . . . . . . . . . . . . . . . . . . . . . . . . . . . . . . . . . . . . . . . 83.1 95.9
Finished goods . . . . . . . . . . . . . . . . . . . . . . . . . . . . . . . . . . . . . . . . . . . . . . . . . 992.9 940.3
Supplies and other . . . . . . . . . . . . . . . . . . . . . . . . . . . . . . . . . . . . . . . . . . . . . . 87.9 83.9
Total . . . . . . . . . . . . . . . . . . . . . . . . . . . . . . . . . . . . . . . . . . . . . . . . . . . . . $ 1,803.4 $ 1,597.9
11. CREDIT FACILITIES AND BORROWINGS
At May 29, 2011, we had a $1.50 billion multi-year revolving credit facility with a syndicate of financialinstitutions that matures in December 2011. The multi-year facility has historically been used principally as aback-up facility for our commercial paper program. As of May 29, 2011, there were no outstanding borrowingsunder the credit facility. Borrowings under the multi-year facility bear interest at or below prime rate and may beprepaid without penalty. The multi-year revolving credit facility requires us to repay borrowings if our consolidatedfunded debt exceeds 65% of the consolidated capital base, or if fixed charges coverage, each as defined in the creditagreement, is less than 1.75 to 1.0. As of May 29, 2011, we were in compliance with the credit agreement’s financialcovenants.
We finance our short-term liquidity needs with bank borrowings, commercial paper borrowings, and bankers’acceptances. We had no material short-term borrowings outstanding in fiscal 2011 and 2010.
55
NOTES TO CONSOLIDATED FINANCIAL STATEMENTS — (Continued)
Fiscal years ended May 29, 2011, May 30, 2010, and May 31, 2009
Columnar Amounts in Millions Except Per Share Amounts

12. SENIOR LONG-TERM DEBT, SUBORDINATED DEBT AND LOAN AGREEMENTS2011 2010
Senior Debt
8.25% senior debt due September 2030 . . . . . . . . . . . . . . . . . . . . . . . . . . . . $ 300.0 $ 300.07.0% senior debt due October 2028 . . . . . . . . . . . . . . . . . . . . . . . . . . . . . . . 382.2 382.2
6.7% senior debt due August 2027 . . . . . . . . . . . . . . . . . . . . . . . . . . . . . . . 9.2 9.2
7.125% senior debt due October 2026 . . . . . . . . . . . . . . . . . . . . . . . . . . . . . 372.4 372.4
7.0% senior debt due April 2019 . . . . . . . . . . . . . . . . . . . . . . . . . . . . . . . . . 500.0 500.0
5.819% senior debt due June 2017. . . . . . . . . . . . . . . . . . . . . . . . . . . . . . . . 500.0 500.0
5.875% senior debt due April 2014 . . . . . . . . . . . . . . . . . . . . . . . . . . . . . . . 500.0 500.0
6.75% senior debt due September 2011 . . . . . . . . . . . . . . . . . . . . . . . . . . . . 342.7 342.7
7.875% senior debt due September 2010 . . . . . . . . . . . . . . . . . . . . . . . . . . . — 248.0
2.00% to 9.59% lease financing obligations due on various dates through2029 . . . . . . . . . . . . . . . . . . . . . . . . . . . . . . . . . . . . . . . . . . . . . . . . . . . . 105.4 110.9
Other indebtedness . . . . . . . . . . . . . . . . . . . . . . . . . . . . . . . . . . . . . . . . . . . 67.0 97.6
Total face value senior debt . . . . . . . . . . . . . . . . . . . . . . . . . . . . . . . . . 3,078.9 3,363.0
Subordinated Debt . . . . . . . . . . . . . . . . . . . . . . . . . . . . . . . . . . . . . . . . . . . . . . .
9.75% subordinated debt due March 2021 . . . . . . . . . . . . . . . . . . . . . . . . . . 195.9 195.9
Total face value subordinated debt . . . . . . . . . . . . . . . . . . . . . . . . . . . . 195.9 195.9
Total debt face value . . . . . . . . . . . . . . . . . . . . . . . . . . . . . . . . . . . . . . 3,274.8 3,558.9
Unamortized discounts/premiums . . . . . . . . . . . . . . . . . . . . . . . . . . . . . (68.3) (76.2)
Adjustment due to hedging activity . . . . . . . . . . . . . . . . . . . . . . . . . . . 27.3 3.9
Less current installments . . . . . . . . . . . . . . . . . . . . . . . . . . . . . . . . . . . (363.5) (260.2)
Total long-term debt . . . . . . . . . . . . . . . . . . . . . . . . . . . . . . . . . . . $ 2,870.3 $ 3,226.4
The aggregate minimum principal maturities of the long-term debt for each of the five fiscal years followingMay 29, 2011, are as follows:
2012 . . . . . . . . . . . . . . . . . . . . . . . . . . . . . . . . . . . . . . . . . . . . . . . . . . . . . . $ 362.2
2013 . . . . . . . . . . . . . . . . . . . . . . . . . . . . . . . . . . . . . . . . . . . . . . . . . . . . . . 35.3
2014 . . . . . . . . . . . . . . . . . . . . . . . . . . . . . . . . . . . . . . . . . . . . . . . . . . . . . . 506.5
2015 . . . . . . . . . . . . . . . . . . . . . . . . . . . . . . . . . . . . . . . . . . . . . . . . . . . . . . 79.3
2016 . . . . . . . . . . . . . . . . . . . . . . . . . . . . . . . . . . . . . . . . . . . . . . . . . . . . . . 2.8
Lease financing obligations and other indebtedness included $43.5 million and $83.2 million of debt ofconsolidated variable interest entities at May 29, 2011 and May 30, 2010, respectively.
During the second quarter of fiscal 2011, we repaid the entire principal balance of $248.0 million of our7.875% senior notes, which were due September 15, 2010.
During the fourth quarter of fiscal 2009, we issued $500 million of senior notes maturing in 2014 and$500 million of senior notes maturing in 2019.
During fiscal 2009, we retired $357.3 million of 6.75% senior long-term debt due September 2011,$27.6 million of 7.125% senior long-term debt due October 2026, $290.8 million of 6.7% senior long-term debt
56
NOTES TO CONSOLIDATED FINANCIAL STATEMENTS — (Continued)
Fiscal years ended May 29, 2011, May 30, 2010, and May 31, 2009
Columnar Amounts in Millions Except Per Share Amounts

due August 2027, $17.9 million of 7.0% senior long-term debt due October 2028, $252.0 million of 7.875% seniorlong-term debt due September 2010, and $4.1 million of 9.75% senior subordinated long-term debt due March2021, prior to the maturity of the long-term debt, resulting in net charges of $49.2 million.
We consolidate the financial statements of Lamb Weston BSW. In fiscal 2011, we repaid $35.4 million of bankborrowings by our Lamb Weston BSW potato processing venture.
Our most restrictive debt agreements (the revolving credit facility and certain privately placed long-term debt)require that our consolidated funded debt not exceed 65% of our consolidated capital base, and that our fixedcharges coverage ratio be greater than 1.75 to 1.0. At May 29, 2011, we were in compliance with our debt covenants.
Net interest expense consists of:
2011 2010 2009
Long-term debt . . . . . . . . . . . . . . . . . . . . . . . . . . . . . . . $ 231.1 $ 257.7 $ 261.9
Short-term debt. . . . . . . . . . . . . . . . . . . . . . . . . . . . . . . 0.2 0.1 5.4
Interest income . . . . . . . . . . . . . . . . . . . . . . . . . . . . . . . (42.2) (85.2) (78.2)
Interest capitalized . . . . . . . . . . . . . . . . . . . . . . . . . . . . (11.6) (12.2) (3.1)
$ 177.5 $ 160.4 $ 186.0
Interest paid from continuing and discontinued operations was $231.7 million, $244.3 million, and$261.2 million in fiscal 2011, 2010, and 2009, respectively.
Our net interest expense was reduced by $14.5 million and $1.2 million in fiscal 2011 and 2010, respectively,due to the impact of interest rate swap contracts entered into in fiscal 2010. The interest rate swaps effectivelychanged our interest rates on the senior long-term debt instruments maturing in fiscal 2012 and 2014 from fixed tovariable. During fiscal 2011, we terminated the interest rate swap contracts and received proceeds of $31.5 million.The cumulative adjustment to the fair value of the debt instruments being hedged (the effective portion of the hedge)is being amortized as a reduction of interest expense over the remaining lives of the debt instruments (through fiscal2014).
Our net interest expense was increased by $1.0 million and $0.7 million in fiscal 2011 and 2010, respectively,due to the net impact of previously terminated interest rate swap agreements.
13. OTHER NONCURRENT LIABILITIES
Other noncurrent liabilities consisted of:
May 29, 2011 May 30, 2010
Postretirement health care and pension obligations . . . . . . . . . . . . . . . . $ 674.1 $ 790.5
Noncurrent income tax liabilities . . . . . . . . . . . . . . . . . . . . . . . . . . . . . 738.7 509.4
Environmental liabilities (see Note 18) . . . . . . . . . . . . . . . . . . . . . . . . . 70.2 70.6
Other . . . . . . . . . . . . . . . . . . . . . . . . . . . . . . . . . . . . . . . . . . . . . . . . . 287.0 240.4
1,770.0 1,610.9
Less current portion . . . . . . . . . . . . . . . . . . . . . . . . . . . . . . . . . . . . . . . (65.7) (69.6)
$ 1,704.3 $ 1,541.3
57
NOTES TO CONSOLIDATED FINANCIAL STATEMENTS — (Continued)
Fiscal years ended May 29, 2011, May 30, 2010, and May 31, 2009
Columnar Amounts in Millions Except Per Share Amounts

14. CAPITAL STOCK
We have authorized shares of preferred stock as follows:
Class B—$50 par value; 150,000 shares
Class C—$100 par value; 250,000 shares
Class D—without par value; 1,100,000 shares
Class E—without par value; 16,550,000 shares
There were no preferred shares issued or outstanding as of May 29, 2011.
We have repurchased our shares of common stock from time to time after considering market conditions and inaccordance with repurchase limits authorized by our Board of Directors. In February 2010, our Board of Directorsapproved a $500.0 million share repurchase program with no expiration date. Upon receipt of payment for the finaltwo outstanding tranches of the Notes from the purchaser of the trading and merchandising business, during fiscal2011, our Board of Directors increased our share repurchase authorization by the amount of the payment, which was$554.2 million. We repurchased approximately 36.2 million shares of our common stock for approximately$825.0 million and approximately 4.0 million shares of our common stock for approximately $100.0 million infiscal 2011 and 2010, respectively, under this program. We completed an accelerated share repurchase programduring fiscal 2009. We paid $900.0 million and received 44.0 million shares under this program in fiscal 2009.
15. SHARE-BASED PAYMENTS
In accordance with stockholder-approved plans, we issue share-based payments under various stock-basedcompensation arrangements, including stock options, restricted stock units, performance shares, and other share-based awards.
On September 25, 2009, the stockholders approved the ConAgra Foods 2009 Stock Plan, which authorized theissuance of up to 29.5 million shares of ConAgra Foods common stock. At May 29, 2011, approximately27.5 million shares were reserved for granting additional options, restricted stock units, performance shares, orother share-based awards.
Stock Option Plan
We have a stockholder-approved stock option plan that provides for granting of options to employees for thepurchase of common stock at prices equal to the fair value at the date of grant. Options become exercisable undervarious vesting schedules (typically three to five years) and generally expire seven to ten years after the date ofgrant.
The fair value of each option is estimated on the date of grant using a Black-Scholes option-pricing model withthe following weighted average assumptions for stock options granted:
2011 2010 2009
Expected volatility (%) . . . . . . . . . . . . . . . . . . . . . . . . . . . . . . . . . . . 22.83 22.94 18.16
Dividend yield (%) . . . . . . . . . . . . . . . . . . . . . . . . . . . . . . . . . . . . . . 3.51 3.77 3.30
Risk-free interest rates (%) . . . . . . . . . . . . . . . . . . . . . . . . . . . . . . . . 1.72 2.31 3.31
Expected life of stock option (years) . . . . . . . . . . . . . . . . . . . . . . . . . 4.82 4.75 4.67
The expected volatility is based on the historical market volatility of our stock over the expected life of thestock options granted. The expected life represents the period of time that the awards are expected to be outstanding
58
NOTES TO CONSOLIDATED FINANCIAL STATEMENTS — (Continued)
Fiscal years ended May 29, 2011, May 30, 2010, and May 31, 2009
Columnar Amounts in Millions Except Per Share Amounts
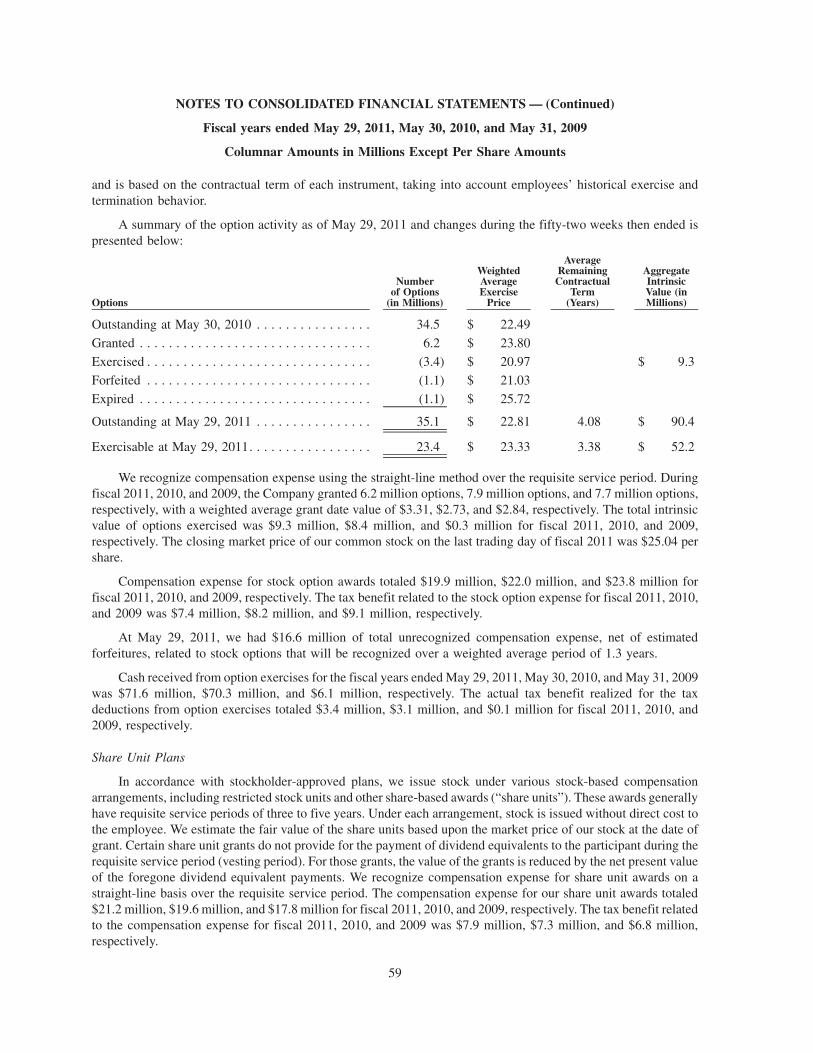
and is based on the contractual term of each instrument, taking into account employees’ historical exercise andtermination behavior.
A summary of the option activity as of May 29, 2011 and changes during the fifty-two weeks then ended ispresented below:
Options
Numberof Options
(in Millions)
WeightedAverageExercise
Price
AverageRemaining
ContractualTerm
(Years)
AggregateIntrinsicValue (inMillions)
Outstanding at May 30, 2010 . . . . . . . . . . . . . . . . 34.5 $ 22.49
Granted . . . . . . . . . . . . . . . . . . . . . . . . . . . . . . . . 6.2 $ 23.80
Exercised . . . . . . . . . . . . . . . . . . . . . . . . . . . . . . . (3.4) $ 20.97 $ 9.3
Forfeited . . . . . . . . . . . . . . . . . . . . . . . . . . . . . . . (1.1) $ 21.03
Expired . . . . . . . . . . . . . . . . . . . . . . . . . . . . . . . . (1.1) $ 25.72
Outstanding at May 29, 2011 . . . . . . . . . . . . . . . . 35.1 $ 22.81 4.08 $ 90.4
Exercisable at May 29, 2011. . . . . . . . . . . . . . . . . 23.4 $ 23.33 3.38 $ 52.2
We recognize compensation expense using the straight-line method over the requisite service period. Duringfiscal 2011, 2010, and 2009, the Company granted 6.2 million options, 7.9 million options, and 7.7 million options,respectively, with a weighted average grant date value of $3.31, $2.73, and $2.84, respectively. The total intrinsicvalue of options exercised was $9.3 million, $8.4 million, and $0.3 million for fiscal 2011, 2010, and 2009,respectively. The closing market price of our common stock on the last trading day of fiscal 2011 was $25.04 pershare.
Compensation expense for stock option awards totaled $19.9 million, $22.0 million, and $23.8 million forfiscal 2011, 2010, and 2009, respectively. The tax benefit related to the stock option expense for fiscal 2011, 2010,and 2009 was $7.4 million, $8.2 million, and $9.1 million, respectively.
At May 29, 2011, we had $16.6 million of total unrecognized compensation expense, net of estimatedforfeitures, related to stock options that will be recognized over a weighted average period of 1.3 years.
Cash received from option exercises for the fiscal years ended May 29, 2011, May 30, 2010, and May 31, 2009was $71.6 million, $70.3 million, and $6.1 million, respectively. The actual tax benefit realized for the taxdeductions from option exercises totaled $3.4 million, $3.1 million, and $0.1 million for fiscal 2011, 2010, and2009, respectively.
Share Unit Plans
In accordance with stockholder-approved plans, we issue stock under various stock-based compensationarrangements, including restricted stock units and other share-based awards (“share units”). These awards generallyhave requisite service periods of three to five years. Under each arrangement, stock is issued without direct cost tothe employee. We estimate the fair value of the share units based upon the market price of our stock at the date ofgrant. Certain share unit grants do not provide for the payment of dividend equivalents to the participant during therequisite service period (vesting period). For those grants, the value of the grants is reduced by the net present valueof the foregone dividend equivalent payments. We recognize compensation expense for share unit awards on astraight-line basis over the requisite service period. The compensation expense for our share unit awards totaled$21.2 million, $19.6 million, and $17.8 million for fiscal 2011, 2010, and 2009, respectively. The tax benefit relatedto the compensation expense for fiscal 2011, 2010, and 2009 was $7.9 million, $7.3 million, and $6.8 million,respectively.
59
NOTES TO CONSOLIDATED FINANCIAL STATEMENTS — (Continued)
Fiscal years ended May 29, 2011, May 30, 2010, and May 31, 2009
Columnar Amounts in Millions Except Per Share Amounts

The following table summarizes the nonvested share units as of May 29, 2011, and changes during the fifty-two weeks then ended:
Share UnitsShare Units(in millions)
WeightedAverage
Grant-DateFair Value
Nonvested share units at May 30, 2010 . . . . . . . . . . . . . . . . . . . . . . . . 2.58 $ 20.81
Granted . . . . . . . . . . . . . . . . . . . . . . . . . . . . . . . . . . . . . . . . . . . . . . . . 1.57 $ 21.55
Vested/Issued. . . . . . . . . . . . . . . . . . . . . . . . . . . . . . . . . . . . . . . . . . . . (0.59) $ 20.99
Forfeited . . . . . . . . . . . . . . . . . . . . . . . . . . . . . . . . . . . . . . . . . . . . . . . (0.31) $ 19.25
Nonvested share units at May 29, 2011 . . . . . . . . . . . . . . . . . . . . . . . . 3.25 $ 19.56
During fiscal 2011, 2010, and 2009, we granted 1.6 million share units, 1.1 million share units, and 1.0 millionshare units, respectively, with a weighted average grant date value of $21.55, $19.41, and $21.00, respectively.
The total intrinsic value of share units vested was $14.5 million, $18.7 million, and $18.7 million during fiscal2011, 2010, and 2009, respectively.
At May 29, 2011, we had $25.3 million of total unrecognized compensation expense, net of estimatedforfeitures, related to share unit awards that will be recognized over a weighted average period of 2.0 years.
Performance-Based Share Plan
Performance shares are granted to selected executives and other key employees with vesting contingent uponmeeting various Company-wide performance goals. The performance goals are based upon our earnings beforeinterest and taxes and our return on average invested capital measured over a defined performance period. Theawards actually earned will range from zero to three hundred percent of the targeted number of performance sharesfor performance periods ending in fiscal 2011 and fiscal 2012 and will range from zero to two hundred percent of thetargeted number of performance shares for the performance period ending in fiscal 2013. Awards, if earned, will bepaid in shares of common stock. Subject to limited exceptions set forth in the performance share plan, any sharesearned will be distributed at the end of the performance period. The value of the performance shares granted in fiscal2009, 2010, and 2011 was adjusted based upon the market price of our stock at the end of each reporting period andamortized as compensation expense over the vesting period.
A summary of the activity for performance share awards as of May 29, 2011 and changes during the fifty-twoweeks then ended is presented below:
Performance SharesShares
(in Millions)
WeightedAverage
Grant-DateFair Value
Nonvested performance shares at May 30, 2010 . . . . . . . . . . . . . . . . . . 1.39 $ 21.85
Granted . . . . . . . . . . . . . . . . . . . . . . . . . . . . . . . . . . . . . . . . . . . . . . . . 0.51 $ 21.43
Adjustments for performance results attained . . . . . . . . . . . . . . . . . . . . (0.09) $ 26.59
Vested/Issued. . . . . . . . . . . . . . . . . . . . . . . . . . . . . . . . . . . . . . . . . . . . (0.31) $ 26.60
Forfeited . . . . . . . . . . . . . . . . . . . . . . . . . . . . . . . . . . . . . . . . . . . . . . . (0.13) $ 20.93
Nonvested performance shares at May 29, 2011 . . . . . . . . . . . . . . . . . . 1.37 $ 20.42
60
NOTES TO CONSOLIDATED FINANCIAL STATEMENTS — (Continued)
Fiscal years ended May 29, 2011, May 30, 2010, and May 31, 2009
Columnar Amounts in Millions Except Per Share Amounts

The compensation expense for our performance share awards totaled $4.0 million, $14.7 million, and$5.6 million for fiscal 2011, 2010, and 2009, respectively. The tax benefit related to the compensation expensefor fiscal 2011, 2010, and 2009 was $1.5 million, $5.4 million, and $2.1 million, respectively.
The total intrinsic value of share units vested (including shares paid in lieu of dividends) during fiscal 2011,2010, and 2009 was $7.4 million, $24.8 million, and $11.7 million, respectively.
Based on estimates at May 29, 2011, the Company had $7.4 million of total unrecognized compensationexpense, net of estimated forfeitures, related to performance shares that will be recognized over a weighted averageperiod of 2.0 years.
Accounting guidance requires the benefits of tax deductions in excess of recognized compensation expense tobe reported as a financing cash flow, rather than as an operating cash flow in our statements of cash flows. Becausethe tax deductions in fiscal 2010 and 2009 were less than the recognized compensation expenses, our net operatingcash flows increased and our net financing cash flows decreased by approximately $1.5 million and $0.7 million forfiscal 2010 and 2009, respectively. There was no impact on our statement of cash flows for fiscal 2011.
16. PRE-TAX INCOME AND INCOME TAXES
Pre-tax income from continuing operations (including equity method investment earnings) consisted of thefollowing:
2011 2010 2009
United States . . . . . . . . . . . . . . . . . . . . . . . . . . . . . . . . . . . . . $ 1,176.5 $ 1,036.9 $ 868.0
Foreign. . . . . . . . . . . . . . . . . . . . . . . . . . . . . . . . . . . . . . . . . . 74.8 66.6 64.3
$ 1,251.3 $ 1,103.5 $ 932.3
The provision for income taxes included the following:
2011 2010 2009
Current
Federal . . . . . . . . . . . . . . . . . . . . . . . . . . . . . . . . . . . . . . . . $ 157.3 $ 259.0 $ 111.8
State . . . . . . . . . . . . . . . . . . . . . . . . . . . . . . . . . . . . . . . . . . 21.0 27.5 15.1
Foreign . . . . . . . . . . . . . . . . . . . . . . . . . . . . . . . . . . . . . . . . 11.9 14.4 19.3
190.2 300.9 146.2
Deferred
Federal . . . . . . . . . . . . . . . . . . . . . . . . . . . . . . . . . . . . . . . . 218.7 51.9 150.3
State . . . . . . . . . . . . . . . . . . . . . . . . . . . . . . . . . . . . . . . . . . 9.7 1.7 26.2
Foreign . . . . . . . . . . . . . . . . . . . . . . . . . . . . . . . . . . . . . . . . 2.4 6.4 (5.6)
230.8 60.0 170.9
$ 421.0 $ 360.9 $ 317.1
61
NOTES TO CONSOLIDATED FINANCIAL STATEMENTS — (Continued)
Fiscal years ended May 29, 2011, May 30, 2010, and May 31, 2009
Columnar Amounts in Millions Except Per Share Amounts

Income taxes computed by applying the U.S. Federal statutory rates to income from continuing operationsbefore income taxes are reconciled to the provision for income taxes set forth in the consolidated statements ofearnings as follows:
2011 2010 2009
Computed U.S. Federal income taxes . . . . . . . . . . . . . . . . . . . $ 437.7 $ 386.2 $ 326.4
State income taxes, net of U.S. Federal tax impact . . . . . . . . . . 20.0 21.0 26.7
Tax credits and domestic manufacturing deduction . . . . . . . . . . (27.5) (27.3) (26.0)
Foreign tax credits and related items, net . . . . . . . . . . . . . . . . . (0.2) (4.3) (1.2)
IRS audit adjustments and settlements . . . . . . . . . . . . . . . . . . . 0.5 (17.4) 3.2
Other . . . . . . . . . . . . . . . . . . . . . . . . . . . . . . . . . . . . . . . . . . . (9.5) 2.7 (12.0)
$ 421.0 $ 360.9 $ 317.1
Income taxes paid, net of refunds, were $172.3 million, $290.5 million, and $512.6 million in fiscal 2011,2010, and 2009, respectively.
The tax effect of temporary differences and carryforwards that give rise to significant portions of deferred taxassets and liabilities consisted of the following:
Assets Liabilities Assets Liabilities2011 2010
Property, plant and equipment . . . . . . . . . . . . . . . . $ — $ 452.3 $ — $ 321.1
Goodwill, trademarks and other intangible assets . . — 610.9 — 575.7
Accrued expenses . . . . . . . . . . . . . . . . . . . . . . . . . 15.9 — 21.5 —
Compensation related liabilities . . . . . . . . . . . . . . 66.2 — 68.4 —
Pension and other postretirement benefits . . . . . . . 230.9 — 309.2 —
Other liabilities that will give rise to future taxdeductions . . . . . . . . . . . . . . . . . . . . . . . . . . . . 121.5 — 126.0 —
Long-term debt . . . . . . . . . . . . . . . . . . . . . . . . . . — 2.9 — 7.9
Foreign tax credit carryforwards . . . . . . . . . . . . . . 0.2 — 4.1 —
Net operating loss carryforwards . . . . . . . . . . . . . . 52.1 — 46.5 —
Other . . . . . . . . . . . . . . . . . . . . . . . . . . . . . . . . . . 29.4 — 22.5 —
516.2 1,066.1 598.2 904.7
Less: Valuation allowance . . . . . . . . . . . . . . . (50.8) — (48.7) —
Net deferred taxes . . . . . . . . . . . . . . . . . $ 465.4 $ 1,066.1 $ 549.5 $ 904.7
At May 29, 2011 and May 30, 2010, net deferred tax assets of $93.4 million and $110.8 million, respectively,are included in prepaid expenses and other current assets. At May 29, 2011 and May 30, 2010, net deferred taxliabilities of $694.1 million and $466.0 million, respectively, are included in other noncurrent liabilities.
The liability for gross unrecognized tax benefits at May 29, 2011 was $56.5 million, excluding a relatedliability of $14.7 million for gross interest and penalties. Included in the balance at May 29, 2011 was $3.3 millionof tax positions for which the ultimate deductibility is highly certain but for which there is uncertainty about thetiming of such deductibility. Because of the impact of deferred tax accounting, the disallowance of the shorterdeductibility period would not affect the annual effective tax rate but would accelerate the payment of cash to thetaxing authority to an earlier period. Any associated interest and penalties imposed would affect the tax rate. As of
62
NOTES TO CONSOLIDATED FINANCIAL STATEMENTS — (Continued)
Fiscal years ended May 29, 2011, May 30, 2010, and May 31, 2009
Columnar Amounts in Millions Except Per Share Amounts

May 30, 2010, our gross liability for unrecognized tax benefits was $53.4 million, excluding a related liability of$14.8 million for gross interest and penalties.
The net amount of unrecognized tax benefits at May 29, 2011 and May 30, 2010 that, if recognized, wouldfavorably impact our effective tax rate was $35.7 million and $32.6 million, respectively.
We accrue interest and penalties associated with uncertain tax positions as part of income tax expense.
We conduct business and file tax returns in numerous countries, states, and local jurisdictions. The U.S. InternalRevenue Service (“IRS”) has completed its audit for tax years through fiscal 2009 and all resulting significant itemsfor fiscal 2009 and prior years have been settled with the IRS. Other major jurisdictions where we conduct businessgenerally have statutes of limitations ranging from 3 to 5 years.
We estimate that it is reasonably possible that the amount of gross unrecognized tax benefits will decrease by$0 to $5 million over the next twelve months due to various federal, state, and foreign audit settlements and theexpiration of statutes of limitations.
The change in the unrecognized tax benefits for the year ended May 29, 2011 was:
Beginning balance on May 30, 2010 . . . . . . . . . . . . . . . . . . . . . . . . . . . . . . . . . . . . . . . . . . . . $ 53.4Increases from positions established during prior periods . . . . . . . . . . . . . . . . . . . . . . . . . . . . . 4.9Decreases from positions established during prior periods . . . . . . . . . . . . . . . . . . . . . . . . . . . . . (2.8)Increases from positions established during the current period. . . . . . . . . . . . . . . . . . . . . . . . . . 6.3Decreases relating to settlements with taxing authorities . . . . . . . . . . . . . . . . . . . . . . . . . . . . . . (3.1)Reductions resulting from lapse of applicable statute of limitation . . . . . . . . . . . . . . . . . . . . . . (2.2)
Ending balance on May 29, 2011. . . . . . . . . . . . . . . . . . . . . . . . . . . . . . . . . . . . . . . . . . . . . . . $ 56.5
We have approximately $68.7 million of foreign net operating loss carryforwards ($23.8 million expirebetween fiscal 2012 and 2022 and $44.9 million have no expiration dates). Substantially all of our foreign taxcredits will expire between fiscal 2016 and 2020. State tax credits of approximately $15.1 million expire in variousyears ranging from fiscal 2013 to 2017.
We have recognized a valuation allowance for the portion of the net operating loss carryforwards, tax creditcarryforwards, and other deferred tax assets we believe are not more likely than not to be realized. The net impact onincome tax expense related to changes in the valuation allowance for fiscal 2011 was a charge of $2.1 million. Forfiscal 2010 and 2009, changes in the valuation allowance were a benefit of $4.6 million and a charge of $3.8 million,respectively. The current year change principally relates to increases to the valuation allowances for foreign netoperating losses, offset by decreases related to state net operating losses and credits.
We have not provided U.S. deferred taxes on cumulative earnings of non-U.S. affiliates and associatedcompanies that the Company considers to be reinvested indefinitely. It is not practicable to estimate the amount ofU.S. income taxes that would be incurred in the event that we were to repatriate the cumulative earnings ofnon-U.S. affiliates and associated companies. Deferred taxes are provided for earnings of non-U.S. affiliates andassociated companies when we determine that such earnings are no longer indefinitely reinvested.
17. OPERATING LEASES
We lease certain facilities, land, and transportation equipment under agreements that expire at various dates.Rent expense under all operating leases from continuing operations was $126.1 million, $127.2 million, and$134.3 million in fiscal 2011, 2010, and 2009, respectively. Rent expense under operating leases from discontinuedoperations was $0.4 million, $3.2 million, and $5.9 million in fiscal 2011, 2010, and 2009, respectively.
63
NOTES TO CONSOLIDATED FINANCIAL STATEMENTS — (Continued)
Fiscal years ended May 29, 2011, May 30, 2010, and May 31, 2009
Columnar Amounts in Millions Except Per Share Amounts

A summary of noncancelable operating lease commitments for fiscal years following May 29, 2011, was asfollows:
2012 . . . . . . . . . . . . . . . . . . . . . . . . . . . . . . . . . . . . . . . . . . . . . . . . . . . . . . $ 65.52013 . . . . . . . . . . . . . . . . . . . . . . . . . . . . . . . . . . . . . . . . . . . . . . . . . . . . . . 56.2
2014 . . . . . . . . . . . . . . . . . . . . . . . . . . . . . . . . . . . . . . . . . . . . . . . . . . . . . . 46.7
2015 . . . . . . . . . . . . . . . . . . . . . . . . . . . . . . . . . . . . . . . . . . . . . . . . . . . . . . 38.1
2016 . . . . . . . . . . . . . . . . . . . . . . . . . . . . . . . . . . . . . . . . . . . . . . . . . . . . . . 28.5
Later years . . . . . . . . . . . . . . . . . . . . . . . . . . . . . . . . . . . . . . . . . . . . . . . . . 132.0
$ 367.0
During fiscal 2010, we completed the sale of approximately 17,600 acres of farmland to an unrelated buyer andimmediately entered into an agreement with an affiliate of the buyer to lease back the farmland. At that time, wereceived proceeds of $75.0 million in cash, removed the land from our balance sheet, and recorded a deferred gain of$29.7 million (reflected primarily in noncurrent liabilities). The lease agreement has an initial term of ten years andtwo five-year renewal options. This lease is being accounted for as an operating lease and we are recognizing thedeferred gain as a reduction of rent expense over the lease term.
18. CONTINGENCIES
In fiscal 1991, we acquired Beatrice Company (“Beatrice”). As a result of the acquisition and the significantpre-acquisition contingencies of the Beatrice businesses and its former subsidiaries, our consolidated post-acquisition financial statements reflect liabilities associated with the estimated resolution of these contingencies.These include various litigation and environmental proceedings related to businesses divested by Beatrice prior toits acquisition by us. The litigation includes suits against a number of lead paint and pigment manufacturers,including ConAgra Grocery Products and the Company as alleged successors to W. P. Fuller Co., a lead paint andpigment manufacturer owned and operated by Beatrice until 1967. Although decisions favorable to us have beenrendered in Rhode Island, New Jersey, Wisconsin, and Ohio, we remain a defendant in active suits in Illinois andCalifornia. The Illinois suit seeks class-wide relief in the form of medical monitoring for elevated levels of lead inblood. In California, a number of cities and counties have joined in a consolidated action seeking abatement of thealleged public nuisance. We have had successful outcomes in every case decided to date and although exposure inthe remaining cases is unlikely, it is reasonably possible. However, given the range of potential remedies, it is notpossible to estimate this exposure.
The environmental proceedings include litigation and administrative proceedings involving Beatrice’s statusas a potentially responsible party at 37 Superfund, proposed Superfund, or state-equivalent sites; these sites involvelocations previously owned or operated by predecessors of Beatrice that used or produced petroleum, pesticides,fertilizers, dyes, inks, solvents, PCBs, acids, lead, sulfur, tannery wastes, and/or other contaminants. Beatrice haspaid or is in the process of paying its liability share at 34 of these sites. Reserves for these matters have beenestablished based on our best estimate of the undiscounted remediation liabilities, which estimates includeevaluation of investigatory studies, extent of required clean-up, the known volumetric contribution of Beatriceand other potentially responsible parties, and its experience in remediating sites. The reserves for Beatrice-relatedenvironmental matters totaled $68.5 million as of May 29, 2011, a majority of which relates to the Superfund andstate-equivalent sites referenced above. The reserve for Beatrice-related environmental matters reflects a reductionin pre-tax expense of $15.4 million made in the third quarter of fiscal 2010 due to favorable regulatorydevelopments at one of the sites. We expect expenditures for Beatrice-related environmental matters to continuefor up to 19 years.
64
NOTES TO CONSOLIDATED FINANCIAL STATEMENTS — (Continued)
Fiscal years ended May 29, 2011, May 30, 2010, and May 31, 2009
Columnar Amounts in Millions Except Per Share Amounts

In limited situations, we will guarantee an obligation of an unconsolidated entity. At the time in which weinitially provide such a guarantee, we assess the risk of financial exposure to us under these agreements. Weconsider the credit-worthiness of the guaranteed party, the value of any collateral pledged against the relatedobligation, and any other factors that may mitigate our risk. We actively monitor market and entity-specificconditions that may result in a change of our assessment of the risk of loss under these agreements.
We guarantee certain leases and other commercial obligations resulting from the 2002 divestiture of our freshbeef and pork operations. The remaining terms of these arrangements do not exceed five years and the maximumamount of future payments we have guaranteed was $13.5 million as of May 29, 2011.
We have also guaranteed the performance of the divested fresh beef and pork business with respect to a hogpurchase contract. The hog purchase contract requires the divested fresh beef and pork business to purchase aminimum of approximately 1.2 million hogs annually through 2014. The contract stipulates minimum pricecommitments, based in part on market prices, and, in certain circumstances, also includes price adjustments basedon certain inputs. We have not established a liability for any of the fresh beef and pork divestiture-relatedguarantees, as we have determined that the likelihood of our required performance under the guarantees is remote.
We are a party to various potato supply agreements. Under the terms of certain such potato supply agreements,we have guaranteed repayment of short-term bank loans of the potato suppliers, under certain conditions. AtMay 29, 2011, the amount of supplier loans we have effectively guaranteed was $34.4 million. We have notestablished a liability for these guarantees, as we have determined that the likelihood of our required performanceunder the guarantees is remote.
We are a party to a supply agreement with an onion processing company. We have guaranteed repayment of aloan of this supplier, under certain conditions. At May 29, 2011, the term of the loan is 14 years. The amount of ourguaranty was $25 million as of May 29, 2011. In the event of default on this loan by the supplier, we have thecontractual right to purchase the loan from the lender, thereby giving us the rights to the underlying collateral. Wehave not established a liability in connection with this guarantee, as we believe the likelihood of financial exposureto us under this agreement is remote.
Federal income tax credits were generated related to our sweet potato production facility in Delhi, Louisiana.Third parties invested in certain of these income tax credits. We have guaranteed these third parties the face value ofthese income tax credits over their statutory lives, a period of seven years, in the event that the income tax credits arerecaptured or reduced. The face value of the income tax credits was $21.2 million as of May 29, 2011. We believethe likelihood of the recapture or reduction of the income tax credits is remote, and therefore we have notestablished a liability in connection with this guarantee.
We are a party to a number of lawsuits and claims arising out of the operation of our business, includinglawsuits and claims related to the February 2007 recall of our peanut butter products and litigation we initiatedagainst an insurance carrier to recover our settlement expenditures and defense costs. We recognized a charge of$24.8 million during the third quarter of fiscal 2009 in connection with the disputed coverage with this insurancecarrier. During the second quarter of fiscal 2010, a Delaware state court rendered a decision on certain matters in ourclaim for the disputed coverage favorable to the insurance carrier. We appealed this decision and, during the fourthquarter of fiscal 2011, we received a favorable opinion related to our defense costs and the claim for disputedcoverage was remanded to the state court. We continue to vigorously pursue our claim for the disputed coverage. Infiscal 2011, we received formal requests from the U.S. Attorney’s office in Georgia seeking a variety of records andinformation related to the operations of our peanut butter manufacturing facility in Sylvester, Georgia. We believethese requests are related to the previously disclosed June 2007 execution of a search warrant at our facilityfollowing the February 2007 recall of our peanut butter products. The Company is cooperating with officials inregard to the requests.
65
NOTES TO CONSOLIDATED FINANCIAL STATEMENTS — (Continued)
Fiscal years ended May 29, 2011, May 30, 2010, and May 31, 2009
Columnar Amounts in Millions Except Per Share Amounts

In June 2009, an accidental explosion occurred at our manufacturing facility in Garner, North Carolina. Duringthe fourth quarter of fiscal 2011, Jacobs Engineering Group Inc., our engineer and project manager at the site filed adeclaratory judgment action against us seeking indemnity for personal injury claims brought against it as a result ofthe accident. We intend to defend this action vigorously. Any exposure in this case is expected to be limited to theapplicable insurance deductible. See Note 5 for additional information related to this matter.
We are a party to several lawsuits concerning the use of diacetyl, a butter flavoring ingredient that was added toour microwave popcorn until late 2007. The cases are primarily consumer personal injury suits claiming respiratoryillness allegedly due to exposures to vapors from microwaving popcorn. Another case involved a putative classaction contending that our packaging information with respect to diacetyl is false and misleading. Through the dateof this report, we have received a favorable verdict, summary judgment ruling, and two dismissals in connectionwith these suits, and the class action motion in the packaging suit was denied. The verdict and the favorablesummary judgment ruling were appealed and the summary judgment was affirmed in the fourth quarter of fiscal2011. We do not believe these cases possess merit and continue to vigorously defend them. Any exposure in thesecases is expected to be limited to the applicable insurance deductible.
After taking into account liabilities recognized for all of the foregoing matters, management believes theultimate resolution of such matters should not have a material adverse effect on our financial condition, results ofoperations, or liquidity. It is reasonably possible that a change in one of the estimates of the foregoing matters mayoccur in the future. Costs of legal services associated with the foregoing matters are recognized in earnings asservices are provided.
19. DERIVATIVE FINANCIAL INSTRUMENTS
Our operations are exposed to market risks from adverse changes in commodity prices affecting the cost of rawmaterials and energy, foreign currency exchange rates, and interest rates. In the normal course of business, theserisks are managed through a variety of strategies, including the use of derivatives.
Commodity futures and options contracts are used from time to time to economically hedge commodity inputprices on items such as natural gas, vegetable oils, proteins, dairy, grains, and electricity. Generally, we econom-ically hedge a portion of our anticipated consumption of commodity inputs for periods of up to 36 months. We mayenter into longer-term economic hedges on particular commodities, if deemed appropriate. As of May 29, 2011, wehad economically hedged certain portions of our anticipated consumption of commodity inputs using derivativeinstruments with expiration dates through December 2012.
In order to reduce exposures related to changes in foreign currency exchange rates, when deemed prudent, weenter into forward exchange, options, or swap contracts for transactions denominated in a currency other than theapplicable functional currency. This includes, but is not limited to, hedging against foreign currency risk inpurchasing inventory and capital equipment, sales of finished goods, and future settlement of foreign-denominatedassets and liabilities. As of May 29, 2011, we had economically hedged certain portions of our foreign currency riskin anticipated transactions using derivative instruments with expiration dates through May 2017.
From time to time, we may use derivative instruments, including interest rate swaps, to reduce risk related tochanges in interest rates. This includes, but is not limited to, hedging against increasing interest rates prior to theissuance of long-term debt and hedging the fair value of our senior long-term debt.
Derivatives Designated as Cash Flow Hedges
During fiscal 2011, we entered into interest rate swap contracts to hedge the interest rate risk related to ourforecasted issuance of long-term debt in 2014 (based on the anticipated refinancing of the senior long-term debtmaturing at that time). We designated these interest rate swaps as cash flow hedges of the forecasted interest
66
NOTES TO CONSOLIDATED FINANCIAL STATEMENTS — (Continued)
Fiscal years ended May 29, 2011, May 30, 2010, and May 31, 2009
Columnar Amounts in Millions Except Per Share Amounts

payments related to this debt issuance. The unrealized loss associated with these derivatives, which is deferred inaccumulated other comprehensive loss at May 29, 2011, was $11.8 million.
The net notional amount of these interest rate derivatives at May 29, 2011 was $250.0 million.
Hedge ineffectiveness for cash flow hedges may impact net earnings when a change in the value of a hedgedoes not offset the change in the value of the underlying hedged item. Depending on the nature of the hedge,ineffectiveness is recognized within cost of goods sold or selling, general and administrative expense. We do notexclude any component of the hedging instrument’s gain or loss when assessing ineffectiveness. The ineffectivenessassociated with derivatives designated as cash flow hedges from continuing operations was not material to ourresults of operations in any period presented.
Derivatives Designated as Fair Value Hedges
During the fourth quarter of fiscal 2010, we entered into interest rate swap contracts to hedge the fair value ofcertain of our senior long-term debt instruments maturing in fiscal 2012 and 2014. We designated these interest rateswap contracts as fair value hedges of the debt instruments.
Changes in fair value of the derivative instruments are immediately recognized in earnings along with changesin the fair value of the items being hedged (based solely on the change in the benchmark interest rate). These gainsand losses are classified within selling, general and administrative expenses. In fiscal 2011 and 2010, we recognizeda net gain of $23.0 million and $8.5 million, respectively, on the interest rate swap contracts and a loss of$29.7 million and $5.1 million, respectively, on the senior long-term debt. The notional amount of the interest ratederivatives outstanding at May 30, 2010 was $842.7 million.
We terminated the interest rate swap contracts during fiscal 2011. As a result of this termination, we receivedproceeds of $31.5 million. The cumulative adjustment to the fair value of the debt instruments being hedged,$34.8 million, is included in long-term debt and is being amortized as a reduction of interest expense over theremaining lives of the debt instruments (through fiscal 2014). At the end of fiscal 2011, the unamortized amount was$27.6 million.
The entire change in fair value of the derivative instruments was included in our assessment of hedgeeffectiveness.
Economic Hedges of Forecasted Cash Flows
Many of our derivatives do not qualify for, and we do not currently designate certain commodity or foreigncurrency derivatives to achieve, hedge accounting treatment. We reflect realized and unrealized gains and lossesfrom derivatives used to economically hedge anticipated commodity consumption and to mitigate foreign currencycash flow risk in earnings immediately within general corporate expense (within cost of goods sold). The gains andlosses are reclassified to segment operating results in the period in which the underlying item being economicallyhedged is recognized in cost of goods sold.
Economic Hedges of Fair Values—Foreign Currency Exchange Rate Risk
We may use options and cross currency swaps to economically hedge the fair value of certain monetary assetsand liabilities (including intercompany balances) denominated in a currency other than the functional currency.These derivatives are marked-to-market with gains and losses immediately recognized in selling, general andadministrative expenses. These substantially offset the foreign currency transaction gains or losses recognized onthe monetary assets or liabilities being economically hedged.
67
NOTES TO CONSOLIDATED FINANCIAL STATEMENTS — (Continued)
Fiscal years ended May 29, 2011, May 30, 2010, and May 31, 2009
Columnar Amounts in Millions Except Per Share Amounts

Derivative Activity in Our Milling Operations
We also use derivative instruments within our milling operations, which are part of the Commercial Foodssegment. Derivative instruments used to economically hedge commodity inventories and forward purchase andsales contracts within the milling operations are marked-to-market such that realized and unrealized gains andlosses are immediately included in operating results. The underlying inventory and forward contracts being hedgedare also marked-to-market with changes in market value recognized immediately in operating results.
For commodity derivative trading activities within our milling operations that are not intended to mitigatecommodity input cost risk, the derivative instrument is marked-to-market each period with gains and lossesincluded in net sales of the Commercial Foods segment. There were no material gains or losses from derivativetrading activities in fiscal 2011, 2010, or 2009.
All derivative instruments are recognized on the balance sheet at fair value. The fair value of derivative assets isrecognized within prepaid expenses and other current assets, while the fair value of derivative liabilities isrecognized within other accrued liabilities. In accordance with FASB guidance, we offset certain derivative assetand liability balances, as well as certain amounts representing rights to reclaim cash collateral and obligations toreturn cash collateral, where legal right of setoff exists. Amounts representing a right to reclaim cash collateral of$7.8 million and $8.6 million were included in prepaid expenses and other current assets in our consolidated balancesheets at May 29, 2011 and May 30, 2010, respectively.
Derivative assets and liabilities and amounts representing a right to reclaim cash collateral are reflected in ourbalance sheets as follows:
May 29,2011
May 30,2010
Prepaid expenses and other current assets . . . . . . . . . . . . . . . . . . . . . . . $ 71.5 $ 61.8
Other accrued liabilities . . . . . . . . . . . . . . . . . . . . . . . . . . . . . . . . . . . . 92.2 10.1
The following table presents our derivative assets and liabilities, on a gross basis, prior to the offsetting ofamounts where legal right of setoff exists at May 29, 2011:
Balance Sheet Location Fair Value Balance Sheet Location Fair ValueDerivative Assets Derivative Liabilities
Interest rate contracts Prepaid expenses and othercurrent assets
$ — Other accrued liabilities $ 11.8
Total derivatives designatedas hedging instruments $ — $ 11.8
Commodity contracts Prepaid expenses and othercurrent assets
$ 85.4 Other accrued liabilities $ 84.4
Foreign exchange contracts Prepaid expenses and othercurrent assets
1.0 Other accrued liabilities 19.2
Other Prepaid expenses and othercurrent assets
0.7 Other accrued liabilities 0.2
Total derivatives notdesignated as hedginginstruments $ 87.1 $ 103.8
Total derivatives $ 87.1 $ 115.6
68
NOTES TO CONSOLIDATED FINANCIAL STATEMENTS — (Continued)
Fiscal years ended May 29, 2011, May 30, 2010, and May 31, 2009
Columnar Amounts in Millions Except Per Share Amounts

The following table presents our derivative assets and liabilities, on a gross basis, prior to the offsetting ofamounts where legal right of setoff exists at May 30, 2010:
Balance Sheet Location Fair Value Balance Sheet Location Fair ValueDerivative Assets Derivative Liabilities
Interest rate contracts Prepaid expenses and othercurrent assets
$ 8.5 Other accrued liabilities $ —
Total derivatives designatedas hedging instruments $ 8.5 $ —
Commodity contracts Prepaid expenses and othercurrent assets
$ 48.7 Other accrued liabilities $ 20.0
Foreign exchange contracts Prepaid expenses and othercurrent assets
8.1 Other accrued liabilities 1.3
Other Prepaid expenses and othercurrent assets
— Other accrued liabilities 0.9
Total derivatives notdesignated as hedginginstruments $ 56.8 $ 22.2
Total derivatives $ 65.3 $ 22.2
The location and amount of gains (losses) from derivatives not designated as hedging instruments in ourstatements of earnings were as follows:
Derivatives Not Designated as HedgingInstruments
Location in Consolidated Statement ofEarnings of Gain (loss) Recognized on Derivatives
Amount of Gain (loss)Recognized on Derivatives in
Consolidated Statement ofEarnings
For the Fiscal Year Ended May 29, 2011
Commodity contracts Cost of goods sold $ 58.1
Foreign exchange contracts Cost of goods sold (20.2)
Commodity contracts Selling, general and administrative expense 2.1
Foreign exchange contracts Selling, general and administrative expense (7.9)
Total gain from derivativeinstruments not designated ashedging instruments $ 32.1
Derivatives Not Designated as HedgingInstruments
Location in Consolidated Statement ofEarnings of Gain (loss) Recognized on Derivatives
Amount of Gain (loss)Recognized on Derivatives in
Consolidated Statement ofEarnings
For the Fiscal Year Ended May 30, 2010
Commodity contracts Cost of goods sold $ 149.0
Foreign exchange contracts Cost of goods sold 0.5
Other Selling, general and administrative expense 2.6
Total gain from derivativeinstruments not designated ashedging instruments $ 152.1
69
NOTES TO CONSOLIDATED FINANCIAL STATEMENTS — (Continued)
Fiscal years ended May 29, 2011, May 30, 2010, and May 31, 2009
Columnar Amounts in Millions Except Per Share Amounts

Derivatives Not Designated as HedgingInstruments
Location in Consolidated Statement ofEarnings of Gain (loss) Recognized on Derivatives
Amount of Gain (loss)Recognized on Derivatives in
Consolidated Statement ofEarnings
For the Fiscal Year Ended May 31, 2009
Commodity contracts Cost of goods sold $ 98.1
Foreign exchange contracts Cost of goods sold 4.2
Other Selling, general and administrative expense (0.4)
Total gain from derivativeinstruments not designated ashedging instruments $ 101.9
As of May 29, 2011, our open commodity contracts had a notional value (defined as notional quantity timesmarket value per notional quantity unit) of $1.0 billion and $1.2 billion for purchase and sales contracts,respectively. As of May 30, 2010, our open commodity contracts had a notional value of $563.7 million and$577.1 million for purchase and sales contracts, respectively. The notional amount of our foreign currency forwardand cross currency swap contracts as of May 29, 2011 and May 30, 2010 was $292.7 million and $240.0 million,respectively. In addition, we held foreign currency option collar contracts with notional amounts of $86.4 millionand $97.2 million as of May 29, 2011 and May 30, 2010, respectively.
We enter into certain commodity, interest rate, and foreign exchange derivatives with a diversified group ofcounterparties. We continually monitor our positions and the credit ratings of the counterparties involved and limitthe amount of credit exposure to any one party. These transactions may expose us to potential losses due to the riskof nonperformance by these counterparties. We have not incurred a material loss and do not expect to incur any suchmaterial losses. We also enter into futures and options transactions through various regulated exchanges.
At May 29, 2011, the maximum amount of loss due to the credit risk of the counterparties, had thecounterparties failed to perform according to the terms of the contracts, was $55.2 million.
20. PENSION AND POSTRETIREMENT BENEFITS
The Company and its subsidiaries have defined benefit retirement plans (“plans”) for eligible salaried andhourly employees. Benefits are based on years of credited service and average compensation or stated amounts foreach year of service. We also sponsor postretirement plans which provide certain medical and dental benefits(“other benefits”) to qualifying U.S. employees.
We recognize the funded status of our plans in the consolidated balance sheets. We also recognize as acomponent of accumulated other comprehensive loss, the net of tax results of the gains or losses and prior servicecosts or credits that arise during the period but are not recognized in net periodic benefit cost. These amounts will beadjusted out of accumulated other comprehensive income (loss) as they are subsequently recognized as componentsof net periodic benefit cost.
70
NOTES TO CONSOLIDATED FINANCIAL STATEMENTS — (Continued)
Fiscal years ended May 29, 2011, May 30, 2010, and May 31, 2009
Columnar Amounts in Millions Except Per Share Amounts

The changes in benefit obligations and plan assets at May 29, 2011 and May 30, 2010 are presented in thefollowing table.
2011 2010 2011 2010Pension Benefits Other Benefits
Change in Benefit ObligationBenefit obligation at beginning of year . . . . . $ 2,614.1 $ 2,220.4 $ 324.9 $ 288.6
Service cost . . . . . . . . . . . . . . . . . . . . . . . . . 59.7 49.8 0.6 0.5
Interest cost . . . . . . . . . . . . . . . . . . . . . . . . . 147.5 148.1 16.3 18.3
Plan participants’ contributions . . . . . . . . . . . — — 6.9 7.6
Amendments . . . . . . . . . . . . . . . . . . . . . . . . . 1.5 3.0 (9.0) 6.2
Actuarial loss . . . . . . . . . . . . . . . . . . . . . . . . 190.9 331.1 19.4 42.0
Special termination benefits . . . . . . . . . . . . . . 1.3 — — —
Benefits paid. . . . . . . . . . . . . . . . . . . . . . . . . (133.6) (138.3) (36.5) (38.3)
Benefit obligation at end of year . . . . . . $ 2,881.4 $ 2,614.1 $ 322.6 $ 324.9
Change in Plan AssetsFair value of plan assets at beginning of
year . . . . . . . . . . . . . . . . . . . . . . . . . . . . . $ 2,144.6 $ 1,903.2 $ 4.0 $ 8.1
Actual return on plan assets. . . . . . . . . . . . . . 418.3 268.3 — —
Employer contributions . . . . . . . . . . . . . . . . . 129.4 122.6 25.7 26.6
Plan participants’ contributions . . . . . . . . . . . — — 6.9 7.6
Investment and administrative expenses . . . . . (14.8) (11.2) — —
Benefits paid. . . . . . . . . . . . . . . . . . . . . . . . . (133.6) (138.3) (36.5) (38.3)
Fair value of plan assets at end of year . . $ 2,543.9 $ 2,144.6 $ 0.1 $ 4.0
71
NOTES TO CONSOLIDATED FINANCIAL STATEMENTS — (Continued)
Fiscal years ended May 29, 2011, May 30, 2010, and May 31, 2009
Columnar Amounts in Millions Except Per Share Amounts

The funded status and amounts recognized in our consolidated balance sheets at May 29, 2011 and May 30,2010 were:
2011 2010 2011 2010Pension Benefits Other Benefits
Funded status . . . . . . . . . . . . . . . . . . . . . . . . . . . $ (337.5) $ (469.5) $ (322.5) $ (320.9)
Amounts Recognized in Consolidated BalanceSheets
Other assets . . . . . . . . . . . . . . . . . . . . . . . . . . . . . $ 14.7 $ 0.1 $ — $ —
Other accrued liabilities . . . . . . . . . . . . . . . . . . . . (8.7) (8.5) (27.5) (31.1)
Other noncurrent liabilities . . . . . . . . . . . . . . . . . . (343.5) (461.1) (295.0) (289.8)
Net amount recognized . . . . . . . . . . . . . . . . $ (337.5) $ (469.5) $ (322.5) $ (320.9)
Amounts Recognized in Accumulated OtherComprehensive (Income) Loss (Pre-tax)
Actuarial net loss . . . . . . . . . . . . . . . . . . . . . . . . . $ 417.6 $ 473.5 $ 75.6 $ 61.3
Net prior service cost (benefit) . . . . . . . . . . . . . . . 15.7 17.4 (12.2) (12.7)
Total . . . . . . . . . . . . . . . . . . . . . . . . . . . . . . $ 433.3 $ 490.9 $ 63.4 $ 48.6
Weighted-Average Actuarial Assumptions Usedto Determine Benefit Obligations At May 29,2011 and May 30, 2010
Discount rate . . . . . . . . . . . . . . . . . . . . . . . . . . . . 5.30% 5.80% 4.90% 5.40%
Long-term rate of compensation increase . . . . . . . 4.25% 4.25% N/A N/A
The accumulated benefit obligation for all defined benefit pension plans was $2.8 billion and $2.5 billion atMay 29, 2011 and May 30, 2010, respectively.
The projected benefit obligation, accumulated benefit obligation, and fair value of plan assets for pension planswith accumulated benefit obligations in excess of plan assets at May 29, 2011 and May 30, 2010 were:
2011 2010
Projected benefit obligation . . . . . . . . . . . . . . . . . . . . . . . . . . . . . $ 2,505.6 $ 2,611.9
Accumulated benefit obligation . . . . . . . . . . . . . . . . . . . . . . . . . . 2,436.1 2,530.9
Fair value of plan assets . . . . . . . . . . . . . . . . . . . . . . . . . . . . . . . 2,153.4 2,142.3
72
NOTES TO CONSOLIDATED FINANCIAL STATEMENTS — (Continued)
Fiscal years ended May 29, 2011, May 30, 2010, and May 31, 2009
Columnar Amounts in Millions Except Per Share Amounts

Components of pension benefit and other postretirement benefit costs were:
2011 2010 2009 2011 2010 2009Pension Benefits Other Benefits
Service cost . . . . . . . . . . . . . . . . . . $ 59.7 $ 49.8 $ 50.7 $ 0.6 $ 0.5 $ 0.8
Interest cost . . . . . . . . . . . . . . . . . . 147.5 148.1 141.2 16.3 18.3 20.6
Expected return on plan assets. . . . . (173.0) (161.2) (158.7) (0.1) (0.3) (0.2)
Amortization of prior service cost(benefit) . . . . . . . . . . . . . . . . . . . 3.2 3.2 3.0 (9.6) (9.4) (11.2)
Settlement loss . . . . . . . . . . . . . . . . — 1.9 — — — —
Special termination benefits . . . . . . 1.3 — — — — —
Recognized net actuarial (gain)loss. . . . . . . . . . . . . . . . . . . . . . . 16.4 3.9 2.1 4.6 (0.1) 4.8
Curtailment loss . . . . . . . . . . . . . . . — 0.9 — — — —
Benefit cost—Company plans . . . . . 55.1 46.6 38.3 11.8 9.0 14.8
Pension benefit cost—multi-employer plans . . . . . . . . . . . . . . 9.2 9.7 8.6 — — —
Total benefit cost . . . . . . . . . . . $ 64.3 $ 56.3 $ 46.9 $ 11.8 $ 9.0 $ 14.8
Other changes in plan assets and benefit obligations recognized in other comprehensive (income) loss were:
2011 2010 2011 2010Pension Benefits Other Benefits
Net actuarial (gain) loss . . . . . . . . . . . . . . . . . . . . $ (39.5) $ 235.2 $ 18.9 $ 41.9
Prior service cost (benefit) . . . . . . . . . . . . . . . . . . 1.5 3.0 (9.1) 6.2Amortization of prior service (cost) benefit . . . . . . (3.2) (4.1) 9.6 9.4
Recognized net actuarial gain (loss) and settlementloss . . . . . . . . . . . . . . . . . . . . . . . . . . . . . . . . . (16.4) (5.8) (4.6) 0.1
Net amount recognized . . . . . . . . . . . . . . . . . $ (57.6) $ 228.3 $ 14.8 $ 57.6
Weighted-Average Actuarial AssumptionsUsed to Determine Net Expense
2011 2010 2009 2011 2010 2009Pension Benefits Other Benefits
Discount rate . . . . . . . . . . . . . . . . . . . . . . 5.80% 6.90% 6.60% 5.40% 6.60% 6.40%
Long-term rate of return on plan assets . . . 7.75% 7.75% 7.75% 3.50% 4.50% 4.50%
Long-term rate of compensationincrease . . . . . . . . . . . . . . . . . . . . . . . . 4.25% 4.25% 4.25% N/A N/A N/A
We amortize prior service cost and amortizable gains and losses in equal annual amounts over the averageexpected future period of vested service. For plans with no active participants, average life expectancy is usedinstead of average expected useful service.
73
NOTES TO CONSOLIDATED FINANCIAL STATEMENTS — (Continued)
Fiscal years ended May 29, 2011, May 30, 2010, and May 31, 2009
Columnar Amounts in Millions Except Per Share Amounts

The amounts in accumulated other comprehensive income (loss) expected to be recognized as components ofnet expense during the next year are as follows:
Pension Benefits Other Benefits
Prior service cost (benefit) . . . . . . . . . . . . . . . . . . . . . . . . . . . . . . $ 3.1 $ (8.7)
Net actuarial loss . . . . . . . . . . . . . . . . . . . . . . . . . . . . . . . . . . . . . 38.2 6.0
Plan Assets
The fair value of Plan assets, summarized by level within the fair value hierarchy described in Note 21, as ofMay 29, 2011, are as follows:
Level 1 Level 2 Level 3 Total
Cash and cash equivalents . . . . . . . . . . . . . . . . . . $ 2.7 $ 121.5 $ — $ 124.2
Equity securities:
U.S. equity securities . . . . . . . . . . . . . . . . . . 625.7 7.7 — 633.4
International equity securities . . . . . . . . . . . . 473.1 131.5 — 604.6
Fixed income securities:
Government bonds . . . . . . . . . . . . . . . . . . . . 53.4 155.1 — 208.5
Corporate bonds . . . . . . . . . . . . . . . . . . . . . . 103.5 169.5 — 273.0
Mortgage-backed bonds. . . . . . . . . . . . . . . . . 31.5 58.9 — 90.4
Real Estate. . . . . . . . . . . . . . . . . . . . . . . . . . . . . . 7.8 — 70.3 78.1
Multi-strategy hedge funds . . . . . . . . . . . . . . . . . . — — 346.0 346.0
Private equity . . . . . . . . . . . . . . . . . . . . . . . . . . . . — — 56.0 56.0
Master limited partnerships . . . . . . . . . . . . . . . . . . 125.2 — — 125.2
Net receivables for unsettled transactions . . . . . . . 4.5 — — 4.5
Total assets . . . . . . . . . . . . . . . . . . . . . . . . . . . . $ 1,427.4 $ 644.2 $ 472.3 $ 2,543.9
74
NOTES TO CONSOLIDATED FINANCIAL STATEMENTS — (Continued)
Fiscal years ended May 29, 2011, May 30, 2010, and May 31, 2009
Columnar Amounts in Millions Except Per Share Amounts

The fair value of Plan assets, summarized by level within the fair value hierarchy described in Note 21, as ofMay 30, 2010, are as follows:
Level 1 Level 2 Level 3 Total
Cash and cash equivalents . . . . . . . . . . . . . . . . . . $ 5.0 $ 275.5 $ — $ 280.5
Equity securities:
U.S. equity securities . . . . . . . . . . . . . . . . . . 537.2 42.1 — 579.3
International equity securities . . . . . . . . . . . . 366.9 40.3 — 407.2
Fixed income securities:
Government bonds . . . . . . . . . . . . . . . . . . . . 160.4 160.2 — 320.6
Corporate bonds . . . . . . . . . . . . . . . . . . . . . . 38.4 207.3 — 245.7
Mortgage-backed bonds. . . . . . . . . . . . . . . . . 32.3 67.6 — 99.9
Real Estate. . . . . . . . . . . . . . . . . . . . . . . . . . . . . . 3.0 — 61.4 64.4Multi-strategy hedge funds . . . . . . . . . . . . . . . . . . — — 22.1 22.1
Private equity . . . . . . . . . . . . . . . . . . . . . . . . . . . . — — 39.1 39.1
Master limited partnerships . . . . . . . . . . . . . . . . . . 49.2 — — 49.2
Contracts with insurance companies . . . . . . . . . . . — — 31.2 31.2
Net receivables for unsettled transactions . . . . . . . 5.4 — — 5.4
Total assets . . . . . . . . . . . . . . . . . . . . . . . . . . . . $ 1,197.8 $ 793.0 $ 153.8 $ 2,144.6
Level 1 assets are valued based on quoted prices in active markets for identical securities. The majority of theLevel 1 assets listed above include the common stock of both U.S. and international companies, master limitedpartnership units, and real estate investment trusts, all of which are actively traded and priced in the market. Level 2assets are valued based on other significant observable inputs including quoted prices for similar securities, yieldcurves, indices, etc. The Level 2 assets listed above consist primarily of commingled equity investments wherevalues are based on the net asset value of the underlying investments held, individual fixed income securities wherevalues are based on quoted prices of similar securities and observable market data, and commingled fixed incomeinvestments where values are based on the net asset value of the underlying investments held. Level 3 assets arethose where the fair value is determined based on unobservable inputs. The Level 3 assets listed above consist ofalternative investments where active market pricing is not readily available and, as such, we use net asset values asan estimate of fair value as a practical expedient. For Real Estate, the value is based on the net asset value providedby the investment manager who uses market data and independent third party appraisals to determine fair marketvalue. For the Multi-Strategy Hedge Funds, the value is based on the net asset values provided by a third partyadministrator. For Private Equity, the investment manager provides the valuation using, among other things,comparable transactions, comparable public company data, discounted cash flow analysis, and market conditions.The valuations on the contracts with insurance companies are provided by third party administrators who use theterms of the contract along with available market data to determine the fair market value.
Level 3 investments are generally considered long-term in nature with varying redemption availability. Certainof our Level 3 investments, with a fair value of approximately $407.8 million as of May 29, 2011, have imposedcustomary redemption gates which may further restrict or limit the redemption of invested funds therein.
As of May 29, 2011, we have unfunded commitments for additional investments in the Private Equity fundstotaling approximately $37 million. We expect unfunded commitments to be funded from plan assets rather than thegeneral assets of the Company.
75
NOTES TO CONSOLIDATED FINANCIAL STATEMENTS — (Continued)
Fiscal years ended May 29, 2011, May 30, 2010, and May 31, 2009
Columnar Amounts in Millions Except Per Share Amounts

To develop the expected long-term rate of return on plan assets assumption for the pension plans, we considerthe current asset allocation strategy, the historical investment performance, and the expectations for future returns ofeach asset class.
Our pension plan weighted-average asset allocations and our target asset allocations at May 29, 2011 andMay 30, 2010, by asset category were as follows:
May 29,2011
May 30,2010
TargetAllocation
Equity Securities . . . . . . . . . . . . . . . . . . . . . . . . . . . . . . . . . . . . . 49% 46% 42%
Debt Securities . . . . . . . . . . . . . . . . . . . . . . . . . . . . . . . . . . . . . . 22% 31% 28%
Real Estate . . . . . . . . . . . . . . . . . . . . . . . . . . . . . . . . . . . . . . . . . 3% 3% 8%
Multi-strategy Hedge Funds . . . . . . . . . . . . . . . . . . . . . . . . . . . . . 14% 1% 5%
Private Equity . . . . . . . . . . . . . . . . . . . . . . . . . . . . . . . . . . . . . . . 2% 2% 10%
Other . . . . . . . . . . . . . . . . . . . . . . . . . . . . . . . . . . . . . . . . . . . . . 10% 17% 7%
Total . . . . . . . . . . . . . . . . . . . . . . . . . . . . . . . . . . . . . . . . . . 100% 100%
The Company’s investment strategy reflects the expectation that equity securities will outperform debtsecurities over the long term. Assets are invested in a prudent manner to maintain the security of funds whilemaximizing returns within the Company’s Investment Policy guidelines. The strategy is implemented utilizingindexed and actively managed assets from the categories listed.
The investment goals are to provide a total return that, over the long term, increases the ratio of plan assets toliabilities subject to an acceptable level of risk. This is accomplished through diversification of assets in accordancewith the Investment Policy guidelines. Investment risk is mitigated by periodic rebalancing between asset classes asnecessitated by changes in market conditions within the Investment Policy guidelines.
Other investments are primarily made up of cash, hedge funds, private equity, master limited partnerships, andcontracts with insurance companies.
Level 3 Gains and Losses
The change in the fair value of the Plan’s Level 3 assets is summarized as follows:
Fair ValueMay 30,
2010
Net Realizedand UnrealizedGains (Losses)
Net,Purchasesand Sales
Fair ValueMay 29,
2011
Real Estate . . . . . . . . . . . . . . . . . $ 61.4 $ 7.5 $ 1.4 $ 70.3
Multi-strategy hedge funds . . . . . . 22.1 34.1 289.8 346.0
Private equity . . . . . . . . . . . . . . . 39.1 8.1 8.8 56.0
Contracts with insurancecompanies . . . . . . . . . . . . . . . . 31.2 (2.4) (28.8) —
Total . . . . . . . . . . . . . . . . . . . . . . . . . $ 153.8 $ 47.3 $ 271.2 $ 472.3
76
NOTES TO CONSOLIDATED FINANCIAL STATEMENTS — (Continued)
Fiscal years ended May 29, 2011, May 30, 2010, and May 31, 2009
Columnar Amounts in Millions Except Per Share Amounts

Fair ValueMay 31,
2009
Net RealizedAnd UnrealizedGains (Losses)
Net,Purchasesand Sales
Fair ValueMay 30,
2010
Real Estate . . . . . . . . . . . . . . . . . $ 77.1 $ (17.0) $ 1.3 $ 61.4
Multi-strategy hedge funds . . . . . . 68.9 2.4 (49.2) 22.1
Private equity . . . . . . . . . . . . . . . 28.5 3.9 6.7 39.1
Contracts with insurancecompanies . . . . . . . . . . . . . . . . 28.9 4.1 (1.8) 31.2
Total . . . . . . . . . . . . . . . . . . . . . . . . . $ 203.4 $ (6.6) $ (43.0) $ 153.8
Assumed health care cost trend rates have a significant effect on the benefit obligation of the postretirementplans.
Assumed Health Care Cost Trend Rates at:May 29,
2011May 30,
2010
Initial health care cost trend rate . . . . . . . . . . . . . . . . . . . . . . . . . . . . . . . . . 7.5% 8.0%
Ultimate health care cost trend rate . . . . . . . . . . . . . . . . . . . . . . . . . . . . . . . 5.0% 5.0%
Year that the rate reaches the ultimate trend rate . . . . . . . . . . . . . . . . . . . . . 2016 2016
A one percentage point change in assumed health care cost rates would have the following effect:
One PercentIncrease
One PercentDecrease
Effect on total service and interest cost . . . . . . . . . . . . . . . . . . . . . . . . $ 1.3 $ (1.1)
Effect on postretirement benefit obligation . . . . . . . . . . . . . . . . . . . . . . 24.1 (21.7)
We currently anticipate making contributions of approximately $80.4 million to our company-sponsoredpension plans in fiscal 2012. This estimate is based on current tax laws, plan asset performance, and liabilityassumptions, which are subject to change. We anticipate making contributions of $32.5 million to the postretire-ment plan in fiscal 2012.
The following table presents estimated future gross benefit payments and Medicare Part D subsidy receipts forour plans:
PensionBenefits
BenefitPayments
SubsidyReceipts
Health Care and Life Insurance
2012. . . . . . . . . . . . . . . . . . . . . . . . . . . . . . . . . . . . . . . . . . . . $ 148.2 $ 32.6 $ (4.3)
2013. . . . . . . . . . . . . . . . . . . . . . . . . . . . . . . . . . . . . . . . . . . . 151.9 33.7 (4.5)
2014. . . . . . . . . . . . . . . . . . . . . . . . . . . . . . . . . . . . . . . . . . . . 156.2 33.3 (4.5)
2015. . . . . . . . . . . . . . . . . . . . . . . . . . . . . . . . . . . . . . . . . . . . 160.8 32.7 (4.6)2016. . . . . . . . . . . . . . . . . . . . . . . . . . . . . . . . . . . . . . . . . . . . 165.7 31.8 (4.6)
Succeeding 5 years . . . . . . . . . . . . . . . . . . . . . . . . . . . . . . . . . 915.7 139.8 (21.2)
Certain of our employees are covered under defined contribution plans. The expense related to these plans was$21.2 million, $22.8 million, and $23.2 million in fiscal 2011, 2010, and 2009, respectively.
77
NOTES TO CONSOLIDATED FINANCIAL STATEMENTS — (Continued)
Fiscal years ended May 29, 2011, May 30, 2010, and May 31, 2009
Columnar Amounts in Millions Except Per Share Amounts

21. FAIR VALUE MEASUREMENTS
FASB guidance establishes a three-level fair value hierarchy based upon the assumptions (inputs) used to priceassets or liabilities. The three levels of inputs used to measure fair value are as follows:
Level 1—Unadjusted quoted prices in active markets for identical assets or liabilities,
Level 2—Observable inputs other than those included in Level 1, such as quoted prices for similar assets andliabilities in active markets or quoted prices for identical assets or liabilities in inactive markets, and
Level 3—Unobservable inputs reflecting our own assumptions and best estimate of what inputs marketparticipants would use in pricing the asset or liability.
The following table presents our financial assets and liabilities measured at fair value on a recurring basisbased upon the level within the fair value hierarchy in which the fair value measurements fall, as of May 29, 2011:
Level 1 Level 2 Level 3 Total
Assets:Derivative assets. . . . . . . . . . . . . . . . . . . . . . . . . . $ 16.3 $ 55.2 $ — $ 71.5Available-for-sale securities . . . . . . . . . . . . . . . . . 1.7 — — 1.7Deferred compensation assets . . . . . . . . . . . . . . . . 7.4 — — 7.4
Total assets . . . . . . . . . . . . . . . . . . . . . . . . . . $ 25.4 $ 55.2 $ — $ 80.6
Liabilities:Derivative liabilities . . . . . . . . . . . . . . . . . . . . . . . $ — $ 92.2 $ — $ 92.2Deferred and share-based compensation
liabilities . . . . . . . . . . . . . . . . . . . . . . . . . . . . . 29.1 — — 29.1
Total liabilities . . . . . . . . . . . . . . . . . . . . . . . $ 29.1 $ 92.2 $ — $ 121.3
The following table presents our financial assets and liabilities measured at fair value on a recurring basisbased upon the level within the fair value hierarchy in which the fair value measurements fall, as of May 30, 2010:
Level 1 Level 2 Level 3 Total
Assets:Derivative assets. . . . . . . . . . . . . . . . . . . . . . . . . . $ 5.7 $ 56.1 $ — $ 61.8Available-for-sale securities . . . . . . . . . . . . . . . . . 1.8 — — 1.8Deferred compensation assets . . . . . . . . . . . . . . . . 7.1 — — 7.1
Total assets . . . . . . . . . . . . . . . . . . . . . . . . . . $ 14.6 $ 56.1 $ — $ 70.7
Liabilities:Derivative liabilities . . . . . . . . . . . . . . . . . . . . . . . $ 0.3 $ 9.8 $ — $ 10.1Deferred and share-based compensation
liabilities . . . . . . . . . . . . . . . . . . . . . . . . . . . . . 22.1 — — 22.1
Total liabilities . . . . . . . . . . . . . . . . . . . . . . . $ 22.4 $ 9.8 $ — $ 32.2
78
NOTES TO CONSOLIDATED FINANCIAL STATEMENTS — (Continued)
Fiscal years ended May 29, 2011, May 30, 2010, and May 31, 2009
Columnar Amounts in Millions Except Per Share Amounts

The following table presents our assets measured at fair value on a nonrecurring basis based upon the levelwithin the fair value hierarchy in which the fair value measurements fall, as of May 30, 2010:
Balance atMay 30,
2010 Level 1 Level 2 Level 3Total LossesRecognized
Assets measured at fair value:
Property, plant, and equipment . . . . $ 35.0 $ — $ — $ 35.0 $ 49.8
Noncurrent assets held for sale. . . . 30.4 — — 30.4 58.3
$ — $ — $ 65.4 $ 108.1
During fiscal 2010, a partially completed production facility with a carrying amount of $39.3 million waswritten-down to its fair value of $6.0 million, resulting in an impairment charge of $33.3 million, which is includedin selling, general and administrative expenses in the Consumer Foods segment (see Note 6). The fair valuemeasurement used to determine this impairment was based on the market approach and reflected anticipated salesproceeds for these assets. This production facility was sold in fiscal 2011, resulting in no material gain or loss.
During fiscal 2010, we decided to close our meat snack production facility in Garner, North Carolina (seeNote 6). We recognized an impairment charge of $16.5 million to write-down the associated property, plant andequipment with a carrying amount of $45.5 million to its fair value of $29.0 million. The fair value measurementused to determine this impairment was based on the income approach, which utilized cash flow projectionsconsistent with the most recent Slim Jim» business plan, a terminal value, and a discount rate equivalent to a marketparticipant’s weighted-average cost of capital.
During fiscal 2010, noncurrent assets held for sale from our discontinued Gilroy Foods & FlavorsTM businesswith a carrying amount of $88.7 million were written-down to their fair value of $30.4 million, resulting in animpairment charge of $58.3 million ($39.3 million after-tax), which is included in results of discontinued operations(see Note 2). The fair value measurement used to determine this impairment was based on the market approach andreflected anticipated sales proceeds for these assets.
The carrying amount of long-term debt (including current installments) was $3.2 billion as of May 29, 2011and $3.5 billion as of May 30, 2010. Based on current market rates provided primarily by outside investmentbankers, the fair value of this debt at May 29, 2011 and May 30, 2010 was estimated at $3.6 billion and $4.1 billion,respectively.
22. BUSINESS SEGMENTS AND RELATED INFORMATION
We report our operations in two reporting segments: Consumer Foods and Commercial Foods. The ConsumerFoods reporting segment includes branded, private label, and customized food products, which are sold in variousretail and foodservice channels, principally in North America. The products include a variety of categories (meals,entrees, condiments, sides, snacks, and desserts) across frozen, refrigerated, and shelf-stable temperature classes.The Commercial Foods reporting segment includes commercially branded foods and ingredients, which are soldprincipally to foodservice, food manufacturing, and industrial customers. The Commercial Foods segment’sprimary products include: specialty potato products, milled grain ingredients, a variety of vegetable products,seasonings, blends, and flavors which are sold under brands such as Lamb Weston», ConAgra Mills», and SpicetecFlavors & SeasoningsTM.
79
NOTES TO CONSOLIDATED FINANCIAL STATEMENTS — (Continued)
Fiscal years ended May 29, 2011, May 30, 2010, and May 31, 2009
Columnar Amounts in Millions Except Per Share Amounts

Intersegment sales have been recorded at amounts approximating market. Operating profit for each segment isbased on net sales less all identifiable operating expenses. General corporate expense, net interest expense, andincome taxes have been excluded from segment operations.
2011 2010 2009
Net salesConsumer Foods . . . . . . . . . . . . . . . . . . . . . . . . . . . . . . . $ 8,002.0 $ 7,939.7 $ 7,903.4Commercial Foods. . . . . . . . . . . . . . . . . . . . . . . . . . . . . . 4,301.1 4,075.2 4,445.2
Total Net Sales . . . . . . . . . . . . . . . . . . . . . . . . . . . . . . . . $ 12,303.1 $ 12,014.9 $ 12,348.6
Operating profitConsumer Foods . . . . . . . . . . . . . . . . . . . . . . . . . . . . . . . $ 1,144.3 $ 1,109.6 $ 945.7Commercial Foods. . . . . . . . . . . . . . . . . . . . . . . . . . . . . . 504.6 538.6 542.2
Total operating profit . . . . . . . . . . . . . . . . . . . . . . . . . . . . $ 1,648.9 $ 1,648.2 $ 1,487.9
Equity method investment earningsConsumer Foods . . . . . . . . . . . . . . . . . . . . . . . . . . . . . . . $ 5.7 $ 5.2 $ 5.4Commercial Foods. . . . . . . . . . . . . . . . . . . . . . . . . . . . . . 20.7 16.9 18.6
Total equity method investment earnings . . . . . . . . . . . . . $ 26.4 $ 22.1 $ 24.0
Operating profit plus equity method investment earningsConsumer Foods . . . . . . . . . . . . . . . . . . . . . . . . . . . . . . . $ 1,150.0 $ 1,114.8 $ 951.1Commercial Foods. . . . . . . . . . . . . . . . . . . . . . . . . . . . . . 525.3 555.5 560.8
Total operating profit plus equity method investmentearnings . . . . . . . . . . . . . . . . . . . . . . . . . . . . . . . . . . . . $ 1,675.3 $ 1,670.3 $ 1,511.9
General corporate expenses . . . . . . . . . . . . . . . . . . . . . . . $ (246.5) $ (406.4) $ (393.6)Interest expense, net . . . . . . . . . . . . . . . . . . . . . . . . . . . . (177.5) (160.4) (186.0)Income tax expense . . . . . . . . . . . . . . . . . . . . . . . . . . . . . (421.0) (360.9) (317.1)
Income from continuing operations . . . . . . . . . . . . . . . . . 830.3 742.6 615.2Less: Income (loss) attributable to noncontrolling
interests . . . . . . . . . . . . . . . . . . . . . . . . . . . . . . . . . . . . 1.8 (2.5) 0.6
Income from continuing operations attributable toConAgra Foods, Inc. . . . . . . . . . . . . . . . . . . . . . . . . . . $ 828.5 $ 745.1 $ 614.6
80
NOTES TO CONSOLIDATED FINANCIAL STATEMENTS — (Continued)
Fiscal years ended May 29, 2011, May 30, 2010, and May 31, 2009
Columnar Amounts in Millions Except Per Share Amounts

2011 2010 2009
Identifiable assetsConsumer Foods . . . . . . . . . . . . . . . . . . . . . . . . . . . . . . . $ 7,277.3 $ 7,065.0 $ 7,070.0Commercial Foods. . . . . . . . . . . . . . . . . . . . . . . . . . . . . . 2,466.8 2,230.7 2,187.9Corporate . . . . . . . . . . . . . . . . . . . . . . . . . . . . . . . . . . . . 1,664.6 2,135.0 1,438.9Held for sale . . . . . . . . . . . . . . . . . . . . . . . . . . . . . . . . . . — 307.3 376.5
Total . . . . . . . . . . . . . . . . . . . . . . . . . . . . . . . . . . . . . . . . $ 11,408.7 $ 11,738.0 $ 11,073.3
Additions to property, plant and equipmentConsumer Foods . . . . . . . . . . . . . . . . . . . . . . . . . . . . . . . $ 208.7 $ 277.4 $ 260.6Commercial Foods. . . . . . . . . . . . . . . . . . . . . . . . . . . . . . 187.0 158.6 109.1Corporate . . . . . . . . . . . . . . . . . . . . . . . . . . . . . . . . . . . . 70.5 46.3 59.2
Total . . . . . . . . . . . . . . . . . . . . . . . . . . . . . . . . . . . . . . . . $ 466.2 $ 482.3 $ 428.9
Depreciation and amortizationConsumer Foods . . . . . . . . . . . . . . . . . . . . . . . . . . . . . . . $ 180.3 $ 148.6 $ 130.2Commercial Foods. . . . . . . . . . . . . . . . . . . . . . . . . . . . . . 87.6 78.4 73.7Corporate . . . . . . . . . . . . . . . . . . . . . . . . . . . . . . . . . . . . 93.0 97.1 101.0
Total . . . . . . . . . . . . . . . . . . . . . . . . . . . . . . . . . . . . . . . . $ 360.9 $ 324.1 $ 304.9
Net sales by product type within each segment were:
2011 2010 2009
Net salesConsumer Foods:
Convenient Meals . . . . . . . . . . . . . . . . . . . . . . . . . . . $ 2,795.1 $ 2,754.8 $ 2,694.3Snacks . . . . . . . . . . . . . . . . . . . . . . . . . . . . . . . . . . . 1,744.9 1,689.8 1,710.1Meal Enhancers . . . . . . . . . . . . . . . . . . . . . . . . . . . . 1,047.0 1,083.8 1,004.6Specialty Foods . . . . . . . . . . . . . . . . . . . . . . . . . . . . 1,700.8 1,751.9 1,865.3Specialty International . . . . . . . . . . . . . . . . . . . . . . . 714.2 659.4 629.1
Total Consumer Foods . . . . . . . . . . . . . . . . . . . . . . . . . . . $ 8,002.0 $ 7,939.7 $ 7,903.4
Commercial Foods:Specialty Potatoes . . . . . . . . . . . . . . . . . . . . . . . . . . $ 2,375.3 $ 2,277.6 $ 2,294.6Milled Products . . . . . . . . . . . . . . . . . . . . . . . . . . . . 1,520.5 1,413.3 1,747.4Seasonings, Blends, and Flavors . . . . . . . . . . . . . . . . 405.3 384.3 403.2
Total Commercial Foods . . . . . . . . . . . . . . . . . . . . . . . . . $ 4,301.1 $ 4,075.2 $ 4,445.2
Total Net Sales . . . . . . . . . . . . . . . . . . . . . . . . . . . . . . . . $ 12,303.1 $ 12,014.9 $ 12,348.6
Presentation of Derivative Gains (Losses) for Economic Hedges of Forecasted Cash Flows in Segment Results
Derivatives used to manage commodity price risk and foreign currency risk are not designated for hedgeaccounting treatment. We believe these derivatives provide economic hedges of certain forecasted transactions. Assuch, these derivatives (except those related to our milling operations, see Note 19 to our Consolidated FinancialStatements) are recognized at fair market value with realized and unrealized gains and losses recognized in generalcorporate expenses. The gains and losses are subsequently recognized in the operating results of the reportingsegments in the period in which the underlying transaction being economically hedged is included in earnings.
81
NOTES TO CONSOLIDATED FINANCIAL STATEMENTS — (Continued)
Fiscal years ended May 29, 2011, May 30, 2010, and May 31, 2009
Columnar Amounts in Millions Except Per Share Amounts

The following table presents the net derivative gains (losses) from economic hedges of forecasted commodityconsumption and the foreign currency risk of certain forecasted transactions, under this methodology (in millions):
May 29,2011
May 30,2010
Fiscal Year Ended
Net derivative gains (losses) incurred . . . . . . . . . . . . . . . . . . . . . . . . . . $ 35.1 $ (16.9)
Less: Net derivative gains (losses) allocated to reporting segments . . . . 0.6 (19.3)
Net derivative gains recognized in general corporate expenses . . . . $ 34.5 $ 2.4
Net derivative gains (losses) allocated to Consumer Foods . . . . . . . . . . $ 3.6 $ (14.3)
Net derivative losses allocated to Commercial Foods . . . . . . . . . . . . . . (3.0) (5.0)
Net derivative gains (losses) included in segment operatingprofit . . . . . . . . . . . . . . . . . . . . . . . . . . . . . . . . . . . . . . . . . . . . $ 0.6 $ (19.3)
Based on our forecasts of the timing of recognition of the underlying hedged items, we expect to reclassifygains of $33.7 million and losses of $2.1 million to segment operating results in fiscal 2012 and 2013 and thereafter,respectively. Amounts allocated, or to be allocated, to segment operating results during fiscal 2011 and thereafterinclude net losses of $3.0 million that were recognized prior to fiscal 2011.
At May 29, 2011, ConAgra Foods and its subsidiaries had approximately 23,200 employees, primarily in theUnited States. Approximately 48% of our employees are parties to collective bargaining agreements. Of theemployees subject to collective bargaining agreements, approximately 40% are parties to collective bargainingagreements that are scheduled to expire during fiscal 2012.
Our operations are principally in the United States. With respect to operations outside of the United States, nosingle foreign country or geographic region was significant with respect to consolidated operations for fiscal 2011,2010, and 2009. Foreign net sales, including sales by domestic segments to customers located outside of theUnited States, were approximately $1.4 billion, $1.3 billion, and $1.3 billion in fiscal 2011, 2010, and 2009,respectively. Our long-lived assets located outside of the United States are not significant.
Our largest customer, Wal-Mart Stores, Inc. and its affiliates, accounted for approximately 18%, 18%, and17% of consolidated net sales for fiscal 2011, 2010, and 2009, respectively, primarily in the Consumer Foodssegment.
Wal-Mart Stores, Inc. and its affiliates accounted for approximately 15% and 16% of consolidated netreceivables as of May 29, 2011 and May 30, 2010, respectively, primarily in the Consumer Foods segment.
82
NOTES TO CONSOLIDATED FINANCIAL STATEMENTS — (Continued)
Fiscal years ended May 29, 2011, May 30, 2010, and May 31, 2009
Columnar Amounts in Millions Except Per Share Amounts

23. QUARTERLY FINANCIAL DATA (Unaudited)
FirstQuarter
SecondQuarter
ThirdQuarter
FourthQuarter
FirstQuarter
SecondQuarter
ThirdQuarter
FourthQuarter
2011 2010
Net sales . . . . . . . . . . . . . . . . . $ 2,804.3 $ 3,147.5 $ 3,141.3 $ 3,210.0 $ 2,869.2 $ 3,083.2 $ 3,015.0 $ 3,047.5Gross profit . . . . . . . . . . . . . . . 651.3 760.0 797.3 704.9 704.4 841.6 778.2 737.0Income (loss) from discontinued
operations, net of tax . . . . . . . 3.0 0.6 (10.6) (4.5) 3.3 1.9 7.8 (32.3)Net income attributable to
ConAgra Foods, Inc. . . . . . . . 146.4 200.9 214.8 254.9 165.9 239.7 229.6 90.6Earnings per share (1)(2):Basic earnings per share:
Income from continuingoperations attributable toConAgra Foods, Inc.common stockholders . . . $ 0.32 $ 0.46 $ 0.53 $ 0.63 $ 0.37 $ 0.54 $ 0.50 $ 0.28
Income (loss) fromdiscontinued operationsattributable to ConAgraFoods, Inc. commonstockholders . . . . . . . . . . 0.01 — (0.03) (0.01) — — 0.02 (0.08)
Net income attributable toConAgra Foods, Inc.common stockholders . . . $ 0.33 $ 0.46 $ 0.50 $ 0.62 $ 0.37 $ 0.54 $ 0.52 $ 0.20
Diluted earnings per share:Income from continuing
operations attributable toConAgra Foods, Inc.common stockholders . . . $ 0.32 $ 0.45 $ 0.52 $ 0.62 $ 0.36 $ 0.53 $ 0.49 $ 0.27
Income (loss) fromdiscontinued operationsattributable to ConAgraFoods, Inc. commonstockholders . . . . . . . . . . 0.01 — (0.02) (0.01) 0.01 0.01 0.02 (0.07)
Net income attributable toConAgra Foods, Inc.common stockholders . . . $ 0.33 $ 0.45 $ 0.50 $ 0.61 $ 0.37 $ 0.54 $ 0.51 $ 0.20
Dividends declared per commonshare . . . . . . . . . . . . . . . . . . $ 0.20 $ 0.23 $ 0.23 $ 0.23 $ 0.19 $ 0.20 $ 0.20 $ 0.20
Share price:High . . . . . . . . . . . . . . . . $ 25.23 $ 22.95 $ 23.58 $ 25.58 $ 20.45 $ 22.56 $ 24.64 $ 26.28Low . . . . . . . . . . . . . . . . . 21.36 21.14 21.48 22.48 18.51 19.92 21.83 23.58
(1) Amounts differ from previously filed quarterly reports. During the fourth quarter of fiscal 2011, we began to reflectthe operations of our frozen handhelds operations as discontinued operations. See additional detail in Note 2.
(2) Basic and diluted earnings per share are calculated independently for each of the quarters presented.Accordingly, the sum of the quarterly earnings per share amounts may not agree with the total year.
83
NOTES TO CONSOLIDATED FINANCIAL STATEMENTS — (Continued)
Fiscal years ended May 29, 2011, May 30, 2010, and May 31, 2009
Columnar Amounts in Millions Except Per Share Amounts

Report of Independent Registered Public Accounting Firm
The Board of Directors and StockholdersConAgra Foods, Inc.:
We have audited the accompanying consolidated balance sheets of ConAgra Foods, Inc. and subsidiaries (theCompany) as of May 29, 2011 and May 30, 2010, and the related consolidated statements of earnings, compre-hensive income, common stockholders’ equity, and cash flows for each of the years in the three-year period endedMay 29, 2011. These consolidated financial statements are the responsibility of the Company’s management. Ourresponsibility is to express an opinion on these consolidated financial statements based on our audits.
We conducted our audits in accordance with the standards of the Public Company Accounting Oversight Board(United States). Those standards require that we plan and perform the audit to obtain reasonable assurance aboutwhether the financial statements are free of material misstatement. An audit includes examining, on a test basis,evidence supporting the amounts and disclosures in the financial statements. An audit also includes assessing theaccounting principles used and significant estimates made by management, as well as evaluating the overallfinancial statement presentation. We believe that our audits provide a reasonable basis for our opinion.
In our opinion, the consolidated financial statements referred to above present fairly, in all material respects,the financial position of ConAgra Foods, Inc. and subsidiaries as of May 29, 2011 and May 30, 2010, and the resultsof their operations and cash flows for each of the years in the three-year period ended May 29, 2011, in conformitywith U.S. generally accepted accounting principles.
We also have audited, in accordance with the standards of the Public Company Accounting Oversight Board(United States), the Company’s internal control over financial reporting as of May 29, 2011, based on the criteriaestablished in Internal Control—Integrated Framework issued by the Committee of Sponsoring Organizations ofthe Treadway Commission (COSO), and our report dated July 19, 2011 expressed an unqualified opinion on theeffectiveness of the Company’s internal control over financial reporting.
/s/ KPMG LLP
Omaha, NebraskaJuly 19, 2011
84

ITEM 9. CHANGES IN AND DISAGREEMENTS WITH ACCOUNTANTS ON ACCOUNTINGAND FINANCIAL DISCLOSURE
None.
ITEM 9A. CONTROLS AND PROCEDURES
Disclosure Controls and Procedures
The Company’s management carried out an evaluation, with the participation of the Company’s Chief ExecutiveOfficer and Chief Financial Officer, of the effectiveness of the design and operation of the Company’s disclosurecontrols and procedures as defined in Rule 13a-15(e) under the Securities Exchange Act of 1934, as amended, as ofMay 29, 2011. Based upon that evaluation, the Chief Executive Officer and Chief Financial Officer concluded that, asof the end of the period covered by this report, the Company’s disclosure controls and procedures are effective.
Internal Control Over Financial Reporting
The Company’s management, with the participation of the Company’s Chief Executive Officer and ChiefFinancial Officer, evaluated any change in the Company’s internal control over financial reporting that occurredduring the quarter covered by this report and determined that there was no change in the Company’s internal controlover financial reporting during the fourth quarter of fiscal 2011 that has materially affected, or is reasonably likelyto materially affect, the Company’s internal control over financial reporting.
Management’s Annual Report on Internal Control Over Financial Reporting
The management of ConAgra Foods is responsible for establishing and maintaining adequate internal controlover financial reporting as defined in Rule 13a-15(f) under the Securities Exchange Act of 1934, as amended.ConAgra Foods’ internal control over financial reporting is designed to provide reasonable assurance regarding thereliability of financial reporting and the preparation of financial statements for external purposes in accordance withU.S. generally accepted accounting principles. ConAgra Foods’ internal control over financial reporting includesthose policies and procedures that: (i) pertain to the maintenance of records that, in reasonable detail, accurately andfairly reflect the transactions and dispositions of the assets of ConAgra Foods; (ii) provide reasonable assurance thattransactions are recorded as necessary to permit preparation of financial statements in accordance with U.S. gen-erally accepted accounting principles, and that receipts and expenditures of ConAgra Foods are being made only inaccordance with the authorization of management and directors of ConAgra Foods; and (iii) provide reasonableassurance regarding prevention or timely detection of unauthorized acquisition, use or disposition of ConAgraFoods’ assets that could have a material effect on the financial statements. Because of its inherent limitations,internal control over financial reporting may not prevent or detect misstatements. Also, projections of anyevaluations of effectiveness to future periods are subject to the risk that controls may become inadequate becauseof the changes in conditions, or that the degree of compliance with the policies or procedures may deteriorate.
With the participation of ConAgra Foods’ Chief Executive Officer and Chief Financial Officer, managementassessed the effectiveness of ConAgra Foods’ internal control over financial reporting as of May 29, 2011. In makingthis assessment, management used criteria established in Internal Control—Integrated Framework, issued by theCommittee of Sponsoring Organizations of the Treadway Commission (“COSO”). As a result of this assessment,management concluded that, as of May 29, 2011, its internal control over financial reporting was effective.
The effectiveness of ConAgra Foods’ internal control over financial reporting as of May 29, 2011 has beenaudited by KPMG LLP, an independent registered public accounting firm, as stated in their report, a copy of whichis included in this Annual Report on Form 10-K.
/s/ GARY M. RODKINGary M. Rodkin
President and Chief Executive OfficerJuly 19, 2011
/s/ JOHN F. GEHRINGJohn F. Gehring
Executive Vice President and Chief Financial OfficerJuly 19, 2011
85

Report of Independent Registered Public Accounting Firm
The Board of Directors and StockholdersConAgra Foods, Inc.:
We have audited the internal control over financial reporting of ConAgra Foods, Inc. and subsidiaries (theCompany) as of May 29, 2011, based on the criteria established in Internal Control—Integrated Framework issuedby the Committee of Sponsoring Organizations of the Treadway Commission (COSO). The Company’s manage-ment is responsible for maintaining effective internal control over financial reporting and for its assessment of theeffectiveness of internal control over financial reporting, included in the accompanying Management’s AnnualReport on Internal Control Over Financial Reporting. Our responsibility is to express an opinion on the Company’sinternal control over financial reporting based on our audit.
We conducted our audit in accordance with the standards of the Public Company Accounting Oversight Board(United States). Those standards require that we plan and perform the audit to obtain reasonable assurance aboutwhether effective internal control over financial reporting was maintained in all material respects. Our auditincluded obtaining an understanding of internal control over financial reporting, assessing the risk that a materialweakness exists, and testing and evaluating the design and operating effectiveness of internal control based on theassessed risk. Our audit also included performing such other procedures as we considered necessary in thecircumstances. We believe that our audit provides a reasonable basis for our opinion.
A company’s internal control over financial reporting is a process designed to provide reasonable assuranceregarding the reliability of financial reporting and the preparation of financial statements for external purposes inaccordance with generally accepted accounting principles. A company’s internal control over financial reportingincludes those policies and procedures that (1) pertain to the maintenance of records that, in reasonable detail,accurately and fairly reflect the transactions and dispositions of the assets of the company; (2) provide reasonableassurance that transactions are recorded as necessary to permit preparation of financial statements in accordancewith generally accepted accounting principles, and that receipts and expenditures of the company are being madeonly in accordance with authorizations of management and directors of the company; and (3) provide reasonableassurance regarding prevention or timely detection of unauthorized acquisition, use, or disposition of the company’sassets that could have a material effect on the financial statements.
Because of its inherent limitations, internal control over financial reporting may not prevent or detectmisstatements. Also, projections of any evaluation of effectiveness to future periods are subject to the risk thatcontrols may become inadequate because of changes in conditions, or that the degree of compliance with thepolicies or procedures may deteriorate.
In our opinion, ConAgra Foods, Inc. and subsidiaries maintained, in all material respects, effective internalcontrol over financial reporting as of May 29, 2011, based on the criteria established in Internal Control—Integrated Framework issued by the Committee of Sponsoring Organizations of the Treadway Commission.
We also have audited, in accordance with the standards of the Public Company Accounting Oversight Board(United States), the consolidated balance sheets of the Company as of May 29, 2011 and May 30, 2010, and therelated consolidated statements of earnings, comprehensive income, common stockholders’ equity, and cash flowsfor each of the years in the three-year period ended May 29, 2011, and our report dated July 19, 2011 expressed anunqualified opinion on those consolidated financial statements.
/s/ KPMG LLP
Omaha, NebraskaJuly 19, 2011
86

ITEM 9B. OTHER INFORMATION
None.
PART III
ITEM 10. DIRECTORS, EXECUTIVE OFFICERS AND CORPORATE GOVERNANCE
Information with respect to our Directors will be set forth in the 2011 Proxy Statement under the heading“Voting Item #1: Election of Directors,” and the information is incorporated herein by reference.
Information regarding our executive officers is included in Part I of this Form 10-K under the heading“Executive Officers of the Registrant,” as permitted by Instruction 3 to Item 401(b) of Regulation S-K.
Information with respect to compliance with Section 16(a) of the Securities Exchange Act of 1934, asamended, by our Directors, executive officers, and holders of more than ten percent of our equity securities will beset forth in the 2011 Proxy Statement under the heading “Section 16(a) Beneficial Ownership Reporting Com-pliance,” and the information is incorporated herein by reference.
Information with respect to the Audit Committee and the Audit Committee’s financial experts will be set forthin the 2011 Proxy Statement under the heading “Board Committees—Audit Committee,” and the information isincorporated herein by reference.
We have adopted a code of ethics that applies to our Chief Executive Officer, Chief Financial Officer, andController. This code of ethics is available on our website at www.conagrafoods.com through the “Our Company—Investors— Corporate Governance” link. If we make any amendments to this code other than technical, admin-istrative, or other non-substantive amendments, or grant any waivers, including implicit waivers, from a provisionof this code to our Chief Executive Officer, Chief Financial Officer, or Controller, we will disclose the nature of theamendment or waiver, its effective date, and to whom it applies on our website at www.conagrafoods.com throughthe “Our Company—Investors—Corporate Governance” link.
ITEM 11. EXECUTIVE COMPENSATION
Information with respect to director and executive compensation and our Human Resources Committee will beset forth in the 2011 Proxy Statement under the headings “Non-Employee Director Compensation,” “BoardCommittees—Human Resources Committee,” and “Executive Compensation,” and the information is incorporatedherein by reference.
ITEM 12. SECURITY OWNERSHIP OF CERTAIN BENEFICIAL OWNERS AND MANAGEMENTAND RELATED STOCKHOLDER MATTERS
Information with respect to security ownership of certain beneficial owners and management will be set forthin the 2011 Proxy Statement under the heading “Information on Stock Ownership,” and the information isincorporated herein by reference.
87

Equity Compensation Plan Information
The following table provides information about shares of our common stock that may be issued upon theexercise of options, warrants, and rights under existing equity compensation plans as of our most recent fiscal year-end, May 29, 2011.
Plan Category
Number of Securities tobe Issued Upon Exerciseof Outstanding Options,
Warrants, and Rights(a)
Weighted-AverageExercise Price of
OutstandingOptions, Warrants, and
Rights(b)
Number of SecuritiesRemaining Available forFuture Issuance Under
Equity Compensation Plans(Excluding Securities
Reflected in Column (a))(c)
Equity compensation plans approvedby security holders (1) . . . . . . . . . 40,484,137 $ 22.81 26,029,015
Equity compensation plans notapproved by security holders. . . . . — — —
Total . . . . . . . . . . . . . . . . . . . . 40,484,137 $ 22.81 26,029,015
(1) Column (a) includes 1,479,668 shares that could be issued under performance shares outstanding at May 29,2011. The performance shares are earned and common stock issued if pre-set financial objectives are met.Actual shares issued may be equal to, less than, or greater than the number of outstanding performance sharesincluded in column (a), depending on actual performance. Column (b) does not take these awards into accountbecause they do not have an exercise price. The number of shares reflected in column (a) with respect to theseperformance shares assumes the vesting criteria will be achieved at target levels. Column (b) also excludes3,251,897 restricted stock units and 623,997 deferral interests in deferred compensation plans that areincluded in column (a) but do not have an exercise price. The units vest and are payable in common stock afterexpiration of the time periods set forth in the related agreements. The interests in the deferred compensationplans are settled in common stock on the schedules selected by the participants.
ITEM 13. CERTAIN RELATIONSHIPS AND RELATED TRANSACTIONS, AND DIRECTORINDEPENDENCE
Information with respect to Director independence and certain relationships and related transactions will be setforth in the 2011 Proxy Statement under the headings “Corporate Governance—Director Independence” and“Board Committees—Audit Committee,” and the information is incorporated herein by reference.
ITEM 14. PRINCIPAL ACCOUNTANT FEES AND SERVICES
Information with respect to the principal accountant will be set forth in the 2011 Proxy Statement under theheading “Voting Item #2: Ratification of the Appointment of Independent Auditor,” and the information isincorporated herein by reference.
PART IV
ITEM 15. EXHIBITS AND FINANCIAL STATEMENT SCHEDULES
a) List of documents filed as part of this report:
1. Financial Statements
All financial statements of the Company as set forth under Item 8 of this Annual Report on Form 10-K.
88

2. Financial Statement Schedules
ScheduleNumber Description
PageNumber
S-II Valuation and Qualifying Accounts . . . . . . . . . . . . . . . . . . . . . . . . . . . . . . . . . . . . . . . . 92
Report of Independent Registered Public Accounting Firm . . . . . . . . . . . . . . . . . . . . . . . 93
All other schedules are omitted because they are not applicable, or not required, or because the requiredinformation is included in the consolidated financial statements, notes thereto.
3. Exhibits
All exhibits as set forth on the Exhibit Index, which is incorporated herein by reference.
89

SIGNATURES
Pursuant to the requirements of Section 13 or 15(d) of the Securities Exchange Act of 1934, ConAgra Foods,Inc. has duly caused this report to be signed on its behalf by the undersigned, thereunto duly authorized.
ConAgra Foods, Inc.
/s/ GARY M. RODKINGary M. Rodkin
President and Chief Executive OfficerJuly 19, 2011
/s/ JOHN F. GEHRINGJohn F. Gehring
Executive Vice President and Chief Financial OfficerJuly 19, 2011
/s/ PATRICK D. LINEHANPatrick D. Linehan
Senior Vice President and Corporate ControllerJuly 19, 2011
90

Pursuant to the requirements of the Securities Exchange Act of 1934, this report has been signed below by thefollowing persons on behalf of the Registrant and in the capacities indicated on the 19th day of July, 2011.
Gary M. Rodkin* . . . . . . . . . . . . . . . . . . . . . . . . . . . . . . . . . . . . . . . . . . . . . Director
Mogens C. Bay* . . . . . . . . . . . . . . . . . . . . . . . . . . . . . . . . . . . . . . . . . . . . . . Director
Stephen G. Butler* . . . . . . . . . . . . . . . . . . . . . . . . . . . . . . . . . . . . . . . . . . . . Director
Steven F. Goldstone* . . . . . . . . . . . . . . . . . . . . . . . . . . . . . . . . . . . . . . . . . . . Director
Joie A. Gregor* . . . . . . . . . . . . . . . . . . . . . . . . . . . . . . . . . . . . . . . . . . . . . . . Director
Rajive Johri* . . . . . . . . . . . . . . . . . . . . . . . . . . . . . . . . . . . . . . . . . . . . . . . . . Director
Richard H. Lenny* . . . . . . . . . . . . . . . . . . . . . . . . . . . . . . . . . . . . . . . . . . . . Director
Ruth Ann Marshall* . . . . . . . . . . . . . . . . . . . . . . . . . . . . . . . . . . . . . . . . . . . Director
Andrew J. Schindler*. . . . . . . . . . . . . . . . . . . . . . . . . . . . . . . . . . . . . . . . . . . Director
Kenneth E. Stinson* . . . . . . . . . . . . . . . . . . . . . . . . . . . . . . . . . . . . . . . . . . . Director
* John F. Gehring, by signing his name hereto, signs this annual report on behalf of each person indicated.Powers-of-Attorney authorizing John F. Gehring to sign this annual report on Form 10-K on behalf of each of theindicated Directors of ConAgra Foods, Inc. have been filed herein as Exhibit 24.
By: /s/ JOHN F. GEHRINGJohn F. GehringAttorney-In-Fact
91

Schedule II
CONAGRA FOODS, INC. AND SUBSIDIARIESValuation and Qualifying Accounts
For the Fiscal Years ended May 29, 2011, May 30, 2010, and May 31, 2009(Dollars in millions)
Description
Balance atBeginningof Period
AdditionsCharged
to Costs andExpenses
Deductionsfrom
Reserves
Balance atClose ofPeriod
Year ended May 29, 2011
Allowance for doubtful receivables . . . . . . . . . . . . . . $ 8.5 0.2 0.9(1) $ 7.8
Year ended May 30, 2010
Allowance for doubtful receivables . . . . . . . . . . . . . . $ 13.8 1.1 6.4(1) $ 8.5Year ended May 31, 2009
Allowance for doubtful receivables . . . . . . . . . . . . . . $ 17.5 1.5 5.2(1) $ 13.8
(1) Bad debts charged off, less recoveries.
92

Report of Independent Registered Public Accounting Firm
The Board of Directors and StockholdersConAgra Foods, Inc.:
Under date of July 19, 2011, we reported on the consolidated balance sheets of ConAgra Foods, Inc. andsubsidiaries (the Company) as of May 29, 2011 and May 30, 2010, and the related consolidated statements ofearnings, comprehensive income, common stockholders’ equity, and cash flows for each of the years in the three-year period ended May 29, 2011, which are included in the Annual Report on Form 10-K of ConAgra Foods, Inc. forthe fiscal year ended May 29, 2011. In connection with our audits of the aforementioned consolidated financialstatements, we also audited the related consolidated financial statement schedule listed in the Index at Item 15. Thisconsolidated financial statement schedule is the responsibility of the Company’s management. Our responsibility isto express an opinion on this consolidated financial statement schedule based on our audits.
In our opinion, such consolidated financial statement schedule, when considered in relation to the basicconsolidated financial statements taken as a whole, presents fairly, in all material respects, the information set forththerein.
/s/ KPMG LLP
Omaha, NebraskaJuly 19, 2011
93

EXHIBIT INDEX
Number Description
3.1 ConAgra Foods’ Certificate of Incorporation, as restated, incorporated herein by reference toExhibit 3.1 of ConAgra Foods’ current report on Form 8-K dated December 1, 2005
3.2 Amended and Restated By-Laws of ConAgra Foods, Inc., as Amended, incorporated herein byreference to Exhibit 3.1 of ConAgra Foods’ current report on Form 8-K dated November 29, 2007
*10.1 ConAgra Foods, Inc. Amended and Restated Non-Qualified CRISP Plan (January 1, 2009Restatement) incorporated herein by reference to Exhibit 10.1 of ConAgra Foods’ quarterlyreport on Form 10-Q for the quarter ended November 23, 2008
*10.1.1 Amendment One dated November 29, 2010 to the ConAgra Foods, Inc. Amended and RestatedNon-Qualified CRISP Plan (January 1, 2009 Restatement) incorporated herein by reference toExhibit 10.1 of ConAgra Foods’ quarterly report on Form 10-Q for the quarter ended February 27,2011
*10.2 ConAgra Foods, Inc. Non-Qualified Pension Plan (January 1, 2009 Restatement) incorporatedherein by reference to Exhibit 10.2 of ConAgra Foods’ quarterly report on Form 10-Q for thequarter ended November 23, 2008
*10.2.1 Amendment One dated December 3, 2009 to ConAgra Foods, Inc. Nonqualified Pension Planincorporated herein by reference to Exhibit 10.2 of ConAgra Foods’ quarterly report onForm 10-Q for the quarter ended February 28, 2010
*10.2.2 Amendment Two dated November 29, 2010 to the ConAgra Foods, Inc. Non-Qualified PensionPlan (January 1, 2009 Restatement) incorporated herein by reference to Exhibit 10.2 ofConAgra Foods’ quarterly report on Form 10-Q for the quarter ended February 27, 2011
*10.3 ConAgra Foods, Inc. Directors’ Deferred Compensation Plan (January 1, 2009 Restatement)incorporated herein by reference to Exhibit 10.4 of ConAgra Foods’ quarterly report onForm 10-Q for the quarter ended November 23, 2008
*10.3.1 Amendment One dated December 10, 2010 to ConAgra Foods, Inc. Directors’ DeferredCompensation Plan (September, 2009 Restatement) incorporated herein by reference toExhibit 10.4 of ConAgra Foods’ quarterly report on Form 10-Q for the quarter endedFebruary 27, 2011
*10.4 ConAgra Foods, Inc. Amended and Restated Voluntary Deferred Compensation Plan (January 1,2009 Restatement), incorporated herein by reference to Exhibit 10.3 of ConAgra Foods’ quarterlyreport on Form 10-Q for the quarter ended November 23, 2008
*10.4.1 Amendment One dated December 3, 2009 to the ConAgra Foods, Inc. Amended and RestatedVoluntary Deferred Compensation Plan (January 1, 2009 Restatement) incorporated herein byreference to Exhibit 10.1 of ConAgra Foods’ quarterly report on Form 10-Q for the quarter endedFebruary 28, 2010
*10.4.2 Amendment Two dated November 29, 2010 to ConAgra Foods, Inc. Amended and RestatedVoluntary Deferred Compensation Plan (January 1, 2009 Restatement) incorporated herein byreference to Exhibit 10.3 of ConAgra Foods’ quarterly report on Form 10-Q for the quarter endedFebruary 27, 2011
*10.5 ConAgra Foods 1990 Stock Plan incorporated herein by reference to Exhibit 10.6 ofConAgra Foods’ annual report on Form 10-K for the fiscal year ended May 29, 2005
*10.6 ConAgra Foods 1995 Stock Plan incorporated herein by reference to Exhibit 10.7 ofConAgra Foods’ annual report on Form 10-K for the fiscal year ended May 29, 2005
*10.7 ConAgra Foods 2000 Stock Plan incorporated herein by reference to Exhibit 10.8 ofConAgra Foods’ annual report on Form 10-K for the fiscal year ended May 29, 2005
*10.8 Amendment dated May 2, 2002 to ConAgra Foods Stock Plans and other Plans incorporatedherein by reference to Exhibit 10.10 of ConAgra Foods’ annual report on Form 10-K for the fiscalyear ended May 26, 2002
*10.9 ConAgra Foods 2006 Stock Plan incorporated herein by reference to Exhibit 10.10 ofConAgra Foods’ annual report on Form 10-K for the fiscal year ended May 28, 2006
94

Number Description
*10.9.1 Form of Stock Option Agreement for Non-Employee Directors (ConAgra Foods 2006 Stock Plan)incorporated herein by reference to Exhibit 10.1 of ConAgra Foods’ current report on Form 8-Kdated October 3, 2006
*10.9.2 Form of Stock Option Agreement for Employees (ConAgra Foods 2006 Stock Plan) incorporatedherein by reference to Exhibit 10.25 of ConAgra Foods’ quarterly report on Form 10-Q for thequarter ended November 26, 2006
*10.9.3 Form of Restricted Stock Award Agreement (ConAgra Foods 2006 Stock Plan), incorporatedherein by reference to Exhibit 10.26 of ConAgra Foods’ quarterly report on Form 10-Q for thequarter ended November 26, 2006
*10.9.4 Form of Restricted Stock Unit Agreement (ConAgra Foods 2006 Stock Plan) incorporated hereinby reference to Exhibit 10.27 of ConAgra Foods’ quarterly report on Form 10-Q for the quarterended November 26, 2006
*10.9.4.1 Amendment One to Restricted Stock Unit Agreement (ConAgra Foods 2006 Stock Plan)incorporated herein by reference to Exhibit 10.12 of ConAgra Foods’ quarterly report onForm 10-Q for the quarter ended November 23, 2008
*10.9.5 Form of Restricted Stock Unit Agreement (ConAgra Foods 2006 Stock Plan) (Post—July 2007)incorporated herein by reference to Exhibit 10.13 of ConAgra Foods’ quarterly report onForm 10-Q for the quarter ended November 23, 2008
*10.10 ConAgra Foods 2009 Stock Plan incorporated herein by reference to Exhibit 10.1 ofConAgra Foods’ current report on Form 8-K dated September 28, 2009
*10.10.1 Form of Stock Option Agreement (ConAgra Foods 2009 Stock Plan) for Non-Employee Directorsunder the ConAgra Foods 2009 Stock Plan incorporated herein by reference to Exhibit 10.5 ofConAgra Foods’ quarterly report on Form 10-Q for the quarter ended August 30, 2009
*10.10.2 Form of Stock Option Agreement (ConAgra Foods 2009 Stock Plan) incorporated herein byreference to Exhibit 10.4 of ConAgra Foods’ quarterly report on Form 10-Q for the quarter endedAugust 30, 2009
*10.10.3 Form of Stock Option Agreement for certain named executive officers (ConAgra Foods 2009Stock Plan) incorporated herein by reference to Exhibit 10.6 of ConAgra Foods’ quarterly reporton Form 10-Q for the quarter ended August 30, 2009
*10.10.4 Form of Restricted Stock Unit Agreement (ConAgra Foods 2009 Stock Plan) incorporated hereinby reference to Exhibit 10.3 of ConAgra Foods’ quarterly report on Form 10-Q for the quarterended August 30, 2009
*10.10.4.1 Form of Restricted Stock Unit Agreement (ConAgra Foods 2009 Stock Plan) (Choice Program)incorporated herein by reference to Exhibit 10.1 of ConAgra Foods’ quarterly report onForm 10-Q for the quarter ended August 29, 2010
*10.10.4.2 Form of Restricted Stock Unit Agreement (ConAgra Foods 2009 Stock Plan) (ChoiceProgram—post November 2010) incorporated herein by reference to Exhibit 10.5 ofConAgra Foods’ quarterly report on Form 10-Q for the quarter ended February 27, 2011
*10.10.5 Form of Restricted Stock Unit Agreement for Non-Employee Directors (ConAgra Foods 2009Stock Plan) incorporated herein by reference to Exhibit 10.6 of ConAgra Foods’ quarterly reporton Form 10-Q for the quarter ended February 27, 2011
*10.11 ConAgra Foods 2004 Executive Incentive Plan incorporated by reference to Exhibit 10.18 ofConAgra Foods’ annual report on Form 10-K for the fiscal year ended May 30, 2004
*10.11.1 Amendment One to ConAgra Foods 2004 Executive Incentive Plan incorporated herein byreference to Exhibit 10.6 of ConAgra Foods’ quarterly report on Form 10-Q for the quarter endedNovember 23, 2008
*10.12 ConAgra Foods Executive Incentive Plan, as amended and restated incorporated herein byreference to Exhibit 10.2 of ConAgra Foods’ current report on Form 8-K dated September 28,2009
*10.13 ConAgra Foods, Inc. 2006 Performance Share Plan, as amended, incorporated herein by reference toExhibit 10.8 of ConAgra Foods’ quarterly report on Form 10-Q for the quarter ended November 23,2008
95

Number Description
*10.14 ConAgra Foods, Inc. 2008 Performance Share Plan, effective July 16, 2008, incorporated hereinby reference to Exhibit 10.3 of ConAgra Foods’ quarterly report on Form 10-Q for quarter endedAugust 24, 2008
*10.15 ConAgra Foods, Inc. Deferred Compensation Plan Requirements dated December 10, 2010incorporated herein by reference to Exhibit 10.7 of ConAgra Foods’ quarterly report onForm 10-Q for the quarter ended February 27, 2011
*10.16 Form of Amended and Restated Agreement between ConAgra Foods and its executivesincorporated herein by reference to Exhibit 10.14 of ConAgra Foods’ quarterly report onForm 10-Q for the quarter ended November 23, 2008
*10.17 Form of Executive Time Sharing Agreement incorporated herein by reference to Exhibit 10.5 ofConAgra Foods’ quarterly report on Form 10-Q for the quarter ended November 25, 2007
*10.18 Amended and Restated Employment Agreement between ConAgra Foods and Gary M. Rodkinincorporated herein by reference to Exhibit 10.15 of ConAgra Foods’ quarterly report onForm 10-Q for the quarter ended November 23, 2008
*10.19 Stock Option Agreement between ConAgra Foods and Gary M. Rodkin incorporated herein byreference to Exhibit 10.2 of ConAgra Foods’ current report on Form 8-K dated August 31, 2005
*10.20 Second Amended and Restated Employment Agreement by and between ConAgra Foods, Inc.and Robert F. Sharpe, Jr. dated November 17, 2010 incorporated herein by reference toExhibit 10.1 of ConAgra Foods’ quarterly report on Form 10-Q for the quarter endedNovember 28, 2010
*10.21 Letter Agreement between ConAgra Foods and Andre Hawaux, dated October 9, 2006incorporated herein by reference to Exhibit 10.24 of ConAgra Foods’ annual report onForm 10-K for the fiscal year ended May 27, 2007
*10.22 Transition and Severance Agreement between ConAgra Foods, Inc. and Pete Perez datedDecember 31, 2009, incorporated herein by reference to Exhibit 10.3 of ConAgra Foods’quarterly report on Form 10-Q for the quarter ended February 28, 2010
*10.23 Amendment No. 1 to Stock Option Agreement between ConAgra Foods, Inc. and Peter M. Perezdated December 31, 2009 (2004 Options), incorporated herein by reference to Exhibit 10.4 ofConAgra Foods’ quarterly report on Form 10-Q for the quarter ended February 28, 2010
*10.24 Amendment No. 1 to Stock Option Agreement between ConAgra Foods, Inc. and Peter M. Perezdated December 31, 2009 (2009 Options), incorporated herein by reference to Exhibit 10.5 ofConAgra Foods’ quarterly report on Form 10-Q for the quarter ended February 28, 2010
*10.25 Summary of Non-Employee Director Compensation Program incorporated herein by reference toExhibit 10.8 of ConAgra Foods’ quarterly report on Form 10-Q for the quarter ended February 27,2011
*10.26 Long-Term Revolving Credit Agreement between ConAgra Foods and the banks that have signedthe agreement incorporated herein by reference to Exhibit 10.1 of ConAgra Foods’ current reporton Form 8-K dated December 16, 2005
*10.26.1 Extension Letter for Long-Term Revolving Credit Agreement between ConAgra Foods and thebanks that have signed the agreement incorporated herein by reference to Exhibit 10.23.1 ofConAgra Foods’ quarterly report on Form 10-Q for the quarter ended November 26, 2006
*10.27 Contribution and Equity Interest Purchase Agreement by and among ConAgra Foods, Inc.,ConAgra Foods Food Ingredients Company, Inc., Freebird I LLC, Freebird II LLC, FreebirdHoldings, LLC and Freebird Intermediate Holdings, LLC, dated as of March 27, 2008,incorporated herein by reference to Exhibit 10.1 of ConAgra Foods’ current report onForm 8-K dated March 27, 2008
12 Statement regarding computation of ratios of earnings to fixed charges21 Subsidiaries of ConAgra Foods, Inc.23 Consent of KPMG LLP24 Powers of Attorney31.1 Section 302 Certificate31.2 Section 302 Certificate
96

Number Description
32.1 Section 906 Certificates101.1 The following materials from ConAgra Foods’ Annual Report on Form 10-K for the year ended
May 29, 2011, formatted in XBRL (eXtensible Business Reporting Language): (i) theConsolidated Statements of Earnings, (ii) the Consolidated Statements of ComprehensiveIncome, (iii) the Consolidated Balance Sheets, (iv) the Consolidated Statements of CommonStockholders’ Equity, (v) the Consolidated Statements of Cash Flows, (vi) Notes to ConsolidatedFinancial Statements, and (vi) document and entity information.
* Management contract or compensatory plan.
Pursuant to Item 601(b)(4) of Regulation S-K, certain instruments with respect to ConAgra Foods’ long-termdebt are not filed with this Form 10-K. ConAgra Foods will furnish a copy of any such long-term debtagreement to the Securities and Exchange Commission upon request.
*END OF FORM 10-K*
97

Comparative Stock Price Performance
These comparative stock price performance graphs compare the yearly change in cumulative value of ConAgraFoods common stock with certain Index values for both five- and ten- year periods ended fiscal 2011, according toBloomberg. The graphs set the beginning value of ConAgra Foods common stock and the Indices at $100. Allcalculations assume reinvestment of dividends. The graphs compare ConAgra Foods with the Standard & Poor’s(S&P) 500 Index and the S&P 500 Packaged Foods Index. All Index values are weighted by capitalization ofcompanies included in the group.
Five Year Comparison
201120102009200820072006
$50
$75
$100
$125
$175
$200
$150
ConAgra Foods S&P 500
$153.44 S&P 500 Pkgd Foods Index
$115.62 S&P 500
$131.44 ConAgra Foods
S&P 500 Pkgd Foods Index
Ten Year Comparison
2011201020092008200720062001 2002 2003 2004 2005
$50
$100
$150
$250
$200
ConAgra Foods S&P 500
$221.15 S&P 500 Pkgd Foods Index
$181.05 ConAgra Foods
$126.19 S&P 500
S&P 500 Pkgd Foods Index
98

18 CONAGRA FOODS 2011 ANNUAL REPORT CONAGRA FOODS 2011 ANNUAL REPORT 19
CONTACTSInvestor Relations (402) 240-4154(for analyst/investor inquiries)
ConAgra Foods Shareholder Services (800) 214-0349 or [email protected] (for individual shareholder account issues)
Corporate Secretary (402) 240-4005(for additional shareholder needs)
Communication & External Relations (402) 240-4677(for news media inquiries)
Consumer Affairs(877) CONAGRA (877) 266-2472(for consumer inquiries)
CORPORATE HEADQUARTERSConAgra Foods, Inc. One ConAgra Drive Omaha, NE 68102-5001 (402) 240-4000
CONAGRA FOODS COMMON STOCKExchange Listing and Ticker symbol: New York Stock Exchange: CAG. At the end of fiscal 2011, approximately 411 million shares of common stock were outstanding. On June 26, 2011, there were approximately 23,500 stockholders of record. During fiscal 2011, approximately 1.0 billion shares were traded with a daily average volume of approximately 4.1 million shares.
FORM 10-KThe company’s Annual Report on Form 10-K for the fiscal year ended May 29, 2011, that has been filed with the Securities and Exchange Commission, is included as part of this Annual Report.
TRANSFER AGENT AND REGISTRARWells Fargo Shareowner Services 161 N. Concord ExchangeP.O. Box 64856St. Paul, MN 55164-0856 (800) 214-0349
COMMON STOCK DIVIDENDSThe quarterly dividend rate was $0.20 per share for the first quarter of fiscal 2011 and $0.23 for the second, third and fourth quarters of fiscal 2011. The annualized rate at fiscal year-end was $0.92 per share.
ANNUAL MEETING OF STOCKHOLDERSFriday, Sept. 23, 2011 1:30 p.m. Central time Joslyn Art Museum 2200 Dodge Street Omaha, NE 68102
CONAGRA FOODS SHAREHOLDER SERVICESStockholders of record who have questions about or need help with their accounts may contact ConAgra Foods Shareholder Services at (800) 214-0349 or by email at shareholderservices@ conagrafoods.com.
Through ConAgra Foods Shareholder Services, stockholders of record may make arrangements to:• automatically deposit dividends directly to bank accounts through Electronic Funds Transfer;• have stock certificates held for safekeeping;
• automatically reinvest dividends in ConAgra Foods common stock (about 60 percent of ConAgra Foods stockholders of record participate in the dividend reinvestment plan);• purchase additional shares of ConAgra Foods common stock through voluntary cash investments; and• have bank accounts automatically debited to purchase additional ConAgra Foods shares.
NEWS AND PUBLICATIONSConAgra Foods mails annual reports to stockholders of record. Street-name holders who would like to receive these reports directly from us may call Investor Relations at (402) 240-4154 and ask to be placed on our mailing list.
Investors can access information on ConAgra Foods’ performance, corporate responsibility initiatives and other information at www.conagrafoods.com.
INVESTOR INFORMATION
Endof10-K
117276_FIN_P99_100 99 7/20/11 8:34 AM

20 CONAGRA FOODS 2011 ANNUAL REPORTBOARD OF DIRECTORS OFFICERS
Mogens C. Bay Omaha, Neb.Chairman and chief executive officer of Valmont Industries, Inc. (products for water management and infrastructure). Director since 1996.
Stephen G. ButlerLeawood, Kan.Retired chairman and chief executive officer of KPMG LLP (national public accounting firm). Director since 2003.
Steven F. Goldstone Ridgefield, Conn.Manager of Silver Spring Group (a private investment firm). Retired chairman of Nabisco Group Holdings.Director since 2003 and non-executive chairman since October 2005.
Joie A. Gregor Scottsdale, Ariz.Senior advisor to Notch Partners (buyout-driven human capital consulting services). Former assistant to President George W. Bush for presidential personnel. Former vice chairman of Heidrick & Struggles International, Inc. (executive search firm). Director since 2009.
Rajive Johri Greenwich, Conn.Former president and director of First National Bank of Omaha. Director since 2009.
W. G. JurgensenColumbus, OhioFormer chief executive officer of Nationwide Financial Insurance Services, Inc. (insurance). Director since 2002.
Richard H. LennyLake Forest, Ill. Operating partner with Friedman, Fleischer & Lowe (private equity firm). Former chairman and chief executive officer of The Hershey Company (confectionary and snack products). Director since 2009.
Ruth Ann MarshallFisher Island, Fla.Retired president of MasterCard International’s Americas division (payments industry).Director since 2007.
Gary M. RodkinOmaha, Neb.President and chief executive officer of ConAgra Foods, Inc. Director since 2005.
Andrew J. Schindler Winston-Salem, N.C.Retired chairman of Reynolds American Inc. Former chairman and CEO of R.J. Reynolds Tobacco Holdings Inc. (tobacco products).Director since 2007.
Kenneth E. Stinson Omaha, Neb. Chairman of Peter Kiewit Sons’ Inc. (construction and mining). Director since 1996.
Gary RodkinPresident and chief executive officer
Colleen BatchelerExecutive vice president, general counsel and corporate secretary
Al Bolles, Ph.D.Executive vice president, Research, Quality & Innovation
Joan ChowExecutive vice president and chief marketing officer
Allen CooperVice president, Internal Audit
John GehringExecutive vice president and chief financial officer
André HawauxPresident, Consumer Foods
Brian KeckExecutive vice president and chief administrative officer
Doug KnudsenPresident, Sales
Doug LinehanSenior vice president and corporate controller
Paul MaassPresident, Commercial Foods
Scott Messel Senior vice president, treasurer and assistant corporate secretary
Greg SmithExecutive vice president, Supply Chain
Nicole TheophilusSenior vice president, Human Resources
117276_FIN_P99_100 100 7/21/11 3:01 PM

David W. K. Acheson, Ph.D.Glenelg, Md.Managing director, Food and Import Safety Leavitt Partners LLC
Robert E. Brackett, Ph.D.Bedford Park, Ill. Vice president and director,Institute for Food Safety and Health,Illinois Institute of Technology,Moffett Campus
Robert L. Buchanan, Ph.D. College Park, Md. Director and professor, Center for Food Safety and Security SystemsUniversity of Maryland
Michael P. Doyle, Ph.D. Griffin, Ga. Regents professor and director, University of Georgia Center for Food Safety
Craig Hedberg, Ph.D. Minneapolis, Minn.Professor, Division of Environmental Health Sciences, School of Public Health University of Minnesota
Jean D. Kinsey, Ph.D. St. Paul, Minn. Professor emeritus, Department of Applied Economics, and Director emeritus, The Food Industry CenterUniversity of Minnesota
David R. Lineback, Ph.D.Southport, N.C. Senior fellow,Joint Institute for Food Safety and Applied Nutrition (JIFSAN) University of Maryland
Martin Philbert, Ph.D. Northville, Mich. Dean of the School of Public Health and professor of Toxicology University of Michigan, Ann Arbor
Steve L. Taylor, Ph.D. Lincoln, Neb.Professor and director,Food Allergy Research & Resource Program, Dept. of Food Science & Technology University of Nebraska
FOOD SAFETY COUNCIL SCIENTIFIC ADVISORY BOARD
Susan I. Barr, Ph.D., R.D. Professor of NutritionThe University of British Columbia
Dennis M. Bier, M.D. Professor of PediatricsDirector, USDA/ARS Children’s Nutrition Research CenterBaylor College of Medicine
Fergus M. Clydesdale, Ph.D. Distinguished professor and directorof Food Science Policy AllianceUniversity of Massachusetts, Amherst
Johanna T. Dwyer, D.Sc., R.D. Director, Frances Stern Nutrition Center, Tufts Medical Center,Professor, School of Medicine and Friedman School of NutritionTufts University, Boston
Gary D. Foster, Ph.D.Professor of Medicine and Public Health, director of the Center for Obesity Research and EducationTemple University
Nancy Green, Ph.D. Retired professor, Nutrition Florida State University Vice president, Health and Wellness Policy (Retired), PepsiCo
Janet C. King, Ph.D.Senior scientist,Children’s HospitalOakland Research Institute,and professor, University ofCalifornia, Berkeley & Davis
David A. McCarron, M.D.Adjunct professor Department of Nutrition University of California, Davis
Sylvia Rowe PresidentSR Strategy
Mark A. Uebersax, Ph.D.Professor emeritus of Food Science and Human Nutrition Michigan State University
Sources: Above estimates were made using the Environmental Paper Network Paper Calculator v3.0 and the U.S. EPA’s Power Profiler.
ConAgra Foods is committed to reducing its impact on the environment. By producing our printed report using 169,675 pounds of paper made from 10 percent post-consumer recycled fiber as opposed to 100 percent virgin wood fiber, and printing with 100 percent renewable wind energy (RECs) we lessened the impact on the environment in the following ways:
521 trees preserved for the future
204 million BTUs of energy conserved
9,900 kWh of electricity offset
50,821 pounds of greenhouse gas reduced
229,170 gallons of water waste eliminated
14,516 pounds of solid waste eliminated
The paper, paper mills and the printers for this publication are all FSC® certified and meet the strict standards of the Forest Stewardship Council,TM which promotes environmentally appropriate, socially beneficial and economically viable management of the world’s forests.
This is a greener annual report.
our operatingprinciplessimplicityaccountabilitycollaborationimagination
Financial HighlightsDollars in millions, except per-share amounts MAY 29, 2011 MAY 30, 2010
Net sales 1 $ 12,303 $ 12,015
Gross profit 1,2 $ 2,913 $ 3,061
Operating profit 1,3 $ 1,649 $ 1,648
Income from continuing operations before income taxes and equity method investment earnings $ 1,225 $ 1,081
Income from continuing operations $ 830 $ 743
Income attributable to ConAgra Foods, Inc., common stockholders $ 817 $ 726
Diluted earnings per share from continuing operations
attributable to ConAgra Foods, Inc., common stockholders $ 1.90 $ 1.66
Diluted earnings per share from discontinued operations
attributable to ConAgra Foods, Inc., common stockholders $ (0.02) $ (0.04)
Diluted earnings per share $ 1.88 $ 1.62
Common stock price at year-end $ 25.04 $ 24.18
Annualized common stock dividend rate at year-end $ 0.92 $ 0.80
Employees at year-end 23,200 24,400
1 Amounts exclude the impact of discontinued operations of the frozen handhelds operations, the trading and merchandising operations, the Gilroy Foods & Flavors™ operations and the Fernando’s® operations. 2 Gross profit is defined as net sales less cost of goods sold. 3 Operating profit is defined as income from continuing operations before general corporate expense, interest expense (net), income tax expense, and equity method investment earnings. Refer to Note 22 to the Consolidated Financial Statements for a reconciliation of operating profit to income from continuing operations.
117276_CVRS 2 7/27/11 10:08 AM

CONAGRA FOODS 2009 ANNUAL REPORT
CON
AGR
A FOO
DS, IN
C., 2011 ANN
UAL R
EPOR
T
117276_CVRS 1 7/25/11 3:38 PM