Embed Size (px)
Citation preview

PEER-REVIEWED ARTICLE bioresources.com
Han et al. (2016). “Density distribution of WPCs,” BioResources 11(2), 3538-3549. 3538
Computer Tomography of the Density and its Spatial
Distribution of Wood-Plastic Composites
Yu Han, † Jinxing Ta, † and Dawei Qi *
The density and its spatial distribution of wood-plastic composites (WPCs) were tested by the computer tomography (CT) method. Based on the correlation among the attenuation coefficient, density, and CT number, a mathematical model between CT number and density of WPCs was established. This contributed to the realization of fast and nondestructive detection of WPC density and to the determination of the quality of wood-plastic composite products. Taking pine and poplar wood powder WPCs as subjects, the density was higher near the edge and lower in the middle of the sample, which resembled a "V" shape in the width direction. Compared with the density variations of poplar wood powder WPCs, those of pine wood powder had more of a "V" distribution.
Keywords: Wood-plastic composites; CT testing; CT number; Nondestructive detection;
Density distribution
Contact information: School of Science, Northeast Forestry University, Harbin, 150040, P. R. China;
† These authors contributed to the work equally and should be regarded as co-first authors;
* Corresponding author: [email protected]
INTRODUCTION
Wood-plastic composites (WPCs) are materials that take plant fiber (wood powder,
Platycodon grandiflorum, etc.) and plastic (polyethylene, polyvinyl chloride, etc.) as raw
materials, and are made with plastic production technology in fixed proportions. The good
mechanical properties of wood are not only retained, but the disadvantages of low strength
and high variability are removed. Additionally, WPCs can be recycled and toxic substances
are not easy to produce in the production process (Petchwattana et al. 2012). Therefore,
WPCs are known as promising "green materials" (Clemons 2002; Pritchard 2004; Yang et
al. 2015). Experts predict that WPCs will become one of the world's most important wood
materials. WPCs have distinguished applications in many different spheres, e.g.,
automotive industries, windows, doors, and decking (Ashori 2008; Caufield et al. 2010),
and have become very popular in Europe and the United States (Clemons 2002; Stark and
Matuana 2007). WPCs have also been widely exploited in outdoor applications, e.g., public
facilities and industrial or recreational purposes.
Many studies have been conducted by modifying the components or the
percentages of WPCs (Adhikary et al. 2008; Khanjanzadeh et al. 2011). For example,
Adhikary et al. (2008) noted that recycled HDPE and wood sawdust can be successfully
applied to produce stable and strong WPCs. High dimensional stability and mechanical
properties of composites can be achieved by improving the polymer content or by addition
of coupling agents. These WPCs are made using either recycled or virgin high-density
polyethylene (HDPE), with wood flour (Pinus radiata) as filler. In addition, some studies
have concentrated on the influence of external conditions on WPCs. Specifically, a
comparative analysis of the photostabilizing effects of hindered amine light

PEER-REVIEWED ARTICLE bioresources.com
Han et al. (2016). “Density distribution of WPCs,” BioResources 11(2), 3538-3549. 3539
stabilizers (HALSs), an ultraviolet absorber (UVA), and zinc borate (ZnB) on WPCs was
carried out to show the influence of accelerated weathering on the surface degradation and
loss mechanical properties of treated WPCs (Li et al. 2014). Additionally, various technical
means have been adopted in the experiments. The morphology of the WF-plastic
interaction was investigated through SEM images. SEM images confirmed the degradation
in mechanical properties of the WPCs. Increasing the plastic contents to more than 50%
can significantly improve the resistance of WPCs to weathering (Yang et al. 2015). X-ray
diffraction (XRD) analysis of composites with 3% and 5% nanoclay content has also been
conducted. The effects of organoclay platelet contents (0, 3, and 5 wt%) and polypropylene
type (virgin and recycled) on the mechanical properties of polypropylene/wood flour
composites were investigated (Khanjanzadeh et al. 2011). In addition to mechanical
properties, other characteristics of WPCs are also affected. The flexural properties, impact
strength, density, and water uptake have been measured (TabkhPaz et al. 2013). However,
there has been no emphasis on the method of density measurement in these studies.
Ideally the performance of WPCs should be determined by a nondestructive testing
method. In recent years, with the continuous progress of science and technology, non-
destructive testing technology has been developed by leaps and bounds (Yang and Qi
2011). Some widely used non-destructive testing methods include microwave detection,
ultrasonic detection, optical detection, mechanical performance testing, nuclear magnetic
resonance detection, and X-ray detection. X-ray detection technology is the most widely
used. It is also important to note that computer tomography (CT) is a non-destructive
testing method based on X-ray detection technology. CT is being increasingly utilized for
automated detection and localization of internal defects in logs prior to scanning
(Atanassov et al. 1983). Of all methods, CT has attracted considerable interest for industrial
log inspection because of its internal imaging capacity, high penetrating power, efficiency,
and resolution (Sarigul et al. 2003; Bhandarkar et al. 2005). It is reasonable to expect that
CT is valid not only for the testing of logs, but also for the testing of WPCs. However, to
date, there has been very little research conducted on the CT testing of density
measurement and distribution of WPCs.
The main purpose of this paper is to use CT to scan WPCs and obtain their fault
images. At the same time, the CT numbers of the reconstructed images were achieved and
quantitative calculations were performed via the CT numbers. A mathematical model
between CT number and density of WPCs was established, which was based on correlation
between the CT number, material attenuation coefficient, and material density.
Furthermore, the density and spatial distribution of WPCs were acquired. Assessment of
quality levels of WPC products can be made by the density distribution available, and it is
worth noting that the WPCs were undamaged.
STRUCTURE OF CT SCANNING SYSTEM AND IMAGING PRINCIPLE Structure of CT Scanning System
Three radiation sources are generally employed in CT scanning: a low-energy X-
ray source, γ-ray source, and high-energy X-ray source. As shown in Fig. 1, the X-ray CT
system has five parts: the radiation source, mechanical scanning system, data acquisition
system, display system, and storing system. The CT system is composed of two large parts,
the imaging and computer segments.

PEER-REVIEWED ARTICLE bioresources.com
Han et al. (2016). “Density distribution of WPCs,” BioResources 11(2), 3538-3549. 3540
The role of the mechanical scanning system is to rotate and translate the detected
object while scanning and to adjust the distance and relative position between radiation
source, object, and detector. A diagram of the mechanical system is displayed in Fig. 2.
The main performance indices of the mechanical scanning system are the scanning mode,
shift mode, controlling mode, and accuracy.
The key component of data acquisition system is the detector, which receives ray
signals and forms the original data of the CT system. The performance of the detector
directly affects the CT image quality.
Exploiting specific software in the computer system, many of the most important
processes can be completed, including parameter adjusting, scanning procedure
controlling, data processing, image reconstructing, image display, and storage. The main
functions of the computer system are processing and controlling.
Fig. 1. Diagram of CT scanning system
Fig. 2. Diagram of mechanical system

PEER-REVIEWED ARTICLE bioresources.com
Han et al. (2016). “Density distribution of WPCs,” BioResources 11(2), 3538-3549. 3541
Basic Imaging Principles of CT The imaging principles vary when various energy sources are used as the radiation
source in CT scanning. Take X-rays for example; during CT scanning, an X-ray beam
passes through the targeted part of the sample by multiple array projection around the
sample, and a cross-sectional image or matrix is reconstructed. Each of these through the
sample consists of an array of pixels (picture elements), which describes the X-ray
attenuation coefficient of volume elements (voxels) of the scanned object. Thus, the
attenuation coefficient can be correlated to the density of the voxel in a certain area of the
object. The outputs of the CT scanner are matrices of CT numbers expressed in Hounsfield
units (HU).
X-ray attenuation obeys Beer’s law. An attenuation illustration of Beer’s law is
shown in Fig. 3. When a ray casts the object, ray intensity I can be expressed as:
d-
01eII (1)
Fig. 3. Attenuation illustration of Beer law
When the object is heterogeneous, the ray intensity expression is written as:
w
i
iμ-d
eII 1
0, (2)
where I represents the ray intensity after attenuation occurs, 0I denotes the initial ray
intensity, i indicates ray attenuation parameters of diverse objects, and d is the length of
every detected object.
Calculation and Conversion of CT Number
CT number is the value of each pixel in the reconstructed image. It is a relative
value in practical applications. The attenuation coefficient of water serves as a reference
value. The calculation formula of CT number is as follows,
T W
W
CT number k
(3)
where T indicates the absorption coefficient of the tested object,
W denotes the
absorption coefficient of water, and k represents a constant (k = 1000). The unit of CT
number is Hounsfield units (Hu). The CT number of water is 0 in the formula. The CT

PEER-REVIEWED ARTICLE bioresources.com
Han et al. (2016). “Density distribution of WPCs,” BioResources 11(2), 3538-3549. 3542
number of a vacuum is -1000. Figure 4 is the conversion graph for CT number. The point
to emphasize here is that the conversion to CT number is an important procedure in the
image reconstruction.
Fig. 4. The conversion to CT number
EXPERIMENTAL Materials and Methods for Density Measurement
The WPCs used were double screw extrusion molded, provided by the Material
Science and Technology Key Laboratory of the Ministry of Education of Northeast
Forestry University. Cross-sectional scanning for a host of WPCs including pine and
poplar wood powder WPCs was conducted (a total of 80). The scanning conditions of
WPC samples are given. Philips Brilliance 64 channel spiral CT scanner of Philips's
company (Cleveland, USA) was used. Scanning voltage and current were 100 KV and 80
mA, respectively. The sample was 200 mm long, 100 mm wide, and 20 mm thick. The
ratio of wood powder to plastic was 3:2. Extrusion molding style was randomly selected.
Tomography width was 5 mm. The total number of scanned layers equaled 20. The average
CT number and density of 12 pieces of samples are displayed by Table 1.
The CT numbers of all cross-sectional images were obtained and recorded. Twelve
pieces of WPCs were randomly selected. First, each piece was scanned with CT and the
corresponding CT number was recorded. The average value of CT numbers was
calculated.
Note that when the CT number was recorded, the selection of CT number should
ignore corresponding values of defect sites and choose corresponding values of the uniform
parts. Second, according to GB/T 17657 (1999), there are two methods for density
measurement, the direct measuring and drainage method, we use the former. The density
of WPCs is equal to the ratio of mass to volume and then the density was determined.
Materials and Methods for Measuring Density Distribution Poplar and pine wood powder WPCs in the single screw extrusion molding style
were selected. Two kinds of WPCs were scanned in cross-sectional mode, and
corresponding images were saved. CT numbers of the entire images were achieved and
marked in numerical way.

PEER-REVIEWED ARTICLE bioresources.com
Han et al. (2016). “Density distribution of WPCs,” BioResources 11(2), 3538-3549. 3543
RESULTS AND DISCUSSION
Equation 3 represents the relationship between CT number and ray attenuation
coefficient of WPCs. It may be accepted that the attenuation of WPCs is certainly
correlated with the density. The reason is that exploiting CT number not only indicates the
absorption and attenuation coefficient of materials but also indicates the relative
relationship of different density tissues (Yu and Lu 2005). Therefore, it is proposed that
the CT number of WPCs may also be associated with the corresponding density. Given
the same controlled conditions, the magnitude of the average CT number can signify
densities of the samples are different.
Table 1. Average CT Number and Corresponding Average Density
Sample number Average CT number (Hu)
Average density (g/cm3)
S1 141 1.214 S2 187 1.261 S3 446 1.411 S4 592 1.470 S5 359 1.419 S6 480 1.420 S7 500 1.436 S8 -11 1.000 S9 -83 0.957
S10 -30 0.977 S11 61 1.078 S12 50 1.076
The data given in Table 1 were analyzed and a mathematical model was
successfully established, as follows,
( 4)1.0420 8.2305 10 xy (4)
where y indicates sample density and x denotes the CT number of sample faults or
tomography. The coefficient is determined by the data in combination with the linear fitting
formula. The relationship between CT number and density is shown in Fig. 5. The CT
number distribution appears to be well correlated with density distribution for WPCs.
Fig. 5. Relationship between CT number and density of WPC faults

PEER-REVIEWED ARTICLE bioresources.com
Han et al. (2016). “Density distribution of WPCs,” BioResources 11(2), 3538-3549. 3544
Table 2. CT Numbers of Cross Section of Pine Powder WPCs
Selection points
Section 1 2 3 4 5 6 7 8 9 10
1 260 152 123 70 -19 -11 -47 51 136 221 2 266 172 123 79 -20 -17 -32 35 132 218 3 269 183 115 60 7 0 -61 51 137 203 4 258 186 129 66 -11 -9 -20 57 123 186 5 267 175 129 70 -29 -4 -38 48 113 203 6 163 127 65 -51 -16 20 18 110 179 199 7 190 120 66 -61 -26 -3 18 113 171 202 8 187 120 69 -16 -30 -41 28 109 192 185 9 194 131 52 -35 -4 -46 12 105 177 187 10 180 134 50 -53 -31 -13 28 107 182 175 11 195 122 32 -46 -43 -43 41 101 159 197 12 201 134 31 -39 -6 -20 61 88 181 180 13 201 129 42 -51 -17 -44 35 82 178 197 14 204 127 53 -36 -7 -66 -9 86 163 202 15 185 110 47 -59 -53 -10 3 74 182 207 16 195 120 42 -19 -43 -23 12 75 165 216 17 203 119 36 -31 -65 -38 -2 75 159 203 18 210 97 32 -32 -12 -11 12 77 152 216 19 213 118 31 -29 -45 -26 12 63 157 235 20 202 105 47 -35 -22 -16 24 76 148 234
Average value 212 134 66 -12 -25 -21 5 79 159 203
Table 3. CT Numbers of Cross Section of Poplar Powder WPCs
Selection points
Section 1 2 3 4 5 6 7 8 9 10
1 212 141 131 107 105 113 113 143 134 212 2 218 159 161 136 92 100 92 176 170 218 3 190 160 156 135 101 116 120 112 162 190 4 203 125 130 108 90 135 138 142 145 203 5 179 178 162 140 113 112 156 172 169 179 6 200 188 156 149 140 124 115 156 147 203 7 185 161 158 143 124 99 179 185 200 243 8 222 164 159 151 134 93 182 193 207 222 9 207 196 187 180 178 149 169 181 211 220 10 203 203 156 140 171 136 113 146 178 212 11 243 180 171 116 95 130 148 149 150 212 12 193 177 170 134 109 137 189 187 212 218 13 211 175 152 145 97 156 167 166 180 190 14 203 163 151 148 129 154 174 169 178 203 15 218 192 172 141 101 158 154 179 182 179 16 200 186 142 182 136 196 153 139 214 147 17 212 158 167 133 109 137 218 158 206 185 18 183 180 153 171 161 177 180 200 215 222 19 196 194 173 170 95 159 198 202 207 220 20 211 191 156 145 131 176 187 187 190 222
average value 204 173 158 143 120 137 157 167 182 205

PEER-REVIEWED ARTICLE bioresources.com
Han et al. (2016). “Density distribution of WPCs,” BioResources 11(2), 3538-3549. 3545
CT numbers of cross sections of pine and poplar wood powder WPCs are listed in
Tables 2 and 3, respectively. Selected ten points were equally spaced at each fault of two
kinds of WPCs. The total number of selected CT numbers amounts to 200 in each table.
It is known that the density distribution of a material reflects whether or not the
density is uniform. Therefore, to intuitively analyze density distribution and enable better
judgment of density uniformity, the CT number distribution of WPC sections is
demonstrated in stereograph and line graph style (Figs. 6 to 9). As shown in Figs. 6 to 9,
the section densities of pine and poplar powder WPCs exhibit distinct and regular changes
in the width. To be specific, density is high near the edge and is low in the middle, showing
a "V" shape. A comparison of the results obtained for these two materials suggests the
density change of pine powder WPCs is more pronounced than that of poplar powder
WPCs.
Fig. 6. Density spatial distribution of pine wood powder WPCs
Fig. 7. Density distribution of fault planes of pine wood powder WPCs
PEER-REVIEWED ARTICLE bioresources.com
Han et al. (2016). “Density distribution of WPCs,” BioResources 11(2), 3538-3549. 3546
Fig. 8. Density spatial distribution of poplar powder WPCs
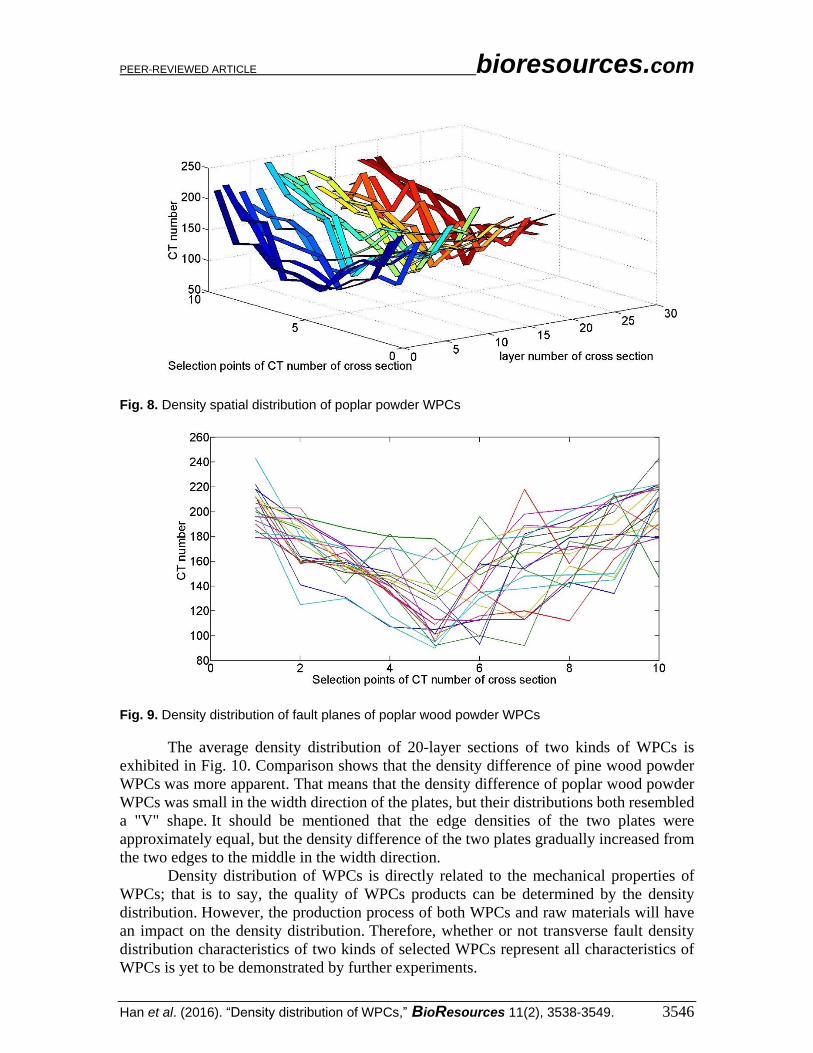
Fig. 9. Density distribution of fault planes of poplar wood powder WPCs
The average density distribution of 20-layer sections of two kinds of WPCs is
exhibited in Fig. 10. Comparison shows that the density difference of pine wood powder
WPCs was more apparent. That means that the density difference of poplar wood powder
WPCs was small in the width direction of the plates, but their distributions both resembled
a "V" shape. It should be mentioned that the edge densities of the two plates were
approximately equal, but the density difference of the two plates gradually increased from
the two edges to the middle in the width direction.
Density distribution of WPCs is directly related to the mechanical properties of
WPCs; that is to say, the quality of WPCs products can be determined by the density
distribution. However, the production process of both WPCs and raw materials will have
an impact on the density distribution. Therefore, whether or not transverse fault density
distribution characteristics of two kinds of selected WPCs represent all characteristics of
WPCs is yet to be demonstrated by further experiments.

PEER-REVIEWED ARTICLE bioresources.com
Han et al. (2016). “Density distribution of WPCs,” BioResources 11(2), 3538-3549. 3547
Fig. 10. Comparison of average density distribution of cross section
CONCLUSIONS 1. Based on the correlation among the attenuation coefficient, density, and CT number, a
mathematical model between CT number and density of WPCs was established, which
contributed to the realization of the fast and non-destructive detection of the density of
WPCs and to the determination of the quality of WPC products.
2. Cross-sections of pine and poplar wood powder WPCs were scanned by CT. The cross-
sectional density images were established. Cross sectional densities of pine and poplar
powder WPCs changed greatly in the width direction. Density was high near the edge
and was low in the middle, showing a "V" shape. A comparison of the results obtained
for these two materials suggests that the density variation of pine powder WPCs was
greater.
ACKNOWLEDGEMENTS
This work was financially supported by the Fundamental Research Funds for the
Central Universities of China under Grant No. 2572014BB17, No.2572014CB30, the
Project of the National Science Foundation of China (No. 31570712), the Project of the
Natural Science Foundation of Heilongjiang Province of China (No.C201338), the Science
and Technology Innovative Talents Special Funds Harbin (No.2012RFXXG080), and the
Science and Technology Research Project of the Education Department of Heilongjiang
Province (No.12543019).

PEER-REVIEWED ARTICLE bioresources.com
Han et al. (2016). “Density distribution of WPCs,” BioResources 11(2), 3538-3549. 3548
REFERENCES CITED
Adhikary, K. B., Pang, S. S., and Staiger, M. P. (2008). “Dimensional stability and
mechanical behaviour of wood-plastic composites based on recycled and virgin high-
density polyethylene (HDPE),” Composites: Part B. 39(5), 807-815. DOI: 10.101
6/j.compositesb.2007.10.005
Ashori, A. (2008). “Wood-plastic composites as promising green-composites for
automotive industries!,” Bioresour. Technol. 99(11), 4661-4667. DOI: 10.1016 /j.bio
rtech.2007.09.043
Atanassov, K. T. (1983). “Intuitionistic fuzzy sets,” Seventh Scientific Session of ITKR
11(6), 87-96.
Bhandarkar, S. M., Luo, X. Z., Daniels, R., and Tollner, E. W. (2005). “Detection of
cracks in computer tomography images of logs,” Pattern Recognit. Lett. 26(14),
2282-2294. DOI:10.1016/j.patrec.2005.04.004
Caufield, D. F., Clemons, C., and Rowell, R. M. (2010). Wood Thermoplastic
Composites. Sustainable Development in the Forest Products Industry, Universidada
Femando Pessoa, Porto, Portugal.
Clemons, C. (2002). “Wood-plastic composites in the United States: The interfacing of
two industries,” Forest Prod J. 52(6), 10-18, (http://www. treesearch. fs.fed.us/pubs/8
778).
GB/T 17657 (1999). “Testing method for physical and chemical properties of artificial
and decorative boards,” China Standards Press, Beijing, China
Khanjanzadeh, H., Tabarsa, T., Shakeri, A., and Omidvar, A. (2011). “Effect of
organoclay platelets on the mechanical properties of wood plastic composites
formulated with virgin and recycled polypropylene,” Wood Mater. Sci. Eng. 6(4),
207-212. DOI: 10.1080/17480272.2011.606915
Li, H. Y., Zhang, Z., Song, K. L., Lee, S., Chun, S. J., Zhou, D. G., and Wu, Q. L.
(2014). “Effect of durability treatment on ultraviolet resistance, strength, and surface
wettability of wood plastic composite,” BioResources 9(2), 3591-3601. DOI:
10.15376/biores.9.2.3591-3601
Petchwattana, N., Covavisaruch, S., and Sanetuntikul, J. (2012). “Recycling of wood–
plastic composites prepared from poly (vinyl chloride) and wood flour,” Constr.
Build. Mater. 28(1), 557-560. DOI:10.1016/j.conbuildmat.2011.08.024
Pritchard, G. (2004). “Two technologies merge: Wood plastic composites,” Reinf. Plast.
48(6), 26-29. DOI: 10.1016/S0034-3617(04)00339-X
Sarigul, E., Abbott, A. L., and Schmoldt, D. L. (2003). “Rule-driven defect detection in CT
images of hardwood logs,” Comput. Electron. Agric. 41(1-3), 101-119. DOI:
10.1016/S0168-1699(03)00046-2
Stark, N. M., and Matuana, L. M. (2007). “Characterization of weathered wood-plastic
composite surfaces using FTIR spectroscopy, contact angle, and XPS,” Polym.
Degrad. Stab. 92(10), 1883-1890. DOI:10.1016/j.polymdegradstab.2007.06.017
TabkhPaz, M., Behravesh, A. H., Shahi, P., and Zolfaghari, A. (2013). “Procedure effect
on the physical and mechanical properties of the extruded wood plastic composites,”
Polym. Compos. 34(8), 1349-1356. DOI: 10.1002/pc
Yang, N. X., and Qi, D. W. (2011). “Nondestructive testing of blockboard using
combination of wavelet transform and gray-scale mathematical morphology,” Appl.
Mech. Mater. 55-57, 1206-1210. DOI:10.4028/www.scientific.net/AMM.55-57.1206

PEER-REVIEWED ARTICLE bioresources.com
Han et al. (2016). “Density distribution of WPCs,” BioResources 11(2), 3538-3549. 3549
Yang, T. H., Yang, T. H., Chao, W. C., and Leu, S. Y. (2015). “Characterization of the
property changes of extruded wood-plastic composites during year round subtropical
weathering,” Constr. Build. Mater. 88, 159-168. DOI:10.1016/j.conbuildmat.201
5.04.019
Yu, X. E., and Lu, G.W. (2005). The Principle, Structure and Quality Assurance of CT
Device, Science Press, Beijing, China.
Article submitted: August 23, 2015; Peer review completed: December 1, 2015; Revised
version received: January 26, 2016; Accepted: February 20, 2016; Published: February
24, 2016.
DOI: 10.15376/biores.11.2.3538-3549