Embed Size (px)
Citation preview
Computer Adaptive Testing and Vertical Scales
for the Measurement of Growth
Connecticut Assessment Forum August 2012
Hariharan Swaminathan H. Jane Rogers Norma Sinclair Mohamed Dirir

CT has joined the Smarter Balanced Assessment Consortium (SBAC), a consortium of states that have agreed to a common core of educational standards and a common set of assessments

Consists of 21 governing states and 6 advisory states
Common assessments to begin in 2014-2015
Based on Common Core State Standards adopted by 45 states, District of Columbia, and 3 territories
Grades 3-8 and 11 tested
Subjects: Mathematics and English Language Arts
Goal: College and career-readiness
Testing Method: Computer Adaptive Testing
Performance Report: Vertical scale scores and grade-specific achievement levels
Why computer adaptive testing (CAT)?
Some necessary background

Fundamental Concepts of Educational Measurement
1. An individual has a “true” but unobservable ability or proficiency level
2. Our task is to determine this proficiency level by using a measuring instrument, i.e., a TEST.
3. In general, we cannot measure this proficiency perfectly – we can only measure it with some error.
4. We want this error to be as small as possible.
x

5. We cannot measure this error directly. The traditional approach is to estimate the Standard Deviation of the Error, known as the Standard Error of Measurement (SEM) in a population of examinees and use the SEM as an indicator of the average precision with which true proficiency is measured.
x

1SEM Reliability
When Score Reliability is high, SEM is low and vice versa.
6. SEM is closely related to Score Reliability
SEM can be reduced (reliability increased) by:
increasing the test length
assembling test items carefully
Increasing test length is clearly not an option in many situations.
Assembling test items to yield a given reliability is difficult.
An Alternative Measurement Theory:
ITEM RESPONSE THEORY

Item Response Theory (IRT)
IRT became feasible for practical testing purposes only in the 1970s with the increasing power and availability of computers and software
IRT is a powerful measurement framework based on mathematical models of examinee performance
Nearly all large-scale assessments today are based on IRT
Features of IRT
When an IRT model fits the data,
Item parameters are invariant across subpopulations - items can be “calibrated” using different groups of examinees

Features of IRT
When an IRT model fits the data,
Proficiency parameters are invariant across test forms - examinees’ scores can be compared even when they take different tests

Features of IRT
When an IRT model fits the data,
Measurement precision can be calculated at every level of proficiency - each examinee has his/her own standard error of measurement (SEM) - important because examinees at the extremes are measured less precisely than those in the middle

Test construction
- items can be chosen to obtain a desired level of measurement precision in any region of the proficiency continuum
Equating of test forms
- scores from different forms can easily be placed on a common scale
How is IRT Used in Large-Scale Assessments?

Vertical scaling
- examinees’ performance in different grades or years can be placed on a common scale to determine growth
Adaptive testing
- examinees can be administered items matched to their proficiency levels to more quickly and precisely determine their proficiency
How is IRT Used in Large-Scale Assessments?
How does IRT provide all these benefits?
Principles of IRT
1. An examinee has a certain level of proficiency that cannot be directly observed (i.e., is a latent variable)
In practice, we generally assume only one underlying dimension, but multidimensional models are available

Principles of IRT
2. The examinee’s proficiency level and the characteristics of a test item determine the examinee’s probability of a particular response to the item
For dichotomous responses, the higher an examinee’s proficiency, the higher the probability of a correct response
Principles of IRT
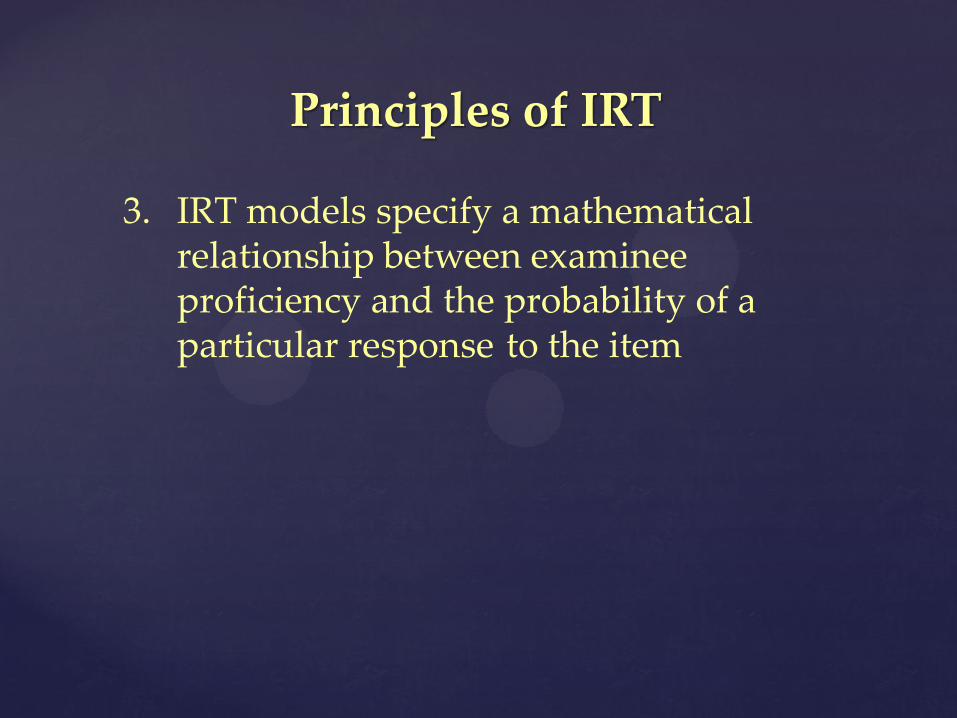
3. IRT models specify a mathematical relationship between examinee proficiency and the probability of a particular response to the item
IRT Models
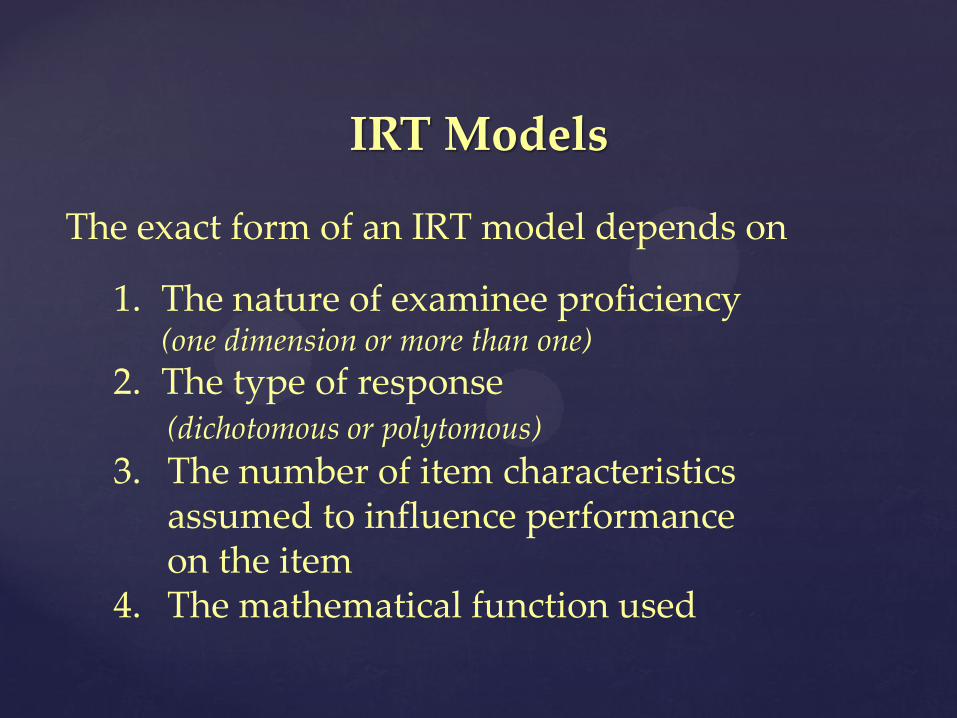
The exact form of an IRT model depends on
1. The nature of examinee proficiency (one dimension or more than one)
2. The type of response (dichotomous or polytomous)
3. The number of item characteristics assumed to influence performance
on the item 4. The mathematical function used

IRT models specify up to three item characteristic that influence the probability of a given response
IRT Item Parameters
IRT Item Parameters
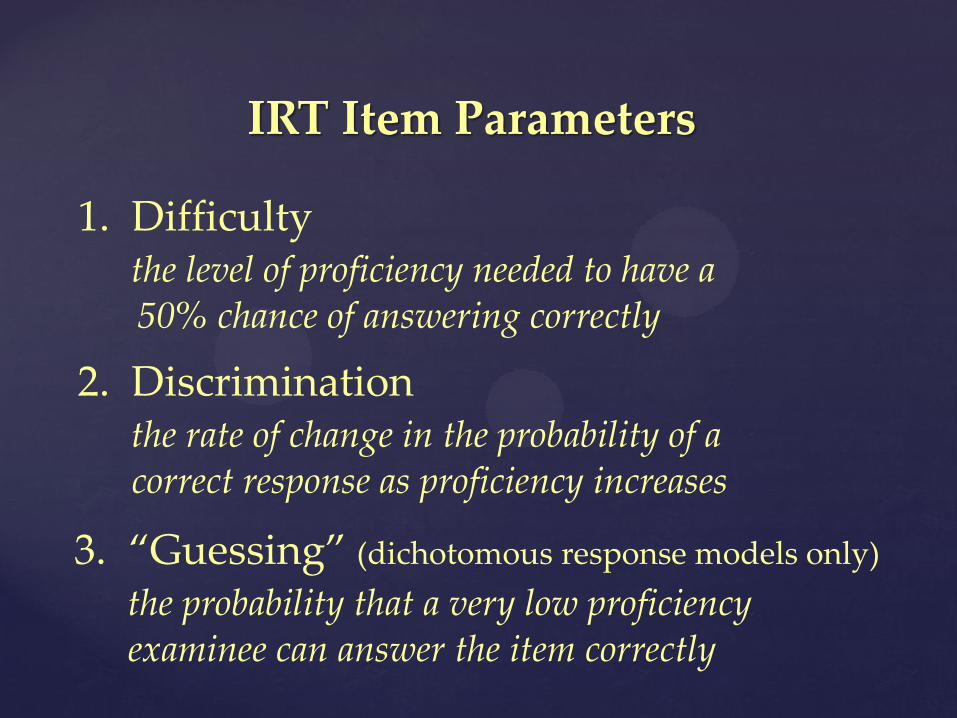
1. Difficulty the level of proficiency needed to have a 50% chance of answering correctly
2. Discrimination the rate of change in the probability of a correct response as proficiency increases
3. “Guessing” (dichotomous response models only)
the probability that a very low proficiency examinee can answer the item correctly

Dichotomous Item Response Models
One-parameter model Items differ only in difficulty
Two-parameter model Items differ in difficulty and discrimination
Three-parameter model Items differ in difficulty, discrimination, and susceptibility to guessing
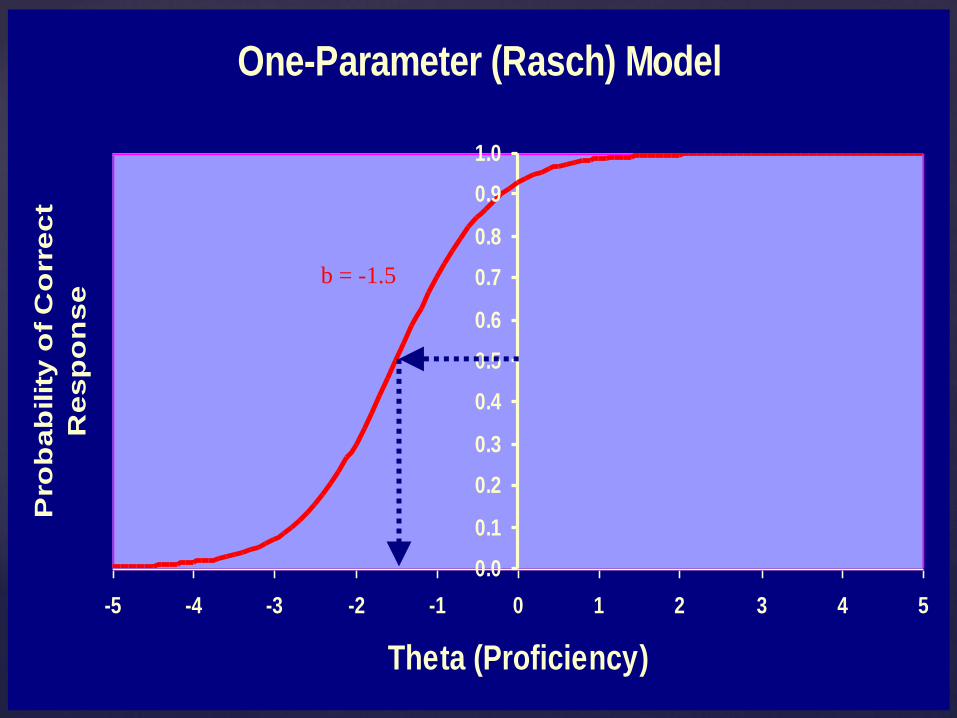
One-Parameter (Rasch) Model
0.0
0.1
0.2
0.3
0.4
0.5
0.6
0.7
0.8
0.9
1.0
-5 -4 -3 -2 -1 0 1 2 3 4 5
Theta (Proficiency)
Pro
ba
bilit
y o
f C
orr
ec
t
Re
sp
on
se
b = -1.5
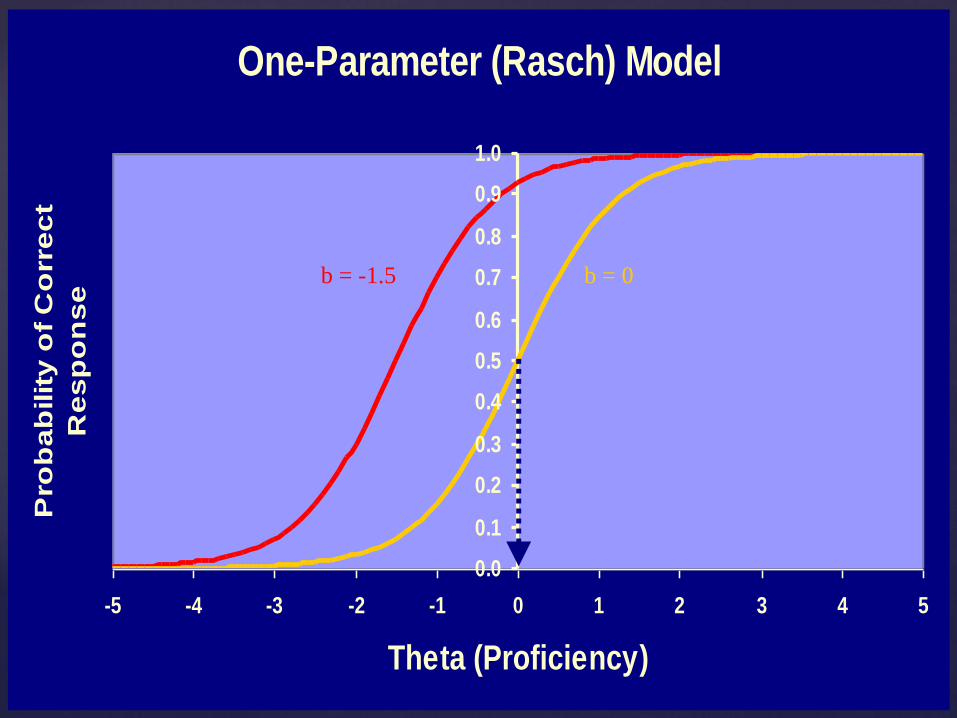
One-Parameter (Rasch) Model
0.0
0.1
0.2
0.3
0.4
0.5
0.6
0.7
0.8
0.9
1.0
-5 -4 -3 -2 -1 0 1 2 3 4 5
Theta (Proficiency)
Pro
ba
bilit
y o
f C
orr
ec
t
Re
sp
on
se
b = -1.5 b = 0

One-Parameter (Rasch) Model
0.0
0.1
0.2
0.3
0.4
0.5
0.6
0.7
0.8
0.9
1.0
-5 -4 -3 -2 -1 0 1 2 3 4 5
Theta (Proficiency)
Pro
ba
bilit
y o
f C
orr
ec
t
Re
sp
on
se
b = 0 b = -1.5 b = 1.5

Two-Parameter Model
0.0
0.1
0.2
0.3
0.4
0.5
0.6
0.7
0.8
0.9
1.0
-5 -4 -3 -2 -1 0 1 2 3 4 5
Theta (Proficiency)
Pro
ba
bil
ity o
f C
orr
ect
Re
sp
on
se
Two-Parameter Model
0.0
0.1
0.2
0.3
0.4
0.5
0.6
0.7
0.8
0.9
1.0
-5 -4 -3 -2 -1 0 1 2 3 4 5
Theta (Proficiency)
Pro
bab
ilit
y o
f C
orrect
Resp
on
se
Difficulty - b
a - Discrimination - Slope

Two-Parameter Model
0.0
0.1
0.2
0.3
0.4
0.5
0.6
0.7
0.8
0.9
1.0
-5 -4 -3 -2 -1 0 1 2 3 4 5
Theta (Proficiency)
Pro
ba
bil
ity o
f C
orr
ect
Re
sp
on
se
a = 0.5
b = -0.5
a = 2.0
b = 0.0
a = 0.8
b = 1.5

Three-Parameter Model
0.0
0.1
0.2
0.3
0.4
0.5
0.6
0.7
0.8
0.9
1.0
-5 -4 -3 -2 -1 0 1 2 3 4 5
Theta (Proficiency)
Pro
ba
bil
ity o
f C
orr
ect
Re
sp
on
se
c - Lower Asymptote

Three-Parameter Model
0.0
0.1
0.2
0.3
0.4
0.5
0.6
0.7
0.8
0.9
1.0
-5 -4 -3 -2 -1 0 1 2 3 4 5
Theta (Proficiency)
Pro
ba
bil
ity o
f C
orr
ect
Re
sp
on
se
a = 2.0
b = 0.0
c = .25
a = 0.8
b = 1.5
c = 0.1
a = 0.5
b = -0.5
c = 0.0

Standard Error of Measurement in IRT
• Rather than using the concept of SEM, its inverse is used to assess the “information” provided by the test score about an examinee
INFORMATION = 1/(SEM)2
The smaller the SEM, the greater the information

• Each item contributes its information to the test. The sum of the ITEM INFORMATION functions is the TEST INFORMATION function
Items can be selected to maximize information in desired regions of the proficiency continuum
• The amount of information provided by the test depends on the examinee’s proficiency level

Bell-shaped
Item Information Functions
Peak is at or near difficulty value b
an item provides greatest information at proficiency values near the difficulty
Height depends on discrimination
more discriminating items provide greater information
Items with low c provide greatest information
guessing reduces information

0
1
2
3
4
5
6
7
8
-2.5 -2.0 -1.5 -1.0 -0.5 0.0 0.5 1.0 1.5 2.0 2.5
Theta
Info
rmati
on
Item and Test Information Functions

We can construct a bank of items with known characteristics
Importance of Information Functions
We can construct tests with desired measurement precision in any region of the proficiency continuum
We can “tailor” a test to suit the proficiency level of an examinee while maintaining comparability of scores
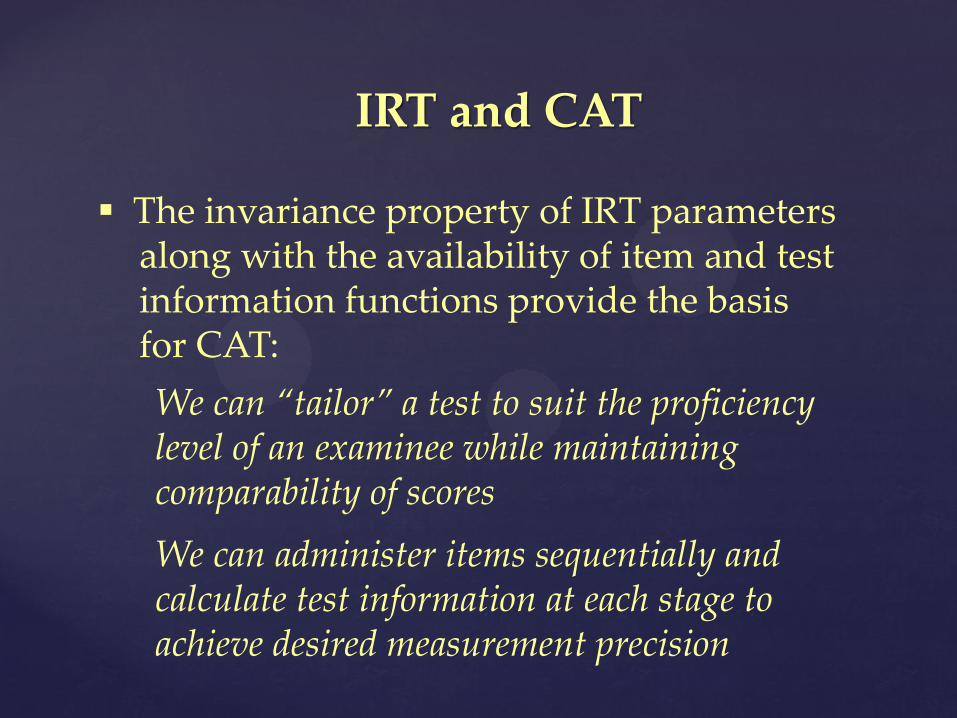
IRT and CAT
We can administer items sequentially and calculate test information at each stage to achieve desired measurement precision
The invariance property of IRT parameters along with the availability of item and test information functions provide the basis for CAT:

1. Administer an item of medium difficulty.
2. If the response is correct, administer a more difficult item; if incorrect, administer an easier item.
3. Continue until at least one item is answered correctly or incorrectly (usually five items or fewer).
An Adaptive Testing Scheme
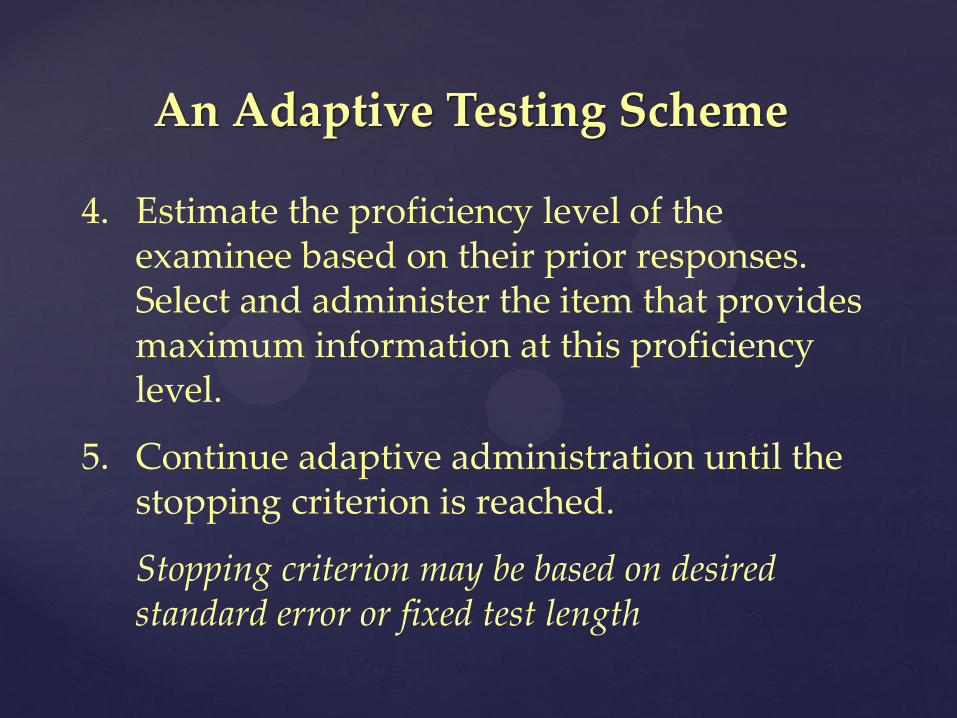
4. Estimate the proficiency level of the examinee based on their prior responses. Select and administer the item that provides maximum information at this proficiency level.
5. Continue adaptive administration until the stopping criterion is reached.
Stopping criterion may be based on desired standard error or fixed test length
An Adaptive Testing Scheme

6. Place the final proficiency estimate and its standard error on the reporting scale - usually a linear transformation.
Final proficiency scores are on a common scale and can be compared across examinees even though each examinee took a unique set of items.
An Adaptive Testing Scheme
With this adaptive sequence, we can reach a level of precision (SEM, and hence reliability level) with fewer items than with a traditional linear test.
In practice, we have to fine tune this approach and modify it to satisfy a set of requirements and constraints.

Over-exposure of items
Items with high discriminations provide the most information, so these items are administered more often if not controlled.
Issues with the Simple CAT

Possible exposure control mechanisms:
1. Calculate a set of parameters that control the frequency with which each item is administered if selected
2. Choose less discriminating items in the early stages of the test and save the more discriminating items for later when proficiency has been better targeted
Issues with the Simple CAT

Content constraints have to be imposed to satisfy validity related requirements.
The test for each examinee must meet test specifications so items must be selected based on content as well as information
Issues with the Simple CAT

1. There must be a large enough item bank.
2. There must be sufficient existing examinee response data on each item in the bank to fit an IRT model (calibrate)
3. An IRT model must provide adequate fit to the response data.
4. The calibrated item bank must contain items of sufficiently heterogeneous difficulty.
Requirements for CAT

IRT, CAT and Vertical Scales for Measuring Growth
Item parameters for items across grades can be placed on a common scale through an appropriate calibration design
Students in each grade will be administered a CAT that meets content specifications for that grade
Proficiency estimates across grades will be on a common scale because the items have been calibrated on the vertical scale

Student Achievement Growth
Co
mpu
te
r A
da
ptive
Te
st
Ve
rtic
al S
ca
le

Why Vertical Scales?
Vertical scales are the best tool to measure growth as students go from grade to grade
They provide interpretable score changes over time and across grades
They provide a clear picture of grade-specific achievement levels
Caution: vertical scales need careful development and constant maintenance
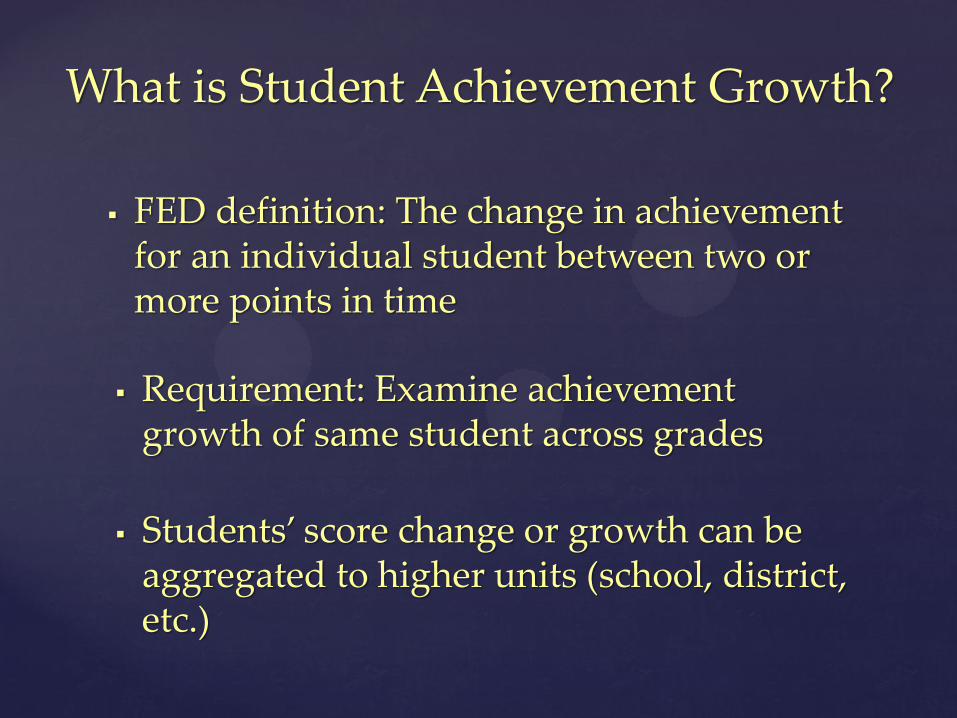
What is Student Achievement Growth?
FED definition: The change in achievement for an individual student between two or more points in time
Requirement: Examine achievement growth of same student across grades
Students’ score change or growth can be aggregated to higher units (school, district, etc.)

What is Student Achievement Growth? “Without continual growth …, achievement, and success have no meaning.” Benjamin Franklin
Does the following show achievement growth?
The percent of 7th grade students in District A at/above goal was 65 last year, and 68 this year.
2011 Goal 65%
2012 Goal 68%
Not Goal
32% Not Goal
35%

What is Not Achievement Growth
In District A above, 65% of 7th graders scored at/above goal last year, 70% of 8th graders scored at/above goal this year.
Jose scored at proficient in 5th grade and scored at proficient in 6th grade.
Anna performed at the basic level in grade 3, and at proficient level in grade 4.
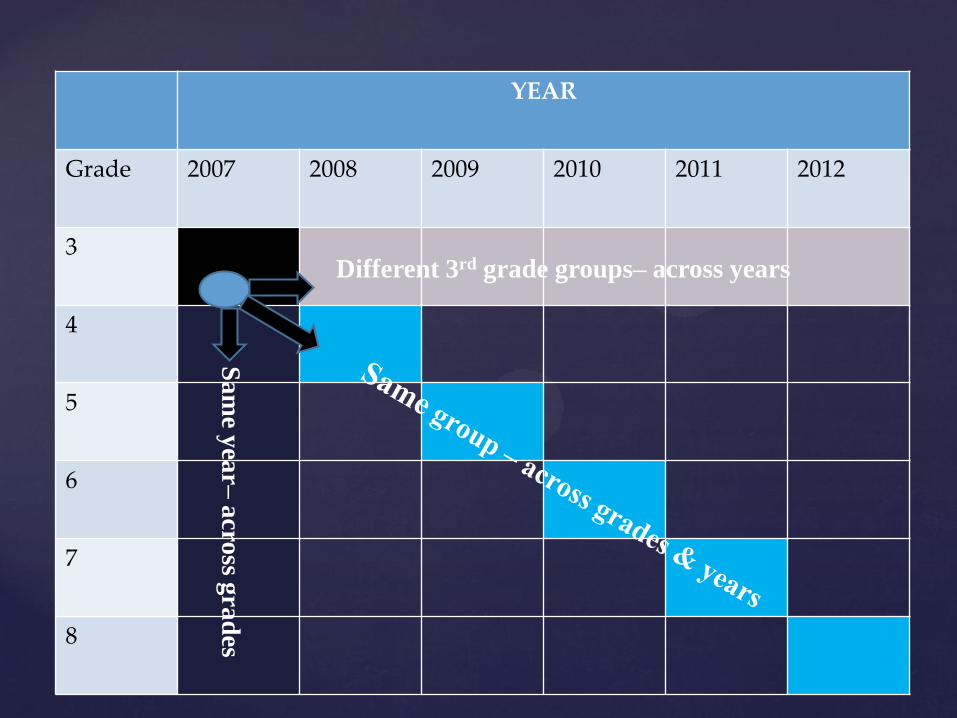
YEAR
Grade 2007 2008 2009 2010 2011 2012
3
4
5
6
7
8
Different 3rd grade groups– across years
Sa
me y
ear–
acro
ss gra
des

Achievement Growth in Connecticut
CT vertical scales in use since 2008
Math grades 3-8
Reading/Language Arts grades 3-8
Growth model based on the vertical scale
Incorporates vertical scale and achievement levels
Offers school-level performance projections
Assigns achievement growth targets to each student, school, and district
Reports success in achieving growth targets

Gain Score Targets: Three Step Model
459
430
483
510
534
Below Basic
Basic
Proficient
At/Above Goal
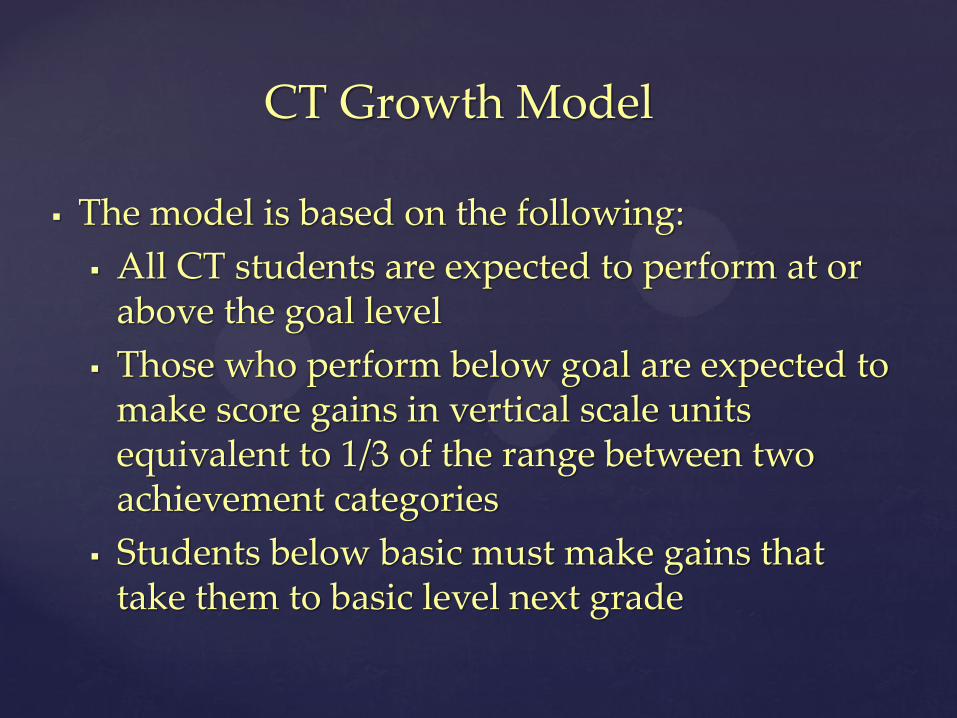
CT Growth Model
The model is based on the following:
All CT students are expected to perform at or above the goal level
Those who perform below goal are expected to make score gains in vertical scale units equivalent to 1/3 of the range between two achievement categories
Students below basic must make gains that take them to basic level next grade
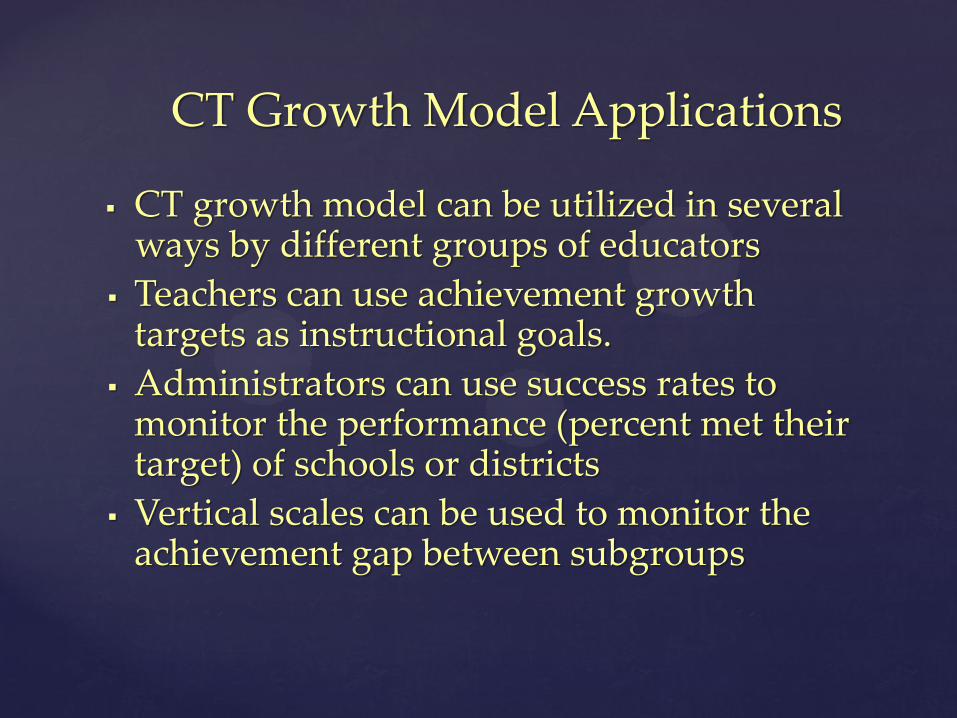
CT Growth Model Applications
CT growth model can be utilized in several ways by different groups of educators
Teachers can use achievement growth targets as instructional goals.
Administrators can use success rates to monitor the performance (percent met their target) of schools or districts
Vertical scales can be used to monitor the achievement gap between subgroups

At/Above Goal
Basic
Below Basic
GROWTH IN MATHEMATICS ACHIEVEMENT: 2007-2012 ALLIANCE DISTRICTS AND THE REST OF STATE

CT hopes to continue this growth
model with SBAC assessments in the
next generation