Embed Size (px)
Citation preview

University of South Carolina University of South Carolina
Scholar Commons Scholar Commons
Theses and Dissertations
Spring 2020
Computational Tools for Analyzing Correlations Between Computational Tools for Analyzing Correlations Between
Microbial Biological Diversity and Ecosystems Microbial Biological Diversity and Ecosystems
Behzad Torkian
Follow this and additional works at: https://scholarcommons.sc.edu/etd
Part of the Environmental Health Commons
Recommended Citation Recommended Citation Torkian, B.(2020). Computational Tools for Analyzing Correlations Between Microbial Biological Diversity and Ecosystems. (Doctoral dissertation). Retrieved from https://scholarcommons.sc.edu/etd/5922
This Open Access Dissertation is brought to you by Scholar Commons. It has been accepted for inclusion in Theses and Dissertations by an authorized administrator of Scholar Commons. For more information, please contact [email protected].

COMPUTATIONAL TOOLS FOR ANALYZING CORRELATIONS BETWEEN MICROBIAL BIOLOGICAL DIVERSITY AND ECOSYSTEMS
by
Behzad Torkian
Bachelor of Science University of South Carolina, 2009
Master of Science
Florida Institute of Technology, 2012
Submitted in Partial Fulfillment of the Requirements
For the Degree of Doctor of Philosophy in
Environmental Health Sciences
Arnold School of Public Health
University of South Carolina
2020
Accepted by:
Sean Norman, Major Professor
Cai Guoshuai, Committee Member
Phil Moore, Committee Member
Amir Karami, Committee Member
Cheryl L. Addy, Vice Provost and Dean of the Graduate School

ii
© Copyright by Behzad Torkian, 2020
All Rights Reserved.

iii
Dedication
To my wife, Bita, and my puppy Theia. I also dedicate this dissertation to my many
friends and family who have supported me throughout the process, and without them, this
work would have been completed two years earlier.

iv
Acknowledgement
I wish to thank the members of my dissertation committee: Sean Norman, Cai
Guoshuai, Phil Moor, and Amir Karami for generously offering their time, support, and
guidance. I also acknowledge the Norman lab & Research Cyberinfrastructure staff at the
University of South Carolina for computational support.
v
Abstract
Metagenomics has developed into a reliable mechanism to analyze microbial
diversity of microbial communities in the recent years. Through the use of next-generation
sequencing, metagenomic studies can generate billions of short sequencing reads that are
processed by computational tools. However, with the rapid adoption of metagenomics, a
large amount of data has been produced. This high level of data production requires the
development of computational tools and pipelines to manage data scalability and
performance. In this thesis, we developed several tools that will aid in the exploration of
the large amount of DNA sequence data, and we further developed a bioinformatic pipeline
that will enhance the use of the developed tools by researchers with minimum
computational background while also making them available for widespread use across the
field of microbiology so that the research community can further contribute to development
of these tools to overcome the growing computational challenges resultant from continued
technological advances in high throughput DNA sequencing.

vi
Preface
Humans' influence on the environment is one of the biggest threats to
environmental health and human public health. The issue requires urgent action to
understand and control these changes effectively. In the last few years, advancements in
the field of metagenomics have enabled researchers to address more complex biological
questions which have resulted in a deeper understanding of many of the ongoing ecological
changes and the possible larger downstream effects of these changes. Through the use of
next-generation DNA sequencing methodology, genomics studies can generate millions of
short sequence reads that are produced by environmental samples collected over time. Such
large quantities of data require the development of computational tools and pipeline to
manage the data scale and performance. In this thesis, we introduce several tools to help
researchers perform a study on the sequences. Also, we introduce a pipeline that can assist
researchers in bringing our tools and other tools developed by the scientific community
together in order to successfully analyze the correlation between microbial and biological
diversity of an ecosystem.

vii
Table of Contents
Dedication .......................................................................................................................... iii
Acknowledgement .............................................................................................................. iv
Abstract ................................................................................................................................ v
Preface ................................................................................................................................ vi
List of Tables ................................................................................................................... viii
List of Figures ..................................................................................................................... ix
List of Abbreviations .......................................................................................................... xi
Chapter 1 Introduction ........................................................................................................ 1
Chapter 2 Blast-Qc: Automated Analysis Of Blast Results ................................................ 7
Chapter 3 Analyzing Correlations Between Microbial Biological Diversity And Ecosystems With The Application Of A Finite State Automaton Computational Model ................................................................................... 23
Chapter 4 Overall Thesis Conclusions: ............................................................................ 48
References ......................................................................................................................... 50

viii
List of Tables
Table 2.1: Addressing the issue with 'max_target_ seqs' ................................................. 16
Table 2.2: Range Functionality of BLAST-QC. ............................................................. 18
Table 2.3: Order Functionality of BLAST-QC. ................................................................ 19
Table 2.4: Threshold functionality of BLAST-QC. ........................................................ 20

ix
List of Figures
Figure 1.1 Timeline showing advances in microbial community studies from Leeuwenhoek to new generation sequencing ................................................... 6
Figure 2.2 Comparison of BLAST-QC to BioPerl v1 and v2 ........................................... 17
Figure 3.1 Example of application Config JSON .............................................................. 26
Figure 3.2 Example of parameter config JSON ................................................................ 27
Figure 3.3 Workflow from start to end .............................................................................. 30
Figure 3.4 Blast processing time across an increasing number of cores ........................... 32
Figure 3.5 Preprocessing of information through FASTQ split or FSA split, Bashwriter, and Parsemerge ................................................................................................. 33
Figure 3.6 Update version of workflow ............................................................................. 34
Figure 3.7 Taxa Chart Layer One ...................................................................................... 38
Figure 3.8 Heatmap Layer One ......................................................................................... 39
Figure 3.9 Taxa Chart Layer Two ..................................................................................... 40

x
Figure 3.10 Heatmap Layer Two ....................................................................................... 41
Figure 3.11 Taxa Chart Layer Three ................................................................................. 42
Figure 3.12 Heatmap Layer Three ..................................................................................... 43
Figure 3.13 Taxa Chart Layer Four ................................................................................... 44
Figure 3.14 Heatmap Layer Four ...................................................................................... 45
Figure 3.15 Taxa Chart Layer Five ................................................................................... 46
Figure 3.16 Heatmap Layer Five ....................................................................................... 47

xi
List of Abbreviations
BLAST ……………………………………………… Basic Local Alignment Search Tool
DNA……………………………….….………………………….. deoxyribonucleic acid
FSA ………………………………………………………...…... Finite-State Automaton
HPC ……………………………………………………...High-Performance Computing
HSP …………………………………………………………………….High Scoring Pairs
QC …………………………………………………………………………Quality Control
XML ………………………………………………………...eXtensible Markup Language

1
Chapter 1
Introduction
This thesis focuses on the tools and application of a workflow developed using a
finite state automaton model for computational analysis of correlations in the biodiversity
of microbial ecosystems under changes in quantifiable stresses and environmental
conditions. An understanding of the biodiversity and ecology of microbial life is
indispensable, as these organisms have a crucial role in environmental sustainability.
The microbiology of ecosystems is complex, and the multitude of respective
microbial taxa contained in these biomes reflect this vast complexity. In order to form an
understanding of such ecosystems, we need to assess what organisms are present in the
environment and what biological function they perform within it. These questions help us
to evaluate the taxonomic diversity of the ecosystem, in order to form a deeper
understanding of the function a taxon preforms within the ecosystem. This function is
defined by the role a taxon fills within the ecosystem and how interactions with other taxa
combine to produce biogeochemical cycles (Nazaries 2013) and other complexities in the
overall ecological environment (S. Weiman 2013). As a deeper understanding of these
principles is made, the overall role of different microbes and the impact of their interactions
across their community and ecosystem can be realized. To get a deeper understanding of
the role these microbial communities play in ecosystem function, observations should be
made across both temporal and spatial scale, in order to assess the changes in the

2
functionality of these communities with respect to differing environmental conditions and
stresses.
The increased capacity to explore the taxonomic and functional diversity of
microbial communities using a culture-independent, DNA sequencing-based methodology
is rapidly expanding our understanding of how microbial life mediates ecological
processes. A culture-independent approach is necessary to garner a complete understanding
of microbial taxonomic diversity as the vast majority of microbial life cannot be studied
using traditional culturing techniques (Smalla 1 Jan. 2004) . The DNA-Sequence analysis
methodology utilized in this proposal relies on the identification of microbial marker genes
that can be correlated to the taxonomy of the sequence. For example, various marker genes
and their sub-regions can be analyzed with targeted sequencing allowing for the taxonomic
identification of sequences. A notably well studied and reliable gene, the 16S rRNA gene,
is the phylogenetic marker gene used throughout the thesis. This gene is targeted
particularly, as it is widely regarded by researchers to be one of the most optimal genes
related to understanding microbial phylogenetic diversity and distribution (Srinivasan 6
Feb. 2015). This is because the 16S gene contains both conserved loci and regions of
comparative genetic diversity, allowing for classification of both distant and close
phylogenetic relationships. This behavior, along with the universal presence of the 16S
rRNA gene in both Archaea and Bacteria (Prokaryotic) life forms, aids in the ability to
analyze genetic relationships between a large variety of taxa (Srinivasan 6 Feb. 2015).
Having a modern and evolving knowledge of the toolsets available is critical to
effective and accurate results, and major advances in sequencing technology have made
sequencing large datasets of microbial genes more accessible for bioinformatic research.

3
Many next generation platforms for sequencing exist that are capable of accomplishing the
goals for this study, however, cost, accuracy, yield per run, read length and other factors
vary greatly, making the choice of sequencing technology critical to the success of genomic
research. The current industry leaders are well known platforms like Illumina’s HiSeq and
MiSeq systems, Ion Torrent’s Personal Genome Machine (PGM), and the Pacific
Biosciences RS. Out of these systems, Illumia’s MiSeq was selected for the entirety of
genomic research performed, as it has established itself as a competitive platform when
compared to systems within and outside of the Illumina family of sequencers (Illumina Inc
2nd. 2013). Illumina’s MiSeq currently allows sequencing at relatively low cost and
turnaround times whether the sequencing is focused on whole genome sequencing or
targeted sequencing (Illumina Inc 2nd. 2013).
With advancements in the sequencing and data-collection technology,
metagenomics in general has become more comprehensive and datasets increasingly larger.
Analysis of these extensive datasets takes greater amounts of time and computational
resources, requiring novel approaches to optimization and efficient data-processing. The
application of a finite state automaton (FSA) model within the workflow helps to remove
tedious, manual methods of pre-processing, minimizing the processing time needed for
large sequence datasets. This is accomplished by the use of various discrete states that
compartmentalize processes and facilitate the transfer of data between them. With
optimizations such as parallelization of processes and the application of abstraction to
separate the user from manual input to subprocesses, our newly developed FSA workflow
creates a seamless pipeline that provides complete automation of genetic sequence analysis
and can be implemented for research purposes. In this pursuit, several tools have been

4
established and tested using a model ecosystem that undergoes both press and pulse
ecological disturbances (Preisner 2016).
The purpose of the development of workflows and tools is not to necessarily create
any additional steps, but instead to greatly optimize the turnaround time of existing
methods by automating all stages that require manual interventions. An increased
consistency of the resulting datasets is another benefit of automating bioinformatic
workflows as tedious operations and adjustments are made through a reliably programed
pipeline thereby reducing any potential operator error. New techniques for optimizing the
speed and reliability of dataset processing have been developed, producing ever more
efficient pipelines. A single workflow solution is utilized for the downstream processing
and analysis of sequences, with the goal being an increase in the rate at which large
sequence datasets can be processed. With the usage of parallel processing in a MapReduce
format, we achieve distribution of the system load across numerous cores (Ghemawat
2004). The workflow is separated into two independent sections, where tasks are
compartmentalized into small stages, each managed by a variety of programs and tools that
are used to determine the phylogeny and functionality of the microbial community in this
environment. With the application of real bioinformatic sequence data (Preisner 2016), we
establish our finite state automaton’s superior runtime compared to existing workflow
solutions developed, and we demonstrate its effectiveness in processing large sets of
genetic sequence data.

5
Current Solutions:
The need for metagenomic analysis platforms introduces automated workflows for
various processing goals, and integrating tools in the form of services, operative inside
processing pipelines. This has resulted in the development of multiple pipelines dedicated
to metagenomic data. However, the exploitation of technologies in metagenomic analysis
and computational challenges have limitations of similar solutions and developed
workflows.
The current bioinformatic workflow is attempting to take up the challenge of
analyzing a metagenomic sequencing dataset which includes the following tools: CloVR-
metagenomics (Angiuoli n.d.), Galaxy platform (metagenomics pipeline) (Giardine n.d.)
(Kosakovsky Pond 2009), IMG/M (V. M. Markowitz 2014) (V. M. Markowitz 2008),
RAMMCAP (Li 2009), and SmashCommunity (Arumugam 2010).
To utilize each metagenomic workflow, we take into account the range of features
each workflow introduces, the level of complexity of its installation and the limit on
integration to other tools and high-performance computing. We realize the community
needs for FSA to settle these concerns.

Figure 1.1: Timeline showing advances in microbial community studies from Leeuwenhoek to new generation sequencing
6

7
Chapter 2
Blast-Qc: Automated Analysis Of Blast Results
Abstract:
The Basic Local Alignment Search Tool (BLAST) from NCBI is the preferred
utility for sequence alignment and identification for bioinformatics and genomics research.
Among researchers using NCBI’s BLAST software, it is well known that analyzing the
results of a large BLAST search can be tedious and time-consuming. And with the recent
controversy over the effects of parameters such as ‘-max_target_seqs’ on the BLAST
heuristic search process, the use of these filter options are ill-advised. This leaves using a
stand-alone parser as one of the only options of condensing these large datasets. While
there are a few available for download online, the task is mainly left to the researcher to
create a specialized piece of software anytime they need to analyze BLAST results. The
need for a streamlined and fast Python script that solves these issues and can be easily
implemented into a variety of bioinformatics and genomics workflows was the initial
motivation for developing this software

8
Results:
In this study, we demonstrate the effectiveness of our developed software, BLAST-
Quality Control (BLAST-QC), for the analysis of BLAST results and its desirability over
other available options. BLAST-QC implements both the ability to provide a tabular
conversion of the dataset, the ability to input various filters to narrow results to the highest
quality sequences, as well as support for both protein and nucleotide databases. Applying
real sequence data from our workflows, we establish the superior runtime of BLAST-QC
when compared to existing parsers developed with commonly used BioPerl modules. We
demonstrate the flaw in the application of the ‘max_target_seqs’ parameter of the BLAST
software and the ability of our software to provide the functionality this parameter was
assumed to produce. Executions of the script on example datasets are given, demonstrating
the implemented functionality and providing use-cases of the program. BLAST-QC is
designed to be integrated into existing software, and we establish its effectiveness as a
module of workflows or other processes.
Conclusions:
BLAST-QC provides the community with a simple and lightweight Python script
that allows for easy quality control of BLAST results while avoiding the drawbacks of
other options. This includes the uncertain results of applying the -max_target_seqs
parameter or relying on cumbersome dependencies like BioPerl, which add complexity and
run time when examining large data sets of sequences. BLAST-QC is ideal for use in high-
throughput workflows and pipelines common in bioinformatic and genomic research or
standalone process.
9
Background:
The Basic Local Alignment Search Tool (BLAST) from NCBI has been a popular
tool for analyzing the large data sets of genetic sequences that have become common when
working with new generation sequencing technologies. BLAST has been the preferred
utility for sequence alignment and identification in bioinformatics and genomics research
and workflows for almost 30 years (Altschul, et al. 1990). One of the main challenges for
researchers utilizing the NCBI BLAST is interpreting the huge amount of output data
produced when analyzing large numbers of input sequences. While BLAST does allow for
multiple output formats as well as filtering top hit results (using -outfmt and -
max_target_seqs respectively) (National Center for Biotechnology Information, US
National Library of Medicine 2018), for some purposes such as pushing results down a
workflow or pipeline, these tools may not be enough to ensure results that can be
meaningfully and reasonably interpreted. This is not to mention the recent controversy
raised about a possible bug in the functionality of the -max_target_seqs parameter that
threatens the accuracy of any results garnered while this parameter is active (Shah 2018).
While NCBI has published a response stating that the utility of this parameter is simply
misunderstood by the community and that the bug seen by Shah et al. was the result of
“overly aggressive optimization” introduced in 2012, and supposedly patched following
the release of BLAST+ 2.8.1 in 2018 (Madden 2018) (Cock 2015), follow up test cases
and posts have shown that this issue is much more complex than simply “BLAST returns
the first N hits that exceed the specified e-value threshold” (Cock 2015). This is because,
as was stated by Shah et al. (Shah 2018), the -max_target_seqs parameter is applied much
earlier in the search, before the final gapped alignment stage. This means that the use of

10
this parameter can change the number of sequences processed as well as the statistical
significance of a hit if using composition-based statistics (National Center for
Biotechnology Information, US National Library of Medicine 2018). This is contrary to
the popular assumption that the parameter is simply a filter applied post search (Raúl A
González-Pech 2019). As a result of the misinformation and confusion over ‘-
max_target_seqs’ and other intricacies of the BLAST heuristic search and filtering process,
there has been a push towards more detailed documentation of these processes and effects
of parameters on the BLAST algorithm (Raúl A González-Pech 2019). The field has also
moved towards better methods of narrowing the results of a large search, as opposed to
using BLAST parameters that may affect the actual search process. These methods include
resources like Bio-Perl that can be used to create scripts to parse and filter result files. A
few community written scripts are available, such as a Perl script created by Dr. Xiaodong
Bai and published online (v1) (Bai n.d.). While this script (and others like it) can potentially
be very useful for converting the long and convoluted BLAST XML results into a concise
tabular format, it does raise a few concerns and leaves much to be desired. First and most
importantly it creates dependencies on Perl and Bioperl modules which can be unwieldy
and slow for use in high-throughput workflows and pipelines, especially those built on a
modern python framework. Thus, the central motivation for the development of this
software was to create a dedicated piece of quality control software for use in workflows,
find a solution that solely utilizes Python 3, streamlines the process, and minimizes run
times for parsing large data sets of BLAST results. In addition, a need for increased
functionality was considered, particularly the ability to filter results by threshold values
input by the user. Even with an improved modified version of the previously mentioned

11
Perl script (v2) (Bai n.d.) (Preisner 2016), only a bit-score threshold was implemented.
Lastly, as is common when using community parsers found online, an error may occur
wherein the script results in a query frame value of 0 for every hit reported. Our team
sought to correct this and other errors and to provide a verified solution that can be soundly
applied for research purposes.
Implementation:
The BLAST-QC script implements thresholds on e-value, bit-score, percentage
identity, and the level of detail in the definition of a hit (<hit_def> in BLAST XML results).
It is also possible for the user to choose which of these values the output should be ordered
by and how many top matches should be returned per query sequence in the input. Further,
the Python script is also capable of setting a range on these values and selecting the
sequences that produced a more detailed definition within that range. This is useful for
researchers because it avoids the problem of finding a high scoring sequence that provides
no real relevant information, as there is minimal value in knowing that a hit accurately
matches an unknown sequence. Increased definition information is useful for narrowing
the taxonomy of a species or the type/functionality of a protein sequence. We also found
an issue regarding the number of HSPs (high scoring pairs) per hit as in some cases BLAST
may return multiple HSPs per hit sequence, and the BLAST-QC script handles this by
considering it a separate hit that retains the same id and definition. This case was not
covered in any of the scripts encountered online. The BLAST-QC Python script is
compatible with every BLAST type (BLASTP, BLASTN, BLASTX, etc.) and reports all
relevant hits produced in a BLAST XML results file: query name, query length, accession
number, subject length, subject description, e-value, bit-score, query frame, query start,

12
query end, hit start, hit end, percent identity, and percent conserved. Information on these
values can be found in the BLAST glossary and manual (Fassler 2011) (National Center
for Biotechnology Information, US National Library of Medicine 2018), and the two
percentage values (percent identity and percent conserved) have been calculated using the
identity (Hsp_identity), positive (Hsp_positive) and align length values (Hsp_align-len).
Percent identity is defined as the percent of the sequences that have identical residues at
the same alignment positions and is calculated by the number of identical residues divided
by the length of the alignment multiplied by 100 (100*(hsp_identity/hsp_align-len)).
Percent conserved (positive) is defined as the percent of the sequences that have ‘positive’
residues (chemically similar) at the same alignment positions and is calculated by the
number of positive residues divided by the length of the alignment multiplied by 100
(100*(hsp_positive/hsp_align-len)).
Results:
The objective of the development of BLAST-QC was to provide BLAST users with
a method of quality control that ensures accuracy of results, posts superior runtimes, and
provides configurations for many types of analysis processes. In order to establish BLAST-
QCs effectiveness as compared to other quality control options, we demonstrate the ability
of BLAST-QC to correct the issue with `max_target _seqs`, using the dataset provided in
the case study from Shah et. al (Shah 2018). This dataset is available on Shah’s github
page, ‘https://github.com/shahnidhi/BLAST_maxtargetseq_analysis’. As shown in figure
1, BLAST-QC was able to correctly identify the lowest e-value hit for the same query
sequence while BLAST with ‘-max_target_seqs=1’ was not. This result illustrates the
potential for errors to be introduced into BLAST data by the use of this parameter, and we

13
encourage researchers to seek more information on its usage and application (Fassler 2011)
(Raúl A González-Pech 2019). To use BLAST-QC to replicate the function of ‘-
max_target_seqs’ leave the parameter set to default while using BLAST to locate matching
sequences, then run BLAST-QC on the resulting data, ordering output by e-value and
setting a limit of 1 hit per query using the syntax shown in Figure 1. We also demonstrate
the faster runtime of BLAST-QC as compared to existing parsers developed with the
commonly used BioPerl modules. All runtime data was gathered using a system with a 28
core Intel Xeon E5-2680 @ 2.4GHz and 128GB of RAM. The original Bioperl script (v1)
(Bai n.d.) does not provide quality control functionality and simply functions as an XML
to tabular format converter for BLAST results, while the amended Bioperl version (v2)
(Preisner 2016) implements a bit-score threshold and support for both protein and
nucleotide databases. BLAST-QC implements both the ability to provide a tabular
conversion of the dataset, the ability to input various filters to narrow results to the highest
quality sequences, as well as support for both protein and nucleotide databases. These two
scripts were chosen for comparison as they replicate two of the possible use cases for
BLAST-QC, direct tabular conversion of results or the application of filtering thresholds
to provide quality control. Figure 2A plots number of query sequences against runtime for
all three programs using the same dataset of BLAST result files, which were produced
using the ‘max_target_seqs’ parameter. This figure shows the potential of all the programs
to perform a basic parse of the results, without QC, converting the format from XML to a
tabular format. Figure 2B illustrates the application of query sequences against runtime for
all three programs using the same dataset produced with no ‘max_target_seqs’ value set,
to demonstrate the runtime while providing QC filtering to the datasets. Not only was

14
BLAST-QC consistently faster than both Bioperl scripts, but as depicted in figure 2B, the
application of filtering values did not significantly increase the runtime of the script. This
is contrasted by the large difference between the runtimes of the two Bioperl versions, even
though they are both developed from the same base BioPerl (v1) script. This increase in
runtime, over 14.55x more time per query sequence, is the result of the addition of simple
quality control values to the program, while BLAST-QC had an increase in runtime of only
1.036x with the introduction of filtering. This contrast of the effect of implementing
filtering values into the quality control processes demonstrates the inefficiency of the
BioPerl software as opposed to a pure Python 3 framework. To further demonstrate this
inefficiency, figure 2C shows the normal distribution of runtimes of BLAST-QC and the
BioPerl v2 script while providing QC to a large data set of BLAST results. The Bioperl
(v1) script was not included as it provides no QC functionality. The BLAST-QC Python
script running on Python 3.6.5 was, on average, over 4x faster per query sequence than the
Bioperl (v2) script running on Perl v5.16.3 [Figure 2C]. Additionally, BLAST-QC was
more consistent, with a standard deviation from the mean run-time of 3.92 (s) as opposed
to a standard deviation of 13.22 (s) for the Bioperl (v2) script. This demonstrates that not
only does BLAST-QC produce consistently shorter runtimes, but that BLAST-QC is able
to handle large datasets more efficiently, as shown by the consistency of the runtimes in
Figure 2C and the small magnitude of the change in BLAST-QC runtimes with an
increasing query number as depicted in figures 2A and 2B. In figures 3-5, we demonstrate
some of the various functionalities of BLAST-QC and provide the results of their
application to a sample dataset. In figure 3, the range functionality is demonstrated using
an e-value range of .0005. This means that BLAST-QC will consider hits found that fall

15
within the range of the lowest e-value hit, if the target sequence provides an increase in the
quality of the hit definition. As shown in figure 3, the sequence hit identified by simply
returning the lowest e-value hit (command 1) provides a definition that may not be useful
for further analysis, while the top hit using a range value (command 2) provides an
insightful description of the sequence while maintaining a reasonable e-value. In BLAST-
QC, range values are implemented on e-value, bit-score, and percent identity. Figure 4
depicts the ordering functionality of BLAST-QC. This script is capable ordering by e-
value, bit-score, percent identity, and hit definition. For example, when ordering by
definition (command 1), as in figure 4 the hit that has the highest quality of hit definition
that fits input thresholds will be returned, while ordering by percent identity (command 2)
returns the hit with the highest matching identity. Furthermore, figure 5 demonstrates the
threshold capability of the BLAST-QC program. The first sequence is returned when
ordering by e-value (command 1) with the number of hits set to one (replicating
max_target_seqs). The second employs a bit-score threshold (command 2) to find a
matching sequence with the highest e-value that also has a bit-score above the threshold.
Threshold values are implemented on e-value, bit-score, percent identity and hit definition.
All of the resources needed for the BLAST-QC software are available for download from
the BLAST-QC GitHub repository: https://github.com/torkian/blast-QC. Additional test-
cases and usage information for the program along with all sample datasets used in this
paper are located on the page as well.

16
Table 2.1: Addressing the issue with 'max_target_ seqs': BLAST-QC was able to correctly identify the lowest e-value hit for the same query sequence while BLAST with ‘-max_target_seqs=1’ fails to identify the best hit. This issue was observed using three different sequences as input into a blastn search with (command 1) and without (command 2) ‘max_target_seqs=1’
Command One: blastn -query infile.fasta -out outfile.xml -max_target_seqs 1 >> BLAST-QC.py -f outfile.xml -t n Command Two: blastn -query infile.fasta -out outfile.xml >> BLAST-QC.py -f outfile.xml -t n -n 1 or e Sequence One: S50_7242:pb_10cov_000M-001M Sequence Two: S208_335:pb_10cov_001M-002M Sequence Three: S216_4030:pb_10cov_001M-002M
Seq. ID Max_Seq(BLAST) Num_Hits(QC) E-value(BLAST) Hit Definition (BLAST)
Command One: Sequence One 1 - 2,40E-135 s_15833:COG0185 Command Two: Sequence One - 1 0 s_1013:COG0088 Command One: Sequence Two 1 - 5,90E-164 s_6114:COG0087 Command Two: Sequence Two - 1 0 s_9883:COG0088 Command One: Sequence Three 1 - 2,33E-145 s_401:COG0088 Command Two: Sequence Three - 1 0 s_9886:COG0090
16

Figure 2.2: Comparison of BLAST-QC to BioPerl v1 and v2. A) Number of query sequences vs runtime (seconds) for all programs using the same dataset of BLAST result files, which were produced not using the ‘max_target_seqs’ parameter; B) Number of query sequences vs runtime (seconds) for all programs using the same dataset of BLAST result files, which were produced using the ‘max_target_seqs=1’ parameter; C) BLAST-QC vs BioPerl v2 Script runtime distribution, BLAST fails with max_traget_seqs to find the lowest E-value. Blast-QC corrects the issue.
17

Table 2.2. Range Functionality of BLAST-QC. The range functionality (command 2) is demonstrated using an e-value range of .0005 and compared to the result of no range functionality (command 1). Command 2 directs BLAST-QC to consider hits found that fall within the range of the lowest e-value hit, if the target sequence provides an increase in the quality of the hit definition
Command One: BLAST-QC.py -f outfile.xml -t p -n 1 -or e Command Two: BLAST-QC.py -f outfile.xml -t p -n 1 -or e -er .0005 Sequence One: M01535:64:000-AYEHH:1:1101:12986:1498
Seq. ID Hits_QC E-Value
Range (QC) Order By
(QC) E-value
(BLAST) Bit-score (BLAST) Hit Definition(BLAST)
Command One:
Seq One 1 N/A E-Value 0.0015 32.4
protein of unkown function DUF1680
Command Two:
Seq One 1 0.0005 E-Value 0.002 45.5
efflux RND transporter permease subunit …
18

Table 2.3. Order Functionality of BLAST-QC. Command 1 directs BLAST-QC to return the hit that has the highest quality of hit definition that fits input thresholds while command 2 directs the script to return the hit with the best matching identity.
Command One: BLAST-QC.py -f outfile.xml -t p -n 1 -or d
Command Two: BLAST-QC.py -f outfile.xml -t p -n 1 -or i
Sequence One: M01535:64:000-AYEHH:1:1101:12986:1498
Seq. ID Hum_Hits(QC) Order By (QC) E-value
(BLAST) Percent Identity Hit Definition(BLAST)
Command One: Sequence One 1 Definition 0,002 57,80% protein of unkown function
DUF1680
Command Two: Sequence One 1 Percent Identity 0,023 94,70% efflux RND transporter
permease subunit
19

Table 2.4. Threshold functionality of BLAST-QC. Command 1 directs the script to return the best hit to sequence one when ordering by e-value with the number of hits set to one (replicating max_target_seqs). Command 2 further employs a bit-score threshold to find the matching sequence with the highest e-value that also has a bit-score above the threshold. Threshold values can be implemented on e-value, bit-score, percent identity and hit definition.
Command One: BLAST-QC.py -f outfile.xml -t p -n 1 -or e
Command Two: BLAST-QC.py -f outfile.xml -t p -n 1 -or e -b 60
Sequence One: M01535:64:000-AYEHH:1:1101:12986:1498
Seq. ID Hum_Hits(QC) Bit-score
Threshold (QC) Order By
(QC) E-value
(BLAST) Bit-
score(BLAST) Hit Definition(BLAST)
Command One: Sequence One 1 N/A E-Value 0,0015 32,40 protein of unkown function DUF1680
Command Two: Sequence One 1 60 E-Value 0,005 66,50 efflux RND transporter
permease subunit …
20

21
Discussion:
BLAST-QC was developed using Python 3, and is designed for usage within a
script or larger workflow, but also offers a headless command-line interface for use with
smaller datasets. Usage information has been documented in this paper, and additional
documentation can be found in the BLAST-QC GitHub repository, at
https://github.com/torkian/blast-QC. With this script, we seek to initiate an approach to
standardize researchers’ analyses of BLAST result datasets. Most researchers opt to apply
‘max_target_seqs’ as their only quality control parameter (over 400 Google Scholar papers
reference the value (Giolai 2017) (Long n.d.) (Jacquelyn S. Meisel n.d.), even though it has
been shown that this parameter can cause issues with the search process and resulting data.
Those who use a standalone script are exchanging gains in the accuracy of results and
greater functionality and control over parameters for increased bulk and runtime, which
add up when running large datasets of sequences. While there are other quality control and
filtering options available for BLAST results, BLAST-QC takes a novel approach to the
task, removing the necessity for other dependencies and allowing the user to have greatly
increased control over the quality of their results, along with greatly decreased runtimes
when compared to existing QC options. We encourage the community to consider available
options when seeking analysis of BLAST results, and to contribute to and improve on our
source code by submitting a pull request on the BLAST-QC GitHub page.
Conclusions:
BLAST-QC provides a fast and efficient method of quality control for NCBI
BLAST result datasets. It offers greater functionality for controlling the desired QC

22
parameters when compared to existing options and outperforms them in terms of runtime.
We suggest that it is the BLAST-QC Python 3 framework that allows it to outperform
dense BioPerl modules, while also providing more seamless integration into larger
workflows developed with Python. With the increase in popularity of high-performance
computing and new generation sequencing, novel approaches to BLAST quality control
and other bioinformatic computational processes are needed to handle the increasing size
of datasets, but also to take advantage of the increasing capacity of HPC to provide
computational solutions to these problems. We also sought to increase awareness of the
controversy surrounding the application of the ‘max_target_seqs’ parameter in BLAST,
and to provide a sound solution that replicates the function of the parameter and ensures
the highest quality results.
Availability and requirements:
- Project name: BLAST-QC
- Project home page: https://github.com/torkian/blast-QC
- Operating system(s): Platform independent
- Programming language: Python 3
- Other requirements: None.
- License: MIT License
- Any restrictions to use by non-academics: None.

23
Chapter 3
Analyzing Correlations Between Microbial Biological Diversity And
Ecosystems With The Application Of A Finite State Automaton
Computational Model
Abstract:
The use of genetic sequencing technology to study biological diversity in
microbiomes and ecosystems comes with many challenges. With many different data
formats and numerous tools available to the community for bioinformatics research
purposes, it can be hard for researchers to determine which applications best fit their needs.
With many of the requisite tools implemented in various programming languages like R,
Python, and Perl, keeping track of each applications’ dependencies and providing
interfaces between them becomes a major time-consuming factor during research, and the
difficulties encountered have the potential to introduce errors into the research process.
Furthermore, recent advancements in sequencing technology have greatly increased the
volume of sequence data that is available to researchers, allowing for more high-quality
results, but requiring a higher computational overhead. With limited support for high-
performance computing (HPC) among these bioinformatic tools, it becomes almost
unfeasible to utilize them in combination with these substantial datasets.

24
Result:
Here we describe a software project that allows for the analysis of correlations
between microbiological diversity and changes within ecosystems. This was accomplished
with the use of Python 3 to implement a finite-state automaton (FSA) computational model.
The application provides easy integration with external bioinformatic tools and high-
performance computing software, providing user control of dependencies, increased
reproducibility of results, and greatly reduced computational times.
Introduction:
Our approach to bioinformatic analysis of microbial ecology begins with a
fundamental pattern in computer science, the use of a finite state machine configuration to
encapsulate the processes of sequence analysis into a series of sequential tasks, where each
task initiates a distinct downstream event. This approach provides a significant advantage
compared to existing bioinformatic workflows, as many contemporary solutions are
tailored for a single specific task; any small customization made often requires significant
rework of the architecture in order to implement the desired functionality. With the
encapsulation of complex processes into discrete steps, we provide researchers with the
ability to curate the execution of each process individually, as well as to extend the overall
workflow with additional steps/states. Designing a state machine for ease of use and
extendibility is a difficult task since most bioinformatics tools require the need for
significant configuration and rely on various dependencies. Moreover, as the scope and
focus of research change, there will always be modifications required to the configuration

25
of the workflow processes. We must anticipate changes and configuration options that will
likely be required by researchers as the focus of their research evolves over time.
In this chapter, the implementation of the FSA pipeline is outlined, and its
applications to facilitating bioinformatics research are discussed. We further note the ease
of integration with a large number of tools and detail concerns of scalability. We end by
discussing how FSA and Python can be utilized together in order to produce more flexible,
open and reproducible analyses.
Implementation:
Our workflow design is implemented as a FSA. In general, a finite state machine is
a computational model in which a device can be in one of a number of predefined states at
a given time, and changes state based on the input provided. Each step in our workflow
processes data and the result of this processing causes the progression to the next state of
the workflow. This continues until the workflow reaches a predetermined final state or, in
the case of a process failure, enters an error state that acts as a checkpoint in the process.
This allows for ease of error identification and correction.
Our workflow state machine can be summarized as below:
• An initial state triggers the start of the processes.
• A set of input events are passed to the current state.
• The set of inputs is processed within the current state resulting in a new set
of events.
26
• The set of new events is then passed to the next state to be processed.
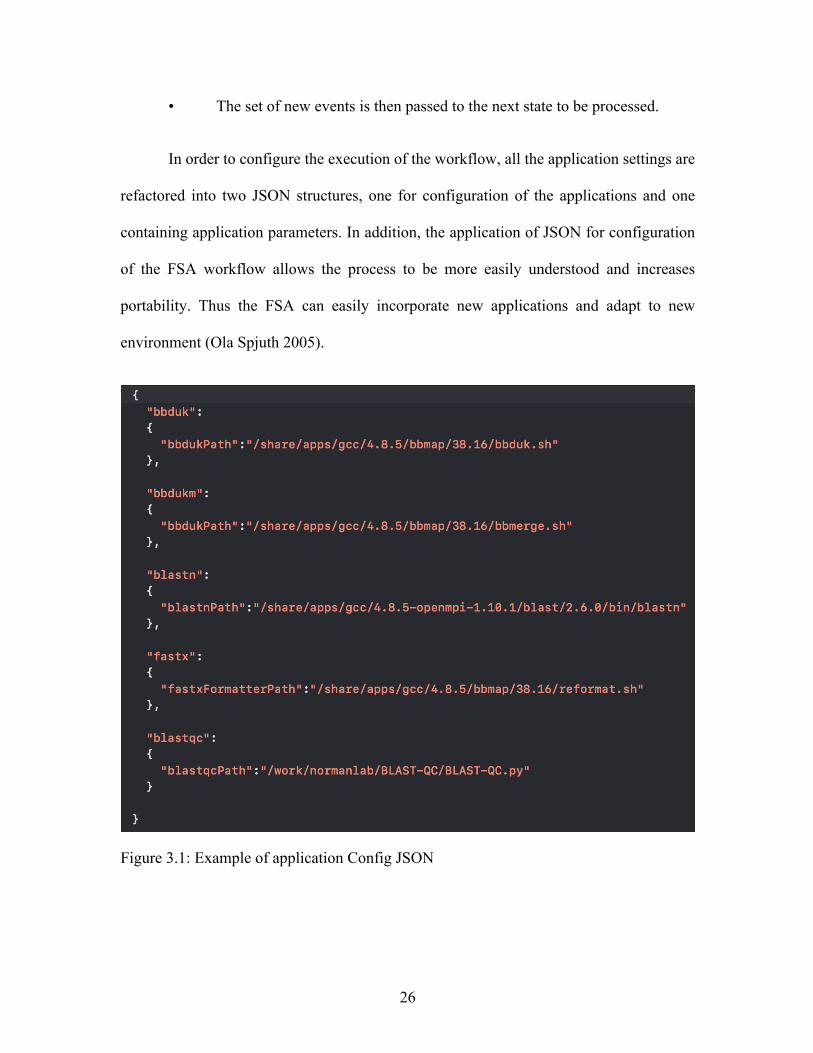
In order to configure the execution of the workflow, all the application settings are
refactored into two JSON structures, one for configuration of the applications and one
containing application parameters. In addition, the application of JSON for configuration
of the FSA workflow allows the process to be more easily understood and increases
portability. Thus the FSA can easily incorporate new applications and adapt to new
environment (Ola Spjuth 2005).
Figure 3.1: Example of application Config JSON

27
Figure 3.2: Example of parameter config JSON
Another major issue with other contemporary bioinformatic workflows is the
mixture of different software architectures, increasing complexity and runtimes. Most
workflows utilize several different languages and/or third-party libraries in order to execute
a pipeline process. In order to solve this issue, a new set of basic tools was produced for
our workflow using Python version 3 in order to limit the number of dependencies from
the start. Researchers may introduce other software applications and/or programing
language to the workflow if they so choose. The FSA generates a script in each state in
order to facilitate debugging and marking checkpoints in the processing of job files.

28
New Python Tools:
1- Fasta Splitter: Splits a FASTA file into several small files containing a
specified number of sequences (limit).
2- Interleaving: Merges forward and backward reads of each sequence
3- UndoInterleaving: Unmerges the forward and backward reads of each
sequence
4- Mergeutil: Parses and combines the XML results of a BLAST database
search.
Finally, we detail the benefits of an FSA design for ease of use. In the next section,
we describe the method for creating a reusable FSA pipeline and explain how researchers
may expand on or remove functionality from the workflow.
Another significant issue for most existing workflows is that they are not
compatible with implementation on an HPC (High-Performance Computing) cluster, or
suitable for use on laptop computers. These limitations can cause configuration and the use
of workflows to be much harder and more time consuming for the researcher. Our
workflow only requires the researcher to have the configuration settings for the workflow
on a personal computer; after the configuration has been completed and validated, the
workflow may be executed on an HPC cluster where many more computational resources
may be allocated to the process. This significantly decreases the time needed to process
substantial bioinformatics datasets and allows for parallelization of the processes within a
given task, further improving the time needed for computation. Less time spent computing

29
results may even allow researchers to utilize more sequence data than they otherwise would
have considered, leading to more accurate results.
Another big disadvantage of current workflows is the lack of checkpointing
functionality. Checkpointing functionality is the capability of the workflow to halt its
processing if any errors are determined to have occurred in a step of the process, allowing
the user to determine the cause of the error, debug the process, and resume the workflow
without the need to start the entire workflow from the beginning, saving significant
processing time in the event of an issue. Even with more advanced workflows currently
available, such as the recently released Galaxy (Ola Spjuth 2005), there is no available
checkpointing functionality. Our workflow is able to provide a checkpoint for each
step/state of the process, and a script is generated at each step that can be run as a standalone
application in order to reproduce the results of any given state. This enables researchers to
backtrack to any given step in order to modulate or adapt the execution of the state, in order
to fix bugs in the process or produce the desired result.
Experiment:
In order to demonstrate the capabilities and ease of use of our workflow technique,
we adopted the finite state automaton model in one of our current research workflows. A
complete data set collected overtime was utilized for this purpose in order to create a
substantial challenge for the FSA model (Preisner 2016).
30
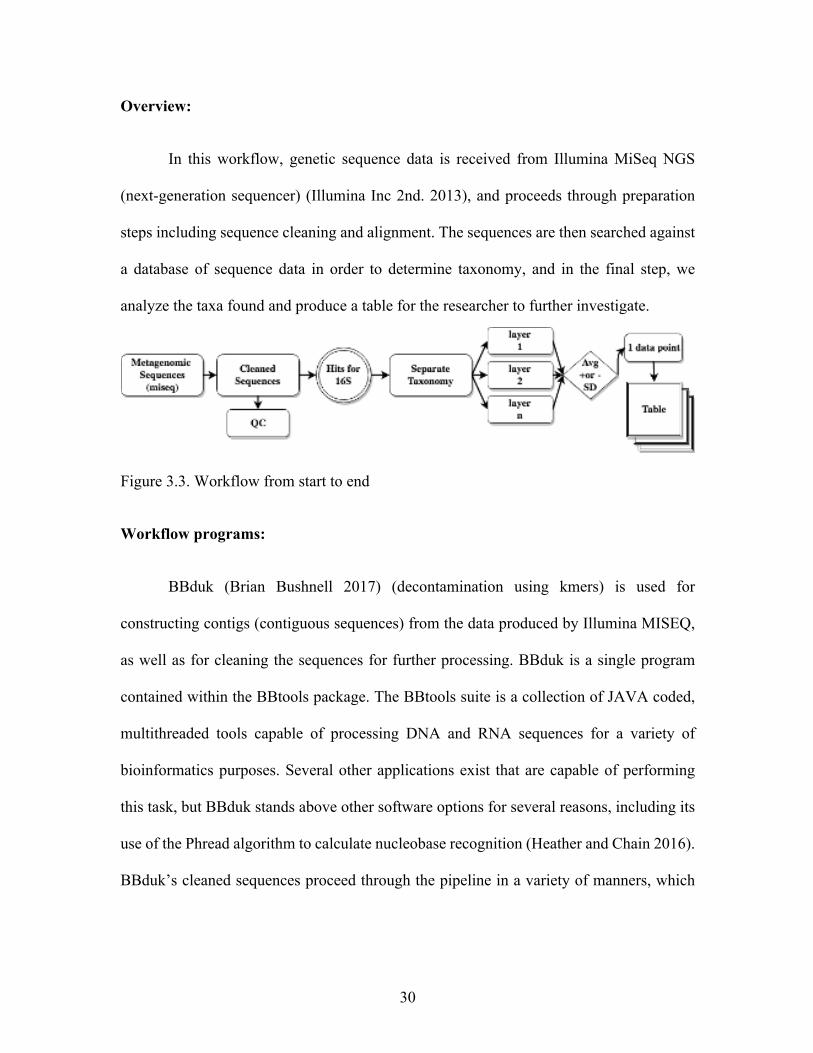
Overview:
In this workflow, genetic sequence data is received from Illumina MiSeq NGS
(next-generation sequencer) (Illumina Inc 2nd. 2013), and proceeds through preparation
steps including sequence cleaning and alignment. The sequences are then searched against
a database of sequence data in order to determine taxonomy, and in the final step, we
analyze the taxa found and produce a table for the researcher to further investigate.
Figure 3.3. Workflow from start to end
Workflow programs:
BBduk (Brian Bushnell 2017) (decontamination using kmers) is used for
constructing contigs (contiguous sequences) from the data produced by Illumina MISEQ,
as well as for cleaning the sequences for further processing. BBduk is a single program
contained within the BBtools package. The BBtools suite is a collection of JAVA coded,
multithreaded tools capable of processing DNA and RNA sequences for a variety of
bioinformatics purposes. Several other applications exist that are capable of performing
this task, but BBduk stands above other software options for several reasons, including its
use of the Phread algorithm to calculate nucleobase recognition (Heather and Chain 2016).
BBduk’s cleaned sequences proceed through the pipeline in a variety of manners, which

31
include metagenome assembly, Basic Local Alignment Search Tool (BLAST) (Fiers, et al.
1976) sequence database searching, and quality control.
One branch of the workflow relies on BLAST Nucleotide, also called BLASTN
[9]. This search method queries a given sequence file against nucleotide databases
containing previously determined matches in order to determine the taxonomy of the
species represented in the input sequence data. Within this section of the workflow, the use
of BLASTN allows for the identification of the 16S rRNA genes in the dataset. 16S rRNA
gene matches are produced by comparing sequences against an extensive SILVA database
(Hugenholtz, Goebel and Pace 1998). The matches are fragmented into smaller, more
manageable sized files to allow for job scheduling among HPC cluster machines to be more
effectively implemented. To make the disjointed output readable, the results are then
reassembled into a CSV file using a python coded section of the pipeline. BLAST is an
invaluable tool for bioinformatics research, but the scaling of BLAST processes for larger
datasets is difficult to do efficiently. Many applications such as Blast MPI (Altschul SF
n.d.), Blast GPU (Panagiotis D. Vouzis 2011), and Blast FPGA (Martin C. Herbordt 2007)
have been produced to try to resolve this issue, however, they all require special software
and/or hardware, and the output results are not as consistent or repeatable. With the
introduction of two new tools to the workflow, Bashwriter, and Parsemerge, BLAST
becomes exceedingly more effective. These programs have been implemented to allow the
running of BLAST using map-reduce, a processing model that allows for the parallelization
of computations. This exponentially decreases BLAST run time and allows us to take
advantage of HPC environments to scale our processes, all without requiring any special
hardware or software.

32
Bashwriter compartmentalizes the full sequence data file into smaller, more
manageable chunks through a process called mapping. This greatly increases the pace by
which sequences are classified using Basic Local Alignment Search Tool (BLAST) (Fiers,
et al. 1976), as many instances of BLAST can be run simultaneously, leading to greatly
increased efficiency as compared to a single instance of BLAST being responsible for
classifying a massive dataset in its entirety. By this principle, as the BLAST processes were
spread to a higher number of cores, the time to complete the computation was reduced
dramatically (Figure 3.4).
Figure 3.4. Blast processing time across an increasing number of cores
After the mapped subprocesses are finished running, they are reduced using
Parsemerge, an application which concatenates all the individual results into a single file.
This final result file is used to provide the taxonomy of the microorganism from which the
potential species can be determined.

33
Figure 3.5. Preprocessing of information through FASTQ split or FSA split, Bashwriter,
and Parsemerge
Finally, data analysis and visualization tools are used to produce graphs of the
results from each layer.
Experiment:
The specific ecological environment (ecosystem) studied in this research is a hyper-
saline coastal lagoon system located on San Salvador Island, The Bahamas. This lagoon
system, called Salt Pond, hosts a diverse ecosystem of microbial life forms (Shade, et al.
2012) (Preisner 2016). Most of the microbial communities found in this ecosystem are
located on the surface of the sediment in the form of a well-structured and consolidated
biofilm system known as a microbial mat. While microbial mats provide niches for all
domains of life, this study centers primarily on the archaeal and bacterial communities
present in these ecosystems. The mats are subject to pulse events, such as tropical storms
or hurricanes, and press events, like climate and seasonal change, and the corresponding

34
changes in environmental conditions force the communities within the mats to adapt
accordingly. This constant gradual shift in the environment occurs in all ecosystems due to
numerous environmental, chemical, and physical factors (Preisner 2016) (Shade, et al.
2012). One of the most significant of these factors within this particular ecosystem is
salinity. Changes in the salinity of the environment result in disturbances in the ecosystem
that may greatly enhance or inhibit the potential for microbial life, and quantifying the
effect of salinity on this ecosystem is a central part of this study (Preisner 2016).
A long-term study was performed of the Salt Pond ecosystem, which included a
sampling of the microbial mats at eight separate time points, each with varying
environmental conditions, over a four-year time period. The purpose of this data collection
was to gain knowledge of the microbial community’s response to various press and pulse
disturbances over this duration. Microbial mat samples were collected directly from Salt
Pond and separated into a depth profile ranging from the surface (layer 1) to 10 mm (layer
5). From the microbial mat layers, nucleic acids were extracted, and sequencing of the
genetic data was performed using the Illumina MISeq NGS. The resulting sequences were
downloaded from the sequencer and passed through our FSA workflow.The updated
workflow after the addition of these new tools [BLAST QC] is shown in Figure 3.6.

Figure 3.6. update version of workflow
35

36
Conclusion:
With advancements in both sequencing and data-collection technology (Escobar),
the fields of metagenomics and bioinformatics have become more complex, and the
datasets used in research are becoming increasingly larger. Analysis of these extensive
datasets takes greater amounts of time and computational resources, requiring novel
approaches to efficient computation and data-processing. A majority of the currently
available workflows and applications for bioinformatic analysis do not meet the standards
necessary for the effective processing of these datasets, with many requiring outdated
software technology and unmanageable dependencies that dramatically increase the time
required for analysis. Those who wish to create their own workflows or pipelines for
research purposes must filter through the countless bioinformatic programs and tools
available in order to find what they require, and are then left with the task of providing
interfaces between the various programs, each of which may be implemented in different
languages and require separate dependencies. The goal of this software project is to solve
common issues encountered by researchers who utilize these software tools, improve on
the capabilities and functionality of these tools, and to facilitate the researcher’s ability to
both modify and extend the processes of the workflow to fit their needs. This was
accomplished with optimizations such as the application of a finite state automata
computational model to encapsulate complex tasks into discrete states, the parallelization
of processes, and the application of abstraction to separate the user from manual input to
subprocesses, our FSA workflow creates a seamless pipeline that can be implemented for
research purposes. The workflow allows researchers to take advantage of modern
computational advancements such as HPC and map-reduce, offering greatly reduced

37
computation time, and complete automation of genetic sequence analysis. As shown in the
results for our model dataset, our pipeline can efficiently reduce the dimensionality of a
large dataset of microbial DNA sequences, resulting in summary graphical representations
that can be interpreted by researchers and used to examine meaningful biological responses
(in this particular example, how the salt pond microbiome responds to changing
environmental conditions). FSA enables a better analytic view of data. In our sample data,
quick reviewing of figures 3.7 to 3.16 researchers can absorb many patterns in order to
achieve a deeper understanding of the microbial ecosystem. For example, in our data we
can see that microbial ecosystem activity was reduced in March 2014.

Figure 3.7. Taxa Chart Layer One
38
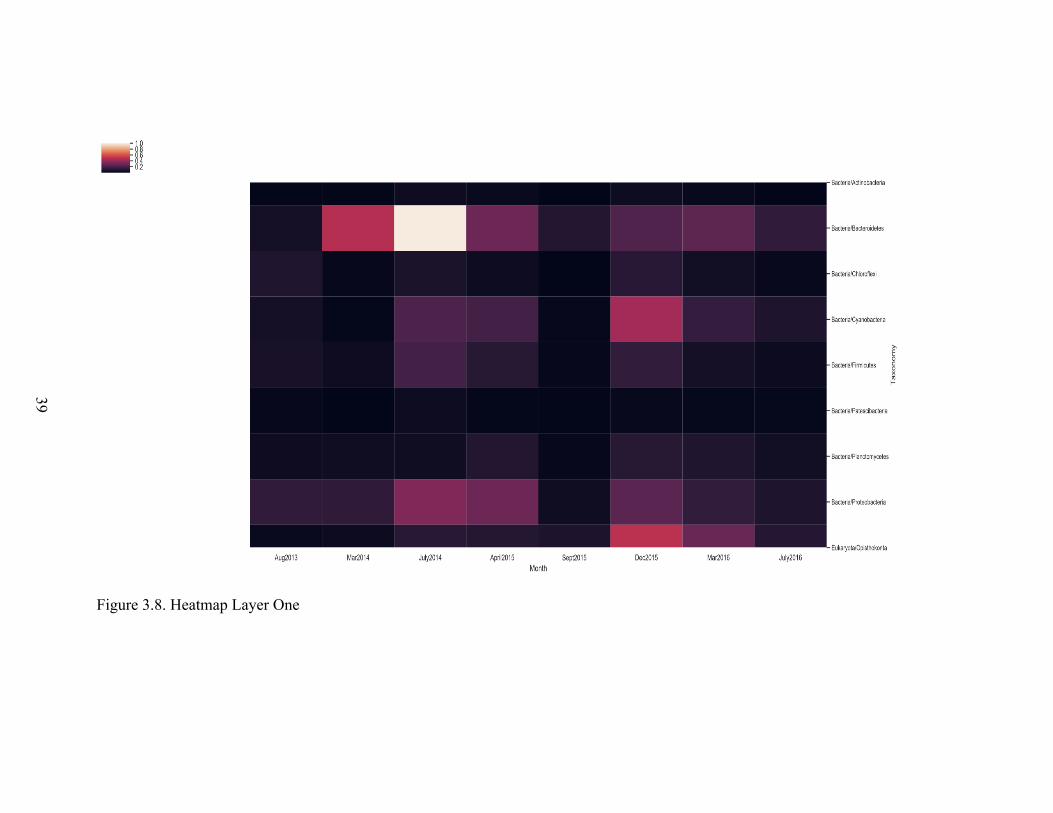
Figure 3.8. Heatmap Layer One
39

Figure 3.9. Taxa Chart Layer Two
40
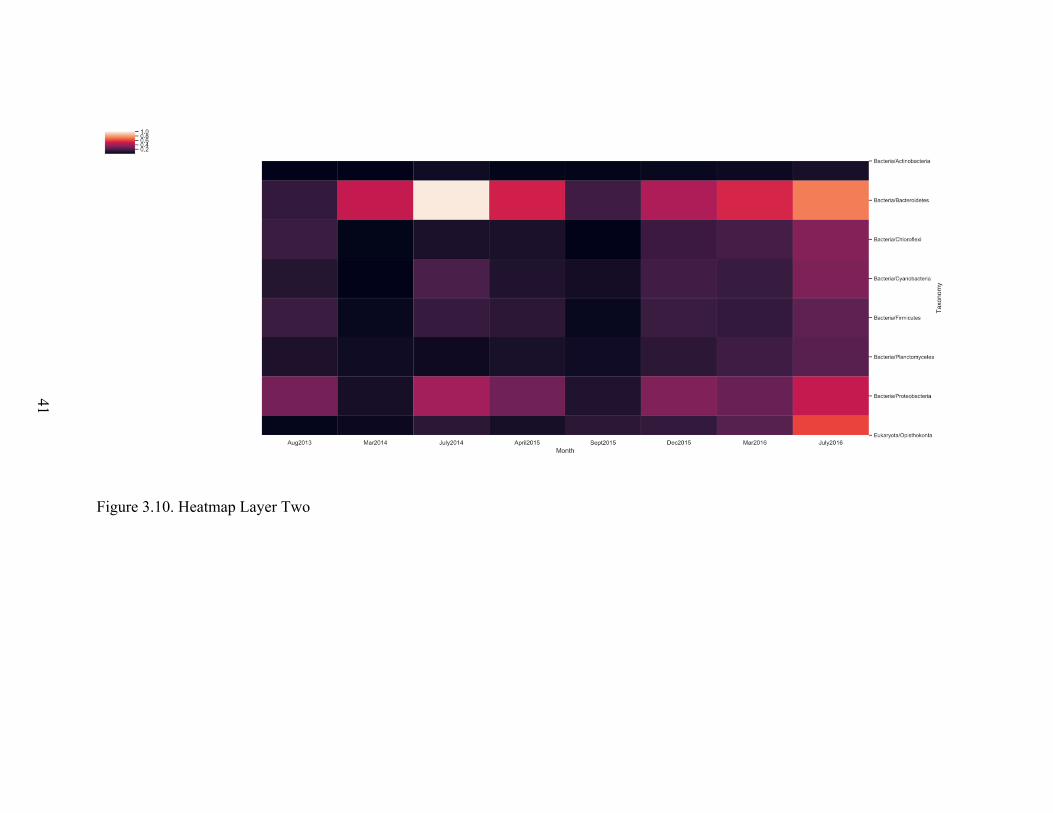
Figure 3.10. Heatmap Layer Two
41
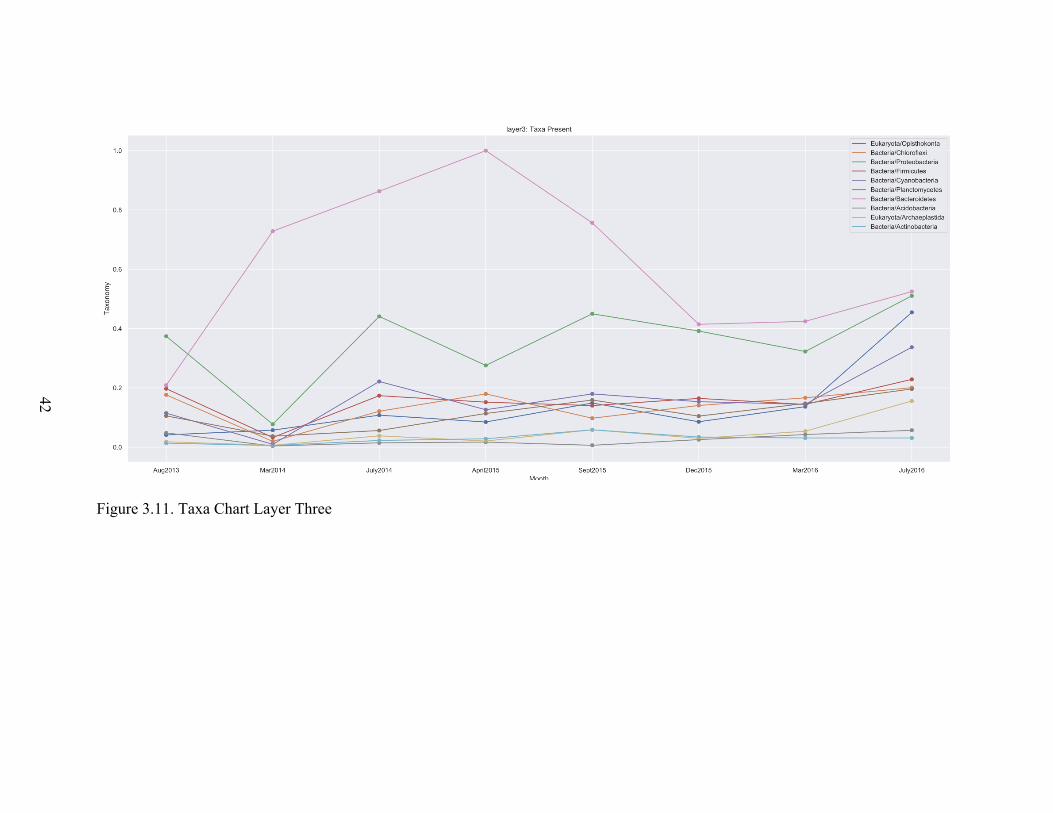
Figure 3.11. Taxa Chart Layer Three
42

Figure 3.12. Heatmap Layer Three
43

Figure 3.13. Taxa Chart Layer Four
44

Figure 3.14. Heatmap Layer Four
45

Figure 3.15. Taxa Chart Layer Five
46

Figure 3.16. Heatmap Layer Five
47

48
Chapter 4
Overall Thesis Conclusions:
In this thesis, computational tools for analyzing correlations between microbial
biological diversity and ecosystems were developed to address different challenges in the
processing and analysis of metagenomic data. During development, we encountered
multiple challenges that have resulted in the development of new tools. These tools were
aimed to help with the understanding of the role of microbial life in their environment, the
main conclusions of this thesis have been listed below:
BLAST-QC provides a fast and efficient method of quality control for NCBI
BLAST result datasets. It offers greater functionality for controlling the desired QC
parameters when compared to existing options and outperforms them in terms of runtime.
We also sought to increase awareness of the controversy surrounding the application of the
‘max_target_seqs’ parameter in BLAST, and to provide a sound solution that replicates the
function of the parameter and ensures the highest quality results.
FSA pipeline is outlined, and its applications to facilitate bioinformatics research
are discussed. We further note the ease of integration with a large number of tools and
detailed concerns of scalability (Torkian 2018).

49
Bioinformatics is changing and growing. Building a solution to handle the
complexity scale and adopt to this scale is a challenge. Both Biology and Computer Science
are merging and developing a system that can support the complexity of the solution,
however this is a complicated task. In our approach, we start with a fundamental pattern in
computer science using state machine pattern to encapsulate the complexity of each vital
task same time realize each task need to trigger an event upstream or downstream. This
approach gives us the upper hand in comparison to other workflows in bioinformatics.
Many current workflows have been solely built for a specific task and any small
customization can cause major rework for the researcher. In order to solve both issues. We
were trying to encapsulate the complexity in each and enable the researcher to use and
extend our state machine as needed. One of the other significant issues we encounter in
studies of workflows are the many dependencies and the outdated technology. We built our
solution based on the recent Python version (Python3) and ported tools from other
languages such as Perl and R, and in case of any short come or bug on the tools used, we
wrote a new tool to satisfy the concern. Finally, the primary issue of our study is data
volume growth with the advancement in sequencing technology; the scaling computation
capability is the key to success. Our workflow enables the researcher to run a small sample
on their workstation or scale to any HPC resource locally or remotely on the cloud
infrastructure (Torkian 2018).
Future works:
As mentioned previously, the data size is growing rapidly. To ensure our workflow
is a standardized solution and can handle the challenges encountered, we will continue to
work on implementing the tools and pipeline and testing the workflow with the community.

50
References
Altschul SF, Gish W, Miller W, Myers EW. n.d. "Lipman DJ (1990) Basic local
alignment search tool." J. Mol. Biol 215:729–731.
Altschul, S F, W Gish, W Miller, E W Myers, and D J Lipman. 1990. "Basic local
alignment search tool." Journal of molecular biology 215 (3): 403-410.
Angiuoli, S. V., Matalka, M., Gussman, A., Galens, K., Vangala, M., Riley, D. R.,
et al. (2011). n.d. "CloVR: a virtual machine for automated and portable sequence analysis
from the desktop using cloud computing." BMC Bioinformatics (BMC Bioinformatics)
12:356. doi: 10.1186/1471-2105-12-356.
Arumugam, M., Harrington, E. D., Foerstner, K. U., Raes, J., and Bork, P. 2010.
Bioinformatics 26 2977–2978. doi: 10.1093/bioinformatics/btq536.
Bai, Xiaodong. n.d. "tomato.cfaes.ohio-
state.edu/HCS806/blast_parsing_for_modification_pl.txt." Ohio State University.
Brian Bushnell, Jonathan Rood,Esther Singer. 2017. "BBMerge – Accurate paired
shotgun read merging via overlap." plos https://doi.org/10.1371/journal.pone.0185056.
Accessed 2020.

51
Cock, Peter. 2015. "What BLAST's Max-Target-Sequences Doesn't Do." What
BLAST's Max-Target-Sequences Doesn't Do blastedbio.blogspot.com/2015/12/blast-max-
target-sequences-bug.html.
Escobar, Alejandra & León, Arturo & Sanchez-Flores, Alejandro. 2016. The Road
to Metagenomics: From Microbiology to DNA Sequencing Technologies and
Bioinformatics. Frontiers in genetics 6. 348. 10.3389/fgene.2015.00348. .
Fassler, Jan, and Peter Cooper. 2011. "BLAST Glossary." National Center for
Biotechnology Information, U.S. National Library of Medicine
www.ncbi.nlm.nih.gov/books/NBK62051/. .
Fiers, W, R Contreras, G Haegeman, D Isrentat, J Merregaert, W Min Jou, F
Molemans, et al. 1976. "Complete nucleotide sequence of bacteriophage MS2 RNA:
primary and secondary structure of the replicase gene." Nature 260 (5551): 500-507.
Ghemawat, Jeffrey Dean and Sanjay. 2004. "MapReduce: Simplified Data
Processing on Large Clusters." Google, Inc.
Giardine, B., Riemer, C., Hardison, R. C., Burhans, R., Elnitski, L., Shah, P. n.d.
"Galaxy: a platform for interactive large-scale genome analysis." Genome Res 15 (doi:
10.1101/gr.4086505): 1451–1455.
Giolai, Michael, et al. 2017. "Comparative Analysis of Targeted Long Read
Sequencing Approaches for Characterization of a Plant's Immune Receptor Repertoire."
BMC Genomics, BioMed Central
bmcgenomics.biomedcentral.com/articles/10.1186/s12864-017-3936-7.

52
Heather, James M, and Benjamin Chain. 2016. "The sequence of sequencers: The
history of sequencing DNA." Genomics 107 (1): 8.
Hugenholtz, Philip, Brett M Goebel, and Norman R Pace. 1998. "Impact of Culture-
Independent Studies on the Emerging Phylogenetic View of Bacterial Diversity." Journal
of Bacteriology 180 (18): 4765-4774.
Illumina Inc 2nd. 2013. An Introduction to Illumina Next-Generation Sequencing
Technology for Microbiologist. December 20. Accessed June 14, 2017.
https://www.illumina.com/content/dam/illumina-
marketing/documents/products/sequencing_introduction_microbiology.pdf.
Jacquelyn S. Meisel, Geoffrey D. Hannigan, Amanda S. Tyldsley, Adam J.
SanMiguel, Brendan P. Hodkinson, Qi Zheng, Elizabeth A. Grice. n.d. "Low coverage
sequencing of three echinoderm genomes: the brittle star Ophionereis fasciata, the sea star
Patiriella regularis, and the sea cucumber Australostichopus mollis." GigaScience, Volume
5, Issue 1 https://gigascience.biomedcentral.com/articles/10.1186/s13742-016-0125-6.
Kosakovsky Pond, S., Wadhawan, S., Chiaromonte, F., Ananda, G., Chung, W. Y.,
Taylor, J. 2009. "Kosakovsky Pond, S., Wadhawan, S., Chiaromonte, F., Ananda, G.,
Chung, W. Y., Taylor, J." Genome Res. 19 2144–2153. doi: 10.1101/gr.094508.109.
Li, W. 2009. "Analysis and comparison of very large metagenomes with fast
clustering and functional annotation." BMC Bioinformatics 10:359. doi: 10.1186/1471-
2105-10-359.

53
Long, Kyle A., Nossa, Carlos W., Sewell, Mary A., Putnam, Nicholas H., and Ryan,
Joseph F. n.d. "Low coverage sequencing of three echinoderm genomes: the brittle star
Ophionereis fasciata, the sea star Patiriella regularis, and the sea cucumber
Australostichopus mollis." GigaScience, Volume 5, Issue 1
ttps://gigascience.biomedcentral.com/articles/10.1186/s13742-016-0125-6.
Madden, Thomas L. 2018. "Reply to the Paper: Misunderstood Parameters of NCBI
BLAST Impacts the Correctness of Bioinformatics Workflows." OUP Academic, Oxford
University Press academic.oup.com/bioinformatics/advance-
article/doi/10.1093/bioinformatics/bty1026/5259186.
Markowitz, V. M., Chen, I. M. A., Chu, K., Szeto, E., Palaniappan, K., Pillay, M.
2014. "4 version of the integrated metagenome comparative analysis system." Nucleic
Acids Res 42, D568–D573. doi: 10.1093/Nar/Gkt919.
Markowitz, V. M., Ivanova, N. N., Szeto, E., Palaniappan, K., Chu, K., Dalevi, D.
2008. "a data management and analysis system for metagenomes." Nucleic Acids Res 36,
D534–D538. doi: 10.1093/Nar/Gkm869.
Martin C. Herbordt, Josh Model, Bharat Sukhwani,‡ Yongfeng Gu, and Tom
VanCourt§. 2007. "Single Pass Streaming BLAST on FPGAs." Parallel Comput 33(10-
11): 741–756.
National Center for Biotechnology Information, US National Library of Medicine.
2018. "www.ncbi.nlm.nih.gov/books/NBK279684/." “Appendices.” BLAST® Command-
Line Applications User Manual. Nov 14.

54
Nazaries, L. e. a. 2013. "Evidence of Microbial Regulation of Biogeochemical
Cycles from a Study on Methane Flux and Land Use Change.,." Applied and
Environmental Microbiology, American Society for Microbiology no.
aem.asm.org/content/79/13/4031.
Ola Spjuth, Erik Bongcam-Rudloff. 2005. "Experiences with workflows for
automating data-intensive bioinformatics." PubMed 10.1186/s13062-015-0071-8.
Panagiotis D. Vouzis, Nikolaos V. Sahinidis. 2011. "GPU-BLAST: using graphics
processors to accelerate protein sequence alignment." Bioinformatics, Volume 27, Issue 2
Pages 182–188.
Preisner, Eva C. 2016. "Microbial Mat Compositional and Functional Sensitivity
to Environmental Disturbance." Frontiers in microbiology
doi:10.3389/fmicb.2016.01632 .
Quast, Christian, Elmar Pruesse, Pelin Yilmaz, Jan Gerken, Timmy Schweer, Pablo
Yarza, Jörg Peplies, and Frank Oliver Glöckner. 2013. "The SILVA ribosomal RNA gene
database project: improved data processing and web-based tools." Nucleic Acids Research
41 (Database issue): D590-D596.
Raúl A González-Pech, Timothy G Stephens, Cheong Xin Chan. 2019. "Commonly
misunderstood parameters of NCBI BLAST and important considerations for
users, Bioinformatics." Bioinformatics 35 (15): Pages 2697–2698.

55
Sahinidis, Panagiotis D. Vouzis and Nikolaos V. 2010. "GPU-BLAST: using
graphics processors to accelerate protein sequence alignment." Bioinformatics, Volume 27,
Issue 2, 15 January 2011 Pages 182–188.
Schirmer, Melanie, Umer Z Ijaz, Rosalinda D'Amore, Neil Hall, William T Sloan,
and Christopher Quince. 2015. "Insight into biases and sequencing errors for amplicon
sequencing with the Illumina MiSeq platform." Nucleic Acids Research 43 (6): e37-e37.
Schloss, Patrick D, Sarah L Westcott, Thomas Ryabin, Justine R Hall, Martin
Hartmann, Emily B Hollister, Ryan A Lesniewski, et al. 2009. "Introducing mothur: open-
source, platform-independent, community-supported software for describing and
comparing microbial communities." Applied and environmental microbiology 75 (23):
7537-7541.
Shade, Ashley, Hannes Peter, Steven Allison, Didier Baho, Mercé Berga, Helmut
Buergmann, David Huber, et al. 2012. "Fundamentals of microbial community resistance
and resilience." Frontiers in Microbiology 417.
Shah, Nidhi. 2018. "Misunderstood Parameter of NCBI BLAST Impacts the
Correctness of Bioinformatics Workflows." OUP Academic, Oxford University Press
academic.oup.com/bioinformatics/article/35/9/1613/5106166.
Smalla, Kornelia. 1 Jan. 2004. "Culture-Independent Microbiology." ASMscience,
American Society of Microbiology
www.asmscience.org/content/book/10.1128/9781555817770.chap9.

56
Srinivasan, Ramya, et al. 6 Feb. 2015. "Use of 16S RRNA Gene for Identification
of a Broad Range of Clinically Relevant Bacterial Pathogens." PLOS ONE, Public Library
of Science journals.plos.org/plosone/article?id=10.1371%2Fjournal.pone.0117617.
Torkian, Ben. 2018. "By optimizing their workflow on the cloud, the University of
South Carolina advances research into climate change." GCP.
Větrovský, Tomáš, and Petr Baldrian. 2013. "The Variability of the 16S rRNA
Gene in Bacterial Genomes and Its Consequences for Bacterial Community Analyses."
Journal of Bacteriology (Public Library of Science) 8 (2): e57923.
Watson, J, and F Crick. 1953. "Molecular Structure of Nucleic Acids: A Structure
for Deoxyribose Nucleic Acid." Nature 171 (4356): 737-738.
Weiman, S. 2013. "Microbes in Diverse Communities Form Codependent Ties,."
American Society of Microbiology.
Weiman, Shannon. 1 Jan. 2013. "Microbes in Diverse Communities Form
Codependent Ties." American Society of Microbiology.
Wu, R, and A Kaiser. 1968. "Structure and base sequence in the cohesive ends of
bacteriophage lambda DNA." Journal of Molecular Biology 35 (3): 523-537.
![arXiv:1702.02123v4 [quant-ph] 11 Jan 2019Asymmetric broadcasting of quantum correlations Aditya Jain Center for Computational Natural Sciences and Bioinformatics, International Institute](https://img.dokumen.tips/doc/110x75/5fed593296258357ae388cef/arxiv170202123v4-quant-ph-11-jan-2019-asymmetric-broadcasting-of-quantum-correlations.jpg)