Embed Size (px)
Citation preview

Computation Reuse in Analytics Job Service at MicrosoftAlekh Jindal, Shi Qiao, Hiren Patel, Zhicheng Yin, Jieming Di, Malay Bag, Marc Friedman,
Yifung Lin, Konstantinos Karanasos, Sriram RaoMicrosoft
{aljindal,shqiao,hirenp,zhyin,jiedi,malayb,marc.friedman,yifungl,kokarana,sriramra}@microsoft.com
ABSTRACTAnalytics-as-a-service, or analytics job service, is emerging as anew paradigm for data analytics, be it in a cloud environment orwithin enterprises. In this setting, users are not required to manageor tune their hardware and software infrastructure, and they payonly for the processing resources consumed per job. However, theshared nature of these job services across several users and teamsleads to significant overlaps in partial computations, i.e., parts ofthe processing are duplicated across multiple jobs, thus generatingredundant costs. In this paper, we describe a computation reuseframework, coined CLOUDVIEWS, which we built to address thecomputation overlap problem in Microsoft’s SCOPE job service.We present a detailed analysis from our production workloads tomotivate the computation overlap problem and the possible gainsfrom computation reuse. The key aspects of our system are thefollowing: (i) we reuse computations by creating materialized viewsover recurring workloads, i.e., periodically executing jobs that havethe same script templates but process new data each time, (ii) weselect the views to materialize using a feedback loop that reconcilesthe compile-time and run-time statistics and gathers precise measuresof the utility and cost of each overlapping computation, and (iii) wecreate materialized views in an online fashion, without requiring anoffline phase to materialize the overlapping computations.
CCS CONCEPTS• Information systems → Query optimization; • Computer sys-tems organization → Cloud computing;
KEYWORDSMaterialized Views; Computation Reuse; Shared Clouds
ACM Reference Format:Alekh Jindal, Shi Qiao, Hiren Patel, Zhicheng Yin, Jieming Di, Malay Bag,Marc Friedman, Yifung Lin, Konstantinos Karanasos, Sriram Rao. 2018.Computation Reuse in Analytics Job Service at Microsoft. In SIGMOD’18:2018 International Conference on Management of Data, June 10–15, 2018,Houston, TX, USA. ACM, New York, NY, USA, 13 pages. https://doi.org/10.1145/3183713.3190656
Permission to make digital or hard copies of all or part of this work for personal orclassroom use is granted without fee provided that copies are not made or distributedfor profit or commercial advantage and that copies bear this notice and the full citationon the first page. Copyrights for components of this work owned by others than ACMmust be honored. Abstracting with credit is permitted. To copy otherwise, or republish,to post on servers or to redistribute to lists, requires prior specific permission and/or afee. Request permissions from [email protected]’18, June 10–15, 2018, Houston, TX, USA© 2018 Association for Computing Machinery.ACM ISBN 978-1-4503-4703-7/18/06. . . $15.00https://doi.org/10.1145/3183713.3190656
0
20
40
60
80
100
cluster1 cluster2 cluster3 cluster4 cluster5
Per
cent
age
Overlapping jobsUsers with overlapping jobs
Overlapping subgraphs
Figure 1: Overlap in different production clusters at Microsoft.
1 INTRODUCTION1.1 BackgroundThere is a recent trend of offering analytics-as-a-service, also re-ferred to simply as job service, by major cloud providers. Examplesinclude Google’s BigQuery [15], Amazon’s Athena [3], and Mi-crosoft’s Azure Data Lake [5]. Similar job services are employedfor the internal needs of large enterprises [11, 49]. These servicesare motivated by the fact that setting up and running data analyticsis a major hurdle for enterprises. Although platform as a service(PaaS), software as a service (SaaS), and more recently database asa service (DBaaS) [4, 6] have eased the pain of provisioning andscaling hardware and software infrastructures, users are still respon-sible for managing and tuning their servers. A job service mitigatesthis pain by offering server-less analytics capability that does notrequire users to provision and manage servers. Instead, the serviceprovider takes care of managing and tuning a query engine that canscale instantly and on demand. Users can get started quickly usingthe all familiar SQL interface and pay only for the processing usedfor each query, in contrast to paying for the entire provisioned serverinfrastructure irrespective of the compute resources actually used.
1.2 ProblemGiven the above shift from provisioned resources to actually con-sumed resources, enterprises naturally do not want to duplicate theirresource consumption and pay redundant costs. However, this is amajor challenge in modern enterprise data analytics which consistsof complex data pipelines written by several users, where parts of thecomputations end up running over and over again. Such computationoverlap not only adds to the cost, but it is also really hard for thedevelopers or even the administrators to detect these overlaps acrossdifferent scripts and different users.
To illustrate the problem, consider SCOPE [11, 52], which isthe equivalent of Azure Data Lake for internal data analytics at Mi-crosoft. SCOPE is deployed over hundreds of thousands of machines,running hundreds of thousands of production analytic jobs per day

that are written by thousands of developers, processing several ex-abytes of data per day, and involving several hundred petabytes ofI/O. Almost 40% of the daily SCOPE jobs have computation over-lap with one or more other jobs. Likewise, there are millions ofoverlapping subgraphs that appear at least twice. These overlaps areincurred by 70% of the total user entities (humans and machines) onthese clusters. Figure 1 shows the cluster-wise computation overlapin five of our clusters. We can see that all clusters, except cluster3,have more than 45% of their jobs overlapping. Likewise, more than65% of users on all clusters end up having computation overlap intheir jobs and the percentage of subgraphs appearing at least twicecould be as high as 80%. While the ideal solution would be for theusers to modularize their code and reuse the shared set of scripts andintermediate data, this is not possible in practice as users are dis-tributed across teams, job functions, as well as geographic locations.Thus, we need an automatic cloud-scale approach to computationreuse in a job service.
1.3 ChallengesThere is a rich literature for materializing views [19, 20, 22, 30, 33,44, 46, 53] and for reusing intermediate output [10, 12, 18, 23, 36–38, 50]. However, there are a number of new challenges in buildinga computation reuse framework for the SCOPE job service.
First, enterprise data analytics often consists of recurring jobsover changing data. The SCOPE job service has more than 60% of thejobs in its key clusters as recurring [25]. With recurring jobs, sched-uling and carefully materializing views over the new data is crucial,which was not an issue in traditional view selection. Incrementalmaintenance would not work because data might be completely new.SCOPE jobs are further packed in tight data pipelines, i.e., multiplejobs operate in a given time interval with strict completion dead-lines. Tight data pipelines leave little room to analyze the recurringworkload over the new data in each occurrence.
Second, we need a feedback loop to analyze the previously ex-ecuted workload and detect overlapping computations. Given thelarge volume of overlaps, materializing all of them for reuse is sim-ply not possible. Typical methods to select the interesting overlaps(or views) depend on the utility and cost of each overlap, i.e., theruntime savings and the storage cost of each overlap. Unfortunately,however, the optimizer estimates for utility and costs are often wayoff due to a variety of factors (unstructured data, inaccurate operatorselectivities, presence of user code, etc.) [17, 29, 31]. Thus, the feed-back loop needs to reconcile the logical query trees with the actualruntime statistics to get more precise measures of utility and cost ofeach overlap.
Third, a job service is always online and there is no offline phaseavailable to create the materialized views, which is expected withtraditional materialized views. Halting or delaying recurring jobsto create materialized views is not an option, as it carries the riskof not meeting the completion deadlines and affecting downstreamdata dependency. Thus, we need to create materialized views justin time and with minimal overheads. This is further challengingbecause multiple jobs can now compete to build views (build-buildinteraction), and they depend on each other for the availability ofviews (build-consume interaction).
Finally, we need an end-to-end system for computation reusethat has a number of requirements, including automatic reuse and
transparency to the end users, that are inspired from our productionenvironments.
1.4 ContributionsIn this paper, we describe why and how we built an end-to-endsystem for automatically detecting and reusing overlapping compu-tations in the SCOPE job service at Microsoft. Our goal is to allowusers to write their jobs just as before, i.e., with zero changes to userscripts, and to automatically detect and reuse computations whereverpossible. We focus on exact job subgraph matches, given that exactmatches are plentiful and it makes the problem much simpler withoutgetting into view containment complexities. Although we presentour ideas and findings in the context of the SCOPE job service, webelieve that they are equally applicable to other job services. Ourcore contributions are as follows.
First, we present a detailed analysis of the computation reuseopportunity in our production clusters to get a sense of the magnitudeof the problem and the expected gains. Our analysis reveals thatcomputation overlap is a major problem across almost all businessunits at Microsoft, with significant runtime improvements to beexpected with relatively low storage costs. We also note that theoverlaps often occur at shuffle boundaries, thereby suggesting thatthe physical design of the materialized view is important (Section 2).
Then, we discuss enabling computation reuse over recurring jobs.The key idea is to use a combination of normalized and precisehashes (called signatures) for computation subgraphs. The normal-ized signature matches computations across recurring instances,while the precise signature matches computations within a recurringinstance. Together these two signatures enable us to analyze ourworkload once and reuse overlapping computations over and overagain (Section 3).
We provide an overview of our CLOUDVIEWS system, an end-to-end system for computation reuse in a job service, along withour key requirements and the intuition behind our approach. TheCLOUDVIEWS system consists of an offline CLOUDVIEWS analyzerand an online CLOUDVIEWS runtime. To the best of our knowledge,this is the first work to present an industrial strength computationreuse framework for big data analytics (Section 4).
We describe the CLOUDVIEWS analyzer for establishing a feed-back loop to select the most interesting subgraphs to materialize andreuse. The CLOUDVIEWS analyzer captures the set of interestingcomputations to reuse based on their prior runs, plugs in customview selection methods to select the view to materialize given a setof constraints, picks the physical design for the materialized views,and also determines the expiry of each of the materialized views. Wefurther describe the admin interface to trigger the CLOUDVIEWS
analyzer (Section 5).We describe the CLOUDVIEWS runtime which handles our online
setting for computation reuse. Key components of the runtime in-clude a metadata service for fetching the metadata of computationsrelevant for reuse in a given job, an online view materialization mech-anism as part of the job execution, a synchronization mechanism toavoid materializing the same view in parallel, making materializedviews available early during runtime, automatic query rewriting us-ing materialized views, and job coordination hints to maximize thecomputation reuse (Section 6).
0
20
40
60
80
100
0 20 40 60 80 100 120 140 160
Per
cent
age
Ove
rlap
Virtual Clusters
(a) Percentage overlap
1
10
100
0 20 40 60 80 100 120 140 160Ave
rage
Ove
rlap
Fre
quen
cy
Virtual Clusters
(b) Average overlap frequecy
Figure 2: Overlap in one of the largest SCOPE clusters
Thereafter, we present an experimental evaluation of CLOUD-VIEWS. We present the impact over production workloads at Mi-crosoft, both in terms of latency and CPU hours. Our results showan average and overall latency improvement of 43% and 60% respec-tively, as well as an average and overall CPU hour improvementof 36% and 54% respectively. We further show evaluation over theTPC-DS benchmark. Our results show 79 out of the 99 TPC-DSqueries having improvements with CLOUDVIEWS, with an overallruntime improvement of 17%. We also discuss the various overheadsof CLOUDVIEWS, including the cost of workload analysis, the meta-data lookup, and the impact on compiler runtime (Section 7).
Finally, we discuss the lessons learned from the CLOUDVIEWS
project. (Section 8)
2 THE REUSE OPPORTUNITYWe saw the overall overlap across our SCOPE clusters in Figure 1.Below we analyze the overlap at different granularity levels.
2.1 Overlap within a ClusterWe analyze one of the largest clusters, in terms of the number of jobs,to better understand the overlap. Figure 2(a) shows the percentageof jobs overlapping in each of the virtual clusters1 (VCs) in thisphysical cluster. Our analysis shows that while some VCs have nooverlapping jobs, 54% of the VCs have more than 50% of their jobsoverlapping, and few others have 100% of their jobs overlapping.Figure 2(b) shows the average overlap frequencies across differentvirtual clusters. The average overlap frequency ranges from 1.5 to112 (median 2.96, 75th percentile 3.82, 95th percentile 7.1). The keylesson here is that computation overlap is a cluster-wide phenomenonand not limited to specific VCs or workloads.
Our interactions with the internal SCOPE customers reveal twomain reasons for the prevalence of computation overlap seen above:(i) users rarely start writing their analytics scripts from scratch, ratherthey start from other people’s scripts and extend/modify them to suittheir purpose, (ii) there is a data producer/consumer model at play inSCOPE, where multiple different consumers process the same inputs(generated by the producers), and they often end up duplicating thesame (partial or full) post-processing over those inputs.
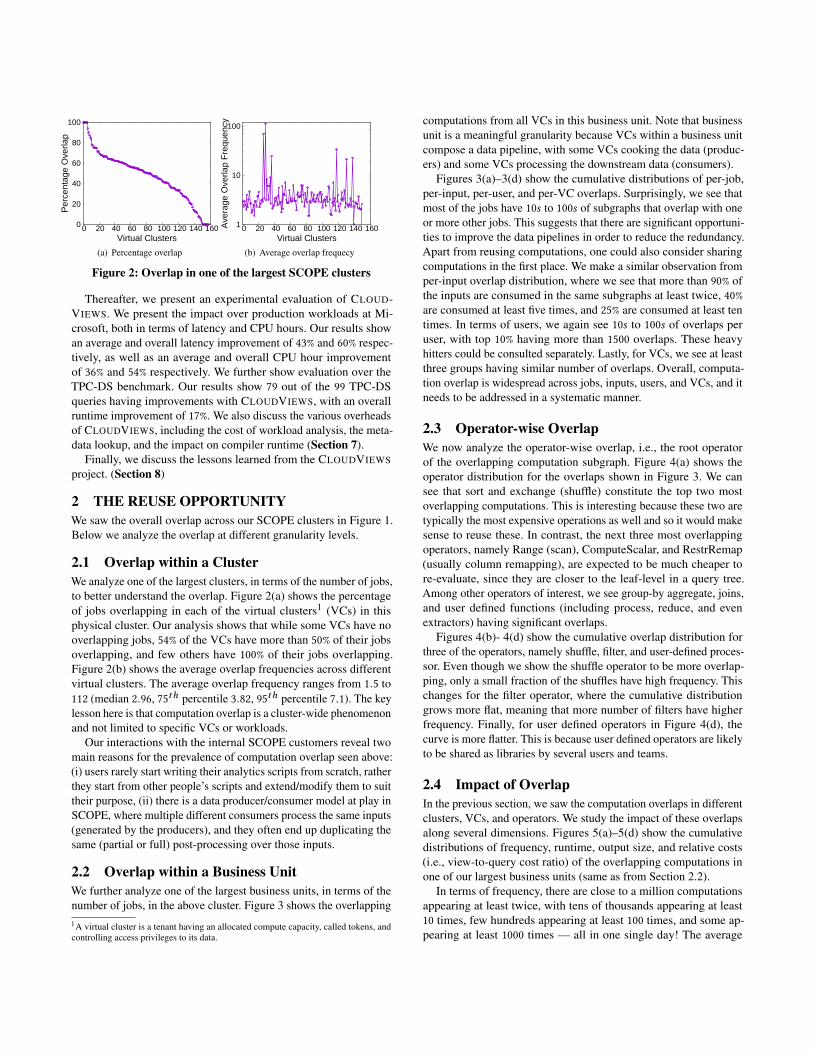
2.2 Overlap within a Business UnitWe further analyze one of the largest business units, in terms of thenumber of jobs, in the above cluster. Figure 3 shows the overlapping1A virtual cluster is a tenant having an allocated compute capacity, called tokens, andcontrolling access privileges to its data.
computations from all VCs in this business unit. Note that businessunit is a meaningful granularity because VCs within a business unitcompose a data pipeline, with some VCs cooking the data (produc-ers) and some VCs processing the downstream data (consumers).
Figures 3(a)–3(d) show the cumulative distributions of per-job,per-input, per-user, and per-VC overlaps. Surprisingly, we see thatmost of the jobs have 10s to 100s of subgraphs that overlap with oneor more other jobs. This suggests that there are significant opportuni-ties to improve the data pipelines in order to reduce the redundancy.Apart from reusing computations, one could also consider sharingcomputations in the first place. We make a similar observation fromper-input overlap distribution, where we see that more than 90% ofthe inputs are consumed in the same subgraphs at least twice, 40%are consumed at least five times, and 25% are consumed at least tentimes. In terms of users, we again see 10s to 100s of overlaps peruser, with top 10% having more than 1500 overlaps. These heavyhitters could be consulted separately. Lastly, for VCs, we see at leastthree groups having similar number of overlaps. Overall, computa-tion overlap is widespread across jobs, inputs, users, and VCs, and itneeds to be addressed in a systematic manner.
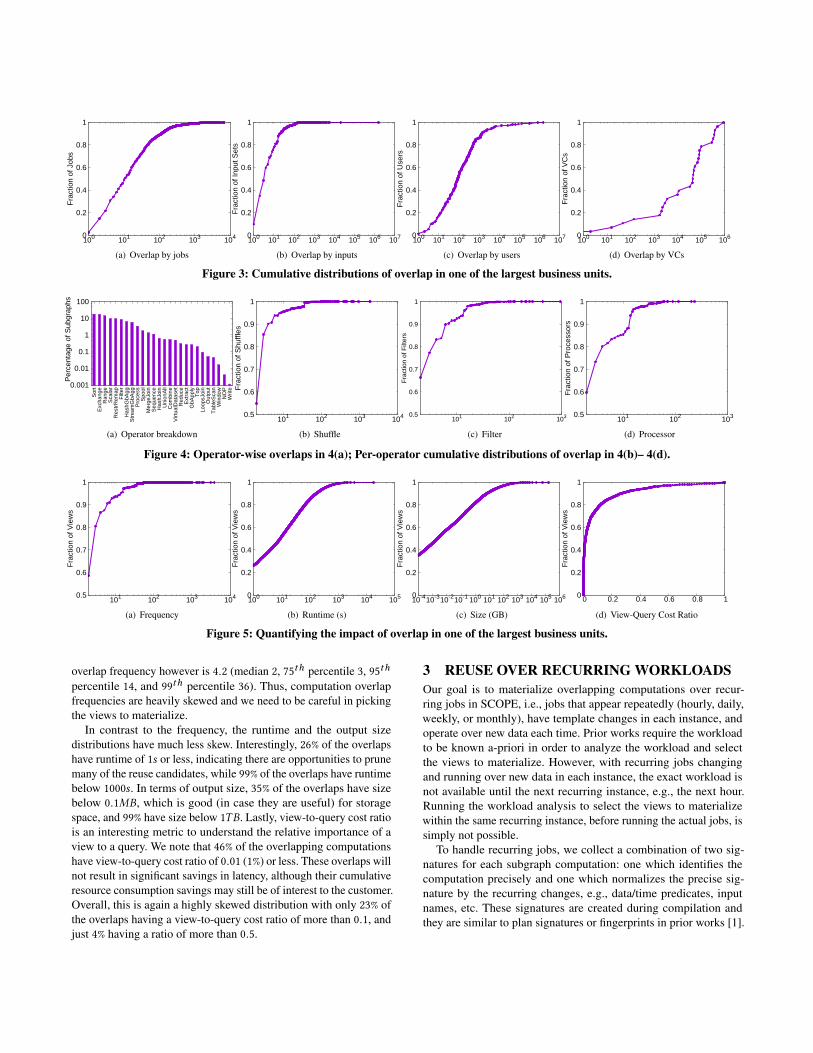
2.3 Operator-wise OverlapWe now analyze the operator-wise overlap, i.e., the root operatorof the overlapping computation subgraph. Figure 4(a) shows theoperator distribution for the overlaps shown in Figure 3. We cansee that sort and exchange (shuffle) constitute the top two mostoverlapping computations. This is interesting because these two aretypically the most expensive operations as well and so it would makesense to reuse these. In contrast, the next three most overlappingoperators, namely Range (scan), ComputeScalar, and RestrRemap(usually column remapping), are expected to be much cheaper tore-evaluate, since they are closer to the leaf-level in a query tree.Among other operators of interest, we see group-by aggregate, joins,and user defined functions (including process, reduce, and evenextractors) having significant overlaps.
Figures 4(b)- 4(d) show the cumulative overlap distribution forthree of the operators, namely shuffle, filter, and user-defined proces-sor. Even though we show the shuffle operator to be more overlap-ping, only a small fraction of the shuffles have high frequency. Thischanges for the filter operator, where the cumulative distributiongrows more flat, meaning that more number of filters have higherfrequency. Finally, for user defined operators in Figure 4(d), thecurve is more flatter. This is because user defined operators are likelyto be shared as libraries by several users and teams.
2.4 Impact of OverlapIn the previous section, we saw the computation overlaps in differentclusters, VCs, and operators. We study the impact of these overlapsalong several dimensions. Figures 5(a)–5(d) show the cumulativedistributions of frequency, runtime, output size, and relative costs(i.e., view-to-query cost ratio) of the overlapping computations inone of our largest business units (same as from Section 2.2).
In terms of frequency, there are close to a million computationsappearing at least twice, with tens of thousands appearing at least10 times, few hundreds appearing at least 100 times, and some ap-pearing at least 1000 times — all in one single day! The average
0
0.2
0.4
0.6
0.8
1
100 101 102 103 104
Fra
ctio
n of
Job
s
(a) Overlap by jobs
0
0.2
0.4
0.6
0.8
1
100 101 102 103 104 105 106 107F
ract
ion
of In
put S
ets
(b) Overlap by inputs
0
0.2
0.4
0.6
0.8
1
100 101 102 103 104 105 106 107
Fra
ctio
n of
Use
rs
(c) Overlap by users
0
0.2
0.4
0.6
0.8
1
100 101 102 103 104 105 106
Fra
ctio
n of
VC
s
(d) Overlap by VCs
Figure 3: Cumulative distributions of overlap in one of the largest business units.
0.001
0.01
0.1
1
10
100
Sor
tE
xcha
nge
Ran
geS
cala
rR
estr
Rem
apF
ilter
Has
hGbA
ggS
trea
mG
bAgg
Pro
cess
Spo
olM
erge
Join
Seq
uenc
eH
ashJ
oin
Uni
onA
llC
ombi
neV
irtua
lDat
aset
Red
uce
Ext
ract
GbA
pply
Top
Loop
sJoi
nO
utpu
tT
able
Sca
nW
indo
wN
OP
Writ
e
Per
cent
age
of S
ubgr
aphs
(a) Operator breakdown
0.5
0.6
0.7
0.8
0.9
1
101 102 103 104
Fra
ctio
n of
Shu
ffles
(b) Shuffle
0.5
0.6
0.7
0.8
0.9
1
101 102 103
Fra
ctio
n of
Filt
ers
(c) Filter
0.5
0.6
0.7
0.8
0.9
1
101 102 103
Fra
ctio
n of
Pro
cess
ors
(d) Processor
Figure 4: Operator-wise overlaps in 4(a); Per-operator cumulative distributions of overlap in 4(b)– 4(d).
0.5
0.6
0.7
0.8
0.9
1
101 102 103 104
Fra
ctio
n of
Vie
ws
(a) Frequency
0
0.2
0.4
0.6
0.8
1
100 101 102 103 104 105
Fra
ctio
n of
Vie
ws
(b) Runtime (s)
0
0.2
0.4
0.6
0.8
1
10-410-310-210-1 100 101 102 103 104 105 106
Fra
ctio
n of
Vie
ws
(c) Size (GB)
0
0.2
0.4
0.6
0.8
1
0 0.2 0.4 0.6 0.8 1
Fra
ctio
n of
Vie
ws
(d) View-Query Cost Ratio
Figure 5: Quantifying the impact of overlap in one of the largest business units.
overlap frequency however is 4.2 (median 2, 75th percentile 3, 95thpercentile 14, and 99th percentile 36). Thus, computation overlapfrequencies are heavily skewed and we need to be careful in pickingthe views to materialize.
In contrast to the frequency, the runtime and the output sizedistributions have much less skew. Interestingly, 26% of the overlapshave runtime of 1s or less, indicating there are opportunities to prunemany of the reuse candidates, while 99% of the overlaps have runtimebelow 1000s. In terms of output size, 35% of the overlaps have sizebelow 0.1MB, which is good (in case they are useful) for storagespace, and 99% have size below 1TB. Lastly, view-to-query cost ratiois an interesting metric to understand the relative importance of aview to a query. We note that 46% of the overlapping computationshave view-to-query cost ratio of 0.01 (1%) or less. These overlaps willnot result in significant savings in latency, although their cumulativeresource consumption savings may still be of interest to the customer.Overall, this is again a highly skewed distribution with only 23% ofthe overlaps having a view-to-query cost ratio of more than 0.1, andjust 4% having a ratio of more than 0.5.
3 REUSE OVER RECURRING WORKLOADSOur goal is to materialize overlapping computations over recur-ring jobs in SCOPE, i.e., jobs that appear repeatedly (hourly, daily,weekly, or monthly), have template changes in each instance, andoperate over new data each time. Prior works require the workloadto be known a-priori in order to analyze the workload and selectthe views to materialize. However, with recurring jobs changingand running over new data in each instance, the exact workload isnot available until the next recurring instance, e.g., the next hour.Running the workload analysis to select the views to materializewithin the same recurring instance, before running the actual jobs, issimply not possible.
To handle recurring jobs, we collect a combination of two sig-natures for each subgraph computation: one which identifies thecomputation precisely and one which normalizes the precise sig-nature by the recurring changes, e.g., data/time predicates, inputnames, etc. These signatures are created during compilation andthey are similar to plan signatures or fingerprints in prior works [1].

CloudViews:ViewMaterialization&Reuse
SCOPEWorkloadRepository
Compile-timequeryplans
Run-timestatistics
Querysubgraphswithfeatures
MaterializedViewselection
Interestingsubgraphs
Queryannotations
EnabledbyVCadmin
Unmodifiedscripts
1.Checkannotationsforeachsubgraph
2.Checkifthesubgraphisalreadymaterializedintheviewrepository
3.Addanexpressionusingview(stillletoptimizerpickthebestexpression)
Materializedviewrepository
4.Materializesubgraphaspartofqueryprocessing
Nomatchingannotations
match
exists !exists
view
view
120205167609!RecurringAnnotationBuildView D:\viewPath.ss120205167609!RecurringAnnotationMatchView D:\viewPath.ss
CloudViews Analyzer CloudViews Runtime
Figure 6: CLOUDVIEWS System Architecture.
Precise Signature Normalized Signature
Detect Overlapping Computations
Preserve Corresponding Normalized Signatures
Match for Creating Materialized View
Preserve Corresponding Precise Signatures
Match for Reuse
Expire and Delete
Runtime
Analysis 1 2
4 3
5 6
Figure 7: Use of precise and normalized signatures for compu-tation reuse over recurring workloads.
However, we extended the precise signature to further include theinput GUIDs, any user code, as well as any external libraries usedfor custom code. The normalized signature ensures that we capturea normalized computation that remains the same across differentrecurring instances. Figure 7 shows the use of these two signatures inour approach. We analyze any recurring instance from the workloadhistory and select frequent computations (views) based on their pre-cise signatures (Step 1), and collect their corresponding normalizedsignatures into our metadata service (Step 2). This analysis needsto be run periodically, only when there is a change in the workload,thereby removing the need to run workload analysis within eachrecurring instance. Later during runtime, we materialize subgraphsbased on their normalized signatures (Step 3), but we also record theprecise signature of each of the materialized view into the physicalpath of the materialized files (Step 4). The precise signatures areused to match future computations for reuse (Step 5), as well as forexpiring a materialized view (Step 6). In summary, the normalizedsignature identifies subgraphs across recurring instances (for ma-terialization) while the precise signature matches subgraph within
a recurring instance (for reuse). Together, they make computationreuse possible over recurring workloads.
4 CLOUDVIEWS OVERVIEWIn this section, we give a brief overview of the CLOUDVIEWS system.Our key goals derived from our engagement with product teams areas follows:
(1) Automatic: We need minimal manual intervention, since it is re-ally hard for developers to coordinate and reuse overlapping compu-tations amongst themselves. Thus, overlapping computations shouldbe detected, materialized, reused, and evicted automatically.
(2) Transparent: With hundreds of thousands of jobs, it is simplynot possible to make changes in user scripts or their libraries.
(3) Correct: Computation reuse should not introduce incorrect re-sults, i.e., data corruption. This is especially challenging due to thepresence of parameters, users code, and external libraries.
(4) Latency-sensitive: SCOPE users cannot afford to slow downtheir data pipelines and hence computation reuse should offer bet-ter or same performance. This requires accurate estimates on thecost/benefit of materialized views, and the optimizer should still beable to discard a view in case it turns out to be too expensive.
(5) Maximize reuse: The obvious goal is to do the computationreuse wherever possible. This is hard because overlapping jobs mayarrive concurrently and so views materialized in one job may notend up being reused.
(6) Debuggability: SCOPE has a rich debuggability experience andcomputation reuse should preserve that. Specifically, customers (andoperations team) should be able to replay the job, see which mate-rialized views are created or used, trace the jobs which created anyof the views, and even drill down into why a view was selected formaterialization or reuse in the first place.

(7) Reporting: Finally, we need to report the impact of computationreuse on job performance, i.e., the storage costs and runtime savings,as well as make all metadata related to the overlapping computationsqueryable.
Traditional materialized view technologies typically have threecomponents, an offline view selection component, an offline viewbuilding component, and an online view matching component. Inour approach, we have two online components: a periodic workloadanalyzer to mine overlapping computations, and a runtime engine tomaterialize and reuse those computations.
Figure 6 shows the high-level architecture of CLOUDVIEWS. Theleft side shows the periodic workload analyzer that is used to analyzethe SCOPE workload repository. Admins can choose to include orexclude different VCs for analysis. The output of this analysis is aset of annotations telling future jobs the subgraph computations thatmust be materialized and reused. The right side of Figure 6 shows theruntime component of CLOUDVIEWS. Here, each incoming job canbe processed in one of three ways: (i) exactly same as before in casenone of the job subgraphs are materialized or are deemed to be tooexpensive by the optimizer, (ii) modified job graph that reads froma materialized view (i.e., there is a matching subgraph annotationand it is materialized) and reading from the materialized view isconsidered more efficient than recomputing it by the optimizer, and(iii) modified job graph that spools and materializes the output of asubgraph (i.e., there is a matching subgraph annotation but it is notmaterialized). While the analyzer part of CLOUDVIEWS could betriggered explicitly by the user or scheduled as another recurring job,the runtime part is triggered by providing a command line flag duringjob submission. The job scripts of the end users remain unchanged.
5 CLOUDVIEWS ANALYZERIn this section, we describe the analyzer component of CLOUD-VIEWS. The key features of this component include: (i) providingfeedback loop for runtime statistics, (ii) picking the physical designfor the selected views to materialize, (iii) determining the expiry ofa materialized view, and (iv) providing a user interface to tune andvisualize the workload analysis. We describe each of these below.
5.1 The Feedback LoopPicking the right set of views to materialize is a hard problem. State-of-the-art approaches rely on what-if optimization to estimate theexpected improvements if the view were to be materialized [2]. Un-fortunately, the optimizer cost estimates are often way off due to thepresence of complex DAGs and user code. The problem becomeseven more severe in a distributed cloud setting where virtual hard-ware and scheduling issues make it even harder to model the actualgains in terms of job latencies. As a result, the actual improvementsfrom a materialized view may be much lower while its actual mate-rialization costs may be much higher than the estimated ones. Thus,we need higher confidence on which views to materialize and donot want to materialize a view which later ends up not being used,thereby wasting customer money in a job service. This gets furtherchallenging with dynamic resource allocation within a job graph aswell as with opportunistic resource allocation in SCOPE [8].
We handle the above issues by providing a feedback loop that rec-onciles compile-time estimates with run-time statistics, as depicted
Compiler Optimizer Scheduler RuntimeQueryResult
Actualruntimestatistics
Optimizedplans&estimatedstatistics
Executiongraphs&resources
CompiledqueryDAGs
WorkloadAnalyzer
Feedback
Figure 8: Feedback loop for computation reuse.
in Figure 8. Our feedback mechanism goes beyond learning fromthe same query, as in LEO [45], and considers arbitrary fine-grainedcommonalities across multiple jobs. We do this by enumerating allpossible subgraphs of all jobs seen within a time window in the past,e.g., a day or a week, and finding the common subgraphs acrossthem. Though this is more restricted than considering generalizedviews2, the subgraphs considered have actually been used in the past(likely to be also used in the future) and there are runtime statisticsavailable from those previous runs (can cost them more accurately).
In order to use the runtime statistics from the previous runs, weconnect the job data flow (one which actually gets executed on acluster of machines) back to the job query graph (the tree represen-tation of the input user query). We do this by linking the operatorsexecuted at every stage in the data flow to operators in the querygraph. Then, for every query subgraph, we extract correspondingruntime statistics from the data flow. These include latency (timetaken to execute the subgraph), cardinality (number of output rows inthe subgraph), data size (in bytes), and resource consumption (CPU,memory, parallelism, IO, etc.). In cases where several operators arepipelined in a data flow, we attribute runtime statistics such as re-source consumption to individual operators, e.g., by sub-dividingthe total resource consumption of all pipelined operators based onthe exclusive runtime of each operator in the pipeline.
Our feedback loop has several key benefits. First, there is aninevitable duplication of analysis in user scripts, due to commondata preparation needed in multiple analyses or simply due to thefact that developers often start from someone else’s script beforeadding their own logic. With the feedback loop in our job service,users do not have to worry about de-duplicating their scripts; thesystem takes care of doing it automatically at runtime. Second,the runtime statistics provide more predictable measures of viewmaterialization costs and benefits, thereby giving the customer abetter idea of how much he will pay and how much he will savewith this feature. Third, the feedback loop makes it more likely thatthe selected (and materialized) subgraphs will actually end up beingused in future jobs, in contrast to picking materialized views basedon cost estimates and later finding them not useful if the estimatesturn out to be incorrect. Fourth, our feedback loop considers jobsubgraphs without considering merging two or more subgraphs, as inmore general view selection. This ensures that materializing a viewnever requires additional computation (and hence additional money)than that would anyways be done by a job using that view. Andfinally, the runtime statistics observed from the subgraphs of one jobget shared across all future queries having any of those subgraphs.In fact, for any new job that comes in, the system may already know
2Queries Q1 and Q2 reading attributes (A, B) and (A, C), respectively, would generatea view (A, B, C) as candidate, even though it is neither a subgraph of Q1 nor of Q2.

the costs of its several subgraphs and may decide to not recomputethem.
5.2 Selecting Subgraphs to MaterializeAs mentioned before, we simplify the view selection problem by re-stricting ourselves to common subgraphs. Although this is more lim-ited than generalized view selection, we are able to capture preciseutility and cost estimates, since the subgraphs have been executedin the past. In addition, during query rewriting we simply scan thematerialized view, without incurring any other post-processing, andhence the gains are more predictable.
We consider two kinds of approaches to select the subgraphs tomaterialize:(i) selecting the top-k subgraphs using one or more heuristics, e.g.,total subgraph utility, or total utility normalized by storage cost, orlimiting to at most one subgraph per-job, etc. The system allowsusers to plug in custom heuristics to narrow down to the subgraphsof their interest.(ii) packing the most interesting subgraphs (or subexpressions) givena set of constraints, e.g., storage constraints, view interaction con-straints, etc. We investigated the subexpression packing problem inmore details in a companion work [24].
5.3 Physical DesignOne of the early lessons we learned in this project was the importanceof view physical design. The physical design of materialized viewsis typically not paid much attention, i.e, views and their physicaldesign are typically not selected at the same time. However, weobserved that materialized views with poor physical design end upnot being used because the computation savings get over-shadowedby any additional repartitioning or sorting that the system needs to do.This happens because with massively large datasets and massivelyparallel processing in SCOPE, repartitioning and sorting are oftenthe slowest steps in the job execution.
CLOUDVIEWS, therefore, pays close attention to view physicaldesign. To do so, we extract the output physical properties (partition-ing type, partitioning columns, number of partitions, sort columns,sort direction) of each of the subgraph while enumerating them. Theoutput physical properties are good hints for view physical design asthey are expected by subsequent operators in the job graph. In caseof no explicit physical properties at the subgraph root, we infer themfrom the children, i.e., we traverse down until we hit one or morephysical properties. Depending on how an overlapping subgraph isused in different jobs, there may be multiple sets of physical proper-ties for the same subgraph. The default strategy is to pick the mostpopular set. However, in case of no clear choice, we treat multiplephysical designs (of the same view) as different views and feed themto the view selection routine.
5.4 Expiry and PurgingAlthough storage is cheap, the storage space used by materializedviews still needs to be reclaimed periodically. A simple heuristic isto remove all views from the previous recurring instance. However,discussions with our customers revealed that output of hourly jobscould also be used in weekly jobs or monthly jobs. Therefore, re-moving views after each hour/day could be wasteful. A better option
is to track the lineage of the inputs of the view, i.e., for each ofthe view input, check the longest duration that it gets used by anyof the recurring jobs. The maximum of all such durations gives agood estimate of the view expiry. Apart from using standard SCOPEscripts, this type of lineage tracking could also be facilitated usingprovenance tools such as Grok [43] and Guider [35], or Goods [21].The view expiry thus obtained is encoded into the physical files, andour Storage Manager takes care of purging the file once it expires.
Cluster admins could also reclaim a given storage space by run-ning the same view selection routines as described in Section 5.2but replacing the max objective function with a min, i.e., pickingthe views with minimum utility. In the worst case, the materializedview files can be simply erased from the cluster. Both of the aboveoperators, however, require cleaning the views from the metadataservice first before deleting any of the physical files (to ensure thatjobs consuming any of those inputs do not fail).
5.5 User InterfacesCLOUDVIEWS provides a few ways to interact with the workloadanalyzer. First, there is a command line interface to run the analyzerover user specific cluster, VCs and time ranges. Users can also pro-vide their custom constraints, e.g., storage costs, latency, CPU hours,or frequency, to filter down the overlapping computations. Then,there is a Power BI [39] dashboard to look at various summariesfrom computation overlap analysis, as well as drill down into thetop-100 most overlapping computations in more detail. Together,the goal is to help users understand the computation overlap in theirworkloads and to tailor computation reuse for their needs.
6 CLOUDVIEWS RUNTIMEIn this section, we describe the various components that make com-putation reuse possible during query processing. We collectivelyrefer to them as the CLOUDVIEWS runtime, which consists of: (i) ametadata service to query the relevant overlaps in each incoming job,(ii) an online view materialization capability to materialize viewsas part of query processing, (iii) a synchronization mechanism toprevent concurrent jobs materializing the same view, (iv) an earlymaterialization technique to publish a materialized view even beforethe job producing it completes, (v) automatic query rewriting touse materialized views wherever possible, and (vi) hints to the jobscheduler in order to maximize the computation reuse.
6.1 Metadata ServiceThe goal of the metadata service is to provide the lookup for overlap-ping computations and to coordinate the materialization and reuse ofthose computations. Recall that we have an online setting, i.e., databatches and jobs arrive continuously, and hence view materializationand reuse is a dynamic activity. Therefore, instead of simply lookingup the views in the compiler, multiple SCOPE components interactwith the metadata service at runtime, as illustrated in Figure 9.
First, the compiler asks the metadata service for overlappingcomputations (views) for a given job J (Step 1). The naïve approachwould be for the compiler to lookup each subgraph individually tocheck whether or not this is an overlapping computation. However,the number of lookup requests can explode since SCOPE job graphscan be quite large, thereby leading to higher compilation overhead

CloudViews Metadata Service
1
2
3
4
5
6
Compiler Optimizer JobManager
Get relevant views for a job J
Propose to materialize a view Vs, with precise signature s
Report successful materialization of Vs
List of normalized signatures
Exclusive lock Success/Failure
Lock Release ACK
Figure 9: CLOUDVIEWS metadata service interactions with dif-ferent SCOPE components.
as well as higher throughput requirements from the metadata service.Instead, we make one request per-job and fetch all overlaps thatcould be relevant for that job. This is done by creating an invertedindex as follows. For each overlapping computation instance, weextract tags from its corresponding job metadata. We normalize thetags for recurring jobs and create an inverted index on the tags topoint to the corresponding normalized signatures. The metadataservice returns the list of normalized signatures relevant to J to thecompiler (Step 2). The signatures returned by the metadata servicemay contain false positives, and the optimizer still needs to matchthem with the actual signatures in the query tree.
Second, when the optimizer tries to materialize an overlappingcomputation, it proposes the materialization to the metadata service(Step 3). The metadata service tries to create an exclusive lock tomaterialize this view. Due to large number of concurrently runningjobs, the same view could be already materialized by another job,i.e., the lock already exists. In this case, the service returns a failuremessage, otherwise, it returns success (Step 4). Note that we minethe average runtime of the view subgraph from the past occurrences,and use that to set the expiry of the exclusive lock. Once the exclusivelock expires, and if the view is still not materialized, another jobcould try to create the same materialized view. This gives us a fault-tolerant behavior for view materialization.
Finally, the job manager reports the successful materialization of aview to the metadata service (Step 5) and the service acknowledgesthe lock release (Step 6). The metadata service now makes thematerialized view available for other jobs to reuse, i.e., it may appearthe next time the compiler asks for relevant views for a job (Step1).
We deployed our metadata service using AzureSQL as the back-end store. The metadata service periodically polls for the output ofCLOUDVIEWS analyzer and loads the set of selected overlappingcomputations whenever new analysis is available. We purge expiredcomputations at regular intervals.
6.2 Online MaterializationTraditional materialized views require an offline process where thedatabase administrator is responsible to first create all relevant ma-terialized views, i.e., the preprocessing step, before the databasebecomes available for running the query workload. This is not possi-ble with recurring jobs which run in tight data pipelines with strictcompletion deadlines, where there is little room to do the prepro-cessing for creating the materialized views. Preprocessing blocks therecurring jobs, thereby causing them to miss their completion dead-lines. Recurring jobs also have data dependency between them, i.e.,
Core Plan Search
Follow-up Optimization
Input: set of annotations that could be relevant for this job
Output: plan with one or more view materialization / reuse
Top-down Enumeration
Norm Matches
Precise Match
Precise Match
... ...
Get Stats on View and Propagate them
......
No Precise Match
} Overall best plan
Bottom-up Enumeration
Norm Matches
Propose Materialize
Propose Materialize
... ...
Physical Properties
Physical Properties
Encode precise signature and JobID... ...
...
Propose Materialize
New plan
Limited
Encode precise signature and JobID
Get Stats on View and Propagate them
Follow-up on the best plan
Re-optimize the new plan
Figure 10: Illustrating online materialization and query rewrit-ing mechanisms in the SCOPE query optimizer.
the result of one recurring job is used in subsequent recurring jobs.Thus, missing completion deadline for one recurring jobs affects theentire data pipeline.
We introduce a mechanism for creating and reusing materializedviews as part of the query processing, as depicted in Figure 10. Af-ter fetching the relevant normalized signatures from the metadataservice, the compiler supplies them as annotations to the query opti-mizer. The compiler also preserves the annotations as a job resourcefor future reproducibility. The optimizer first checks for all reuseopportunities in the plan search phase before trying to materializeone or more views in a follow-up optimization phase, shown in lowerhalf of Figure 10. This ensures that views already materialized (andavailable) are not attempted for materialization. During follow-upoptimization, the optimizer checks whether the normalized signatureof any of the subgraphs matches with the ones in the annotation. Wematch the normalized signatures in a bottom-up fashion (material-izing smaller views first as they typically have more overlaps) andlimit the number of views that could be materialized in a job (couldbe changed by the user via a job submission parameter). In case ofa match, the optimizer proposes to materialize the view (Step 3 inFigure 9). On receiving success from the metadata service, the opti-mizer adjusts the query plan to output a copy of the sub-computationto a materialized view, while keeping the remainder of the queryplan unmodified as before. The new output operator also enforcesthe physical design mined by the analyzer for this view. The opti-mizer takes care of adding any extra partitioning/sorting operatorsto meet those physical property requirements. The optimizer storesthe precise signature of each materialized view as well as the IDof the job producing the materialized view (for tracking the viewprovenance) into the physical path of the materialized file.
The salient features of our approach are as follows. First, weintroduce a mechanism to create materialized views with minimaloverhead as part of the query processing, without requiring any up-front preprocessing that would block the recurring queries. Second,our approach causes the first query that hits a view to materializeit and subsequent queries to reuse it wherever possible. As a result,we materialize views, and hence consume storage, just when theyare to be needed, instead of creating them a priori long before they

would ever be used. Third, we do not need to coordinate betweenthe query which materializes the view (as part of its execution), andthe queries which reuse that materialized view; in case of multi-ple queries arriving at the same time, the one which finishes firstmaterializes the view. Fourth, in case there is a change in queryworkload starting from a given recurring instance, then the viewmaterialization based on the the previous workload analysis stopsautomatically as the signatures do not match anymore. This avoidspaying for and consuming resources for redundant views that are notgoing to be used after all. This also indicates that it is time to rerunthe workload analysis. Finally, our approach does not affect any ofthe user infrastructure in their analytics stack. This means that theuser scripts, data pipelines, query submission, job scheduling, allremain intact as before.
For traditional users with enough room for upfront view material-ization, e.g., weekly analytics, CLOUDVIEWS still provides an of-fline view materialization mode. In this mode, the optimizer extractsthe matching overlapping computation subgraph while excludingany remaining operation in the job. The resulting plan materializesonly the views and could be executed offline, i.e., before runningthe actual workload. The offline mode can be configured at the VClevel in the metadata service, and later the annotations passed tothe optimizer are marked either online or offline depending on themetadata service configuration.
6.3 Query RewritingTo rewrite queries using materialized views, we added an additionaltask in the Volcano style plan search [16]. This additional task,as shown in the upper half of Figure 10, matches the normalizedsignatures retrieved from the metadata service with the normalizedsignatures of each of the query subgraphs in a top-down fashion, i.e,we match the largest materialized views first. In case of a match,the optimizer matches the precise signature as well. Only if theprecise signature matches then the materialized view could be reused.In such a scenario, the optimizer adds an alternate subexpressionplan which reads from the materialized view. We do not limit thenumber of materialized views that could be used to answer a query.Once all applicable materialized views have been added as alternatesubexpressions, the optimizer picks the best plan based on the costestimates, i.e., one or more materialized views may end up notbeing used if their read costs are too high. The plan that readsfrom the materialized view also loads the actual statistics (for thatsub-computation) and propagates those statistics up the query tree.This gives more confidence in deciding whether the plan using thematerialized view is actually a good one or not. Overall, we providefully automatic query rewriting using views, with zero changes touser scripts.
6.4 SynchronizationWe have two goals in terms of synchronization: (i) build-build syn-chronization, i.e., not having multiple jobs materialize the same view,and (ii) build-use synchronization, i.e., reuse a computation as soonas it is materialized. We handle the build-build synchronization bytrying to reuse computations before trying to materialize them, asdescribed in Section 6.2. For concurrent jobs, we also create ex-clusive locks via the metadata service, as described in Section 6.1.
Given that the service is backed by AzureSQL, it provides consistentlocking, and only a single job can actually materialize a view ata time. To handle the build-use synchronization, we modified theSCOPE job manager to publish the materialized view as soon as it isavailable. This means that the materialized view output is availableeven before the job that produces it finishes. We refer to this asearly materialization. Early materialization is a semantic changeas it breaks the atomicity of SCOPE jobs, however, it very usefulbecause the views could be a much smaller subgraph of the overalljob graph. Furthermore, the materialized view is not a user output,but is rather treated as a system output, and therefore we do notaffect the user contract. Finally, early materialization also helps incase of jobs failures, since the job can restart from the materializedview now, i.e., early materialization acts as a checkpoint.
6.5 Job CoordinationThe perfect scenario for computation reuse is when one of the jobswith overlapping computation is scheduled before others, so thatthe view could be computed exactly once and reused by all others.However, in reality, multiple jobs containing the same overlappingcomputation could be scheduled concurrently. In this case, they willrecompute the same subgraph and even attempt to materialize it(though only one will prevail). We mitigate this problem by reorder-ing recurring jobs in the client job submission systems3. To do this,in addition to selecting the interesting computations to materialize,the CLOUDVIEWS analyzer also provides the submission order ofthe recurring jobs, that contain those computations, which will givethe maximum benefit. We do this by grouping jobs having the samenumber of overlaps (job with multiple overlaps can appear in multi-ple groups), and picking the shortest job in terms of runtime, or leastoverlapping job in case of a tie, from each group. The deduplicatedlist of above jobs will create the materialized views that could beused by all others, and so we propose to run them first (orderedby their runtime and breaking ties using the number of overlaps).Such an ordering can be enforced using the SCOPE client-side jobsubmission tools. Future work will look into how view-awarenesscould be handled centrally by the job scheduler itself.
7 EVALUATIONIn this section, we present an experimental evaluation of CLOUD-VIEWS. We break down our evaluation into three parts, answeringeach of the following questions: (i) what is the impact on perfor-mance over production jobs at Microsoft? (ii) what is the impacton traditional TPC-DS benchmark? and (iii) what are the overheadsinvolved in CLOUDVIEWS? Below we address each of these.
7.1 Impact on Production JobsWe first present performance evaluation results from our productionclusters. Given the capacity constraints and costs involved in runningexperiments on these clusters, we carefully picked a small set of jobworkload for our evaluation, as described below.
Workload. We ran CLOUDVIEWS analyzer over one day worth ofjobs from one of the largest business units at Microsoft. We narroweddown the overlapping computations to those appearing at least thrice,3There are multiple client side tools developed and maintained by different businessunits at Microsoft to create workflows on top of our job service.

PN Hours
Queries Baseline CloudViews
1 67 139 -107.462686567164
2 250 56 77.6
3 67 221 -229.850746268657
4 192 47 75.5208333333333
5 64 95 -48.4375
6 59 74 -25.4237288135593
7 73 39 46.5753424657534
8 73 36 50.6849315068493
9 84 51 39.2857142857143
10 59 102 -72.8813559322034
11 72 51 29.1666666666667
12 85 50 41.1764705882353
13 108 47 56.4814814814815
14 79 63 20.253164556962
15 65 27 58.4615384615385
16 362 53 85.3591160220994
17 103.3 116.1 -12.3910939012585
18 247.6 60.6 75.5250403877221
19 723.8 38.6 94.667035092567
20 78.8 22.4 71.5736040609137
21 111.6 18.1 83.7813620071685
22 163.3 20.3 87.5688916105328
23 103.2 20.2 80.4263565891473
24 102 19.8 80.5882352941177
25 169.6 21.7 87.2051886792453
26 126 22.8 81.9047619047619
27 75.7 26.1 65.5217965653897
28 216.6 27.4 87.3499538319483
29 68.4 60.5 11.5497076023392
30 138.9 59.1 57.451403887689
31 104.8 89.7 14.4083969465649
32 245.5 60.7 75.2749490835031
4538.1 1835.1 1138.9148314294
Latency
Queries Baseline CloudViews
1 148 180 -21.6216216216216
2 268 103 61.5671641791045
3 173 241 -39.3063583815029
4 261 89 65.9003831417624
5 142 140 1.40845070422535
6 120 100 16.6666666666667
7 117 89 23.9316239316239
8 149 82 44.9664429530201
9 181 86 52.4861878453039
10 104 154 -48.0769230769231
11 143 91 36.3636363636364
12 133 85 36.0902255639098
13 185 68 63.2432432432432
14 128 107 16.40625
15 106 66 37.7358490566038
16 444 107 75.9009009009009
17 147 122 17.0068027210884
18 329 108 67.1732522796353
19 689 61 91.1465892597968
20 144 61 57.6388888888889
21 189 35 81.4814814814815
22 256 45 82.421875
23 165 40 75.7575757575758
24 166 62 62.6506024096386
25 257 54 78.988326848249
26 185 87 52.972972972973
27 214 145 32.2429906542056
28 291 55 81.0996563573883
29 145 98 32.4137931034483
30 223 81 63.677130044843
31 159 122 23.2704402515723
32 334 98 70.6586826347305
6695 3062 1394.26318213547
CPU
Tim
e (m
ins)
0
75
150
225
300
Jobs1 2 3 4 5 6 7 8 9 10 11 12 13 14 15 16 17 18 19 20 21 22 23 24 25 26 27 28 29 30 31 32
BaselineCloudViews
Tota
l PN
Hou
rs (m
ins)
0
1250
2500
3750
5000
Baseline CloudViews
60% drop
Run
time
(s)
0
100
200
300
400
Jobs1 2 3 4 5 6 7 8 9 10 11 12 13 14 15 16 17 18 19 20 21 22 23 24 25 26 27 28 29 30 31 32
BaselineCloudViews
Tota
l Run
time
(s)
0
1750
3500
5250
7000
Baseline CloudViews
54% drop
�1
Figure 11: Production jobs: end-to-end latency.
whose cost is at least 20% of the overall job cost, and considering atmost one overlapping computation per job. From the resulting set ofoverlapping computations, we picked the top-3 computations (views)based on their total utility, i.e., frequency times the average runtimeof the overlapping computations. For each of these computations,we looked up the jobs relevant to those computations to constructour workload, consisting of a total of 32 jobs — 16, 12, and 4 jobsrespectively for the three overlapping computations.
Setup. We ran the above jobs in a pre-production environment andover production data, but with output redirection as described in [1].For each view, we ran the relevant jobs in a sequence, in the same or-der as they arrived in the past workload. The first job in the sequencematerializes the overlapping computation, while the remaining jobsreuse it. We executed each job twice, once with and once withoutCLOUDVIEWS enabled. In order to make the two runs comparable,we used the same number of machine instances and disabled oppor-tunistic scheduling [8]. We also validated the outputs of the two runsto ensure that there is no data corruption.
Results. Figure 11 shows the end-to-end job latency. While there islatency improvement in all but three jobs that create the materializedview, the actual improvements vary (maximum of 91% speedupand 48% slowdown, and average speedup of 43%). This is due to anumber of factors, including: (i) materialized view read costs couldbe significant and variable based on the parallelism used at runtime,(ii) accurate estimates are propagated only in the subexpression thatuses a view and the estimates are still way off in other cases (oftenover-estimated to avoid failures in big data systems), (iii) there couldbe additional partitioning or sorting applied by the optimizer tosatisfy the required physical properties of the parent subexpressions(very hard to get the best view physical design for every query), and(iv) latency improvements depend on the degree to which the overlapis on the critical path. Still, the overall workload sees a total latencyimprovement of 60% and even though we evaluated some of the mostoverlapping jobs for this particular customer, it demonstrates theeffectiveness of CLOUDVIEWS in speeding up analytical jobs in ourjob service.
Figure 12 shows the resource consumption in terms of the to-tal CPU-hours for each of the jobs in our workload. Similar tolatency, CPU-hour improvements are also variable (maximum of95% speedup, minimum of 230% slowdown, and average speedup of36%). In particular, increased parallelism to read and write the mate-rialized view, which could be often large, affects the overall resourceconsumption. Overall, however, there is a 54% drop in CPU time
PN Hours
Queries Baseline CloudViews
1 67 139 -107.462686567164
2 250 56 77.6
3 67 221 -229.850746268657
4 192 47 75.5208333333333
5 64 95 -48.4375
6 59 74 -25.4237288135593
7 73 39 46.5753424657534
8 73 36 50.6849315068493
9 84 51 39.2857142857143
10 59 102 -72.8813559322034
11 72 51 29.1666666666667
12 85 50 41.1764705882353
13 108 47 56.4814814814815
14 79 63 20.253164556962
15 65 27 58.4615384615385
16 362 53 85.3591160220994
17 103.3 116.1 -12.3910939012585
18 247.6 60.6 75.5250403877221
19 723.8 38.6 94.667035092567
20 78.8 22.4 71.5736040609137
21 111.6 18.1 83.7813620071685
22 163.3 20.3 87.5688916105328
23 103.2 20.2 80.4263565891473
24 102 19.8 80.5882352941177
25 169.6 21.7 87.2051886792453
26 126 22.8 81.9047619047619
27 75.7 26.1 65.5217965653897
28 216.6 27.4 87.3499538319483
29 68.4 60.5 11.5497076023392
30 138.9 59.1 57.451403887689
31 104.8 89.7 14.4083969465649
32 245.5 60.7 75.2749490835031
4538.1 1835.1 1138.9148314294
Latency
Queries Baseline CloudViews
1 148 180 -21.6216216216216
2 268 103 61.5671641791045
3 173 241 -39.3063583815029
4 261 89 65.9003831417624
5 142 140 1.40845070422535
6 120 100 16.6666666666667
7 117 89 23.9316239316239
8 149 82 44.9664429530201
9 181 86 52.4861878453039
10 104 154 -48.0769230769231
11 143 91 36.3636363636364
12 133 85 36.0902255639098
13 185 68 63.2432432432432
14 128 107 16.40625
15 106 66 37.7358490566038
16 444 107 75.9009009009009
17 147 122 17.0068027210884
18 329 108 67.1732522796353
19 689 61 91.1465892597968
20 144 61 57.6388888888889
21 189 35 81.4814814814815
22 256 45 82.421875
23 165 40 75.7575757575758
24 166 62 62.6506024096386
25 257 54 78.988326848249
26 185 87 52.972972972973
27 214 145 32.2429906542056
28 291 55 81.0996563573883
29 145 98 32.4137931034483
30 223 81 63.677130044843
31 159 122 23.2704402515723
32 334 98 70.6586826347305
6695 3062 1394.26318213547
CPU
Tim
e (m
ins)
0
75
150
225
300
Jobs1 2 3 4 5 6 7 8 9 10 11 12 13 14 15 16 17 18 19 20 21 22 23 24 25 26 27 28 29 30 31 32
BaselineCloudViews
Tota
l PN
Hou
rs (m
ins)
0
1250
2500
3750
5000
Baseline CloudViews
60% drop
Run
time
(s)
0
100
200
300
400
Jobs1 2 3 4 5 6 7 8 9 10 11 12 13 14 15 16 17 18 19 20 21 22 23 24 25 26 27 28 29 30 31 32
BaselineCloudViews
Tota
l Run
time
(s)
0
1750
3500
5250
7000
Baseline CloudViews
54% drop
�1
Figure 12: Production jobs: resource consumption.
for the entire workload. Again, this is quite significant for reducingoperational costs in our clusters.
7.2 TPC-DS ExperimentsWe now present results from TPC-DS benchmark [48]. Even thoughTPC-DS does not really model the recurring workloads with produc-er/consumer behavior that we have in SCOPE, it is still helpful toevaluate our system on a more widely used benchmark.
Workload. We generated 1TB of TPC-DS dataset and considered allof the 99 queries in the benchmark. We ran all TPC-DS queries oncewithout using CLOUDVIEWS. Then, we ran the CLOUDVIEWS ana-lyzer to detect and select top-10 overlapping computations, similarto what was described in Section 7.1. Note that this is a very con-servative selection of overlapping computations, and much highergains could be realized by using more sophisticated view selectionmethods proposed in the literature [33].
Setup. We ran the above workload in a test environment using theCLOUDVIEWS runtime. We use our job coordination hints to runone of the jobs containing an overlap first (to create the materializedview) and the other jobs containing the same overlap after that (touse the materialized view). We ran each query with 100 machineinstances and disabled opportunistic scheduling [8] in order to makethe performance comparable.
Results. Figure 13 shows the runtime improvements with CLOUD-VIEWS in each of the TPC-DS queries. We can see that even withour conservative selection of overlapping computations, most of thequeries (79 out of 99) see an improvement in performance. Boththe peak improvement as well as the peak slowdown is close to62%. Overall, the average runtime improves by 12.5%, while the totalworkload runtime improves by 17%. These would translate to signifi-cant cost savings in a job service where users pay for the resourcesused, which is proportional to the runtime, per query.
7.3 OverheadsFinally, we discuss some of the overheads associated with CLOUD-VIEWS. First, we have an overhead of running the CLOUDVIEWS
analyzer. A typical run to analyze all jobs (several tens of thousands)in a cluster takes a couple of hours. However, since we analyze therecurring templates, we only need to analyze once in a while whenthere are changes in workload. We detect changes in workload bymonitoring changes in the number of materialized views createdover time.

Table 1
Queries Baseline CloudViews Change
1 412 285 30.8252427184466
2 1288 980 23.9130434782609
3 792 702 11.3636363636364
4 1946 1168 39.9794450154162
5 2191 1643 25.0114103149247
6 1679 739 55.9857057772484
7 1310 496 62.1374045801527
8 1075 738 31.3488372093023
9 430 447 -3.95348837209302
10 1288 1108 13.9751552795031
11 1713 885 48.3362521891419
12 761 606 20.3679369250986
13 1315 1040 20.9125475285171
14 4053 3294 18.7268689859363
15 652 626 3.98773006134969
16 1157 1046 9.59377700950735
17 2373 1659 30.0884955752212
18 1139 691 39.332748024583
19 942 652 30.7855626326964
20 911 564 38.0900109769484
21 321 162 49.5327102803738
22 412 296 28.1553398058252
23
24 1158 1000 13.6442141623489
25 1820 2156 -18.4615384615385
26 723 1102 -52.4204702627939
27 823 812 1.33657351154313
28 1339 1038 22.4794622852875
29 1819 1738 4.45299615173172
30 347 262 24.4956772334294
31 711 668 6.0478199718706
32 714 537 24.7899159663866
33
34 1423 1011 28.952916373858
35 936 776 17.0940170940171
36 498 534 -7.2289156626506
37 509 290 43.0255402750491
38 1259 1048 16.7593328038126
39 340 470 -38.2352941176471
40 653 622 4.74732006125574
41 94 122 -29.7872340425532
42 396 385 2.77777777777778
43 520 488 6.15384615384615
44 782 797 -1.91815856777494
45 793 626 21.0592686002522
46 1324 646 51.2084592145015
47 1184 1289 -8.86824324324324
48 770 633 17.7922077922078
49 2407 2259 6.14873286248442
50 1634 975 40.3304773561811
51 655 538 17.8625954198473
52 403 576 -42.9280397022332
53 712 586 17.6966292134831
54 1525 1257 17.5737704918033
55 666 648 2.7027027027027
56 1357 1090 19.6757553426676
57 779 679 12.8369704749679
58 1287 1035 19.5804195804196
59 777 1137 -46.3320463320463
60 1082 1121 -3.60443622920518
61 1686 1130 32.9774614472123
62 375 505 -34.6666666666667
63 760 566 25.5263157894737
64 2304 1948 15.4513888888889
65 1229 907 26.20016273393
66 961 930 3.2258064516129
67 925 779 15.7837837837838
68 809 723 10.6304079110012
69 801 706 11.8601747815231
70 645 710 -10.077519379845
71 1290 1336 -3.56589147286822
72 11112 9483 14.6598272138229
73 1020 873 14.4117647058824
74 870 1072 -23.2183908045977
75 1479 1535 -3.78634212305612
76 665 822 -23.609022556391
77 1220 849 30.4098360655738
Queries
0
3000
6000
9000
12000
1 4 7 10 13 16 19 22 25 28 31 34 37 40 43 46 49 52 55 58 61 64 67 70 73 76 79 82 85 88 91 94 97
Baseline CloudViews
Runt
ime
Impr
ovem
ent (
%)
-70
-56
-42
-28
-14
0
14
28
42
56
70
1 3 5 7 9 11 13 15 17 19 21 23 25 27 29 31 33 35 37 39 41 43 45 47 49 51 53 55 57 59 61 63 65 67 69 71 73 75 77 79 81 83 85 87 89 91 93 95 97 99
�1
Figure 13: TPC-DS queries: percentage runtime improvements.
Then, there is compile time overhead to lookup the metadataservice and to do additional work during query optimization. Wemeasured the latency added due to metadata service lookup and itturned out to be 19ms on average with a single thread and 14.3mson average when using 5 threads in the metadata service. This is rea-sonable given that the overall compilation time for TPC-DS querieswas in the range of 1-2 minutes. Likewise, we measured the queryoptimization overhead with CLOUDVIEWS over TPC-DS queries. In-terestingly, while the optimization time increased by 28% on averagewhen creating a materialized view, the optimization time decreasedby 17% on average when using the view. This is because the querytree becomes smaller when using the view and so any follow-upoptimizations become faster.
8 LESSONS LEARNEDIn this section, we outline experiences from deploying CLOUD-VIEWS to our production clusters. The CLOUDVIEWS analyzer isavailable as an offline tool for VC admins, while the CLOUDVIEWS
runtime ships with the most recent SCOPE release. The technologyis currently in preview and available to our customers in an opt-inmode, i.e., each VC admin can enable CLOUDVIEWS either for theentire VC or for certain jobs in that VC. Eventually, the goal isto make CLOUDVIEWS opt-out, i.e., overlapping computations arereused wherever possible, but customers can explicitly turn it off inspecial cases, e.g., SLA sensitive jobs. Below we summarize the keylessons learned from the CLOUDVIEWS project.
Discovering hidden redundancies. Data analytics jobs have hiddenredundancies across users (or sometimes even for the same user), andit is really hard to detect and mitigate these redundancies manuallyat scale. Most of the customers we talked to already expected tohave computation overlaps in their workloads, and it was interestingfor them to see the exact jobs and the overlapping computationspresent in them. While some of the customers were willing to takethe pain of manually modifying their scripts to prevent overlaps,most preferred to use our automatic reuse approach instead.
Improving data sharing across VCs. SCOPE workloads are typi-cally organized as data pipelines, with dependencies across VCs thatare fulfilled via explicit data materialization. With CLOUDVIEWS,we could help customers detect the most efficient of these material-izations, better than those from the manual best effort and that couldspeedup downstream processing. This is an interesting side-effect ofCLOUDVIEWS and would be a subject for future work.
Extracting static computations. In many cases, we saw that therewere overlapping computations even across multiple recurring in-stances of the same job, i.e., even with different inputs. This was be-cause portions of the job were unchanged across multiple instances,i.e., the inputs to those portions were still the same while other por-tions of the job had different inputs. CLOUDVIEWS was thereforeeffective in detecting such static computations across multiple jobinstances.
Reusing existing outputs. In several other cases, a subgraph rootedat an output operator was common across jobs. This means that mul-tiple jobs were producing the same output without ever realizing it.CLOUDVIEWS was helpful to consolidate such redundant outputs bymaterializing the common computation once and reusing it whereverpossible; we separately asked the owners of those jobs to removethe redundant output statements in their jobs.
Discarding redundant jobs. In multiple cases, entire jobs weredetected as overlapping. This was because of two reasons: (i) giventhat jobs are recurring, some of the jobs end up scheduled morefrequently than the new data arrival, and (ii) there were rare casesof plain redundancy where multiple users unknowingly submit thesame job. CLOUDVIEWS helped in detecting such redundancies.
Utility of view physical design. Our workloads had explicit datadependencies across jobs, but the users had little idea on how toset the physical designs of the output from one job that needs tobe consumed by another job. With CLOUDVIEWS, we not onlycapture many of these dependencies across jobs, but also pick thebest physical designs for those dependency outputs.
Better reliability. By materializing the shared computations acrossjobs, CLOUDVIEWS not only provides better performance, but it alsoreduces the failure rates as fewer tasks are scheduled in subsequentjobs hitting the same overlapping computation. Thus, view mate-rialization acts as a checkpoint providing better reliability. This isfurther useful when the first job that hits an overlapping computationfails, since the overlapping portion may be already materialized dueto early materialization in CLOUDVIEWS runtime.
Better cost estimates. As mentioned before, view materializationimproves the cost estimates since we can collect exact statistics fromthe materialized output. Given that we materialize computationsthat are frequent as well as expensive, better estimates over thosecomputations are even more significant.

User expectations. It was important to manage the user expectationsin CLOUDVIEWS project. This includes VC admin expectations tosee the cost of overlaps in their workload and expected gains withCLOUDVIEWS, end-user expectations to know whats going on intheir job and reacting accordingly, and the operational support teamexpectations to be able to reproduce and debug the jobs submittedwith CLOUDVIEWS enabled.
Updates & privacy regulations. Finally, any updates in the inputdata results in a different precise signature, thus automatically in-validing any older materialized view for reuse. This is crucial forprivacy reasons when the customers explicitly request to stop usingtheir personal data, as provisioned in the new EU GDPR [13].
9 RELATED WORKTraditional materialized views. Selecting views to materialize hasbeen a long standing topic of research in databases. Given a set ofqueries, view selection deals with the problem of selecting a setof views to materialize to minimize some cost function (such asquery evaluation and/or view maintenance cost) under some con-straints (e.g., space budget) [33]. Several approaches have been pro-posed, especially in the context of data warehouses [19, 46] and datacubes [22]. These include modeling the problem as a state optimiza-tion problem and using search algorithm to find the most appropriateview set [46], using AND/OR to model the alternatives in a singleDAG [19], or using a lattice to model data cube operations [22].MQO [42] is similar to view selection, with the difference that viewsare typically only transiently materialized for the execution of agiven query set. [41] describes how to incorporate MQO with aVolcano-style optimizer. It uses an AND/OR DAG and proposesheuristic algorithms for choosing intermediate results to material-ize (with no space budget). Recycling intermediate results has alsobeen proposed in the context of MonetDB [23] and pipelined queryevaluation [36].
Views are more generic than subexpressions, as they can considercomputation that does not appear in the logical query plan. Thisincreases the space of possible solutions, and complicates querycontainment and answering queries using views [20]. Subexpressionselection has also been considered in SQL Server [53]. Other relatedworks have looked at common subexpressions within the same jobscript [44].
All of the above works have focussed on traditional databaseswith few tens to hundreds of queries. In contrast, the SCOPE jobservice processes tens of thousands of jobs per cluster per day. Thus,scalability is a major concern in our setting. In this paper, we de-scribed a system that can create and reuse materialized views at ourscale. In a companion work, we looked at scalable view selectionfor our workload size [24].
Computation reuse in big data platforms. Reusing computationhas received particular attention in big data platforms, since (i) thereis a lot of recurring computation, (ii) optimization time is relativelyshort compared to the execution time of the jobs, and (iii) perfor-mance and resource benefits can be significant. ReStore [12], forinstance, considers the caching of map-reduce job outputs, givena space budget. Others have looked at history-aware query opti-mization with materialized intermediate views [38] and at allocatingthe cache fairly amongst multiple cloud tenants [28]. Still others
have looked at multi-query optimization in the context of map-reduce [37, 50]. PigReuse [10] addresses MQO for Pig scripts. Itcreates an AND/OR graph using the nested algebra representationof the Pig jobs, and then uses an ILP solver to select the least costlyplan that can answer all queries. Most of these works consider shar-ing opportunities only for map and reduce operators, and hence theirapplicability is limited. Nectar [18] considers caching intermediateresult in a more generalized DAG of operators. It uses heuristics,based on lookup frequency and the runtime/size of the intermediateresults, to decide on the cache insertion. Still, an intermediate resultis typically the output of an operator pipeline (i.e., consisting ofmultiple operators), without considering the outputs of all possiblesubexpressions. Finally, Kodiak [30] applies the traditional databaseapproach of selecting and materializing views, while ensuring thatqueries meet their SLA and the total view storage is within a budget.
Our approach is different from the above works, since we considercomputation reuse over recurring jobs in a job service that is alwaysonline, i.e., there is no offline phase for view creation. Furthermore,our end-to-end system includes establishing a feedback loop toensure that computation reuse is actually effective.
Recurring and progressive query optimization. Both recurringand progressive optimization focus on the problem of inaccurate ormissing statistics in query optimization, and not on reusing commonsubexpressions across jobs. In particular, recurring optimization(such as DB2’s LEO [45] and more recently Scope’s RoPE [1])collects actual statistics of query subexpressions at runtime, anduses them in future executions of the same subexpression to improvestatistics, and hence the quality of the optimized plan. Progressive op-timization has been studied both in the traditional query optimizationsetting [7, 26, 34], and for big data clusters [9, 27]. These systemsobserve statistics at runtime and can change the query plan mid-flight in case the observed statistics are significantly different fromthe estimated ones. We borrow the concept of signatures from [9] toefficiently identify common subgraphs across jobs.
Shared workload optimization. A lot of works have looked atbuilding a common query plan for a set of queries to share oper-ators, such as scans [40, 54] or joins [32]. A global optimizationapproach to find the overall best shared plan is presented in [14].Work sharing has also been explored in big data systems. Examplesinclude scan sharing in MapReduce [37], Hive [47] and Pig [51], Un-like such approaches, we opted to keep each job separate: operatorsharing in pay-as-you-go job services makes billing and accountingtedious, while it introduces artificial dependencies between jobs,which become even worse in the case of failures.
10 CONCLUSIONIn this paper, we presented a case for computation reuse in an ana-lytics job service. We motivated the problem via a detailed analysisfrom production SCOPE workloads at Microsoft, and described theCLOUDVIEWS system for automatically reusing overlapping com-putations in SCOPE. The CLOUDVIEWS system addresses severalnovel challenges including recurring workloads, establishing a feed-back loop, and an online setting. Overall, computation overlap is aproblem across almost all business units at Microsoft and CLOUD-VIEWS can automatically reuse computations wherever possible,resulting in significant potential cost savings.

REFERENCES[1] Sameer Agarwal, Srikanth Kandula, Nicolas Bruno, Ming-Chuan Wu, Ion Stoica,
and Jingren Zhou. 2012. Re-optimizing data-parallel computing. In NSDI.[2] Sanjay Agrawal, Surajit Chaudhuri, and Vivek R. Narasayya. 2000. Automated
Selection of Materialized Views and Indexes in SQL Databases. In VLDB. 496–505.
[3] Amazon Athena 2018. https://aws.amazon.com/athena/. (2018).[4] Amazon RDS 2018. https://aws.amazon.com/rds/. (2018).[5] Azure Data Lake 2018. https://azure.microsoft.com/en-us/solutions/data-lake/.
(2018).[6] Azure SQL 2018. https://azure.microsoft.com/en-us/services/sql-database/.
(2018).[7] Shivnath Babu, Pedro Bizarro, and David J. DeWitt. 2005. Proactive Re-
optimization. In SIGMOD Conference. 107–118.[8] Eric Boutin, Jaliya Ekanayake, Wei Lin, Bing Shi, Jingren Zhou, Zhengping Qian,
Ming Wu, and Lidong Zhou. 2014. Apollo: Scalable and Coordinated Schedulingfor Cloud-Scale Computing. In OSDI.
[9] Nico Bruno, Sapna Jain, and Jingren Zhou. 2013. Continuous Cloud-Scale QueryOptimization and Processing. In VLDB.
[10] Jesús Camacho-Rodríguez, Dario Colazzo, Melanie Herschel, Ioana Manolescu,and Soudip Roy Chowdhury. 2016. Reuse-based Optimization for Pig Latin. InCIKM.
[11] Ronnie Chaiken, Bob Jenkins, Per-Åke Larson, Bill Ramsey, Darren Shakib,Simon Weaver, and Jingren Zhou. 2008. SCOPE: easy and efficient parallelprocessing of massive data sets. PVLDB 1, 2 (2008), 1265–1276.
[12] Iman Elghandour and Ashraf Aboulnaga. 2012. ReStore: Reusing Results ofMapReduce Jobs. PVLDB 5, 6 (2012).
[13] EU GDPR 2018. https://www.eugdpr.org/. (2018).[14] Georgios Giannikis, Darko Makreshanski, Gustavo Alonso, and Donald Kossmann.
2014. Shared Workload Optimization. PVLDB 7, 6 (2014).[15] Google BigQuery 2018. https://cloud.google.com/bigquery. (2018).[16] Goetz Graefe. 1995. The Cascades Framework for Query Optimization. IEEE
Data Eng. Bull. 18, 3 (1995), 19–29.[17] Zhongxian Gu, Mohamed A. Soliman, and Florian M. Waas. 2012. Testing the
Accuracy of Query Optimizers. In DBTest. 11:1–11:6.[18] Pradeep Kumar Gunda, Lenin Ravindranath, Chandramohan A. Thekkath, Yuan
Yu, and Li Zhuang. 2010. Nectar: Automatic Management of Data and Computa-tion in Datacenters. In OSDI.
[19] Himanshu Gupta and Inderpal Singh Mumick. 2005. Selection of Views toMaterialize in a Data Warehouse. IEEE Trans. Knowl. Data Eng. 17, 1 (2005),24–43.
[20] Alon Y. Halevy. 2001. Answering queries using views: A survey. VLDB J. 10, 4(2001).
[21] Alon Y. Halevy, Flip Korn, Natalya Fridman Noy, Christopher Olston, NeoklisPolyzotis, Sudip Roy, and Steven Euijong Whang. 2016. Goods: OrganizingGoogle’s Datasets. In Proceedings of the 2016 International Conference on Man-agement of Data, SIGMOD Conference 2016, San Francisco, CA, USA, June 26 -July 01, 2016. 795–806.
[22] Venky Harinarayan, Anand Rajaraman, and Jeffrey D. Ullman. 1996. Implement-ing Data Cubes Efficiently. In ACM SIGMOD.
[23] Milena Ivanova, Martin L. Kersten, Niels J. Nes, and Romulo Goncalves. 2009.An architecture for recycling intermediates in a column-store. In SIGMOD.
[24] Alekh Jindal, Konstantinos Karanasos, Sriram Rao, and Hiren Patel. 2017. ThouShall Not Recompute: Selecting Subexpressions to Materialize at Datacenter Scale.Under Submission (2017).
[25] Sangeetha Abdu Jyothi, Carlo Curino, Ishai Menache, Shravan Matthur Narayana-murthy, Alexey Tumanov, Jonathan Yaniv, Ruslan Mavlyutov, Íñigo Goiri, SubruKrishnan, Janardhan Kulkarni, and Sriram Rao. 2016. Morpheus: Towards Auto-mated SLOs for Enterprise Clusters. In OSDI. 117–134.
[26] Navin Kabra and David J. DeWitt. 1998. Efficient Mid-Query Re-Optimization ofSub-Optimal Query Execution Plans. In SIGMOD Conference. 106–117.
[27] Konstantinos Karanasos, Andrey Balmin, Marcel Kutsch, Fatma Ozcan, VukErcegovac, Chunyang Xia, and Jesse Jackson. 2014. Dynamically optimizingqueries over large scale data platforms. In SIGMOD.
[28] Mayuresh Kunjir, Brandon Fain, Kamesh Munagala, and Shivnath Babu. 2017.ROBUS: Fair Cache Allocation for Data-parallel Workloads. In SIGMOD. 219–234.
[29] Viktor Leis, Andrey Gubichev, Atanas Mirchev, Peter Boncz, Alfons Kemper, andThomas Neumann. 2015. How Good Are Query Optimizers, Really? PVLDB 9, 3(2015), 204–215.
[30] Shaosu Liu, Bin Song, Sriharsha Gangam, Lawrence Lo, and Khaled Elmeleegy.2016. Kodiak: Leveraging Materialized Views For Very Low-Latency AnalyticsOver High-Dimensional Web-Scale Data. PVLDB 9, 13 (2016).
[31] Guy Lohman. 2014. http://wp.sigmod.org/?p=1075. (2014).[32] Darko Makreshanski, Georgios Giannikis, Gustavo Alonso, and Donald Kossmann.
2016. MQJoin: Efficient Shared Execution of Main-Memory Joins. PVLDB 9, 6(2016).
[33] Imene Mami and Zohra Bellahsene. 2012. A survey of view selection methods.SIGMOD Record 41, 1 (2012), 20–29.
[34] Volker Markl, Vijayshankar Raman, David E. Simmen, Guy M. Lohman, andHamid Pirahesh. 2004. Robust Query Processing through Progressive Optimiza-tion. In SIGMOD. 659–670.
[35] Ruslan Mavlyutov, Carlo Curino, Boris Asipov, and Philippe Cudré-Mauroux.2017. Dependency-Driven Analytics: A Compass for Uncharted Data Oceans.In CIDR 2017, 8th Biennial Conference on Innovative Data Systems Research,Chaminade, CA, USA, January 8-11, 2017, Online Proceedings.
[36] Fabian Nagel, Peter A. Boncz, and Stratis Viglas. 2013. Recycling in pipelinedquery evaluation. In ICDE.
[37] Tomasz Nykiel, Michalis Potamias, Chaitanya Mishra, George Kollios, and NickKoudas. 2010. MRShare: Sharing Across Multiple Queries in MapReduce.PVLDB 3, 1 (2010).
[38] Luis Leopoldo Perez and Christopher M. Jermaine. 2014. History-aware queryoptimization with materialized intermediate views. In ICDE.
[39] Power BI 2018. https://powerbi.microsoft.com. (2018).[40] Lin Qiao, Vijayshankar Raman, Frederick Reiss, Peter J. Haas, and Guy M.
Lohman. 2008. Main-memory scan sharing for multi-core CPUs. PVLDB 1,1 (2008).
[41] Prasan Roy, S. Seshadri, S. Sudarshan, and Siddhesh Bhobe. 2000. Efficient andExtensible Algorithms for Multi Query Optimization. In SIGMOD.
[42] Timos K. Sellis. 1988. Multiple-Query Optimization. ACM Trans. Database Syst.13, 1 (1988), 23–52.
[43] Shayak Sen, Saikat Guha, Anupam Datta, Sriram K. Rajamani, Janice Y. Tsai,and Jeannette M. Wing. 2014. Bootstrapping Privacy Compliance in Big DataSystems. In IEEE Symposium on Security and Privacy. 327–342.
[44] Yasin N. Silva, Per-Åke Larson, and Jingren Zhou. 2012. Exploiting CommonSubexpressions for Cloud Query Processing. In ICDE.
[45] Michael Stillger, Guy M. Lohman, Volker Markl, and Mokhtar Kandil. 2001. LEO- DB2’s LEarning Optimizer. In VLDB.
[46] Dimitri Theodoratos and Timos K. Sellis. 1997. Data Warehouse Configuration.In VLDB.
[47] Ashish Thusoo, Joydeep Sen Sarma, Namit Jain, Zheng Shao, Prasad Chakka,Suresh Anthony, Hao Liu, Pete Wyckoff, and Raghotham Murthy. 2009. Hive: awarehousing solution over a map-reduce framework. PVLDB 2, 2 (2009).
[48] TPC-DS Benchmark 2018. http://www.tpc.org/tpcds. (2018).[49] Abhishek Verma, Luis Pedrosa, Madhukar R. Korupolu, David Oppenheimer, Eric
Tune, and John Wilkes. 2015. Large-scale cluster management at Google withBorg. In EuroSys.
[50] Guoping Wang and Chee-Yong Chan. 2013. Multi-Query Optimization in MapRe-duce Framework. PVLDB 7, 3 (2013).
[51] Xiaodan Wang, Christopher Olston, Anish Das Sarma, and Randal Burns. 2011.CoScan: Cooperative Scan Sharing in the Cloud. In SOCC. 11:1–11:12.
[52] Jingren Zhou, Nicolas Bruno, Ming-Chuan Wu, Per-Åke Larson, Ronnie Chaiken,and Darren Shakib. 2012. SCOPE: parallel databases meet MapReduce. VLDB J.21, 5 (2012), 611–636.
[53] Jingren Zhou, Per-Åke Larson, Johann Christoph Freytag, and Wolfgang Lehner.2007. Efficient exploitation of similar subexpressions for query processing. InACM SIGMOD. 533–544.
[54] Marcin Zukowski, Sándor Héman, Niels Nes, and Peter A. Boncz. 2007. Coopera-tive Scans: Dynamic Bandwidth Sharing in a DBMS. In VLDB.


![Turkalytics: Analytics for Human Computation · H.5.m [Information interfaces and presentation (e.g., HCI)]: [Miscellaneous] General Terms Human factors Keywords human processing,](https://img.dokumen.tips/doc/110x75/5f9d09393e7b30583a0c8c1d/turkalytics-analytics-for-human-h5m-information-interfaces-and-presentation.jpg)