Embed Size (px)
Citation preview

MOJ Mining and Metallurgy
Computation and Field Dynamic Stress Simulation of Shovel Crawler Shoes
Submit Manuscript | http://medcraveonline.com
IntroductionElectric cable shovel excavator is widely used in the surface
mining operations of oil sand and other highly abrasive formations. The oil sands mines in Alberta use P&H 4100 C Boss shovel [1,2] for their loading operations. The lower works of this shovel consist of propel and crawler systems [3-7]. The crawler system consists of a crawler track assembly, front and rear idlers, lower rollers and guide rails [3]. The crawler track assembly is made up of shoes that are connected together by link pins to form a continuous chain. The efficiency and reliability of the shovel during the excavation of oil sands depends on the service life of the crawler track. The two crawler tracks interact with the abrasive terrain and distribute the machine and dipper loads to the ground during both propel and loading duty cycles. This interaction generates dynamic loads which can cause stress loading, wear, and crack and fatigue failure of the crawler shoes. The only published study on dynamic stress simulation of shovel crawler shoes was conducted by Frimpong et al. [4-7]. They developed the 3-D virtual prototype model of the rigid-flexible open chain crawler track assembly interacting with oil sands to study stress distribution in the crawler shoes during shovel propel and loading operations.
The load due to machine weight and dipper pay load were distributed on each crawler shoe based on the assumptions obtained from on-field observation. The cyclic ground pressure acting under the P&H 4100C Boss shovel during the loading duty cycle is reported in the field study undertaken by Joseph [8], Joseph et al. [9] & Sharif Abadi et al. [10]. They measured ground bearing pressure acting under shovel front and rear track for three idealized shovel-truck loading duty cycles using passive seismic instrumentation. The present study uses the field data [8-10] to distribute load on the crawler track to determine dynamic stress distribution in the crawler shoes during propel and loading within MSC.ADAMS VIEW/FLEX/ DURABILITY and MSC.NASTRAN [11-15]. This stress results can be used in the subsequent study of crawler shoes for investigating its crack and fatigue failure.
Geometry of the Crawler Track and Load DistributionFrimpong et al. [4-7] developed the open chain crawler track
assembly made up of 13 crawler shoes in contact with the ground with track length of 8.37 m. Sharif Abadi et al. [10] used 9 m as the length of the crawler track in contact with the ground for calculating the static ground pressure from a field study. The
Volume 1 Issue 1 - 2017
Department of Mining and Nuclear Engineering, Missouri University of Science and Technology, USA
*Corresponding author: Samuel Frimpong, Department of Mining and Nuclear Engineering, Missouri University of Science and Technology, Rolla, MO 65401, USA, Tel: 573 34 4753; Email:
Received: August 01, 2017 | Published: December 20, 2017
Review Article
MOJ Mining Met 2017, 1(1): 00003
Abstract
Large capacity electric cable shovels are widely used in surface mining of Athabasca oil sands formation to meet economic production targets. The capital investments and operating costs of these shovels are high due to the abrasive nature of the oil sands formation. The interaction of the crawler tracks of the shovel with the abrasive oil sands formation during shovel propel and loading operation can cause large dynamic stresses in the crawler shoes of the shovel. The study of the dynamic stress distribution in the crawler shoes is important to understand crack initiation, propagation and premature fatigue failure of shoes. This paper develops a multi-body dynamic 3-D virtual prototype model of the rigid-flexible crawler track assembly interacting with oil sands formation to establish the dynamic stress distribution in the crawler shoes of the P&H 4100 BOSS shovel during its propel and loading duty cycles. The field data available for cyclic ground pressure under the shovel during the loading operation is then applied as an input into the 3-D virtual prototype model of the rigid-flexible crawler track assembly to capture the model dynamics and real-time stresses and deformation of flexible crawler shoes within MSC.ADAMS. The flexible crawler shoes are generated in the FEA program MSC.NASTRAN and imported into MSC ADAMS. The simulation results show large fluctuating contact forces developing at the interface between the crawler shoes and oil sands terrain causing large fluctuating stresses in the flexible crawler shoes with a maximum von Mises stress of 79 MPa during both propel and loading cycles. A further study is required to simulate the operations with realistic assumptions to provide a basis for subsequent wear, crack and fatigue life prediction of crawler shoes for extending service life of the crawlers.
Keywords: Surface mining; Crawler-terrain interactions; Rigid-flexible multi-body dynamic theory; Virtual prototype simulation; Field data; Modal analysis; Modal stress recovery

Citation: Frimpong S, Thiruvengadam M, Gbadam E (2017) Computation and Field Dynamic Stress Simulation of Shovel Crawler Shoes. MOJ Mining Met 1(1): 00003. DOI: 10.15406/mojmm.2017.01.00003
Computation and Field Dynamic Stress Simulation of Shovel Crawler Shoes 12Copyright:
©2017 Frimpong et al.
crawler track is also divided into front and rear components to represent cyclic ground bearing pressure acting under shovel during the loading duty cycle. This study uses the ground pressure measured under the shovel front and rear [8-10] as input load on each crawler shoe of the open crawler track chain to simulate stress distribution during propel and loading duty cycles. Another crawler shoe is added to the existing open chain from Frimpong et al. [4-7] to:
i. Increase the track length from 8.37 m to 9.02 m to match the track length in the field study.
ii. Divide track length equally into the front and rear parts each with 7 crawler shoes.
Figure 1 shows the modified crawler track assembly model divided into front and rear parts comprising 14 shoes in contact with the oil sands terrain. The material properties of crawler shoes and oil sand units are illustrated in (Table 1). The crawler shoes 1-14 (numbered in blue) and 247 oil sands units are identified using Part numbers 2-262 as shown in Figure 1. Part 1 is the default ground link in MSC.ADAMS. The global coordinate system is located at point O and is shown in Figure 2. The geometry of the modified crawler track assembly is imported into MSC.ADAMS to develop rigid-flexible virtual prototype model of crawler-terrain interaction. The joint constraint equations for crawler shoes and oil sand units, and motion constraint equations for driver crawler shoe 14 and each spring damper oil sand mass units can be found
in Frimpong et al. [4-7]. The stiffness (k) and damping (c) of the oil sands unit are listed in (Table 1). The motion constraint on driver crawler shoe 14, which can cause the crawler track to accelerate, move at constant speed and decelerate, is deactivated when the loading cycle begins to allow six-DOF free crawler movement. The contact forces between crawler shoes and terrain is estimated using parameters in Table 2. The load distribution on crawler shoes on the front and rear parts estimated from the field study [8-10] is shown in Figure 1. More details on the external forces applied on the crawler shoes can be found in Frimpong et al. [4-7].
12
Figure 1: Modified Crawler Track- Oil Sand Assembly.
Table 1: Material Properties of System [16, 17].
Body Density (kg/m3)
Mass (kg)
Elastic Modulus
Poisson’s Ratio
Stiffness (k) MN/m
Damping (c) (kNs/m)
Crawler Shoe 7847.25 4489.63 200 GPa 0.3 - -
Oil-sand 1600.0 1600 20 Mpa 0.3 20 120
Figure 2: Cyclic ground pressure under shovel front and rear crawler track [8-10].
Table 2: Contact parameters used in the study [7].
Normal Force Friction Force
Contact Stiffness (k, N/m) 1.00E+08 Static Coefficient (µs) 0.5
Max. Contact Damping (cmax, N-s/m) 1.00E+04 Dynamic Coefficient (µd) 0.3
Force Exponent (e) 1.5 Static transition velocity (Vst, m/s) 0.01
Max. Penetration Depth (d, m) 1.00E-04 Dynamic transition velocity (Vd, m/s) 0.1

Citation: Frimpong S, Thiruvengadam M, Gbadam E (2017) Computation and Field Dynamic Stress Simulation of Shovel Crawler Shoes. MOJ Mining Met 1(1): 00003. DOI: 10.15406/mojmm.2017.01.00003
Computation and Field Dynamic Stress Simulation of Shovel Crawler Shoes 13Copyright:
©2017 Frimpong et al.
Ground pressure under the shovel
The ground pressure acting under the shovel for three loading duty cycles for front and rear [8-10] is shown in Figure 2. It takes approximately 45 seconds to complete one duty cycle. Each duty cycle consists of digging, hoisting, swinging from the face and dumping into a spotted haul truck, and swinging back to the digging face to start the next duty cycle. During propel the pressure load on the front and rear crawler shoes are same and is due to empty shovel weight without dipper load. The total machine weight for the P&H 4100C BOSS is 1,410,184 kg [1]. The total area of contact between shovel and ground is 2 x 9 m x 3.51 m = 63.18 m2. The static ground pressure due to machine weight is given in equation (1).
Ps = [(1410184kg x 9.81m / s2) 63.18m2] = 218.960kPa (1)
During loading the ground pressure acting under the front
and rear crawler tracks (Figure 2) can be distributed uniformly as pressure loads on the respective seven front and rear crawler shoes (Figure 1).
This is achieved by fitting an appropriate curve to the measured ground pressure data using Fourier 8 function in Matlab. The fitted function for shovel front crawler is shown in equation (2).
PF (t) = A0F + A1F + B1F + A2F + B2F + A3F + B3F + A4F + B4F + A5F + B5F + A6F + B6F + A7F + B7F +A8F + B8F (2)
Similarly the fitted function for shovel rear crawler is shown in equation (3). X in equations (4) and (5) is normalized using mean (μ) and standard deviation (σ) using equation (6).
PR (t) = A0R + A1R + B1R + A2R + B2R + A3R + B3R + A4R + B4R + A5R + B5R + A6R + B6R + A7R + B7R + A8R + B8R (3)
× × × × × × × × × ××= = = =0F 0F 1F 1F F 1F 1F F 2F 2F F 2F 2F FA a ; A a c ( ) ( ) ( )os x w ; B = b sin x w ; A a cos 2 x w ; B b sin 2 x w( )
3 3 3 3 4 4 4 4 3 ; 3 ; 4 ;( ) ( ) ( ) 4( )F F F F F F F F F F F FA a cos x w B b sin x w A a cos x w B b sin x w= × × × × × × × × × × × ×= = = (4)
5 5 5 5 6 6 66 5 ; 5 ; 6 ;( ) ( ) ( ) ) 6(F F F F F F F F FF F F
A a cos x w B b sin x w A a cos x w B b sin x w= × × × = × × × = × × × = × × ×
7 7 7 7 8 8 8 8 7 ; 7 ; 8 ;( ) ( ) ( ) ) 8(F F F F F F F F F F FF
A a cos x w B b sin x w A a cos x w B b sin x w= × × ×= × × × = × × × = × × ×
20 0 1 1 1 1 2 2 2( )( ) ( ) ( 2; ; ; 2 ;) R RR R R R R R R R R R R R
B b sin x wA a A a cos x w B b sin x w A a cos x w = × × ×= = × × = × × = × × ×
33 3 3 4 4 4 43 ;3 ; 4 ; 4( )( ) ( ) ( )R RR R RR R R R R R R
B b sin x wA a cos x w A Ba cos x w b sin x w= × × ×= × × ×= × × × = × × × (5)
5 5 5 5 6 66 65 ; 5 ;( ) ( ) ( )6 (; )6R R R R R R R R R RR R
A a cos x w B b sin x w A a cos x w B b sin x w= × × × = × × × = × × × = × × ×
7 87 7 7 8 8 87 ;( ) ( )( 8 (;)7 ; )8R R R RR R R R R R R R
B b sin x w A a cos x wA a cos x w B b sin x w= × × × = × × ×= × × × = × × ×
X = t µ
σ
−
(6)
t in equation (6) is the simulation time in seconds. The mean and standard deviation for shovel crawler front and rear track is shown in Table 3. The coefficients ai, and bi, (where i = 1, 2 …8) and constants wF, wR in equations (4) and (5) are given in Table 4. The fitted curve from equations (2)-(6) is also plotted in Figure 3 and shows good comparison with measured field data.
Table 3: Mean and Standard Deviation.
Quantity Front Crawler Shoes
Rear Crawler Shoes
Mean (μ, s) 69.9 67.55
Standard Deviation (σ, s) 40.33 39.18
Load distribution on crawler shoes
The surface area of each crawler shoe As= 1.3331m2. The pressure load/shoe in KN is calculated using
i. crawler shoe surface area;
ii. pressure values given in equations (1)-(3); and
iii. the ratio of the contact area between each track-terrain and total surface area of 14 crawler shoes.
The simulation time consists of
i. 15 seconds propel (0 < t < 15 s); and
ii. 46.5 s loading duty cycle (18.5 < t < 65 s) as in (Figure 3).
During propelling motion, the load distribution on the front and rear crawler shoes is calculated from static pressure load given in equation (1) minus crawler shoe weight in contact with the ground [5,7] which is Ps,mod ≈ 200kPa. This modified pressure load is distributed as uniform load in Newton on crawler shoes 1-14 as shown in Figure 3. Similarly, during loading (18.5 < t < 65 s), the pressure load acting on front crawler shoes (8-14) is calculated from equation (2) while for rear crawler shoes (1-7), the loads are obtained from equation (3). Only the part of the cycle ground curve between 40 and 90 seconds in (Figure 2) is used for simulation. This is because in the first 25 seconds, the shovel is brought to quasi-static equilibrium (time t = 0, in (Figure 3)) and in the next 15 seconds, which is 0 < t < 15 s in (Figure 3), the shovel propel operation takes place under uniform pressure load. From (Figure 3), the pressure loads at t=15 seconds for front

Citation: Frimpong S, Thiruvengadam M, Gbadam E (2017) Computation and Field Dynamic Stress Simulation of Shovel Crawler Shoes. MOJ Mining Met 1(1): 00003. DOI: 10.15406/mojmm.2017.01.00003
Computation and Field Dynamic Stress Simulation of Shovel Crawler Shoes 14Copyright:
©2017 Frimpong et al.
track (PF (t =15s) = 223.55kPa) and for rear track (PR (t=15s) = 207.24kPa) are not equal to the uniform pressure load Ps,mod≈ 200kPa acting on the crawler track during propel. To avoid discontinuity at t=15 seconds, the pressure load changes as a cubic function for a time period of 0.5 second (14.5 s to 15 s) from Ps,mod to the corresponding values for front and rear tracks as in (Figure 3). At t = 15 seconds, the shovel completes the propel motion and from 15 to 18.5 seconds, it returns with empty dipper at corner position to empty dipper at the face as part of the first duty cycle in (Figure 3). At t = 18.5 seconds, the empty dipper engages the bank to begin the second digging operation. The duration for the second loading cycle from (Figure 3) is 46.5 seconds with return at t = 65 s as in (Figure 3). These loads are applied as point loads at the centroid of each rigid shoe and as uniformly distributed modal loads on flexible shoes in the rigid-flexible virtual prototype model.
Table 4: Co-efficient in Equations (4) and (5).
Front Crawler Shoes Rear Crawler Shoes
a0F 298.7 a0R 157.3
a1F 23.77 a1R -32.15
b1F -102.2 b1R 57.06
a2F -44.05 a2R 33.7
b2F 30.38 b2R -2.507
a3F 50.28 a3R -26.95
b3F 14.84 b3R -24.55
a4F 5.702 a4R -8.241
b4F -5.768 b4R 2.2
a5F -1.506 a5R -0.6793
b5F -5.003 b5R 2.534
a6F -9.745 a6R 2.99
b6F -0.2056 b6R 6.593
a7F 1.681 a7R 1.233
b7F 1.246 b7R -2.434
a8F -0.3779 a8R -0.3651
b8F 0.262 b8R -0.6219
wF 5.422 wR 5.318
Rigid-Flexible Multi-Body Model of Crawler Shoes(Figure 2) shows that the front crawler track is subjected to
maximum pressure load in comparison with rear crawler track. The stress distribution in the crawler shoes due to these maximum pressure loads on the shovel front is captured using rigid-flexible multibody dynamics theory as in (Figure 4). Two crawler shoes (shoes 8 and 13) or Parts 9 and 14 in the front in (Figure 2) are made flexible by importing meshed crawler shoes using modal neutral file (MNF) [13-18]. The completed 3-D virtual prototype model for simulating the rigid-flexible crawler-terrain interaction is shown in Figure 5. The virtual prototype model is simulated using MSC.ADAMS/FLEX/DURABILITY to capture crawler-terrain interaction and dynamic stresses induced in the crawler shoes. More details on developing rigid-flexible multibody dynamic model, MNF file generation, mode shapes, stress shapes, modal loads, modal damping, the differential algebraic equations (DAE) governing the rigid-flexible crawler-terrain interaction and modal superposition equations governing nodal stress recovery on flexible crawler shoes can be found in Frimpong et al. [7]. The GSTIFF solver with SI2 formulation in MSC Adams is used to integrate DAE’s over time with integration error tolerance value E = 0.001 m.
Results and DiscussionsThe total contact forces in the x, y and z directions on different
front crawler shoes (8-14) and on the rear (1-7) are shown in Figure 5. These contact forces are reaction forces due to
i. loading applied on the crawler shoes and
ii. Deformation of the oil sand terrain.
During propel (0 < t <15 s), large fluctuations in contact forces occur along x, y and z-directions as in (Figure 5). The x-contact forces fluctuate between 2.5x10⁵ and -9.5x10⁵ N (Figure 5a). Similarly, y and z-contact forces fluctuate between 6 x 10⁴ and -7.2 x 10⁴ and between 1.4 x 10⁶ and 1.1 x 10³, respectively as in (Figures 5b-5c). During loading, the x-contact force fluctuates between 3.2x10⁵ and -3.2x10⁵ N and y-contact force between 5.2x10⁴ and -6.3x10⁴ N (Figures 5a,5b). Due to the semi-static nature of shovel loading (Figure 3), the fluctuations in z-force are negligible in comparison with x and y forces and varies between 1.5x10⁶ and 6.7x10⁴ N as in (Figure 5c). These contact forces produce the stress loading of the flexible crawler shoes in the front shoes.Figure 3: Load Distributions on Crawler Shoes during Shovel Operation.
Figure 4: 3D Virtual Rigid-Flexible Track-Terrain Interaction Prototype.
Citation: Frimpong S, Thiruvengadam M, Gbadam E (2017) Computation and Field Dynamic Stress Simulation of Shovel Crawler Shoes. MOJ Mining Met 1(1): 00003. DOI: 10.15406/mojmm.2017.01.00003
Computation and Field Dynamic Stress Simulation of Shovel Crawler Shoes 15Copyright:
©2017 Frimpong et al.
Figure 5: Total contact forces acting on front and rear crawler shoes in the x, y and z-directions.
Comparison of computed ground force with the field results
The comparison of ground bearing pressure force (N) between field values and computational results for shovel front and rear tracks is shown in Figure 6a. The computational values are obtained by summing the z-contact forces on the respective crawler shoes in the front (8-14) and in the rear (1-7) shown in Figure 6c. It can be seen that the computational results are similar to the field results with a percentage error of 3.5-13% (Figure 6b) between field and computational values for the front shoes and 6.5-80% for rear shoes. The mean error and the associated standard deviation for the front and rear shoes are 7.7% and 2.0% and 11.8% and 7.7%, respectively. (Figure 6b) shows a large localized error of 80% on the rear shoes during digging. Simultaneously on the front shoes, the minimum error is 3.5%.
This difference in error between the front and rear shoes is due to the magnitude of ground pressure on the shovel front
being 20X larger than the minimum value on the rear shoes during digging. This causes large percentage error for the rear regions as in (Figure 6b). The large error discrepancy could also be due to the fact that the rear crawler shoes in are assumed rigid while two front crawler shoes are made flexible (Figure 4). Since the maximum error is within 13% with mean error of 7.7% on the front track with flexible crawler shoes, the resulting stress loading on the shoes should be accurate within 13%. In addition, the computational estimation of ground z-reaction force is consistently larger than the field values, which should over predict the stresses on the flexible shoes and hence can be considered as an accurate estimation for further shoe fatigue study.
Ground deformation
The resulting ground deformation due to shovel propel and loading is shown in Figure 7. During propel, large fluctuations occur with total deformation varying between -2.98 and 2.7 cm from equilibrium (t = 0) as in (Figure 7). Due to the semi-

Citation: Frimpong S, Thiruvengadam M, Gbadam E (2017) Computation and Field Dynamic Stress Simulation of Shovel Crawler Shoes. MOJ Mining Met 1(1): 00003. DOI: 10.15406/mojmm.2017.01.00003
Computation and Field Dynamic Stress Simulation of Shovel Crawler Shoes 16Copyright:
©2017 Frimpong et al.
static nature of the applied pressure loads (Figure 3), the total deformation during loading varies smoothly with time as in (Figure 7). During loading, the total deformation varies between -11.6 and -0.8 cm. Figure 7 shows that during loading, the oil sands terrain deforms to a maximum in the digging phase and to a minimum at the end of the dumping phase. The stress distribution in the flexible crawler shoes is obtained by combining modal coordinates or scale factors with stress shapes available in the modal neutral file (MNF) using modal superposition method [13,14]. The time variation of modal coordinates for mode shapes
with frequency (f) in the range of 0 to 1200 Hz during propel and loading for flexible crawler shoes 8 and 13 is plotted in (Figure 8). The scale factors for mode shapes with frequencies greater than 1200 Hz are negligible. The scale factors show large fluctuations and vary between 0.071 and -0.162 for shoe 8 (Figure 8a) and 0.136 and -0.059 for shoe 13 (Figure 9b) during both propelling and loading cycle. The results show that mode shape 7 dominates for both flexible shoes with maximum magnitudes of 0.16 and 0.14, respectively.
Figure 6: Comparison of ground bearing pressure between field measurements and MSC Adams.
Dynamic stress contours in the flexible crawler shoes
The von Mises stress distributions of the flexible front crawler shoes 8 and 13 during different stages of propel and loading are shown in Figures 9 & 10. The load on the crawler shoes follows the load distribution in (Figure 3). The red arrows in (Figure 9) indicate contact forces due to interaction between crawler track and oil sands terrain and color contours indicate the von Mises stress in N/m2 or Pa.
Propelling motion: The von Mises stress distribution during propel is shown in Figure 9. (Figure 9a) shows that at equilibrium (t = 0), the crawler shoe 8 is subjected to large stresses compared to crawler shoe 13. At the beginning of propel, the stresses in the flexible shoes 8 and 13 increase steadily in the acceleration (0<t <5 s) and constant velocity regions (5<t <10 s) and decrease again towards the end of the deceleration phase (Figures 9a-9d). The results show that the maximum stress occurs at the joint regions where the shoes are pinned to each other. This is because machine load is uniformly distributed on the shoes and the propel action of the crawler occurs through the joint. The crawler stops at t = 15 seconds (Figure 9d) at which time the loading begins and the track is free to move in all 6-DOF. The stresses in the shoes at the end of propel (Figure 9d) is dissimilar to that in equilibrium (Figure 9a) even though the crawler is at rest on both occasions. This reveals the dynamic nature of the crawler-oil sands interaction.
Loading duty cycle: The von Mises stresses during loading are shown in Figure 10. The von Mises stresses in the crawler shoes during digging (Figures 10a-10c) steadily increase with a maximum occurring at the digging peak at 31.7 seconds (Figure 10b). The figure shows that the stress loading in the crawler shoes during swinging, dumping and return (Figures 10d-10f) are small in compared to that during digging. This is due to the relatively large contact or reaction forces (red arrows) at the interface between the shoes and oil sands during digging compared to other Figure 7: Total deformation of oil sand terrain.

Citation: Frimpong S, Thiruvengadam M, Gbadam E (2017) Computation and Field Dynamic Stress Simulation of Shovel Crawler Shoes. MOJ Mining Met 1(1): 00003. DOI: 10.15406/mojmm.2017.01.00003
Computation and Field Dynamic Stress Simulation of Shovel Crawler Shoes 17Copyright:
©2017 Frimpong et al.
loading cycles. The results also show that the maximum stress does not occur in the leading flexible shoe 13 as expected but in the last flexible front shoe 8. This may be due to identical loading
of shoes 8-14 (Figure 3) and hence maximum stress loading on crawler shoes depends only on the reaction forces (Figure 5) between oil sand and crawler shoes.
Figure 8: Modal coordinates of flexible crawler shoes 8 and 13.
Figure 9: Von-Mises stress contours during propel motion. Figure 10: Von Mises stress contours during loading operation.
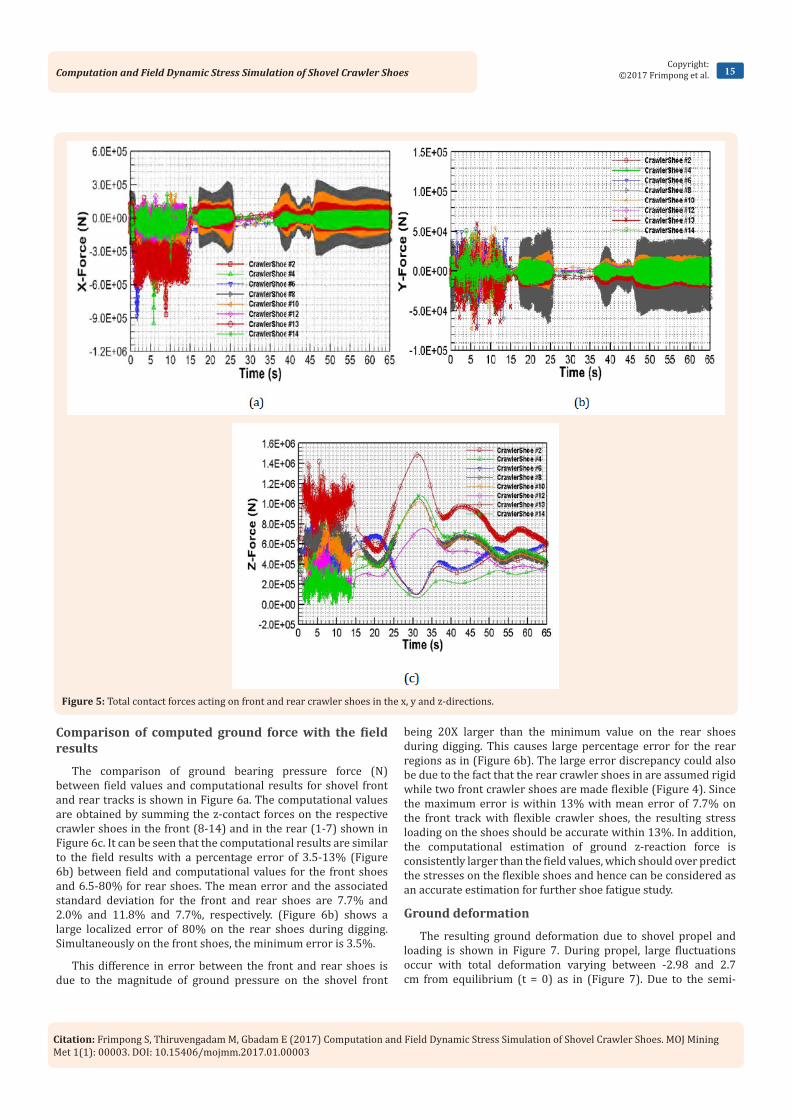
Hot Spots in the flexible crawler shoes
The location of the top 5 hotspots or highest nodal stresses in flexible crawler shoes 8 and 13 during propel and loading is shown in Figure 11a-11d. The corresponding stresses at these locations, the node numbers and the time at which these hot spots occur are shown in Tables 5 & 6. From (Table 6), the largest nodal stress of 79 MPa occurs during propel in the leading crawler shoe 13. On crawler shoe 8, the largest stress value of 78.5 MPa occurs during loading (Table 5). (Tables 5 & 6) also show that the peak stress on shoe 13 during loading is 50% smaller than that on shoe 8. This could be due to the nature of loading. Figure 11 also shows
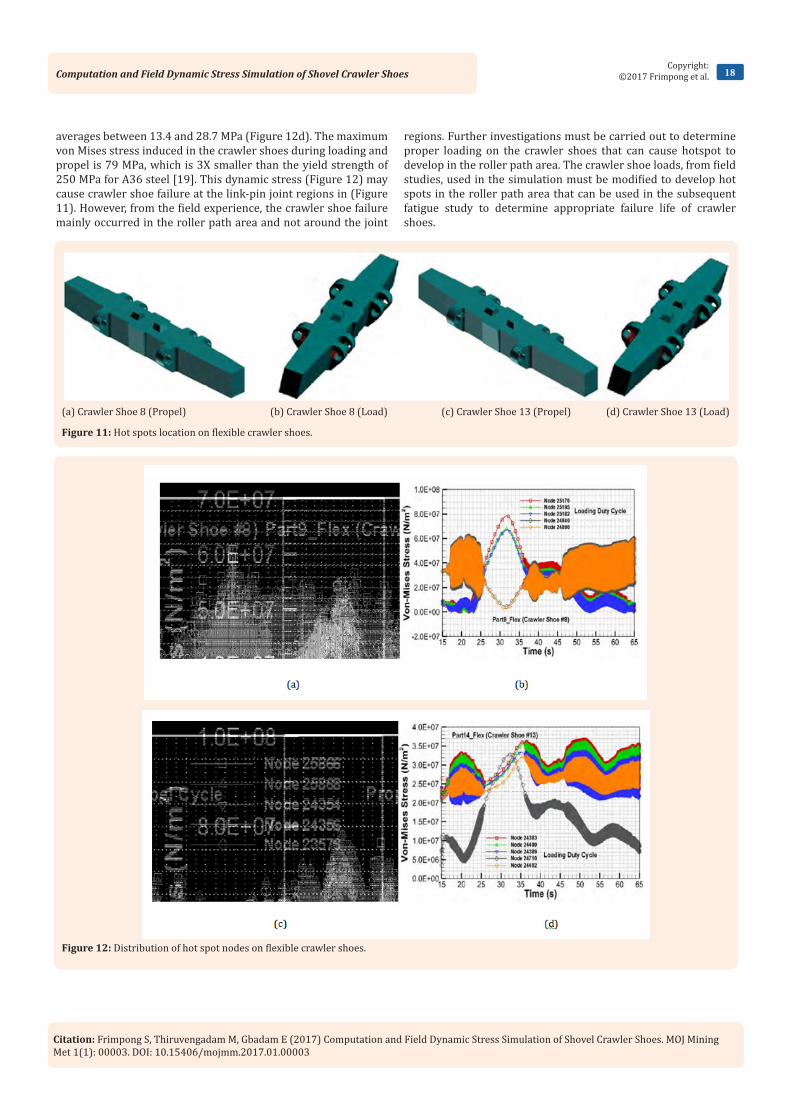
that crawler shoe hot spots are mostly located around the link pin region and not on the main crawler shoe body. (Figure 12) shows the dynamic variation of the von Mises stresses for the hot spots 1-5 in (Tables 5) and 6 for shoes 8 and 13 during propel and loading. The figure shows that during propel, the von Mises stresses for shoe 8 fluctuate between 2.8 and 61.17 MPa with an average ranging between 30.3 and 40.7 MPa (Figure 12a). The von Misses stresses on shoe 13 also fluctuate between 3.25 and 78.97 MPa with an average ranging between 46.1 and 48.0 MPa (Figure 12c). During loading, however, the values for shoe 8 vary between 0.32 and 78.5 MPa with averages between 15 and 33.2 MP (Figure 12b) and, for shoe 13, they vary between 1.67 and 36.7 MPa with
Citation: Frimpong S, Thiruvengadam M, Gbadam E (2017) Computation and Field Dynamic Stress Simulation of Shovel Crawler Shoes. MOJ Mining Met 1(1): 00003. DOI: 10.15406/mojmm.2017.01.00003
Computation and Field Dynamic Stress Simulation of Shovel Crawler Shoes 18Copyright:
©2017 Frimpong et al.
averages between 13.4 and 28.7 MPa (Figure 12d). The maximum von Mises stress induced in the crawler shoes during loading and propel is 79 MPa, which is 3X smaller than the yield strength of 250 MPa for A36 steel [19]. This dynamic stress (Figure 12) may cause crawler shoe failure at the link-pin joint regions in (Figure 11). However, from the field experience, the crawler shoe failure mainly occurred in the roller path area and not around the joint
regions. Further investigations must be carried out to determine proper loading on the crawler shoes that can cause hotspot to develop in the roller path area. The crawler shoe loads, from field studies, used in the simulation must be modified to develop hot spots in the roller path area that can be used in the subsequent fatigue study to determine appropriate failure life of crawler shoes.
(a) Crawler Shoe 8 (Propel) (b) Crawler Shoe 8 (Load) (c) Crawler Shoe 13 (Propel) (d) Crawler Shoe 13 (Load)
Figure 11: Hot spots location on flexible crawler shoes.
Figure 12: Distribution of hot spot nodes on flexible crawler shoes.

Citation: Frimpong S, Thiruvengadam M, Gbadam E (2017) Computation and Field Dynamic Stress Simulation of Shovel Crawler Shoes. MOJ Mining Met 1(1): 00003. DOI: 10.15406/mojmm.2017.01.00003
Computation and Field Dynamic Stress Simulation of Shovel Crawler Shoes 19Copyright:
©2017 Frimpong et al.
Table 5: Hot spots on Crawler shoe 8.
Hot Spot Rank #Stress (MPa Node Id Time (s)
Propel Loading Propel Loading Propel Loading
1 61.166 78.454 24438 25176 11.0818 31.76
2 60.805 67.673 24870 25195 11.0818 31.72
3 58.341 66.747 24424 25182 11.0818 31.75
4 54.928 62.148 26334 24849 1.6 21.66
5 54.371 60.873 24820 24866 1.4327 21.66
Table 6: Hot spots on Crawler shoe 13.
Hot Spots Rank #Stress (MPa) Node Id Time (s)
Propel Loading Propel Loading Propel Loading
1 78.9656 36.7493 25866 24383 1.4754 50.93
2 78.3638 36.0269 25868 24400 1.4724 50.93
3 74.7094 33.6227 24354 24389 1.4724 50.84
4 73.3711 32.6522 24356 24710 1.4724 32.14
5 72.4225 32.3858 23576 24402 1.4724 36.42
ConclusionThe 3-D rigid-flexible virtual prototype model of open crawler
track-oil sands terrain interactions is developed in MSC.ADAMS/FLEX/DURABILITY and MSC.NASTRAN to capture dynamic stresses induced in crawler shoes during propel and loading of the P&H 4100C BOSS electric shovel. The crawler shoe loads during propel and loading operations are based on the field measurement data for P&H 4100C BOSS shovel. The propel duty cycle is simulated for 15 seconds and it consists of acceleration, constant velocity and deceleration regions. The loading duty cycle is simulated immediately after propel for a period of 46.5 seconds.
The cycle consists of digging, swinging, dumping and return operations. The simulation results show large fluctuating contact forces in the x, y and z directions with maximum magnitudes of 9.5 x 10⁵, 7.2 x 10⁴ and 1.4 x 10⁶ N during propel and 3.2 x 10⁵, 6.3 x 10⁴ and 1.5 x 10⁶ N during loading, respectively. The comparison of ground bearing pressures between field and computed values show maximum errors of 13% and 80% for the front and rear crawler shoes. The maximum oil sands deformation of 11.6 cm occurs during digging. The von Mises stresses show that when shovel is propelling, the maximum stress of 79 MPa develops in the front crawler shoe 13 at node 25866 during acceleration phase. During loading, the maximum von Mises stress of 78.5 MPa develops in crawler shoe 8 at node 25176 during digging. The maximum von Mises stress on crawler shoe 8 during loading is twice that for crawler shoe 13.
The maximum stress, 79 MPa, which is 3X smaller than the yield strength of steel material, develops in the link pin joint regions and not in the roller path area. The ground pressure loads used in this study are from the literature. For a more accurate and realistic study, pressure mats with load cells must be buried
under the tracks to record the actual pressures from the shovel tracks in real time. This will cost additional research funds but will yield appropriate results for better characterization. In addition, this study was carried out within oil sands environments, and thus, may not be wholly applicable to other environments. It is therefore recommended that this work be replicated in other harsh environments, such as the iron range formations.
AcknowledgmentNone.
Conflict of InterestNone.
References1. JGI (2012) 4100C BOSS Electric Mining Shovel-AC Drive Product
Overview. © Joy Global Inc., USA, p. 1-8.
2. JGI (2015) Electric Rope Shovels. © Joy Global Inc., USA.
3. P&H (2005) Peak Performance Practices: Lower Works, © P&H Mine Pro, USA.
4. Frimpong S, Thiruvengadam M (2015) Rigid Multi-Body Kinematics of Shovel Crawler-Formation Interactions. Int Journal of Mining, Reclamation and Environment 30(4): 347-369.
5. Frimpong S, Thiruvengadam M (2015) Multi-Body Dynamic Modeling and Simulation of Crawler-Formation Interactions in Surface Mining Operations. Global Journal of Research in Engineering (F) 15(5): 29-49.
6. Frimpong S, Thiruvengadam M (2015) Contact and Joint forces modeling and simulation of crawler-formation interactions. J Powder Metall Min 4(135): 1-14.

Citation: Frimpong S, Thiruvengadam M, Gbadam E (2017) Computation and Field Dynamic Stress Simulation of Shovel Crawler Shoes. MOJ Mining Met 1(1): 00003. DOI: 10.15406/mojmm.2017.01.00003
Computation and Field Dynamic Stress Simulation of Shovel Crawler Shoes 20Copyright:
©2017 Frimpong et al.
7. Frimpong S, Thiruvengadam M (2016) Multibody Dynamic Stress Simulation of Rigid-Flexible Shovel Crawler Shoes. Minerals 6(61): 1-11.
8. Joseph TG (2002) OsEIPOil: The oil sand equipment interactions program. CIM 95(1064): 58-61.
9. Joseph TG, Hansen G (2002) Oil sand reaction to cable shovels motion. 95(1064): 62-64.
10. Sharif Abadi AD, Joseph TG (2010) Oil sand deformation under cyclic loading of ultra-class mobile mining equipment. Journal of Terramechanics 47(2): 75-85.
11. MSC (2014a) MSC ADAMS/View Help Document. © MSC, USA.
12. MSC (2014b) MSC ADAMS/Solver Help Document. © MSC, USA.
13. MSC (2014c) MSC ADAMS/Flex Help Document. © MSC, USA.
14. MSC (2014d) MSC ADAMS/Durability Help Document. © MSC, USA.
15. MSC (2014e) MSC NASTRAN Dynamic Analysis User’s Guide. © MSC, USA.
16. Frimpong S, Li Y (2007) Stress Loading of Cable Shovel Boom under In-situ Digging Conditions. Engineering Failure Analysis 14(4): 702-715.
17. Frimpong S, Li Y, Suglo R (2013) Dynamic Torque and Soil Deformation Mechanics and Simulation of the GAP Machinery. Journal of Powder Metallurgy and Mining 2(1): 1-9.
18. MSC (2016) MSC Software Learning Center. © MSC Corp., USA.
19. Harvey P (1982) Engineering Properties of Steel. American Society for Metals Materials Park, USA.