Embed Size (px)
Citation preview

Pattern Recognition 37 (2004) 2177–2193www.elsevier.com/locate/patcog
Compressing histogram representations for automatic colourphoto categorization
Guoping Qiu∗, Xia Feng1, Jianzhong FangSchool of Computer Science, The University of Nottingham, Jubilee Campus, Nottingham NG8 1BB, UK
Received 12 September 2003; received in revised form 8 March 2004; accepted 8 March 2004
Abstract
Organizing images into semantic categories can be very useful for searching and browsing through large image repositories.In this work, we use machine learning to associate low level colour representations of digital colour photos with their highlevel semantic categories. We investigate the redundancy and performance of a number of histogram-based colour imagecontent representations in the context of automatic colour photo categorization using support vector machines. We use principalcomponent analysis to reduce the dimensionality of (high dimensional) histogram based colour descriptors and use supportvector machines to learn to classify the images into various high level categories in the histograms subspaces. We presentexperimental results to demonstrate the usefulness of such an approach to organizing colour photos into semantic categories.Our results show that the colour content descriptors constructed in di6erent ways perform quite di6erently and the performancesare data dependent hence it is di8cult to pick a “winning” descriptor. Our results demonstrate conclusively that all descriptorsstudied in this paper are highly redundant and that regardless of their performances, the dimensionalities of these histogrambased colour content descriptors can be signi;cantly reduced without a6ecting their classi;cation performances.? 2004 Pattern Recognition Society. Published by Elsevier Ltd. All rights reserved.
Keywords: Color histogram; Content-based indexing and retrieval; PCA; SVM
1. Introduction
Fast advancement in digital imaging technology hasresulted in the exponential increase of image data in bothprofessional archives and personal leisure collections. E6ec-tively managing large image repositories and making themeasily accessible poses signi;cant technical challenges. Inthe past decade, there has been signi;cant research e6ort incontent-based image retrieval (CBIR) [1]. In a CBIR sys-tem, a user can query the image repositories with a visualexample and the system will return an ordered list of imagesthat are similar to the query in some visual sense. Tradi-tionally, image similarity is measured by some forms of
∗ Corresponding author. Tel.: +44-115-8466507;fax: +44-115-951-4254.
E-mail addresses: [email protected] (G. Qiu),[email protected] (X. Feng), [email protected] (J. Fang).
1 On leave from The Civil Aviation University of China andsponsored by the China Scholarship Council.
distance metrics in the feature space. However, similarity is asubjective concept, it is therefore not surprising and perhapsinevitable that there is a “gap” between a similarity measuredby the CBIR systems and a similarity perceived by humanobservers. How to reduce this gap, often referred to as the“semantic gap” in content-based image retrieval has receivedmuch attention in recent years, and technologies that providesolutions to reduce the semantic gap of CBIR are likelyto play a pivotal role in content-based image indexing andretrieval.
One direction pursued by researchers to narrow the se-mantic gap is based on the “learning by example” princi-ple. Machine learning is an integral and essential part ofhuman e6orts to build intelligent machines, and the subjecthas been studied extensively in various disciplines of scien-ti;c and engineering pursues. In the context of CBIR, ma-chine learning has been applied to classify collections of im-ages into categories or classes of various descriptions [2]. Inparticular, image classi;cation techniques based on various
0031-3203/$30.00 ? 2004 Pattern Recognition Society. Published by Elsevier Ltd. All rights reserved.doi:10.1016/j.patcog.2004.03.006
2178 G. Qiu et al. / Pattern Recognition 37 (2004) 2177–2193
machine learning approaches have been shown to be partic-ularly useful in providing relevant feedback in CBIR [1,3–5] to boost the CBIR systems usability and performance.The essential idea behind these approaches is to use ma-chine learning to capture or learn the high level concept ofvisual similarity (as perceived by human observers) fromexamples of similar images chosen by humans. In any ma-chine learning system, an essential issue is the numerical(low-level) representation of the objects to be learned. Dif-ferent representation schemes may a6ect many aspects ofa machine learning system, including computational com-plexity and performance.
Colour is one of the most popular, and arguably themost e6ective low-level cue for content-based image re-trieval. Histogram based colour representations, despitetheir many weaknesses, are the most often used nu-merical representation schemes for the colour contentsof digital images and many forms of histogram-basedcolour representation have been proposed in the lit-erature [1,6–10]. However, histograms are normallyof very high dimension and are therefore compu-tationally expensive for a CBIR system. Recently,it has been shown that colour histograms can be signi;-cantly compressed without a6ecting much the performanceof content-based image retrieval [8]. In this work, we in-vestigate the redundancy and performance of a number ofhistogram-based colour image content representations inthe context of automatic colour photo categorization us-ing machine learning. Five histogram-based colour contentrepresentations are studied. We use principal componentanalysis (PCA) to reduce the dimensionality of these (highdimensional) histogram colour descriptors. Support vectormachine (SVM) is used to learn to categorize images inthe histogram eigenspace. Our results show that a combi-nation of low level colour descriptors and machine learningcan be quite useful in categorizing images into semanticclasses, however, they also show the inadequacy of currenttechnology in bridging the “semantic gap” of content-basedimage retrieval in particular and the di8culty of associatinglow level descriptors with high level concepts in general.It is found that di6erent descriptors have discernible clas-si;cation accuracy. It is also found that the categorizationperformances not only are representation dependent, butalso are data dependent, thus making it di8cult the pick anoverall “winning” colour descriptor. However, it is foundconclusively that in the context of color photo categoriza-tion, histogram-based descriptors are highly redundant andtheir dimensionality can be reduced signi;cantly withouta6ecting the performances. For example, reducing the di-mension of some descriptors by as much as 70% causes nodeterioration in performance, and reducing the dimensionof some descriptors by over 90% only causes about 2%drop in classi;cation performance.
The organization of the paper is as follows. In Section2, we brieOy review related work. Section 3 gives a briefdescription of 5 histogram based colour image content de-
scriptors studied in this paper. Section 4 brieOy summarizesPCA for data compression. Section 5 brieOy describes sup-port vector machine. Section 6 presents our experiment set-ting. Section 7 present experimental results and Section 8concludes the paper.
2. Related work
Organizing images into semantic categories can be ex-tremely useful for searching and browsing through largecollections of images. Recently, various methods have beenproposed for this purpose. Very high dimensional color his-tograms and SVMs have been used to classify color pho-tographs into various categories [2]. SVM has also beenused to perform relevant feedback in content based imageretrieval [3,4]. AdaBoost algorithm [11] has been used fornatural image retrieval [12]. Both AdaBoost learning andSVM were used in Ref. [13] as relevant feedback mecha-nism for natural image retrieval. The author in Ref. [14] haspresented empirical results of boosted image classi;cation.
Projecting image features onto sub spaces for classi;-cation and recognition has been investigated by a numberof authors in various applications. In Ref. [15], subspacemethod has been used for image classi;cation. PCA has beenused to project vectors onto eigenspace for face recognition[16]. In Ref. [8] the authors have successfully applied PCAto compress color histogram for content-based image index-ing. PCA has been used in a feature selection technique toreduce feature dimensionality in an SVM based face detec-tion system [17].
In relevant feedback [28], the user interacts with the sys-tem which has to re-learn a classi;cation model based onthe user’s feedback. It is therefore very important that thesystem can perform real-time learning. One way to achievethis is to use low dimensional feature representations to re-duce the computational complexity. In the literature, this is alargely ignored problem. In Ref. [2], feature vectors of 4096components were used for image classi;cation. Feature vec-tors of 435 components were used in Ref. [13] for relevantfeedback. The authors in Ref. [4] used color and texturefeatures of 144 components. Such high dimensional vectorsnot only make re-learning and re-classi;cation computation-ally expensive, more importantly, they will also make thesystem su6er from the so called “peaking phenomenon” inpattern recognition [18,19]. If the training samples used todesign the classi;er are small relative to the number of fea-tures, the system can be easily overtrained. In order to buildgood classi;ers, the size of the training samples should bean order of magnitude larger than the dimensionality of thefeature vector. That is, if the feature vector is of 435 di-mensional, the training sample size should at least be 4350.In the case of relevant feedback in CBIR, the training sam-ples are picked by the user on line at an interactive rate, andtherefore it is very unlikely a large relevant/irrelevant sam-ples are available for training. Given that the size of training

G. Qiu et al. / Pattern Recognition 37 (2004) 2177–2193 2179
samples is small, the representation features should have lowdimension in order to build good classi;ers. Based on theseconsiderations, it is highly desirable to have representationfeatures of low dimensionality for relevant feedback appli-cation in a CBIR system. This provides the motivation of thecurrent work: we seek to ;nd representation features of lowdimensionality without sacri;cing classi;cation accuracy.
3. Histogram-based color image content descriptors
Many image content descriptors have been proposed inthe content-based image indexing and retrieval literature[1,6–10]. In this paper, we examine ;ve histogram-baseddescriptors. This section gives a brief description of each.
3.1. Opponent color histogram
Color histogram is one of the earliest image content de-scriptors used in content-based image indexing and retrieval[1]. A color histogram can be constructed in a 3d colorspace. However, the dimensionality of such a histogram isoften very high. Researchers have found that it is possibleto construct a 2d chromaticity histogram which will oftengive equal performance to 3d ones [8].
In [8], it was shown that the red–green and blue–yellowopponent chromaticity space decorrelates color informationwell and the 2d color histograms constructed in this space arealso more uniformly distributed hence more compressible.The opponent chromaticities of red–green (rg) and blue–yellow (by) are de;ned in terms of r, g, b chromaticities:
(rg; by) =(r − g; r + g
2− b
): (1)
The opponent color histogram investigated in this paper isconstructed in the rg and by space according to Eq. (1).
3.2. Color correlogram
One of the well-known problems of color histogram isthat it contains no spatial information which has greatly lim-ited its discriminative power. Recently researchers have de-veloped a better and more discriminative technique knownas the color correlogram (CC) [9], which has been shownto provide signi;cant improvement over the original colorhistogram approach. CC is very similar to co-occurrencematrix developed some 20 years ago for grey scale tex-ture classi;cation. Formally, the CC of image {Z(x; y); x=1; 2 : : : M; y = 1; 2; : : : ; N} is de;ned as
CC(i; j; k) = Pr(Z(x1; y1)∈Ci | Z(x2; y2)∈Cj);k = max{|x1 − x2|; |y1 − y2|}; (2)
where the original image Z(x; y) is quantized to a ;xed num-ber of colors C1, C2; : : : ; CL and the distance between thetwo pixels k = 1; 2; : : : ; K is ;xed a priori. In other words,the CC of an image is the probability of joint occurrence
of two pixels some k distance apart that one pixel belongsto color Ci and the other belongs to color Cj . The size ofCC is O(L2K). To reduce storage requirement, [9] concen-trated on auto-correlogram whereby i = j and its size isof O(LK). We also only investigate the auto-correlogramin this paper. We used 64 colors (L = 64) and 4 distances(K = 4 and k = {1; 3; 5; 7}) as suggested in [9] to build theauto-correlogram. The colors, C1, C2; : : : ; C64, were obtainedvia vector quantization (VQ) [20]. The training samples usedto create these colors were all pixels from two hundred andthirty ;ve 512× 512 pixels, 24 bits/pixel true color textureimages from the MIT VisTex 2 collection. These same 64colors were also used for layered color indexing describedin Section 3.5.
3.3. MPEG-7 color structure descriptor
The MPEG-7 color structure (CS) descriptor is a colorfeature descriptor that captures both color content (similarto a color histogram) and information about the structureof this content [10]. Instead of considering each pixel sepa-rately, the extraction method embeds color structure infor-mation into the descriptor by taking into account all colorsin a structuring element of 8× 8 pixels that slides over theimage. This descriptor is more discriminative than color his-togram because it can distinguish between two images inwhich a given color is present in identical amounts but wherethe structure of the groups of pixels having that color is dif-ferent in the two images. MPEG-7 standard speci;es thatcolor values are represented in the double-coned HMMDcolor space, which is quantized non-uniformly. In the stan-dard [21], there are detailed descriptions of how the colorstructure descriptor can be constructed and readers are re-ferred to Ref. [10] and Ref. [21] for full details.
3.4. Colored pattern appearance histogram
The colored pattern appearance model (CPAM) whichhas two channels capturing the characteristics of the chro-matic and achromatic spatial patterns of small image regionshas been used to compile content descriptors for image re-trieval [6]. In this method, the visual appearance of a smallimage block is modeled by three components: the stimulusstrength, the spatial pattern and the color pattern. In Ref.[6], the YCbCr space is used, and the stimulus strength S isapproximated by the local mean of the Y component. Thepixels in Y normalized by S form the achromatic spatialpattern (ASP) vector. Because Cb and Cr have lower band-width, they are sub-sampled. The sub-sampled pixels of Cband Cr are normalized by S, and then concatenated togetherto form the chromatic spatial pattern (CSP) vector. Vectorquantization (VQ) [20] is used to encode the ASP and CSPvectors. Let Qc with a codebook Cc={Cc(j); j∈M} be the
2 http://vismod.www.media.mit.edu/vismod/imagery/Vision-Texture/vistex.htm

2180 G. Qiu et al. / Pattern Recognition 37 (2004) 2177–2193
VQ quantizer for the CSP vectors and QA with a codebookCA = {CA(i); i∈N} be the VQ quantizer for the ASP vec-tors. Typically, the sizes of the codebooks range from 64to 256 work well. The VQ codebooks were also trained us-ing MIT VisTex images [6]. The probabilities that the CSPvectors are coded by the ith codeword of CC and the prob-abilities of the ASP vectors are coded by the jth codewordof CA, for all possible i and j form the colored pattern ap-pearance histogram (CPAH)
CPAH = {{Pr(QA(ASP) = i);∀i};{Pr(QC(CSP) = j); ∀j}}: (3)
Both CPAH and MPEG-7 color structure descriptors aredesigned to take into account the spatial distributions ofcolors. However, MPEG-7 CS only counts the colors withina mask and how the colors are spatially distributed withinthe mask is ignored. CPAH takes this one step further bycapturing the spatial chromatic and achromatic patterns of aneighborhood of pixels, it therefore captures not only color,but also texture characteristics of the images as well [6].
3.5. Layered color indexing
From human perception’s point of view; di6erent fre-quency components of the visual stimulus may be treateddi6erently by the visual system. Physically, di6erent fre-quency components of the signal may correspond to dif-ferent objects or object parts. Consequently, di6erent fre-quency components of the visual stimulus may not only havedi6erent perceptual signi;cance, they may also correspondto di6erent physical objects. Incorporating such concept ishelpful to the development of more e6ective image retrievaltechniques. In Ref. [7] a layered color indexing method wasdeveloped to represent colour contents of images. An imageis ;rst passed through a ;lter bank (each ;lter of the ;l-ter bank covers a speci;ed spectral bandwidth). The outputof the ;lter bank is used to classify the pixels. Pixels in anarea with similar spatial frequencies are then retained on thesame layer. Each individual layer, which contains only thosepixels in areas with similar frequency distributions, is usedto form its own color index. The aggregation of the featureindices from all the layers then forms the overall index ofthe image.
Let Hk be the color histogram of layer Lk , then layeredcolor indexing (LCI) histogram is formed as
H (x) = {Hk}; ∀k: (4)
That is, multiple color histograms for an image, each takingcolors from pixels in areas with similar sharpness are com-piled. This approach not only indexes the color, but also as-sociates color distributions with their surface roughness. Ithas been argued that such an association not only has per-ceptual signi;cance, it also makes sense physically. It hasbeen shown that the LCI method signi;cantly enhances thepower of color indexing and at the same time retains itssimplicity and elegance.
In practice, classi;cation of the pixels into layers can bedone by thresholding the Laplacian image of the Y (achro-matic) channel of the image. We found that dividing thepixels into 4 layers and using 64 colors worked well [7].The 64 colors used for this method are the same as thoseused for the auto-correlogram described in Section 3.2.
4. Data compression using PCA
PCA, also known as Karhunen–Loeve Transform (KLT)[22] is a well-known classical statistical method which hasbeen widely used in data analysis and compression. The ba-sic idea of PCA is to ;nd the n linearly transformed compo-nents {si; i = 1; 2; : : : ; n} so that they explain the maximumamount of variance in the input data. In practice, PCA is doneby calculating the n largest eigenvectors of the (sample) co-variance matrix � = E(xtx), where x is the m-dimensionalsample vectors.
In our current application, the basic goal in PCA is to re-duce the dimension of the data. Thus one usually choosesn�m. Indeed, it can be proven that the representation givenby PCA is an optimal linear dimension reduction techniquein the mean-square sense. Such a reduction in dimension hasimportant bene;ts. First, the computational overhead of thesubsequent processing stages is reduced. Second, noise maybe reduced, as the data not contained in the n ;rst compo-nents may be mostly due to noise. Third, a projection into asubspace of a very low dimension is useful for visualizingthe data.
In the literature, PCA has been successfully applied todimensionality reduction in many ;elds of scienti;c and en-gineering pursuits, e.g., [8,23]. Since the dimensionality oftypical histogram descriptors are quite high which will resultin high computational cost in distance calculation, we usePCA to reduce the dimensionality of histograms describedin the last section before they are presented to the classi;er.Our goal is to investigate the amount of redundancy existingin each of these descriptors so that we can develop computa-tionally e8cient methods using lower dimensional featureswithout sacri;cing classi;cation accuracy performances.
At this point, it is appropriate to mention other widelyused data compression techniques, such as discrete cosinetransform (DCT) and wavelet transform (WT) [24]. UnlikeKLT, the bases of these transforms are data independent. Weargue here that these transforms are in general unsuitablefor our current tasks for the following reasons (as will alsobe demonstrated in the experimental results, Section 7.3).
Firstly, in order to be useful, we want the energy of thesignal to be concentrated in as few transformation coe8-cients as possible so that we can throw away those coe8-cients containing little energy. A compression method suchas DCT or WT may compress the histograms very well interms of the number of bits it used to represent the data,but this does not necessarily help our case if the energy ofthe signal is distributed widely among the transformation
G. Qiu et al. / Pattern Recognition 37 (2004) 2177–2193 2181
coe8cients. Because our goal is not data compression, in-stead our purpose is to achieve dimension reduction. Thesetwo are not always the same.
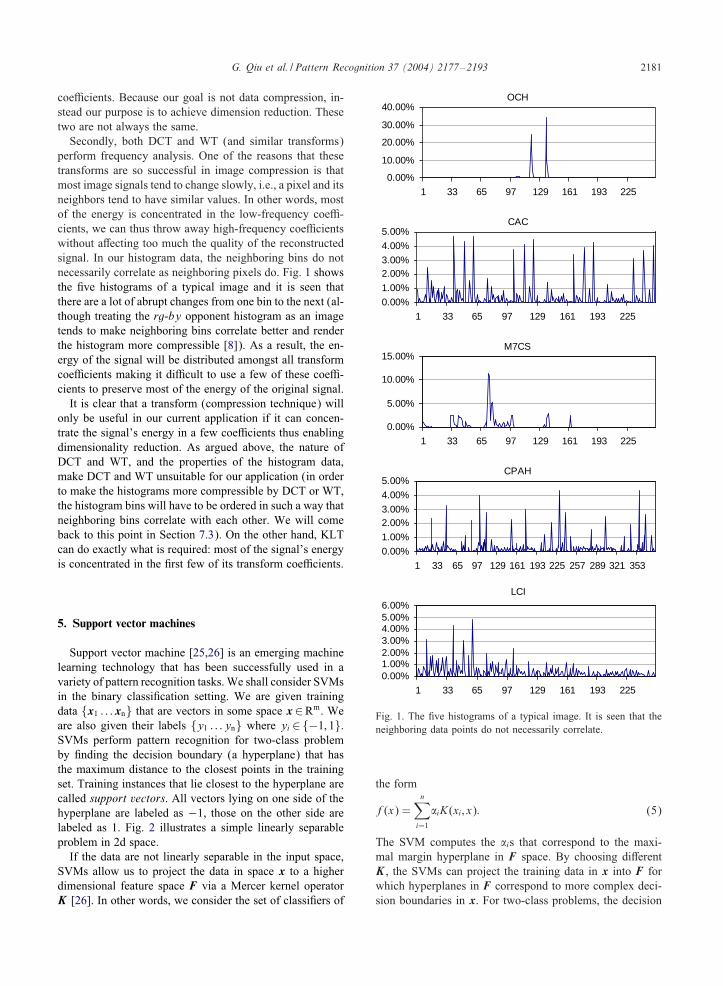
Secondly, both DCT and WT (and similar transforms)perform frequency analysis. One of the reasons that thesetransforms are so successful in image compression is thatmost image signals tend to change slowly, i.e., a pixel and itsneighbors tend to have similar values. In other words, mostof the energy is concentrated in the low-frequency coe8-cients, we can thus throw away high-frequency coe8cientswithout a6ecting too much the quality of the reconstructedsignal. In our histogram data, the neighboring bins do notnecessarily correlate as neighboring pixels do. Fig. 1 showsthe ;ve histograms of a typical image and it is seen thatthere are a lot of abrupt changes from one bin to the next (al-though treating the rg-by opponent histogram as an imagetends to make neighboring bins correlate better and renderthe histogram more compressible [8]). As a result, the en-ergy of the signal will be distributed amongst all transformcoe8cients making it di8cult to use a few of these coe8-cients to preserve most of the energy of the original signal.
It is clear that a transform (compression technique) willonly be useful in our current application if it can concen-trate the signal’s energy in a few coe8cients thus enablingdimensionality reduction. As argued above, the nature ofDCT and WT, and the properties of the histogram data,make DCT and WT unsuitable for our application (in orderto make the histograms more compressible by DCT or WT,the histogram bins will have to be ordered in such a way thatneighboring bins correlate with each other. We will comeback to this point in Section 7.3). On the other hand, KLTcan do exactly what is required: most of the signal’s energyis concentrated in the ;rst few of its transform coe8cients.
5. Support vector machines
Support vector machine [25,26] is an emerging machinelearning technology that has been successfully used in avariety of pattern recognition tasks. We shall consider SVMsin the binary classi;cation setting. We are given trainingdata {x1 : : : xn} that are vectors in some space x∈Rm. Weare also given their labels {y1 : : : yn} where yi ∈{−1; 1}.SVMs perform pattern recognition for two-class problemby ;nding the decision boundary (a hyperplane) that hasthe maximum distance to the closest points in the trainingset. Training instances that lie closest to the hyperplane arecalled support vectors. All vectors lying on one side of thehyperplane are labeled as −1, those on the other side arelabeled as 1. Fig. 2 illustrates a simple linearly separableproblem in 2d space.
If the data are not linearly separable in the input space,SVMs allow us to project the data in space x to a higherdimensional feature space F via a Mercer kernel operatorK [26]. In other words, we consider the set of classi;ers of
OCH
0.00%
10.00%
20.00%
30.00%
40.00%
1 33 65 97 129 161 193 225
CAC
0.00%
1.00%
2.00%3.00%
4.00%
5.00%
1 33 65 97 129 161 193 225
M7CS
0.00%
5.00%
10.00%
15.00%
1 33 65 97 129 161 193 225
CPAH
0.00%
1.00%
2.00%3.00%
4.00%
5.00%
1 33 65 97 129 161 193 225 257 289 321 353
LCI
0.00%1.00%2.00%3.00%4.00%5.00%6.00%
1 33 65 97 129 161 193 225
Fig. 1. The ;ve histograms of a typical image. It is seen that theneighboring data points do not necessarily correlate.
the form
f(x) =n∑i=1
�iK(xi; x): (5)
The SVM computes the �is that correspond to the maxi-mal margin hyperplane in F space. By choosing di6erentK , the SVMs can project the training data in x into F forwhich hyperplanes in F correspond to more complex deci-sion boundaries in x. For two-class problems, the decision

2182 G. Qiu et al. / Pattern Recognition 37 (2004) 2177–2193
1
3
2
f = +1
f = -1
f = 0
ε
ε
ε
Fig. 2. A simple support machine. The optimal hyperplane maxi-mizes the distance to the closest training points. These points (1,2, and 3) are called the support vectors (SVs). The distance � be-tween the hyperplane and the SVs is called the margin.
is made according to: when f(x)¿ 0 we classify x as +1(class 1); otherwise we classify x as −1 (class 2).
SVMs are designed for binary classi;cation [25,26].When dealing with several classes, such as in image clas-si;cation, one needs an appropriate multiclass method. Ourapproach is one per class, also known as one against theothers, which compares a given class with all the othersput together [2]. In the one against the others algorithm,N hyper planes are constructed, where N is the number ofclasses. Each hyperplane separates one class from the otherclasses. In this way, we get N decision functions, fk(x),k=1; : : : ;N . The class label of a new sample x, Lx, is givenby
Lx = arg(max
∀k(fk(x))
); (6)
i.e., the class with the largest decision function.
6. Learning image classi&cation using SVM inhistogram subspaces
We investigate the classi;cation performance and com-pressibility of the various histogram-based image contentdescriptors using a system set up as shown in Fig. 3. Froman input image, we derive its histogram descriptors, whichare then passed to the PCA module to reduce their dimen-sionality. The compressed histogram features are then fedto the SVM classi;ers which then output the identity of theinput image. Let i be the ith eigenvector of the co-variancematrix of the m-dimensional image descriptor x. Let s ={si; i=1; : : : ; m} be the projections of x onto the eigenspace,
InputImage
HistogramDescriptors
PCAFeature Compression
SVMClassifiers
ImageCategories
Fig. 3. Image categorization experiment set up.
and si = x i. It is well known that the vector formed fromthe ;rst few si, s′ = {si; i= 1; : : : ; n}, n¡m, can be used toreconstruct an approximation to x. We can therefore use alower dimensional vector s′ as input to the SVMs for clas-sifying the input images. We investigate how the selectionof n a6ects the classi;cation performances. Obviously, thesmaller the value of n, the higher the compression ratio andthe cheaper it is to compute the categories by the supportvector machine.
7. Experimental results
7.1. Data set A and results
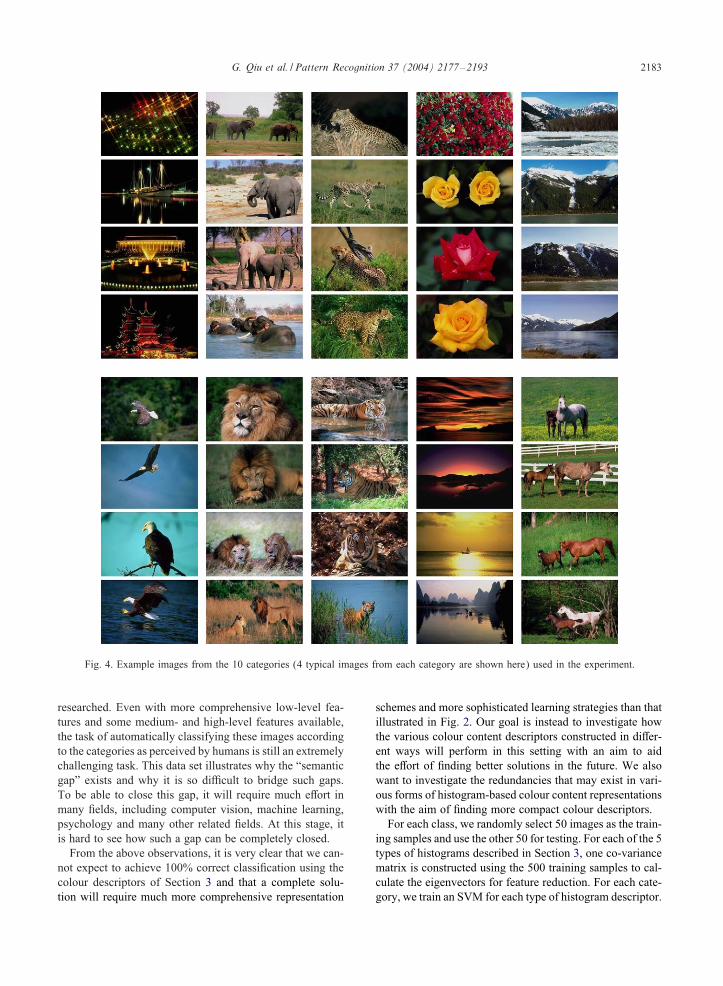
In this ;rst test, we use 10 categories of color photographsfrom the Corel color photo collection. These categories arelabeled by human. The categories are: Lions, Elephants,Tigers, Horses, Sky scenes, Cheetahs, Eagles, Night Scene,Sunset and Roses. Each category consists of 100 color pho-tos. Fig. 4 shows examples of typical images from each ofthese categories.
At this point, it is appropriate to make some observationsabout the data and the adequacy of colour cue alone for itscontent description. The images in each category representa particular theme—a high-level concept. For example, inthe animals categories, such as Lions, Cheetahs and Ele-phants, each image will contain one or more of these ani-mals. However, the animals may only occupy a small sec-tion of the image and the background may occupy mostof the image area. The backgrounds of images within thesame category may vary signi;cantly, and to make the taskmore di8cult the backgrounds of an image in one categorymay be very similar to those of images in another cate-gory. Images in the same theme category may have di6erentcolours as well. For example, in the Roses category, someRoses are yellow and some are red. A number of di6erentcategories, such as Eagles, Sky Scenes, Elephants, Tigers,Cheetahs all have images containing large part of blue skyscenes. Clearly, colour alone will be inadequate to distin-guish among these categories. To be able to represent theimages better, other low-level features, such as texture de-scriptor, and medium/high level object shape descriptor willbe necessary. However, medium and high level descriptorsare di8cult to obtain and the topic is still being actively
G. Qiu et al. / Pattern Recognition 37 (2004) 2177–2193 2183
Fig. 4. Example images from the 10 categories (4 typical images from each category are shown here) used in the experiment.
researched. Even with more comprehensive low-level fea-tures and some medium- and high-level features available,the task of automatically classifying these images accordingto the categories as perceived by humans is still an extremelychallenging task. This data set illustrates why the “semanticgap” exists and why it is so di8cult to bridge such gaps.To be able to close this gap, it will require much e6ort inmany ;elds, including computer vision, machine learning,psychology and many other related ;elds. At this stage, itis hard to see how such a gap can be completely closed.
From the above observations, it is very clear that we can-not expect to achieve 100% correct classi;cation using thecolour descriptors of Section 3 and that a complete solu-tion will require much more comprehensive representation
schemes and more sophisticated learning strategies than thatillustrated in Fig. 2. Our goal is instead to investigate howthe various colour content descriptors constructed in di6er-ent ways will perform in this setting with an aim to aidthe e6ort of ;nding better solutions in the future. We alsowant to investigate the redundancies that may exist in vari-ous forms of histogram-based colour content representationswith the aim of ;nding more compact colour descriptors.
For each class, we randomly select 50 images as the train-ing samples and use the other 50 for testing. For each of the 5types of histograms described in Section 3, one co-variancematrix is constructed using the 500 training samples to cal-culate the eigenvectors for feature reduction. For each cate-gory, we train an SVM for each type of histogram descriptor.
2184 G. Qiu et al. / Pattern Recognition 37 (2004) 2177–2193
Table 1Correct classi;cation performances for di6erent descriptors trained using di6erent penalty factors (results are for training data only)
C OCH (%) CAC (%) M7CS (%) CPAH (%) LCI (%)
1 68 65 80 70 761.4 68 66 80 72 771.8 69 66 81 73 792.2 70 66 81 73 78
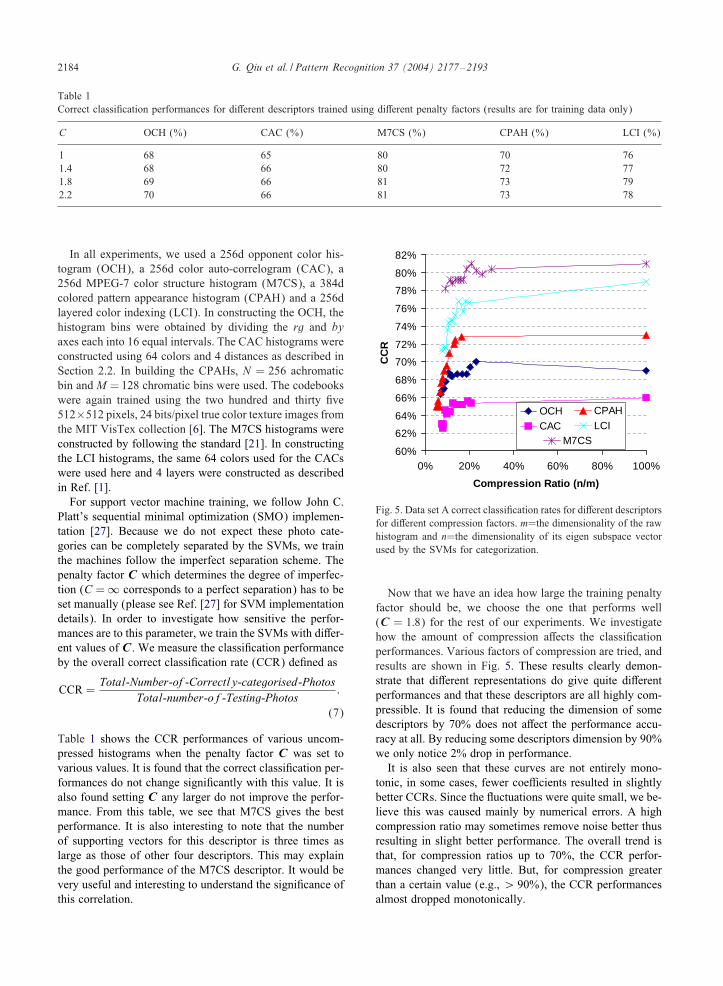
In all experiments, we used a 256d opponent color his-togram (OCH), a 256d color auto-correlogram (CAC), a256d MPEG-7 color structure histogram (M7CS), a 384dcolored pattern appearance histogram (CPAH) and a 256dlayered color indexing (LCI). In constructing the OCH, thehistogram bins were obtained by dividing the rg and byaxes each into 16 equal intervals. The CAC histograms wereconstructed using 64 colors and 4 distances as described inSection 2.2. In building the CPAHs, N = 256 achromaticbin and M = 128 chromatic bins were used. The codebookswere again trained using the two hundred and thirty ;ve512×512 pixels, 24 bits/pixel true color texture images fromthe MIT VisTex collection [6]. The M7CS histograms wereconstructed by following the standard [21]. In constructingthe LCI histograms, the same 64 colors used for the CACswere used here and 4 layers were constructed as describedin Ref. [1].
For support vector machine training, we follow John C.Platt’s sequential minimal optimization (SMO) implemen-tation [27]. Because we do not expect these photo cate-gories can be completely separated by the SVMs, we trainthe machines follow the imperfect separation scheme. Thepenalty factor C which determines the degree of imperfec-tion (C =∞ corresponds to a perfect separation) has to beset manually (please see Ref. [27] for SVM implementationdetails). In order to investigate how sensitive the perfor-mances are to this parameter, we train the SVMs with di6er-ent values of C . We measure the classi;cation performanceby the overall correct classi;cation rate (CCR) de;ned as
CCR =Total-Number-of-Correctly-categorised-Photos
Total-number-of-Testing-Photos:
(7)
Table 1 shows the CCR performances of various uncom-pressed histograms when the penalty factor C was set tovarious values. It is found that the correct classi;cation per-formances do not change signi;cantly with this value. It isalso found setting C any larger do not improve the perfor-mance. From this table, we see that M7CS gives the bestperformance. It is also interesting to note that the numberof supporting vectors for this descriptor is three times aslarge as those of other four descriptors. This may explainthe good performance of the M7CS descriptor. It would bevery useful and interesting to understand the signi;cance ofthis correlation.
60%
62%
64%
66%
68%
70%
72%
74%
76%
78%
80%
82%
0% 20% 40% 60% 80% 100%
Compression Ratio (n/m)
CC
R
OCHCAC
CPAHLCI
M7CS
Fig. 5. Data set A correct classi;cation rates for di6erent descriptorsfor di6erent compression factors. m=the dimensionality of the rawhistogram and n=the dimensionality of its eigen subspace vectorused by the SVMs for categorization.
Now that we have an idea how large the training penaltyfactor should be, we choose the one that performs well(C = 1:8) for the rest of our experiments. We investigatehow the amount of compression a6ects the classi;cationperformances. Various factors of compression are tried, andresults are shown in Fig. 5. These results clearly demon-strate that di6erent representations do give quite di6erentperformances and that these descriptors are all highly com-pressible. It is found that reducing the dimension of somedescriptors by 70% does not a6ect the performance accu-racy at all. By reducing some descriptors dimension by 90%we only notice 2% drop in performance.
It is also seen that these curves are not entirely mono-tonic, in some cases, fewer coe8cients resulted in slightlybetter CCRs. Since the Ouctuations were quite small, we be-lieve this was caused mainly by numerical errors. A highcompression ratio may sometimes remove noise better thusresulting in slight better performance. The overall trend isthat, for compression ratios up to 70%, the CCR perfor-mances changed very little. But, for compression greaterthan a certain value (e.g., ¿ 90%), the CCR performancesalmost dropped monotonically.

G. Qiu et al. / Pattern Recognition 37 (2004) 2177–2193 2185
Table 2Summary of correct classi;cation performances of di6erent categories using di6erent histograms before compression and after compression
Histograms
OCH CAC M7CS CPAH LCI
Categories n=m = 1 n=m = 0:2 n=m = 1 n=m = 0:2 n=m = 1 n=m = 0:2 n=m = 1 n=m = 0:2 n=m = 1 n=m = 0:2
Lions 33 33 33 36 35 36 40 40 37 37Elephants 33 33 31 32 34 34 21 20 40 39Tigers 19 19 18 14 40 41 20 19 31 29Horses 46 46 47 47 48 47 48 47 44 44Sky 44 44 46 46 46 46 48 48 48 49Cheetahs 26 24 11 11 29 29 23 23 21 18Eagles 30 30 33 33 39 36 33 33 40 40Night 44 41 38 38 39 39 41 41 41 42Sunset 29 30 36 34 43 41 42 41 38 35Roses 38 39 36 35 46 46 45 45 46 45
The ;gures are the number of correctly classi;ed images in each category (results are for testing data only).
In Appendix, we tabulate the confusion matrices for thesedescriptors both before compression and after compression.It is seen that regardless of the performances of di6erent de-scriptors, confusion matrices for the same descriptor changevery little before and after dimension reduction, again indi-cating the highly compressible nature of these raw descrip-tors.
Table 2 summarizes the correct classi;cation performanceof di6erent categories when di6erent colour descriptors areused. It is seen that for most categories, the methods actu-ally perform quite well with very high percentage of the im-ages being classi;ed into the correct categories. There aretwo categories, Tigers and Cheetahs, that are di8cult to cat-egorize. In the case of Tigers, M7CS descriptor works quitewell, but all other descriptors perform very poorly. For theCheetahs category, all representations do not perform well.From these results, it is fair to say that the success of sucha scheme for the categorization of colour photos is mixed,in the sense that for some categories, the performances arequite good, whilst for other categories, the performances arepoor. Overall, we feel that such a scheme could be useful inautomatic color photo categorization.
Fig. 6 shows some typical misclassi;ed images. In fact,all these misclassi;ed images are explainable. For example,one Elephant image contains a large portion of sky, there-fore classifying it into sky category cannot be regarded astotally wrong. All these examples demonstrate once morethe di8culty of automatically associating low-level repre-sentations with high-level concepts. This di8culty typi;esthe huge challenges for all the ;elds related to machine in-telligence—computer vision, image understanding, patternrecognition, machine learning, etc
7.2. Data set B and results
We have seen that for data set A, the images within acategory can be di6erent and images from di6erent cate-
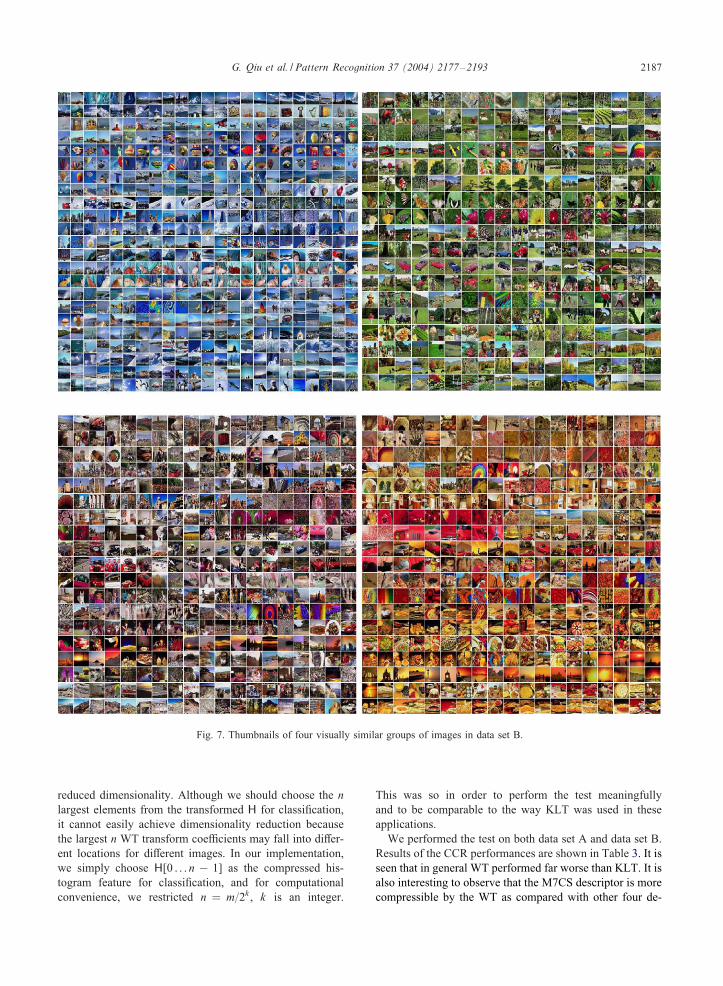
gories can be similar. In this second test data set, we useddata classi;ed as similar and di6erent by human observersto test the method. We manually classi;ed the ;rst 6400images from the Corel collection into four groups, eachcontained visually similar images, those images cannot beput into any of these groups were thrown away. The sizesof these four groups were 399, 354, 541 and 392 images,respectively. The thumbnails of these four groups of imagesare shown in Fig. 7 (not all images are displayed). It is seenthat the visual contents of images within the same groupare quite homogeneous and images in di6erent groups arequite di6erent.
We constructed ;ve histogram descriptors for this dataset in exactly the same way as for data set A. We thenrandomly picked 150 images from each group to developthe classi;ers and the KLT bases and used the rest imagesfor testing. The experimental procedure was the same as inSection 7.1 for data set A.
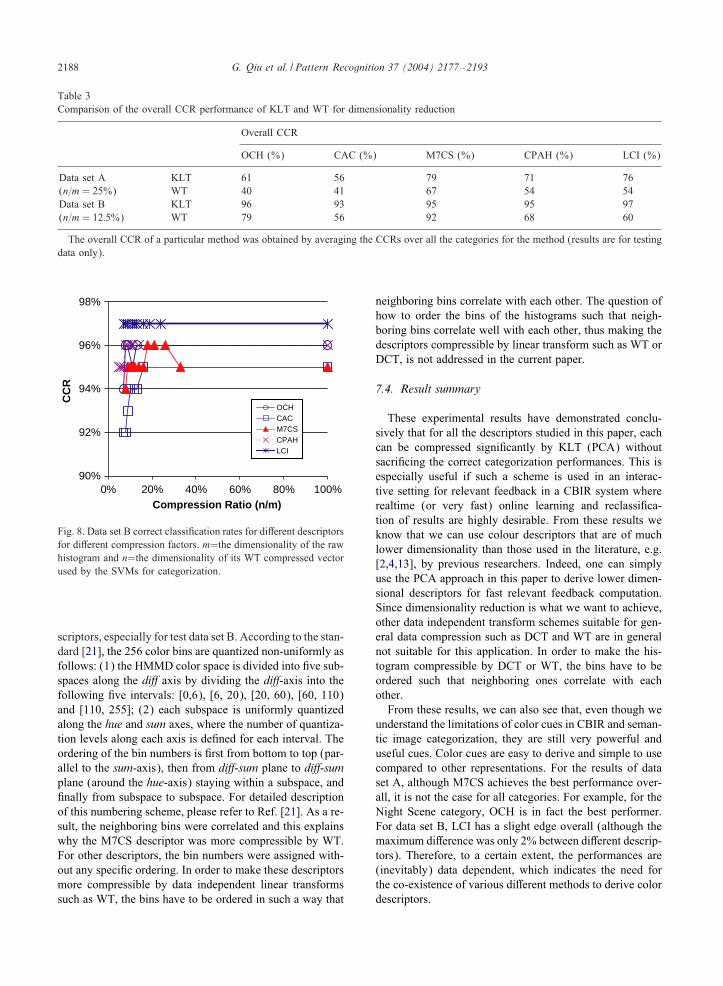
Fig. 8 shows how compression a6ects the performances.Without any compression, all descriptors performed verywell. As can be seen from Fig. 7, images were judged sim-ilar mainly because of their color themes are very similar.Given that all descriptors extract color information in oneway or another, these good performance results are not en-tirely surprising. We also see that LCI gave the best result;OCH and CPAH performed similarly, and M7CS and CACdid similarly well. What is also striking for this data set isthat the amount of compression can be achieved without af-fecting the CCR performances. It is seen that compressingLCI to only 7% of its original dimension did not a6ect itsperformance at all (although not shown in Fig. 8, we noticedthat CCR started to drop gradually for compression ratiosn=m¡ 7% for the LCI method). We again see the occasionalminor Ouctuation of the CCR/compression ratio curve, webelieve this was again caused by numerical errors and canbe explained similarly as the case in Fig. 5. These resultssuggested that if we want to classify images into groups of

2186 G. Qiu et al. / Pattern Recognition 37 (2004) 2177–2193
Fig. 6. Examples of typical mis-classi;ed photos.
similar colour themes, then the descriptors could be com-pressed even harder.
7.3. Other compression schemes
We have implemented a WT method for reducing the di-mensionality of our histogram features. We used the Haarwavelet [24] and our implementation was based on the fol-lowing pseudocode:
proc WT(H: array[0..m- 1])H← H/
√m
while m¿ n do:m← m=2for i = 0 to m− 1 doH′[i]← (H[2i] + H[2i + 1])=
√2
H′[m+i]← (H[2i]− H[2i + 1])=√
2end forH← H′
end whileend proc
where H holds the histogram features before and after thetransform, m is the original dimensionality of H and n is the
G. Qiu et al. / Pattern Recognition 37 (2004) 2177–2193 2187
Fig. 7. Thumbnails of four visually similar groups of images in data set B.
reduced dimensionality. Although we should choose the nlargest elements from the transformed H for classi;cation,it cannot easily achieve dimensionality reduction becausethe largest n WT transform coe8cients may fall into di6er-ent locations for di6erent images. In our implementation,we simply choose H[0 : : : n − 1] as the compressed his-togram feature for classi;cation, and for computationalconvenience, we restricted n = m=2k , k is an integer.
This was so in order to perform the test meaningfullyand to be comparable to the way KLT was used in theseapplications.
We performed the test on both data set A and data set B.Results of the CCR performances are shown in Table 3. It isseen that in general WT performed far worse than KLT. It isalso interesting to observe that the M7CS descriptor is morecompressible by the WT as compared with other four de-
2188 G. Qiu et al. / Pattern Recognition 37 (2004) 2177–2193
Table 3Comparison of the overall CCR performance of KLT and WT for dimensionality reduction
Overall CCR
OCH (%) CAC (%) M7CS (%) CPAH (%) LCI (%)
Data set A KLT 61 56 79 71 76(n=m = 25%) WT 40 41 67 54 54Data set B KLT 96 93 95 95 97(n=m = 12:5%) WT 79 56 92 68 60
The overall CCR of a particular method was obtained by averaging the CCRs over all the categories for the method (results are for testingdata only).
90%
92%
94%
96%
98%
0% 20% 40% 60% 80% 100%Compression Ratio (n/m)
CC
R
OCHCACM7CSCPAHLCI
Fig. 8. Data set B correct classi;cation rates for di6erent descriptorsfor di6erent compression factors. m=the dimensionality of the rawhistogram and n=the dimensionality of its WT compressed vectorused by the SVMs for categorization.
scriptors, especially for test data set B. According to the stan-dard [21], the 256 color bins are quantized non-uniformly asfollows: (1) the HMMD color space is divided into ;ve sub-spaces along the di: axis by dividing the di:-axis into thefollowing ;ve intervals: [0,6), [6, 20), [20, 60), [60, 110)and [110, 255]; (2) each subspace is uniformly quantizedalong the hue and sum axes, where the number of quantiza-tion levels along each axis is de;ned for each interval. Theordering of the bin numbers is ;rst from bottom to top (par-allel to the sum-axis), then from di:-sum plane to di:-sumplane (around the hue-axis) staying within a subspace, and;nally from subspace to subspace. For detailed descriptionof this numbering scheme, please refer to Ref. [21]. As a re-sult, the neighboring bins were correlated and this explainswhy the M7CS descriptor was more compressible by WT.For other descriptors, the bin numbers were assigned with-out any speci;c ordering. In order to make these descriptorsmore compressible by data independent linear transformssuch as WT, the bins have to be ordered in such a way that
neighboring bins correlate with each other. The question ofhow to order the bins of the histograms such that neigh-boring bins correlate well with each other, thus making thedescriptors compressible by linear transform such as WT orDCT, is not addressed in the current paper.
7.4. Result summary
These experimental results have demonstrated conclu-sively that for all the descriptors studied in this paper, eachcan be compressed signi;cantly by KLT (PCA) withoutsacri;cing the correct categorization performances. This isespecially useful if such a scheme is used in an interac-tive setting for relevant feedback in a CBIR system whererealtime (or very fast) online learning and reclassi;ca-tion of results are highly desirable. From these results weknow that we can use colour descriptors that are of muchlower dimensionality than those used in the literature, e.g.[2,4,13], by previous researchers. Indeed, one can simplyuse the PCA approach in this paper to derive lower dimen-sional descriptors for fast relevant feedback computation.Since dimensionality reduction is what we want to achieve,other data independent transform schemes suitable for gen-eral data compression such as DCT and WT are in generalnot suitable for this application. In order to make the his-togram compressible by DCT or WT, the bins have to beordered such that neighboring ones correlate with eachother.
From these results, we can also see that, even though weunderstand the limitations of color cues in CBIR and seman-tic image categorization, they are still very powerful anduseful cues. Color cues are easy to derive and simple to usecompared to other representations. For the results of dataset A, although M7CS achieves the best performance over-all, it is not the case for all categories. For example, for theNight Scene category, OCH is in fact the best performer.For data set B, LCI has a slight edge overall (although themaximum di6erence was only 2% between di6erent descrip-tors). Therefore, to a certain extent, the performances are(inevitably) data dependent, which indicates the need forthe co-existence of various di6erent methods to derive colordescriptors.

G. Qiu et al. / Pattern Recognition 37 (2004) 2177–2193 2189
8. Concluding remarks
In this paper, we have investigated ;ve histogram-basedimage descriptors for automatic digital color photo catego-rization using support vector machines. We have shown thatdi6erent descriptors have di6erent performances. The per-formances of di6erent representations are also data depen-dent, thus it is not easy to pick an overall winning repre-sentation which indicates the need for the co-existence ofvarious di6erent colour descriptors. Despite the many lim-itations of colour cues, our results demonstrate once againthat colour can be a very powerful cue for image classi-;cation. A combination of colour descriptors and machinelearning can be used to build useful systems for color photocategorization. It is also found that all these histograms arehighly redundant and can be signi;cantly compressed with-out a6ecting the classi;cation performance. Histograms area descriptor used extensively in image content management
Table 4Confusion matrix for the OCH descriptor without compression
Output categories
OCH Lions Elephants Tigers Horses Sky Cheetahs Eagles Night Sunset Roses
Input Lions 33 8 0 1 3 2 2 1 0 0categories Elephants 3 33 1 2 4 6 0 0 0 1
Tigers 9 2 19 6 6 3 1 3 1 0Horses 0 0 0 46 0 0 1 0 0 3Sky 0 1 0 0 44 0 5 0 0 0Cheetahs 6 6 3 2 4 26 2 1 0 0Eagles 1 1 3 4 10 1 30 0 0 0Night 0 0 0 0 0 0 0 44 4 2Sunset 12 2 1 0 1 0 0 1 29 4Roses 0 1 0 4 0 1 0 2 4 38
Table 5Confusion matrix for the OCH descriptor, compression ratio (n=m) = 20%
Output categories
OCH Lions Elephants Tigers Horses Sky Cheetahs Eagles Night Sunset Roses
Input Lions 33 8 0 1 3 2 2 1 0 0categories Elephants 3 33 0 2 4 7 0 0 0 1
Tigers 9 2 19 6 6 3 1 3 1 0Horses 0 0 0 46 0 0 1 0 0 3Sky 0 1 0 0 44 0 5 0 0 0Cheetahs 6 6 3 3 4 24 2 1 1 0Eagles 1 1 2 4 10 1 30 0 0 1Night 0 0 0 0 0 0 0 41 3 6Sunset 13 2 1 0 1 0 0 1 30 2Roses 0 1 0 4 0 1 0 1 4 39
and they normally have very high dimensionality. Fromthe results of this study, we conjecture that there may ex-ist lower dimensionality alternatives to the existing highdimensional histogram-based image content descriptors, itmay well worth pursuing these lower complexity alterna-tives. One possibility is to use the technique used in thispaper, i.e., PCA, to reduce the histograms’ dimensionality.Other possible methods, for example, re-ordering the his-togram bins to make neighboring ones correlate well witheach other, thus making the histograms compressible by dataindependent linear transforms such as DCT and WT, maywell warrant further investigation.
Appendix
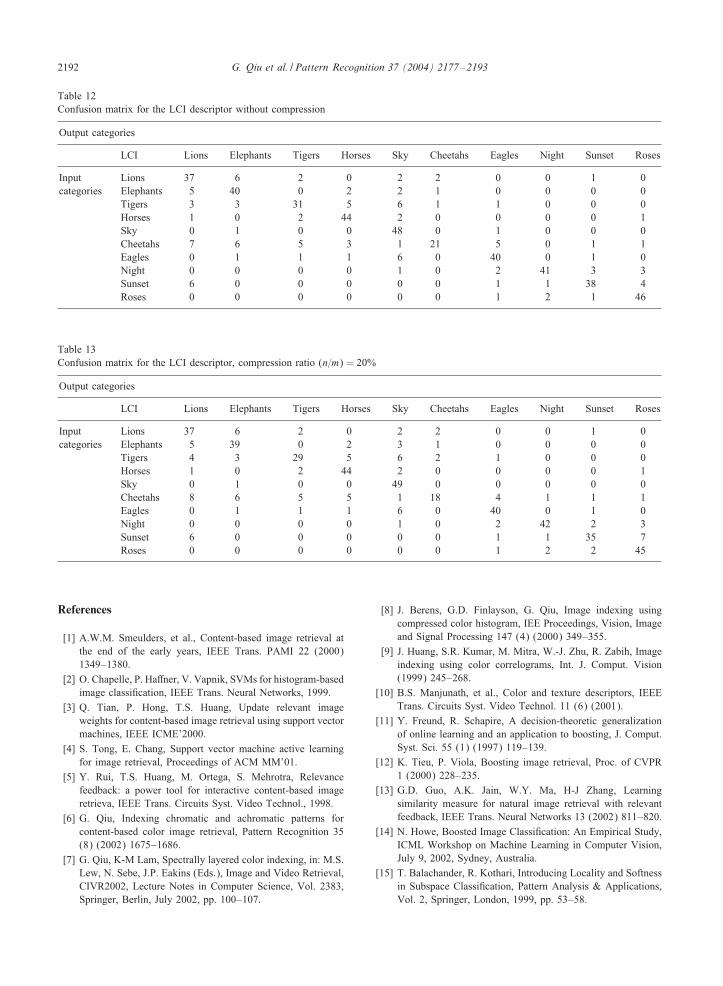
Tables 4–13, confusion matrices of test data set A, beforeand after compression. All results are for testing data only.

2190 G. Qiu et al. / Pattern Recognition 37 (2004) 2177–2193
Table 6Confusion matrix for the CAC descriptor without compression
Output categories
CAC Lions Elephants Tigers Horses Sky Cheetahs Eagles Night Sunset Roses
Input Lions 33 5 3 1 4 0 2 0 2 0categories Elephants 10 31 0 2 6 1 0 0 0 0
Tigers 7 3 18 6 4 3 3 3 0 3Horses 1 0 0 47 1 0 0 0 0 1Sky 0 3 0 0 46 0 1 0 0 0Cheetahs 11 3 3 11 3 11 3 1 3 1Eagles 0 1 1 3 9 0 33 0 1 2Night 0 0 0 0 2 0 4 38 3 3Sunset 6 0 0 0 1 0 1 1 36 5Roses 0 0 0 2 2 0 1 8 1 36
Table 7Confusion matrix for the CAC descriptor, compression ratio (n=m) = 20%
Output categories
CAC Lions Elephants Tigers Horses Sky Cheetahs Eagles Night Sunset Roses
Input Lions 36 4 2 1 4 0 2 0 1 0categories Elephants 8 32 0 3 6 0 0 0 1 0
Tigers 9 3 14 6 5 6 1 2 0 4Horses 1 0 0 47 1 0 0 0 0 1Sky 0 3 0 0 46 0 1 0 0 0Cheetahs 12 4 0 13 2 11 4 1 2 1Eagles 0 0 1 4 9 0 33 0 1 2Night 0 0 0 0 2 0 4 38 3 3Sunset 7 0 0 0 1 0 1 1 34 6Roses 0 0 0 2 2 0 1 8 2 35
Table 8Confusion matrix for the M7CS descriptor without compression
Output categories
M7CS Lions Elephants Tigers Horses Sky Cheetahs Eagles Night Sunset Roses
Input Lions 35 7 3 0 1 2 0 0 2 0categories Elephants 7 34 4 2 2 1 0 0 0 0
Tigers 0 1 40 1 5 0 3 0 0 0Horses 0 0 2 48 0 0 0 0 0 0Sky 0 1 1 0 46 0 2 0 0 0Cheetahs 3 9 2 1 2 29 2 0 1 1Eagles 0 1 1 1 6 1 39 0 0 1Night 0 0 0 0 1 1 1 39 6 2Sunset 2 0 1 0 0 0 1 0 43 3Roses 0 0 0 0 0 0 3 0 1 46

G. Qiu et al. / Pattern Recognition 37 (2004) 2177–2193 2191
Table 9Confusion matrix for the M7CS descriptor, compression ratio (n=m) = 20%
Output categories
M7CS Lions Elephants Tigers Horses Sky Cheetahs Eagles Night Sunset Roses
Input Lions 36 6 3 0 1 2 0 0 2 0categories Elephants 6 34 4 2 2 1 0 0 1 0
Tigers 0 1 41 1 3 0 4 0 0 0Horses 0 0 3 47 0 0 0 0 0 0Sky 0 1 1 0 46 0 2 0 0 0Cheetahs 3 9 2 1 2 29 2 0 1 1Eagles 0 1 3 1 7 1 36 0 0 1Night 0 0 0 0 1 1 1 39 7 1Sunset 4 0 0 0 0 0 0 0 41 5Roses 0 0 0 0 0 0 3 0 1 46
Table 10Confusion matrix for the CPAH descriptor without compression
Output categories
CPAH Lions Elephants Tigers Horses Sky Cheetahs Eagles Night Sunset Roses
Input Lions 40 2 0 2 4 1 1 0 0 0categories Elephants 5 21 0 2 10 6 1 0 0 5
Tigers 5 0 20 10 2 5 5 3 0 0Horses 0 0 0 48 0 0 0 0 1 1Sky 0 0 0 0 48 0 2 0 0 0Cheetahs 10 1 2 5 6 23 2 0 1 0Eagles 1 0 2 4 8 0 33 0 0 2Night 0 0 0 1 1 0 1 41 4 2Sunset 2 0 0 0 3 0 0 2 42 1Roses 0 0 0 2 0 0 0 0 3 45
Table 11Confusion matrix for the CPAH descriptor, compression ratio (n=m) = 20%
Output categories
CPAH Lions Elephants Tigers Horses Sky Cheetahs Eagles Night Sunset Roses
Input Lions 40 2 0 2 5 1 0 0 0 0categories Elephants 6 20 0 2 10 6 1 0 0 5
Tigers 6 1 19 9 2 5 5 3 0 0Horses 0 0 0 47 0 0 1 0 1 1Sky 0 0 0 0 48 0 2 0 0 0Cheetahs 10 1 2 5 6 23 2 0 1 0Eagles 1 0 2 4 8 0 33 0 0 2Night 0 0 0 1 1 0 1 41 4 2Sunset 2 0 0 0 4 0 0 3 41 0Roses 0 0 0 2 0 0 0 1 2 45
2192 G. Qiu et al. / Pattern Recognition 37 (2004) 2177–2193
Table 12Confusion matrix for the LCI descriptor without compression
Output categories
LCI Lions Elephants Tigers Horses Sky Cheetahs Eagles Night Sunset Roses
Input Lions 37 6 2 0 2 2 0 0 1 0categories Elephants 5 40 0 2 2 1 0 0 0 0
Tigers 3 3 31 5 6 1 1 0 0 0Horses 1 0 2 44 2 0 0 0 0 1Sky 0 1 0 0 48 0 1 0 0 0Cheetahs 7 6 5 3 1 21 5 0 1 1Eagles 0 1 1 1 6 0 40 0 1 0Night 0 0 0 0 1 0 2 41 3 3Sunset 6 0 0 0 0 0 1 1 38 4Roses 0 0 0 0 0 0 1 2 1 46
Table 13Confusion matrix for the LCI descriptor, compression ratio (n=m) = 20%
Output categories
LCI Lions Elephants Tigers Horses Sky Cheetahs Eagles Night Sunset Roses
Input Lions 37 6 2 0 2 2 0 0 1 0categories Elephants 5 39 0 2 3 1 0 0 0 0
Tigers 4 3 29 5 6 2 1 0 0 0Horses 1 0 2 44 2 0 0 0 0 1Sky 0 1 0 0 49 0 0 0 0 0Cheetahs 8 6 5 5 1 18 4 1 1 1Eagles 0 1 1 1 6 0 40 0 1 0Night 0 0 0 0 1 0 2 42 2 3Sunset 6 0 0 0 0 0 1 1 35 7Roses 0 0 0 0 0 0 1 2 2 45
References
[1] A.W.M. Smeulders, et al., Content-based image retrieval atthe end of the early years, IEEE Trans. PAMI 22 (2000)1349–1380.
[2] O. Chapelle, P. Ha6ner, V. Vapnik, SVMs for histogram-basedimage classi;cation, IEEE Trans. Neural Networks, 1999.
[3] Q. Tian, P. Hong, T.S. Huang, Update relevant imageweights for content-based image retrieval using support vectormachines, IEEE ICME’2000.
[4] S. Tong, E. Chang, Support vector machine active learningfor image retrieval, Proceedings of ACM MM’01.
[5] Y. Rui, T.S. Huang, M. Ortega, S. Mehrotra, Relevancefeedback: a power tool for interactive content-based imageretrieva, IEEE Trans. Circuits Syst. Video Technol., 1998.
[6] G. Qiu, Indexing chromatic and achromatic patterns forcontent-based color image retrieval, Pattern Recognition 35(8) (2002) 1675–1686.
[7] G. Qiu, K-M Lam, Spectrally layered color indexing, in: M.S.Lew, N. Sebe, J.P. Eakins (Eds.), Image and Video Retrieval,CIVR2002, Lecture Notes in Computer Science, Vol. 2383,Springer, Berlin, July 2002, pp. 100–107.
[8] J. Berens, G.D. Finlayson, G. Qiu, Image indexing usingcompressed color histogram, IEE Proceedings, Vision, Imageand Signal Processing 147 (4) (2000) 349–355.
[9] J. Huang, S.R. Kumar, M. Mitra, W.-J. Zhu, R. Zabih, Imageindexing using color correlograms, Int. J. Comput. Vision(1999) 245–268.
[10] B.S. Manjunath, et al., Color and texture descriptors, IEEETrans. Circuits Syst. Video Technol. 11 (6) (2001).
[11] Y. Freund, R. Schapire, A decision-theoretic generalizationof online learning and an application to boosting, J. Comput.Syst. Sci. 55 (1) (1997) 119–139.
[12] K. Tieu, P. Viola, Boosting image retrieval, Proc. of CVPR1 (2000) 228–235.
[13] G.D. Guo, A.K. Jain, W.Y. Ma, H-J Zhang, Learningsimilarity measure for natural image retrieval with relevantfeedback, IEEE Trans. Neural Networks 13 (2002) 811–820.
[14] N. Howe, Boosted Image Classi;cation: An Empirical Study,ICML Workshop on Machine Learning in Computer Vision,July 9, 2002, Sydney, Australia.
[15] T. Balachander, R. Kothari, Introducing Locality and Softnessin Subspace Classi;cation, Pattern Analysis & Applications,Vol. 2, Springer, London, 1999, pp. 53–58.

G. Qiu et al. / Pattern Recognition 37 (2004) 2177–2193 2193
[16] K-S Goh, E. Chang, K-T Cheng, Support Vector MachinePairwise Classi;ers with Error Reduction for ImageClassi;cation, Third International Workshop on MultimediaInformation Retrieval (MIR2001), Ottawa, Canada, October5, 2001.
[17] T. Serre, B. Heisele, S. Mukherjee, T. Poggio, Featureselection for face detection, MIT A.I. Memo No. 1697,September, 2000.
[18] A.K. Jain, B. Chandrasekaran, Dimensionality and samplesize considerations in pattern recognition practice, in: P.R.Krishnaiah, L.N. Kanal (Eds.), Handbook of Statistics, Vol.2, 1987, pp. 835–855.
[19] S.J. Raudys, A.K. Jain, Small sample size e6ects in statisticalpattern recognition: recommendations for practitioners, IEEETrans. Pattern Anal. Machine Intelligence 13 (1991) 252–264.
[20] A. Gersho, R.M. Gray, Vector quantization and signalcompression, Kluwer Academic Publishers, Boston, 1992.
[21] MPEG7 FCD, ISO/IEC JTC1/SC29/WG11, March 2001,Singapore.
[22] C.M. Bishop, Neural Networks for Pattern Recognition,Clarendon Press, Oxford, 1995.
[23] M. Turk, A. Pentland, Eigenfaces for Recognition, J. CognitiveNeurosci. 3 (1) (1991) 71–86.
[24] R.C. Gonzalez, R.E. Woods, Digital Image Processing, 2ndEdition, Prentice-Hall, Englewood Cli6s, NJ, 2002.
[25] M. Hearst, Support vector machines, IEEE IntelligenceSystems, pp. 18–28, July/August, 1998.
[26] C. Burges, A tutorial on support machines for patternrecognition, Data Mining and Knowledge Discovery, KluwerAcademic Publishers, Vol. 2, 1998, pp. 121–167.
[27] http://www.research.microsoft.com/∼jplatt/smo.html.[28] G. Ciocca, R. Schettini, Using a relevant feedback mechanism
to improve content based image retrieval, Proceedings ofVisual’99, 1999, pp. 107–114.
About the Author—GUOPING QIU received the B.Sc. degree in Electronic Measurement and Instrumentation from the University ofElectronic Science and Technology of China, Chendu, China, in July 1984 and the Ph.D. degree in Electrical and Electronic Engineeringfrom the University of Central Lancashire, Preston, England, in 1993. He is currently a Reader in the School of Computer Science at theUniversity of Nottingham, UK. He has research interests in the broad area of computational visual information processing and has publishedwidely in this area. His current research is focused on two main areas—making better images and graphics and managing large imagerepositories. More about his research can be found in URL: http://www.cs.nott.ac.uk/∼qiu.
About the Author—XIA FENG received the B.Sc. degree in Computer Science from Nan Kai University, Tianjin, China, in July 1991and the M.Sc. degree in Computer Science from the Nan Jing University of Aeronautics and Astronautics, China, in 2001 and is pursuingher Ph.D. degree in Nan Kai University, China. She is currently an associate professor in the School of Computer Science and Technologyat the Civil Aviation University of China, Tianjin, China. From May 2002 to May 2003, She was a visiting researcher in the School ofComputer Science at the University of Nottingham, UK. Her current research interests are in image retrieval and data mining.
About the Author—JIANZHONG FANG received the Bachelor’s degree in Computer Engineering from the National University of DefenseTechnology, Changsha, China, in 1989. From 1989 to 1997, he was engaged in research and development of Central Processing Unit ofmainframe computers at the East China Research Institute of Computer Technology, Shanghai, China. From 1997 to 2001, he worked inR& D department in Printroxin in Singapore. Since 2001, he has been doing his Ph.D. program at the University of Nottingham, UK.He is now studying computational methods of generic visual object detection and recognition.


![영상처리 실습 #4 Histogram 연산 [ Histogram 대화상자 만들기 ]. Histogram 대화상자 만들기](https://img.dokumen.tips/doc/110x75/5697bfe71a28abf838cb5e1a/-4-histogram-histogram-.jpg)