Embed Size (px)
Citation preview
Comprehensive study of the wake vortex
phenomena to the assessment of its
incorporation to ATM for safety and
capacity improvements
by
Peter CHOROBA
A dissertation
submitted to the University of Zilina
in partial fulfilment of the
requirements for the degree of
Doctor of Philosophy
in
Transport and Communication Technologies
Zilina, Slovak Republic, 2006

ii
I hereby declare that I am the sole author of this dissertation.
I authorize the University of Zilina and EUROCONTROL Experimental Centre to lend this dissertation to
other institutions or individuals for the purpose of scholarly research.
Signature
I further authorize the University of Zilina and EUROCONTROL Experimental Centre to reproduce this
dissertation by photocopying or by other means, in total or in part, at the request of other institutions or
individuals for the purpose of scholarly research.
Signature
iii
Abstract
Wake turbulence is one of the main causes for airport capacity problems in air transportation. The lift force exerted on aircraft wings produces vortices with long life-times in their wake. Especially during an aircraft’s critical landing phase vortices can endanger any aircraft trailing behind. Serious problems with wake vortices were first recognized back in the 1970s when the Boeing 747 came into service. Pilots of smaller aircraft who followed the much heavier B 747 in to landing reported suddenly strong turbulence that even caused some aircraft to crash. Safe separation distances (ICAO) are prescribed to ensure that an aircraft does not enter into an unsafe situation due to the wake turbulence of a preceding aircraft. These separation distances have been defined in the past on the basis of aircraft weight classes. Some modifications of these rules have been introduced by the regulating authorities that reflect the experience obtained over the years. Nevertheless neither the original proposals nor these modified rules can always be explained by rigorous physically-based reasoning. It also resulted in a lack of harmonization between the various airports or authorities. It is felt that the regulations that prescribe the separation distances might be too conservative in most cases or too optimistic for very specific meteorological conditions.
The overall objective of this thesis is the understanding of the nature of wake turbulence phenomena in Air Traffic Management (ATM) for potential safety and capacity improvements. Therefore this study was defined in four main research axes: state-of-the-art of physics, technology and operational procedures, definition of users’ (pilots and air traffic controllers) requirements by operational survey, estimation of capacity benefit through fast-time simulations and safety analysis including probabilistic risk assessment of wake vortex safety.
We also introduce a new concept of dynamic separations with transitions between two separation modes depending on the actual meteorological conditions, and within the safety analysis part of the thesis we propose a new conservative probabilistic model for wake vortex safety assessment.
iv
Acknowledgements
After over 1000 days of PhD research, almost 200 pages of thesis, paper and report writing, many presentations at conferences and seminars, I can finally add the final and the most enjoyable part: it is the part with the lines I am writing now, in which I can thank the many people that have enabled me to produce this work by providing the fruitful environment that I have had in the last four years.
First of all, I have to thank Susanne, my partner, for her endless patience and support and for cheering me up when things did not run as smoothly as many of us would have wished. Furthermore I would like to thank my parents for confiding in me and my abilities, especially at times when I was not so sure about them. Even though they live far from me and I can’t see them very often, I feel their support in my heart. Apart of the family, the most important person I would like to say “Thank you!” is my supervisor Prof. Vu Duong, who gave me a fabulous opportunity to conduct my research at Eurocontrol Experimental Centre. He supported me from the beginning till the end, and did not lose the faith in me in the moments when “my trolley on the rollercoaster” was descending. I learned a lot from him, we had also a lot of fun together and I very much appreciate the time we worked together. Supervising a PhD student is not always an easy and pleasant job when there are thousands of other things that one has to pursue. My big thanks belongs also to Andy Harvey, who offered me an internship at EEC before I started to work on this thesis.
I would like to thank Prof. Josef Kriz, Prof. Antonin Kazda and Dr. Andrej Novak from University of Zilina for their academic support and the great work they have been doing at the Department of Air Transport. I am also grateful to company Preston Aviation Solutions Ltd, which provided me a special student licence for Total Airspace Airport Modeller (TAAM).
Then, there are the many colleagues that I have met during that time and who have made this period so pleasant, fruitful and so rich in experience. My first boss in EEC Nadine Pilon, wake vortex experts Antoine Vidal, Jean-Pierre Nicolaon and Thomas Gerz, “TAAM-inators” Jean-Luc Janszen, Francois Vergne and Luis Sillard, then also Ray Dowdal, Christian Pusch, Horst Hering, my first officemates Ha, Thong and Monica and a few work-friends M&M, Sprajtak, Martina, Frederic and Tarja. Of course there were many more people I liked to talk to, or play tennis with, or just meet and greet them on the corridor. You all contributed in one or the other way, through technical discussions, sharing experience or simply by your company and your friendship.
…and so many more who would deserve to be mentioned….
Thanks to all of you!
v
Table of Contents Chapter 1 Introduction......................................................................................................................................1-1
1.1 Background.............................................................................................................................................1-1 1.2 Research problem and hypothesis .........................................................................................................1-3 1.3 Methodology...........................................................................................................................................1-4 1.4 Thesis outline..........................................................................................................................................1-4 1.5 Delimitations of scope ...........................................................................................................................1-5
Chapter 2 Literature review – State of the art.................................................................................................2-1 2.1 Wake vortex separation standards.........................................................................................................2-1
2.1.1 ICAO and local changes .................................................................................................................2-1 2.1.2 FAA / Eurocontrol Action Plan 14 – Wake vortex.......................................................................2-5 2.1.3 IFALPA wake vortex policy ..........................................................................................................2-5
2.2 Physics of the phenomena .....................................................................................................................2-6 2.2.1 Wake vortex formation...................................................................................................................2-6 2.2.2 Characterization of wake vortices..................................................................................................2-8 2.2.3 Age of the vortices ........................................................................................................................2-12 2.2.4 Decay .............................................................................................................................................2-14 2.2.5 Ground effect.................................................................................................................................2-15 2.2.6 Atmospheric influence on wake vortices ....................................................................................2-15
2.3 Safety ....................................................................................................................................................2-17 2.3.1 Introduction to safety....................................................................................................................2-17 2.3.2 Safety assessment and analysis ....................................................................................................2-20
2.4 Capacity ................................................................................................................................................2-20 2.4.1 Introduction ...................................................................................................................................2-20 2.4.2 Understanding capacity and delays at European airports...........................................................2-23 2.4.3 Airport capacity estimation models .............................................................................................2-24 2.4.4 TAAM Review..............................................................................................................................2-25
2.5 Conclusion ............................................................................................................................................2-26 Chapter 3 Objectives and methodology ..........................................................................................................3-1
3.1 Introduction.............................................................................................................................................3-1 3.2 Objectives of the thesis ..........................................................................................................................3-1 3.3 Methodology and justification...............................................................................................................3-2
vi
3.4 Research process ....................................................................................................................................3-3 Chapter 4 Research process – Results .............................................................................................................4-1
4.1 Introduction.............................................................................................................................................4-1 4.2 Phase I – Comprehensive study of technology and operational procedures ......................................4-1
4.2.1 Introduction .....................................................................................................................................4-1 4.2.2 Technology......................................................................................................................................4-1 4.2.3 Operational procedures and systems............................................................................................4-15 4.2.4 Conclusion.....................................................................................................................................4-27
4.3 Phase II – Operational survey..............................................................................................................4-29 4.3.1 Introduction ...................................................................................................................................4-29 4.3.2 Survey description ........................................................................................................................4-29 4.3.3 Data collection ..............................................................................................................................4-29 4.3.4 Data analysis .................................................................................................................................4-31 4.3.5 Conclusion.....................................................................................................................................4-34
4.4 Phase III – Capacity estimation...........................................................................................................4-36 4.4.1 Introduction ...................................................................................................................................4-36 4.4.2 Definition of scenarios..................................................................................................................4-36 4.4.3 Metrics measured ..........................................................................................................................4-38 4.4.4 Data input ......................................................................................................................................4-39 4.4.5 Model validation & limitations ....................................................................................................4-43 4.4.6 Analysis of the results...................................................................................................................4-44 4.4.7 Conclusion.....................................................................................................................................4-52
4.5 Phase IV – Safety analysis...................................................................................................................4-53 4.5.1 Introduction ...................................................................................................................................4-53 4.5.2 Risk based policy making.............................................................................................................4-54 4.5.3 Quantitatively estimating wake vortex safety using P2P decay model .....................................4-57 4.5.4 Incident reporting..........................................................................................................................4-70 4.5.5 Conclusion.....................................................................................................................................4-71
Chapter 5 Theoretical and practical contributions..........................................................................................5-1 5.1 Theoretical contributions .......................................................................................................................5-1 5.2 Practical contributions............................................................................................................................5-1
Chapter 6 Conclusions......................................................................................................................................6-1

vii
6.1 Conclusions about research problem ....................................................................................................6-1 6.2 Limitations..............................................................................................................................................6-3 6.3 Future work.............................................................................................................................................6-4
Appendix A Detailed analysis of the survey...................................................................................................6-5 Appendix B Additional fast-time simulation results ....................................................................................6-47 Appendix C List of publications....................................................................................................................6-52

viii
List of Figures
Figure 1-1 ICAO separation scheme for single runway approaches.............................................................1-1 Figure 1-2 Airport operations influenced by wake vortices ..........................................................................1-2 Figure 2-1 Wake turbulence behind an aircraft ..............................................................................................2-6 Figure 2-2 Normalized tangential velocity profiles of mostly used and adopted vortex models ..............2-11 Figure 2-3 Aviation accidents and fatalities over 1945 – 2001 (Boeing 2002)..........................................2-18 Figure 2-4 Aviation accident rates and fatalities 1959 – 2001 (Boeing 2002) ...........................................2-18 Figure 2-5 Practical capacity λp ....................................................................................................................2-21
Figure 2-6 Saturation capacity λs ..................................................................................................................2-22
Figure 2-7 Unconstrained capacity λu ..........................................................................................................2-22 Figure 2-8 Effect of adverse weather on Heathrow’s capacity....................................................................2-24 Figure 3-1 Cyclical, reflective research process - initial seven steps............................................................3-3 Figure 3-2 Overall research process used in our PhD research .....................................................................3-4 Figure 4-1 General architecture of Lidar.........................................................................................................4-2 Figure 4-2 Maximum LIDAR range vs. visibility ..........................................................................................4-4 Figure 4-3 P2P vs. Lidar measurements..........................................................................................................4-9 Figure 4-4 Example of P-VFS prediction bounds (shaded area) versus measured data (symbols) for a case
with head and cross wind from DLR WakeOp campaign ...................................................................4-11 Figure 4-5 SOIA procedure............................................................................................................................4-16 Figure 4-6 High approach landing system / Dual threshold operation........................................................4-17 Figure 4-7 WakeVAS architecture ................................................................................................................4-19 Figure 4-8 ATC-WAKE HMI for approach controller ................................................................................4-24 Figure 4-9 ATC-Wake alarm for Tower controllers ....................................................................................4-25 Figure 4-10 Definition of SYAGE ................................................................................................................4-27 Figure 4-11 Number of pilot responses per airline.......................................................................................4-30 Figure 4-12 Number of ATCO responses per APP centre...........................................................................4-31 Figure 4-13 Transition periods in scenarios with dynamic separation mode .............................................4-38 Figure 4-14 Scheduled traffic (arrivals + departures) at LHR, FRA and CDG..........................................4-40 Figure 4-15 Aircraft mix - Heavy, Medium, Light.......................................................................................4-40 Figure 4-16 Paris Charles de Gaulle airport layout created in TAAM .......................................................4-41
ix
Figure 4-17 Frankfurt am Main airport layout created in TAAM...............................................................4-42 Figure 4-18 London Heathrow airport layout created in TAAM ................................................................4-42 Figure 4-19 Paris CDG - average and maximum hourly RWY throughput ...............................................4-45 Figure 4-20 LHR - average and maximum hourly RWY throughput .........................................................4-45 Figure 4-21 FRA - average and maximum hourly RWY throughput .........................................................4-46 Figure 4-22 Potential runway throughput increase - Ni ...............................................................................4-47 Figure 4-23 Average airport delay vs. Maximum hourly number of movements - London Heathrow..4-49 Figure 4-24 Average airport delay vs. Maximum hourly number of movements – Paris CDG...............4-49 Figure 4-25 Average airport delay vs. Maximum hourly number of movements –..................................4-50 Figure 4-26 Averaged delay per aircraft ICAO vs. BT1 at Paris CDG.......................................................4-51 Figure 4-27 Averaged delay per aircraft ICAO vs. BT1 at London Heathrow ..........................................4-51 Figure 4-28 Averaged delay per aircraft ICAO vs. BT1 at Frankfurt am Main.........................................4-52 Figure 4-29 Possible risk criteria frameworks ..............................................................................................4-55 Figure 4-30 Goal-setting safety management ...............................................................................................4-56 Figure 4-31 The Profile of Final Approach Phase........................................................................................4-58 Figure 4-32 Flight time to a certain point .....................................................................................................4-62 Figure 4-33 Circulation of vortices at different ages....................................................................................4-63 Figure 4-34 Descent distances of vortices at different ages.........................................................................4-64 Figure 4-35 Aircraft altitude ..........................................................................................................................4-65 Figure 4-36 Probability of Aircraft Passing A Location at Different Time................................................4-66 Figure 4-37 Conditional Probability of Vortex Encounter ..........................................................................4-66 Figure 4-38 Probability of Vortex Encounter at A Location at Different Time.........................................4-67 Figure 4-39 Probability of Vortex Encounter at A Location at Any Time .................................................4-67 Figure 4-40 Probability of An Encounter with Vortices Younger than 50 Seconds..................................4-68 Figure 4-41 Probability of An Encounter with Vortices at Age Between 50 sec. and 70 sec ...................4-68 Figure 6-1 Paris CDG – comparison of number of movements in ICAO and BT scenarios.....................6-47 Figure 6-2 Frankfurt – comparison of number of movements in ICAO and BT scenarios .......................6-47 Figure 6-3 London Heathrow – comparison of number of movements in ICAO and BT scenarios ........6-48 Figure 6-4 Airport delay composition at Paris CDG in ICAO scenario .....................................................6-49 Figure 6-5 Airport delay composition at Paris CDG in BT1 scenario ........................................................6-49 Figure 6-6 Airport delay composition at Frankfurt in ICAO scenario........................................................6-50 Figure 6-7 Airport delay composition at Frankfurt in BT1 scenario...........................................................6-50

x
Figure 6-8 Airport delay composition at London Heathrow in ICAO scenario .........................................6-51 Figure 6-9 Airport delay composition at London Heathrow in BT1 scenario............................................6-51

xi
List of Tables
Table 2-1 ICAO wake vortex separation matrix.............................................................................................2-2 Table 2-2 FAA IFR separation matrix (at runway threshold)........................................................................2-3 Table 2-3 UK five category separation standard ............................................................................................2-4 Table 2-4 Respective parameters and their definitions ..................................................................................2-8 Table 4-1 Aircraft measurements operational performance characteristics................................................4-15 Table 4-2 Separation matrix – ICAO vs. Reduced separations ...................................................................4-37 Table 4-3 Maximum number of movements achieved in specific scenarios ..............................................4-44 Table 4-4 Average airport delay per aircraft (min) in various scenarios ....................................................4-48 Table 4-5 Hypothetical Aircraft Characteristics ...........................................................................................4-61 Table 4-6 Hypothetical meteorological parameters......................................................................................4-63
xii
Abbreviations
ACARS - Aircraft Communications Addressing and Reporting System
ACI - Airports Council International
ADREP - Accident/Incident Reporting System
AGL - Above Ground Level
AIP - Aeronautical Information Publication
ALARP - As-Low-As-Reasonably-Practicable
AMAN - Arrival MANager
AMDAR - Aircraft Meteorological Data Relay
ANSP - Air Navigation Service Provider
APP - Approach Control
ARINC - Aeronautical Radio Inc.
ASMT - Air Traffic Management safety monitoring tool
ATC – Air Traffic Control
ATCO – Air Traffic Controller
ATFM - Air Traffic Flow Management (str.42)
ATL - Hartsfield Airport In Atlanta
ATM – Air Traffic Management
AVOSS - Aircraft Vortex Spacing System
BWI - Baltimore Airport
CDG - Paris Charles de Gaule Airport
CDTI - Cockpit Display of Traffic Information
CFMU - Central Flow Management Unit
COTS - Commercial Of The Shelf
CPDLC - Controller-pilot Data Link Communications
CSPR - Closely Space Parallel Runway Layout
CTAS - Centre TRACON Automation System
CTI - Coherent Technology Inc
CW LIDAR - Continuous-wave LIDAR
CWP - Controller Working Position
DCA - Ronald Reagan National Airport in Washington DC
xiii
DFS - Deutsche Flugsicherung
DLR - Deutsches Zentrum fur Luft-und Raumfahrt
DMAN/AMAN – Departure / Arrival manager
EASA – European aviation safety agency
EC – European Commission
ECAC - European Civil Aviation Conference
EDR - Energy Dissipation Rate
EEC – Eurocontrol Experimental Centre
ESARR - Eurocontrol Safety Regulatory Requirements
EU - European Union
EUROCONTROL – European organization for safety in air navigation
FAA – Federal Aviation Administration
FDR - Flight Data Recorders
FRA - Frankfurt Airport
GAO - General Accounting Office
HALS / DTOP - High Approach and Landing System / Dual Threshold Operation
HERMES - Heuristic Runway Movement Event Simulation
HMI - Human Machine Interface
IATA - International Air Transport Association
ICAO – International Civil Aviation Organization
IFALPA – International Federation of Airline Pilots
IFR – Instrumented Flight Rules
IGE - In Ground Effect
ILS - Instrument Landing System
IMC – Instrument meteorological conditions
ITWS - Integrated Terminal Weather System
JAA – Joint Aviation Authorities
LDA – Localizer Directional Aid
LES - Large Eddy Simulation
LGA - La Guardia in New York City
LHR - London Heathrow
LIDAR – Laser Detection and Ranging

xiv
LM – Lokal Modell
LOS - Line of Sight
LVC – Low Visibility Conditions
LVP - Low Visibility Procedures
MAP – Missed Approach Point
MDCRS - Meteorological Data Collection and Reporting System
MIRS - Microwave Remote Sensing Laboratory of the University of Massachusetts
MM5 - Mezoscale Model
MTOW - Maximum Take-Off Weight
NAS - National Airspace System
NASA – National Aeronautical and Space Agency
NGE - Near Ground Effect
NLR - National Aerospace Laboratory
NOWVIV - Nowcasting of Wake Vortex Impact Variables
NTZ - No Transgression Zone
NWP - Numerical Weather Prediction
NWS - National Weather Service
P2P - Probabilistic Two-Phase Wake Vortex Decay and Transport Model
PDF - Probability Density distributions
PRM - Precision Runway Monitoring
PVD - Plan View Display
P-VFS - Probabilistic Vortex Forecast System
RADAR – Radio Detection and Ranging
RASS sensor - Radio Acoustic Sounder
RTCA - Radio Technical Commission for Aeronautics
RVSM - Reduced Vertical Separation Minima
SARP - Standards and Recommended Practices
SFO - San Francisco International Airport
SID - Standard Instrument Departure route
SIMMOD - Airport and Airspace Simulation Model
SMGCS - Surface Movement Guidance Control System
SMP - Separation Mode Planner
xv
SODAR – Sound Detection and Ranging
SOIA - Simultaneous Offset Instrument Approaches
SSAP - Strategy Safety Action Plan
STAR - Standard Arrival Route
STNA - Service Technique de la Navigation Aérienne
SYAGE - Système Anticipatif de Gestion des Espacements
TAAM – Total Airspace Airport Modeller
TAPPS - Terminal Area Planetary Boundary Layer Prediction System
TBS - Time Based Separations
TC - Transport Canada
TEPwind profiler - Turbulent Eddies Wind Profiler
TKE - Turbulence Kinetic Energy
TLS - Target Level of Safety
TMA - Terminal Manoeuvring Area
TOPAZ - Traffic Organizer and Perturbation AnalyZer
UCL - Universite Catholique de Louvain
UHF - Ultra High Frequency
VAS - Vortex Advisory System
VFR - Visual Flight Rules
VFS - Vortex Forecast System
VMC – Visual Meteorological Conditions
WAVIR - Wake Vortex Induced Risk Assessment Tool
WT – Wake Turbulence
WV – Wake Vortex
WVV - Wake Vortex Vector
WVWS - Wake Vortices Warning System

1-1
Chapter 1
Introduction
1.1 Background
Just like a ship leaves a wave behind it in the sea, an aircraft leaves a wake in the air. An aircraft's wake is in the form of two counter-rotating swirling rolls of air - the wake vortices - that trail from the wings of the aircraft. The wake vortex pair may last for several minutes and may stretch for many kilometres behind the aircraft. The strength of the vortices basically depends on the aircraft weight, divided by the product of air density, flying speed and wingspan. This property generally increases with aircraft weight. The lifetime of a vortex depends upon local meteorological conditions. Vortices last longer in calm air and atmospheric turbulence hastens their decay.
Why do wake vortices matter? It is a question of safety. The rapidly swirling air in a vortex can catch the wings of a following aircraft with potentially disastrous results. Tests with experienced test pilots have shown that even heavy size commercial airliners can be thrown out of control if they follow too close behind a large aircraft such as a Boeing 747. Wake vortices are normally invisible and pilots have no warning that they are flying into one. For this reason, the International Civil Aviation Organization (ICAO) lays down strict rules (Figure 1-1) about the permitted spacing between aircraft, based on their size. In instrument flying conditions aircraft may follow no closer than three nautical miles (5.56 km), and a small aircraft must follow at least six nautical miles (11.12 km) behind a heavy jet such as a Boeing 747.
B 7 4 7
0
L ead in g a irc raft
hea vy> 1 36 t
m e dium7 - 13 6 t
(sm all)/ ligh t< 7 t
he avy m e dium sm all
Se pa ration , m ile s 3 4 5 6
D H C -8
D H C -8
D H C -8
A 32 0
A 3 20
A 32 0
B 74 7
fo llow e d by
N o vo rtex -re la ted se pa rationfor h ea vy a irc ra ft
airc raftto s ca le
A 32 0
D H C -8
Figure 1-1 ICAO separation scheme for single runway approaches
Many airline pilots who have already had encounters with vortices, usually on the final approach to airports, experienced a buffeting of the aircraft. While of little concern to passengers and crew who are wearing seat belts at this phase, pilots regularly report minor injuries to crewmembers standing up or
- 1-2-
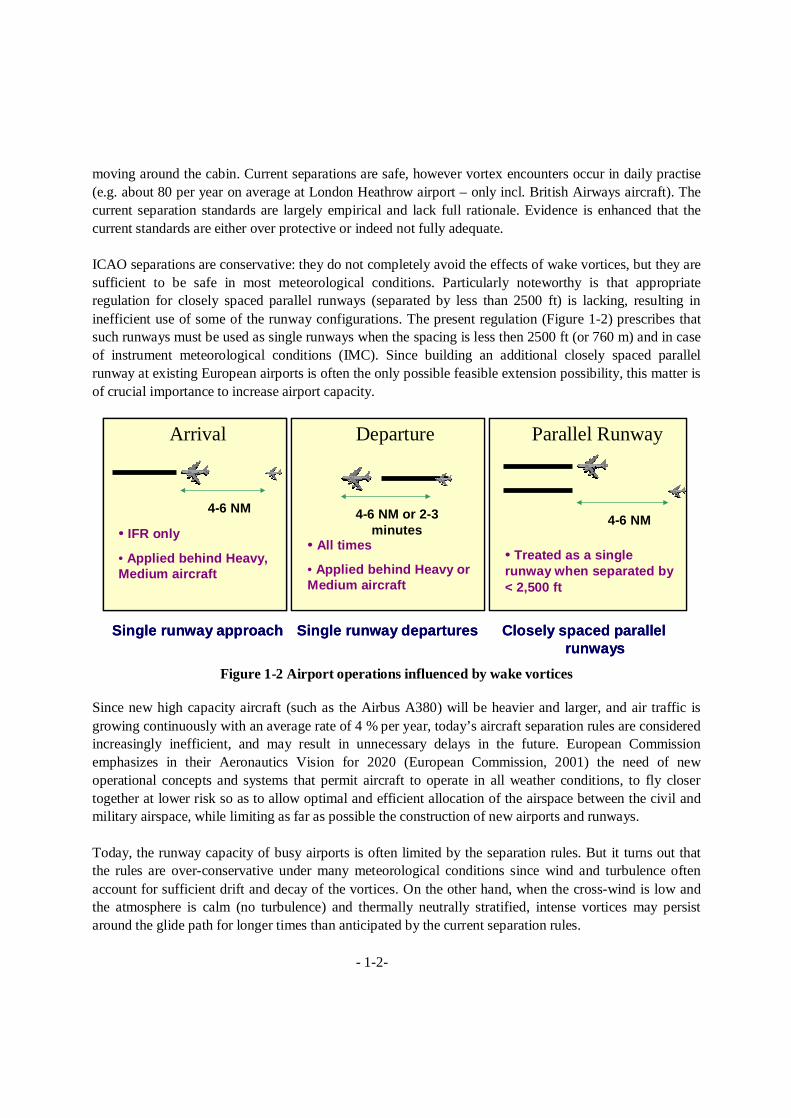
moving around the cabin. Current separations are safe, however vortex encounters occur in daily practise (e.g. about 80 per year on average at London Heathrow airport – only incl. British Airways aircraft). The current separation standards are largely empirical and lack full rationale. Evidence is enhanced that the current standards are either over protective or indeed not fully adequate. ICAO separations are conservative: they do not completely avoid the effects of wake vortices, but they are sufficient to be safe in most meteorological conditions. Particularly noteworthy is that appropriate regulation for closely spaced parallel runways (separated by less than 2500 ft) is lacking, resulting in inefficient use of some of the runway configurations. The present regulation (Figure 1-2) prescribes that such runways must be used as single runways when the spacing is less then 2500 ft (or 760 m) and in case of instrument meteorological conditions (IMC). Since building an additional closely spaced parallel runway at existing European airports is often the only possible feasible extension possibility, this matter is of crucial importance to increase airport capacity.
Arrival
4-6 NM
• IFR only
• Applied behind Heavy, Medium aircraft
Departure
4-6 NM or 2-3 minutes
• All times
• Applied behind Heavy or Medium aircraft
Parallel Runway
4-6 NM
• Treated as a single runway when separated by < 2,500 ft
Single runway approach Single runway departures Closely spaced parallel runways
Arrival
4-6 NM
• IFR only
• Applied behind Heavy, Medium aircraft
Arrival
4-6 NM
• IFR only
• Applied behind Heavy, Medium aircraft
Departure
4-6 NM or 2-3 minutes
• All times
• Applied behind Heavy or Medium aircraft
Parallel Runway
4-6 NM
• Treated as a single runway when separated by < 2,500 ft
Single runway approach Single runway departures Closely spaced parallel runways
Figure 1-2 Airport operations influenced by wake vortices
Since new high capacity aircraft (such as the Airbus A380) will be heavier and larger, and air traffic is growing continuously with an average rate of 4 % per year, today’s aircraft separation rules are considered increasingly inefficient, and may result in unnecessary delays in the future. European Commission emphasizes in their Aeronautics Vision for 2020 (European Commission, 2001) the need of new operational concepts and systems that permit aircraft to operate in all weather conditions, to fly closer together at lower risk so as to allow optimal and efficient allocation of the airspace between the civil and military airspace, while limiting as far as possible the construction of new airports and runways. Today, the runway capacity of busy airports is often limited by the separation rules. But it turns out that the rules are over-conservative under many meteorological conditions since wind and turbulence often account for sufficient drift and decay of the vortices. On the other hand, when the cross-wind is low and the atmosphere is calm (no turbulence) and thermally neutrally stratified, intense vortices may persist around the glide path for longer times than anticipated by the current separation rules.

- 1-3-
Hence, aircraft wake vortices are a concern for aviation both in terms of capacity and safety. It is a relevant economic factor for airlines, air safety providers and airports, so much the more as the air transportation market is expected to expand strongly in the future. This pressure motivates the stakeholders as well as the aviation authorities to find a solution of the wake turbulence problem for an efficient air traffic management. The research community came up with the hypothesis that airport capacities can be increased whilst at least maintaining today’s high safety levels with a smart combination of forecast and monitoring tools for wake vortices and the local weather around airports, joint by advanced aircraft performance and guidance capabilities, and a smooth integration of these tools into the air traffic control (ATC) environment which would allow dynamic (weather depending) separations between aircraft. Such wake vortex advisory system would be a possible solution to dynamically optimise aircraft spacing during approach, landing and take-off. The requirements related to such a system are threefold: Ø The wake vortex behaviour under varying meteorological conditions must be known physically,
predicted for sufficient time in advance and monitored at the airport site and/or from the aircraft Ø From ATC operational point of view, such a system must be reliable and robust in terms of the
predicted safe separations between aircraft pairs, the forecast horizon for separations, the forecasted changes from one separation procedure to another
Ø IFALPA would accept reduced separation between aircraft if it can be shown, within probability
bounds, wake vortices have either left the corridor or decayed to the level of ambient turbulence.
1.2 Research problem and hypothesis
The objective of this thesis has been defined in summer 2001, when no wake vortex projects were part of the research programme of Eurocontrol Experimental Centre. Therefore, it was defined to be a comprehensive study of the wake vortex phenomena to the assessment of its incorporation to ATM for safety and capacity improvements.
General unknown - the understanding of the nature of wake vortex in ATM, is explored by studying the interrelationships between the physics of the phenomena, technology, operational procedures with a specific focus on safety and capacity.
Hypothesis is defined as:
“We can use the current knowledge of physics along with technology in order to improve airport capacities while maintaining at least the current levels of safety.”

- 1-4-
Hypothesis can be further defined in the form of several major research questions:
Ø What kind of technology (wake vortex detection, prediction or integrated systems) might help to reduce wake turbulence separations in the future?
Ø What are the users’ (pilots and air traffic controllers) requirements and beliefs for future solutions of wake vortex problem?
Ø What are the potential benefits in terms of capacity and delays, what can be achieved at the airports?
Ø What is the actual risk of wake turbulence encounter and safety impact in general?
1.3 Methodology
In elaboration of research questions we use following research methods:
Ø Synthesis and analysis – critical review of physics, state-of-the-art technology, operational procedures
Ø Survey research and interview – a questionnaire design, data collection and data analysis
Ø Case study - capacity assessment by fast-time simulation, modelling of several scenarios including our proposal for new dynamic separation concept
Ø Mathematical modelling and simulation - safety assessment – hybrid analytical model (numerical probabilistic method and Monte Carlo simulation)
Methodology is further described and justified in the Chapter 3.
1.4 Thesis outline
This thesis comprises five chapters apart of its introduction.
Chapter 2 presents the literature review related to the subject of the thesis. It depicts the state-of-the-art of wake vortex research including detailed description of wake vortex separation standards, wake vortex physics, general definitions of safety and airport capacity. It is concluded by definition of major research questions.
Chapter 3 describes detailed objectives of the thesis and the methodology used in investigation of identified research questions. Finally it depicts the overall research process.
Chapter 4, the major part of the thesis is divided into four phases.
Phase I provides a critical analysis of current technologies classified into the following domains:
Ø Wake vortex detection technology
Ø Wake vortex prediction models

- 1-5-
Ø Weather forecast
Ø Weather monitoring
Ø Operational procedures and systems
Phase II presents an operational survey focused on perception of wake turbulence phenomena. Its major aim is to map users’ (pilots and air traffic controllers) understanding of wake vortex problem, their knowledge of physics, technology, impact on safety, incident reporting, their requirements and valuable beliefs for future developments.
The objective of Phase III - the capacity estimation part of the thesis - is to evaluate the potential impact of introduction of dynamic wake turbulence separations with specific reference to airport delay and runway throughput. We propose and simulate one particular concept of dynamic separations at three busy European airports.
The aim of Phase IV is to demonstrate a new method to analyze the risk of wake vortex encounters during the final approach phase, but also to provide a quick overview of risk based policy making and incident reporting problematic.
Major theoretical and practical contributions of this thesis are summarized in the Chapter 5.
Finally the thesis is concluded by Chapter 6 which summarizes the overall work, limitations, major findings and holds an outlook to future work.
1.5 Delimitations of scope
Recognizing the large scope of the problem each phase of the main part of the thesis (Chapter 4) is complex enough to be explored in a separate with more details. Synthesis and review of state-of-the-art technology does not lead to a proposal of ideal technology set or a system. Users’ requirements are defined only in terms of our objective, not in the form of general requirements valid for future system development. This is limited due to insufficient response rate of users in questionnaires. Estimation of potential airport capacity gains are conducted in the Total Airspace Airport Modeller a fast-time simulator tool, which was not designed as a research tool. Nevertheless estimated benefits might be a solid base for further more detailed airport capacity studies. Quantitative estimation of wake vortex safety is limited by lack of meteorological data, the aircraft flight model and aircraft characteristics. The physics of wake vortices can be more complicated than it is used in our model.

2-1
Chapter 2
Literature review – State of the art
This chapter presents the literature review depicting the state-of-the-art of wake vortex research including detailed description of wake vortex separation standards, wake vortex physics, general definitions of safety and airport capacity.
2.1 Wake vortex separation standards
Wake vortices are generated inevitably by an aircraft as a consequence of its lift. The intensity of a vortex, its circulation, mainly depends on aircraft weight, approach speed and span. A wake vortex is potentially hazardous because of the rolling moment it may impose on a following wake encountering aircraft. Therefore, the International Civil Aviation Organization (ICAO) put into force separation standards between leader and follower aircraft for approach, landing and take-off to guarantee safe flight operations. Aircraft are grouped into three weight classes with assigned static separations varying between 2.5 (the minimum radar separation) and 6 nautical miles for approach and landing. These separations must be observed when the airport operates under instrumented meteorological conditions (IMC). When visual conditions (VMC) apply the separations may be relaxed on pilot’s request. Next subchapters summarize ICAO wake turbulence separation matrix as well as two examples of local changes (USA and UK), IFALPA wake vortex policy and FAA / Eurocontrol Action Plan 14.
2.1.1 ICAO and local changes
European airspace design and procedures are based on ICAO standards and guidelines defined in various documents including ICAO Doc. 8168-OPS/611 “Procedures for Air Navigation Services, Aircraft Operations.” Supplementary procedures promulgated specifically for the European region of ICAO are contained in ICAO Doc. 7030. Standards and Recommended Practices (SARPS) are contained in ICAO Doc. 4444. New procedures are published in each State's Aeronautical Information Publication (AIP). When a new procedure is proposed it is circulated to each member State for review and potential adoption. Each State may adopt the procedure or prohibit the use of the new procedure within its boundaries and/or by its operators (airlines). The process of review by all States prior to adoption is designed to assure the safety and effectiveness of all new procedures. ICAO standard separations criteria were defined in the early 70’s and, since then, served to maintain acceptable separation standards of wake vortex safety. Such standard was based on fixed distance (arrival) or time separation (departure) between aircraft according to their respective category. Arrival separations are expressed in distance whether departure separations are based on time, according to the note DOC4444. ICAO wake vortex separations are defined as follows:
A minimum separation of 2 minutes shall be applied between a LIGHT or MEDIUM aircraft taking off behind a HEAVY aircraft or a LIGHT aircraft taking off behind a MEDIUM aircraft when the aircraft are using:
a) The same runway;

- 2-2-
b) Parallel runways separated by less than 760 m (2 500 ft);
c) crossing runways if the projected flight path of the second aircraft will cross the projected flight path of the first aircraft at the same altitude or less than 300 m (1 000 ft) below;
d) parallel runways separated by 760 m (2 500 ft) or more, if the projected flight path of the second aircraft will cross the projected flight path of the first aircraft at the same altitude or less than 300 m (1 000 ft) below.
A separation minimum of 3 minutes shall be applied between a LIGHT or MEDIUM aircraft when taking off behind a HEAVY aircraft or a LIGHT aircraft when taking off behind a MEDIUM aircraft from an intermediate part of the same runway or an intermediate part of a parallel runway separated by less than 760 m (2 500 ft).
One-minute separation is required if aircraft are to fly on tracks diverging by at least 45 degrees immediately after take-off so that lateral separation is provided 5.6.2 Two minutes are required between take-offs when the preceding aircraft is 74 km/h (40 kt) or more faster than the following aircraft and both aircraft will follow the same track.
Table 2-1 ICAO wake vortex separation matrix
LEADER
FOLLOWER
Arrival
separation in
NM
Departure
separation in
min
Heavy 4 2
Medium 5 3
Heavy
W > 136t Light 6 3
Heavy 3 2
Medium 3 2
Medium
7t < W < 136t Light 5 3
Heavy 3 2
Medium 3 2
Light
W < 7t Light 3 2
- 2-3-
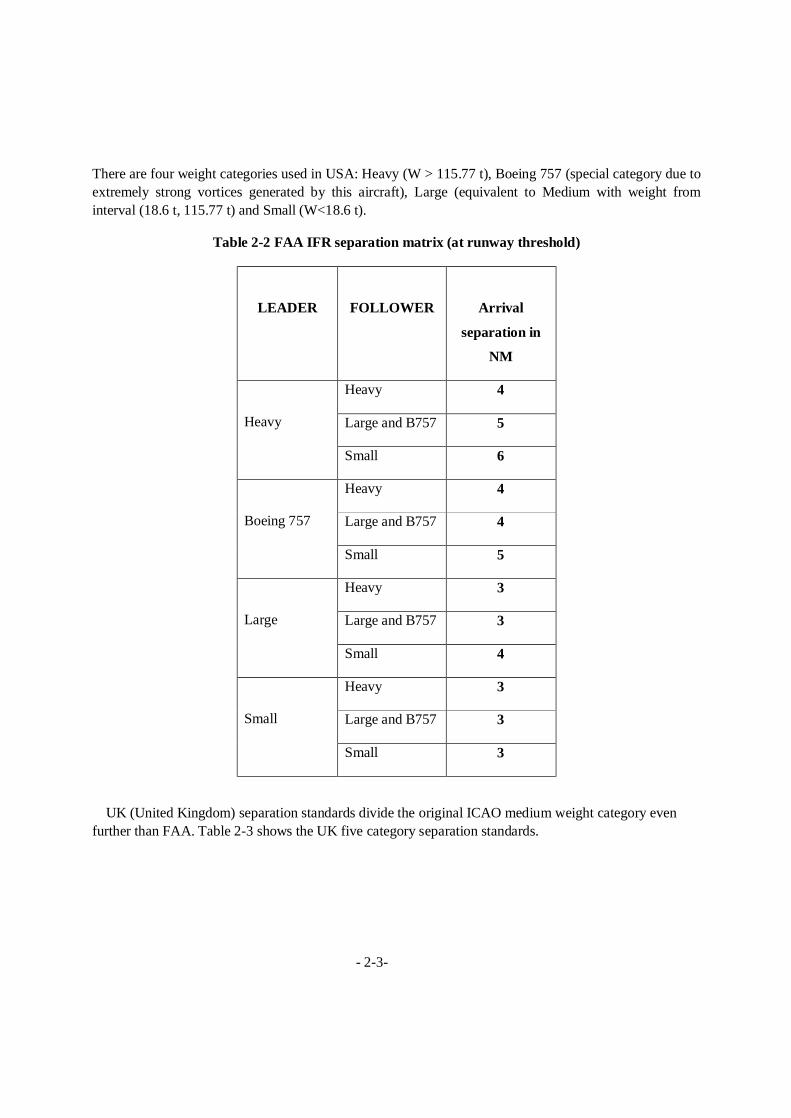
There are four weight categories used in USA: Heavy (W > 115.77 t), Boeing 757 (special category due to extremely strong vortices generated by this aircraft), Large (equivalent to Medium with weight from interval (18.6 t, 115.77 t) and Small (W<18.6 t).
Table 2-2 FAA IFR separation matrix (at runway threshold)
LEADER
FOLLOWER
Arrival
separation in
NM
Heavy 4
Large and B757 5
Heavy
Small 6
Heavy 4
Large and B757 4
Boeing 757
Small 5
Heavy 3
Large and B757 3
Large
Small 4
Heavy 3
Large and B757 3
Small
Small 3
UK (United Kingdom) separation standards divide the original ICAO medium weight category even further than FAA. Table 2-3 shows the UK five category separation standards.
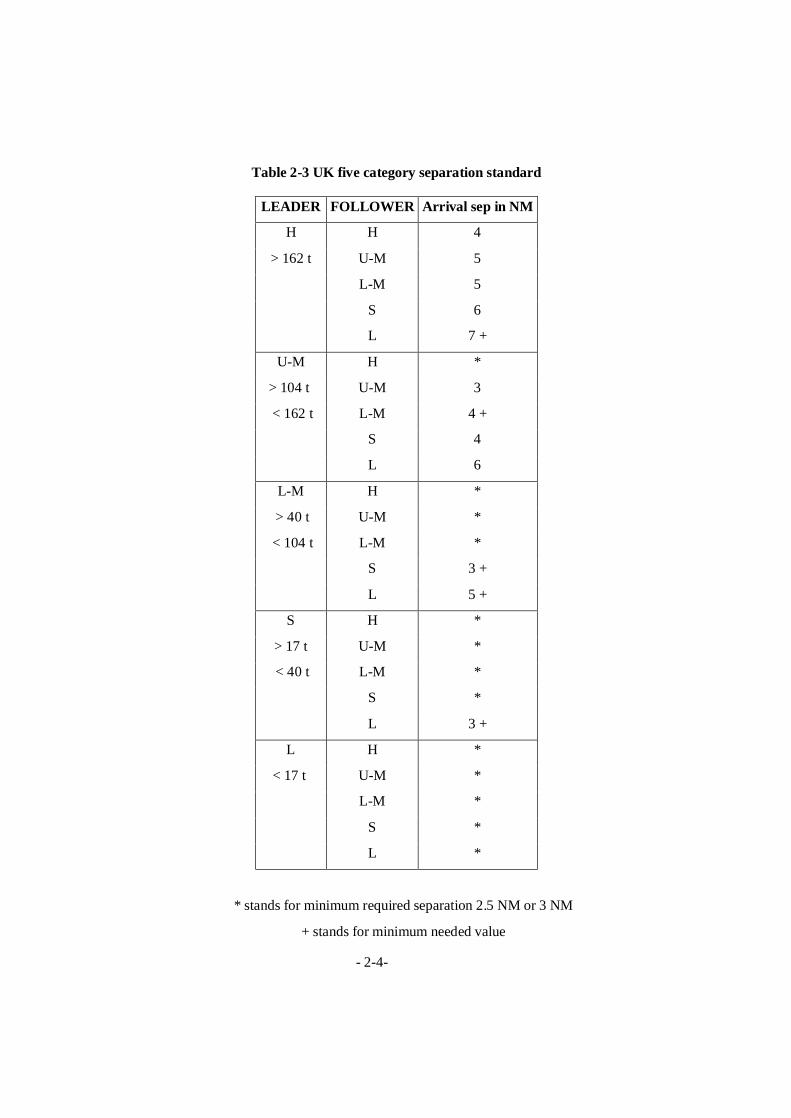
- 2-4-
Table 2-3 UK five category separation standard
LEADER FOLLOWER Arrival sep in NM
H H 4
> 162 t U-M 5
L-M 5
S 6
L 7 +
U-M H *
> 104 t U-M 3
< 162 t L-M 4 +
S 4
L 6
L-M H *
> 40 t U-M *
< 104 t L-M *
S 3 +
L 5 +
S H *
> 17 t U-M *
< 40 t L-M *
S *
L 3 +
L H *
< 17 t U-M *
L-M *
S *
L *
* stands for minimum required separation 2.5 NM or 3 NM
+ stands for minimum needed value

- 2-5-
2.1.2 FAA / Eurocontrol Action Plan 14 – Wake vortex
The current wake vortex separation rules define separation distances depending on the MTOW (Maximum Take-Off Weight) of the paired aircraft. At present, there are no world-wide uniform rules for wake vortex separation minima. There are regional differences and even variations per airport. EUROCONTROL started discussion within the EUROCONTROL/FAA Action Plan 14 initiative to see whether the present separation rules can be harmonized and can perhaps be modified into separation times. Action plan 14 is mapping the US and European wake vortex research activities in order to develop a unique framework for collaboration (FAA/Eurocontrol AP14, 2003).
2.1.3 IFALPA wake vortex policy
It is very important, that IFALPA (IFALPA, 2003) supports the efforts to develop strategies and systems that allow a safe reduction of the standard wake turbulence separation minima, provided the following operational requirements are met:
1. General
Safety should always be the primary consideration if wake turbulence separation is planned to be reduced in order to increase airport capacity.
The results of all international research (ongoing or completed) should be taken into account when developing any wake vortex advisory/avoidance system. Any safety issue identified should be resolved to the satisfaction of the Federation before any reduction in wake turbulence separation minima can be agreed.
IFALPA supports the 1997 US FAA Flight standards position that no planned penetration of wake vortices of any intensity is permitted.
2. Airborne wake vortex detection
Although it is recognized that ground prediction systems are needed to properly plan and execute Air Traffic Flow Management and Control on the basis of expected separation values to be applied, IFALPA believes there is a need to develop airborne wake vortex detection and indication systems to enable pilots to make credible wake turbulence avoidance decisions.
3. Ground based wake vortex advisory and warning systems
Where application of reduced wake turbulence separation minima by ATC is to be based on a predictive system issuing vortex advisory or warning, such a system should be supplemented by a monitoring system able to reliably detect real location, movement, intensity and duration of wake vortices.
Prediction and monitoring systems should be capable of assessing the entire airspace where reduced wake turbulence separation minima are to be applied. Hence the airspace should not be limited to short final approach areas but include the total approach area, in particular from glide slope intercept to landing and departure areas where applicable.
The prediction subsystem should be capable of determining a vertical profile of air temperature and wind direction and speed for all relevant altitudes in increments of not more than 1000ft based on
- 2-6-
meteorological data derived from suitably located sensors processed in real time, to allow a prognosis to be developed about the horizontal and vertical displacement, behaviour and persistence of wake vortices.
2.2 Physics of the phenomena
2.2.1 Wake vortex formation
Wake turbulence defined by FAA (FAA, 2004) as “phenomena resulting from the passage of an aircraft through the atmosphere.” The term refers to several forms of wake turbulence, including wake vortices, which are defined by FAA as “circular patterns of air created by the movement of an airfoil through the air when generating lift.” Other forms of turbulence include thrust stream turbulence (jet blast), propeller wash and rotor wash.
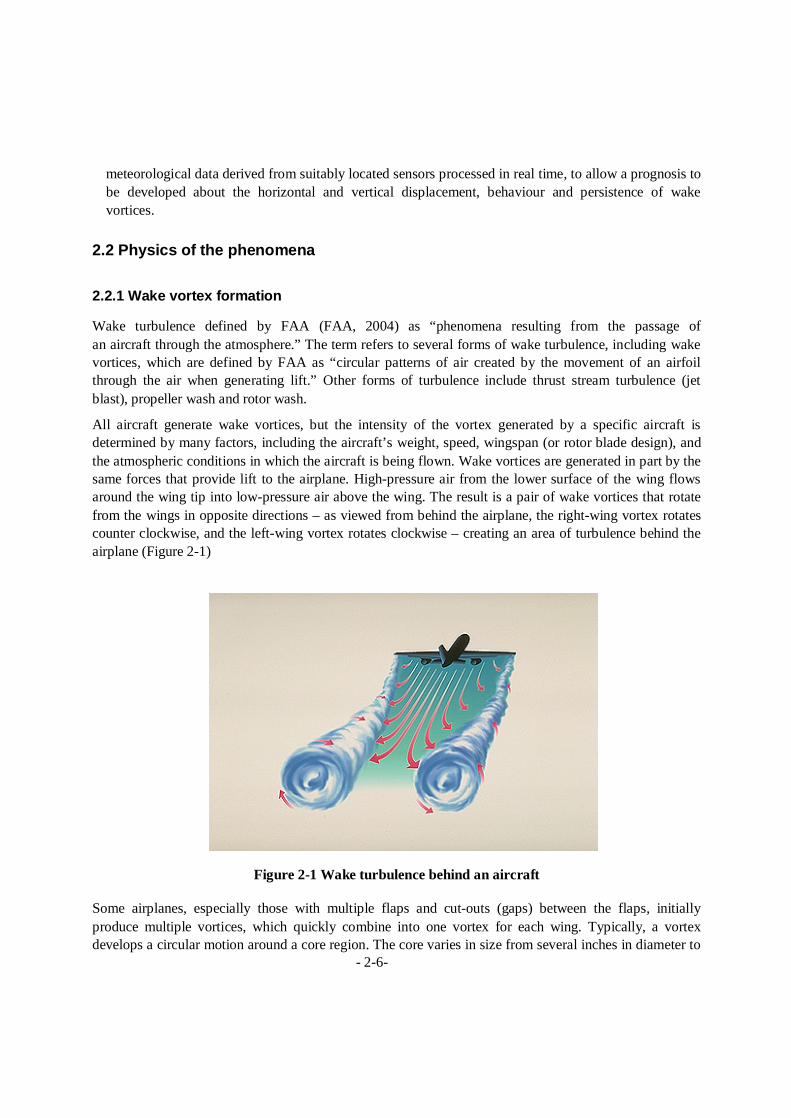
All aircraft generate wake vortices, but the intensity of the vortex generated by a specific aircraft is determined by many factors, including the aircraft’s weight, speed, wingspan (or rotor blade design), and the atmospheric conditions in which the aircraft is being flown. Wake vortices are generated in part by the same forces that provide lift to the airplane. High-pressure air from the lower surface of the wing flows around the wing tip into low-pressure air above the wing. The result is a pair of wake vortices that rotate from the wings in opposite directions – as viewed from behind the airplane, the right-wing vortex rotates counter clockwise, and the left-wing vortex rotates clockwise – creating an area of turbulence behind the airplane (Figure 2-1)
Figure 2-1 Wake turbulence behind an aircraft
Some airplanes, especially those with multiple flaps and cut-outs (gaps) between the flaps, initially produce multiple vortices, which quickly combine into one vortex for each wing. Typically, a vortex develops a circular motion around a core region. The core varies in size from several inches in diameter to
- 2-7-
several feet in diameter. The speed of the air movement within the core can be more than 300 feet (92 meters) per second. The core is surrounded by an outer region of the vortex, as large as 100 feet (31 meters) in diameter, with air moving at speeds that decrease as the distance from the core increases. The wake vortices can extend as far as 10 nautical miles (19 kilometres) behind a large aircraft, typically descending for about 30 seconds at a rate of about 300 feet per minute to 500 feet per minute. The descent rate typically slows to near zero between 500 feet and 900 feet below the aircraft’s flight path. Wake vortices can persist as long as three minutes, depending on various factors, including wind conditions.
The wake flow behind an aircraft can be described by near field and far field characteristics. Just behind the trailing edge of the wing a strong downward motion prevails whereas the regions beyond both wing tips experience a weaker upward motion. In the near field small vortices emerge from that vortex sheet at the wing tips and the edges of the landing flaps. The governing physical processes are boundary layer separation, roll-up of the vortex sheet, merging of co-rotating vortices, initiation of vortex instabilities, etc. These processes define the aircraft – induced characteristics of the wake for its development in the far field. After roll-up the wake generally consists of two coherent counter-rotating swirling flows – the aircraft wake vortices.
The far field is defined as the region where the impact of the atmosphere on the wake vortices becomes dominant, culminating in trajectory and structural changes and circulation decay. Under favourable atmospheric conditions, cooperative instabilities such as the long-wave Crow instability lead to reconnection and subsequent vortex decay. Properly disturbed counter-rotating vortices in a four-vortex system may also develop cooperative instabilities at shorter wavelength, which trigger the transition to turbulent and less coherent primary vortices.
In the past three decades the endeavour to investigate the wake flow behind an aircraft has culminated in a better understanding of the physics of wake vortices and, quite naturally, also put forth a series of new questions and problems. A detailed overview (with many references) over the research activities in the USA has been carried out by Rossow (1999). Hinton et al. (2000) describe the efforts to design an aircraft vortex spacing system for airport capacity improvement. Vyshinsky (1999) summarized the recent research efforts at the Central Aerohydrodynamic Institute (TsAGI) in Russia.

- 2-8-
2.2.2 Characterization of wake vortices
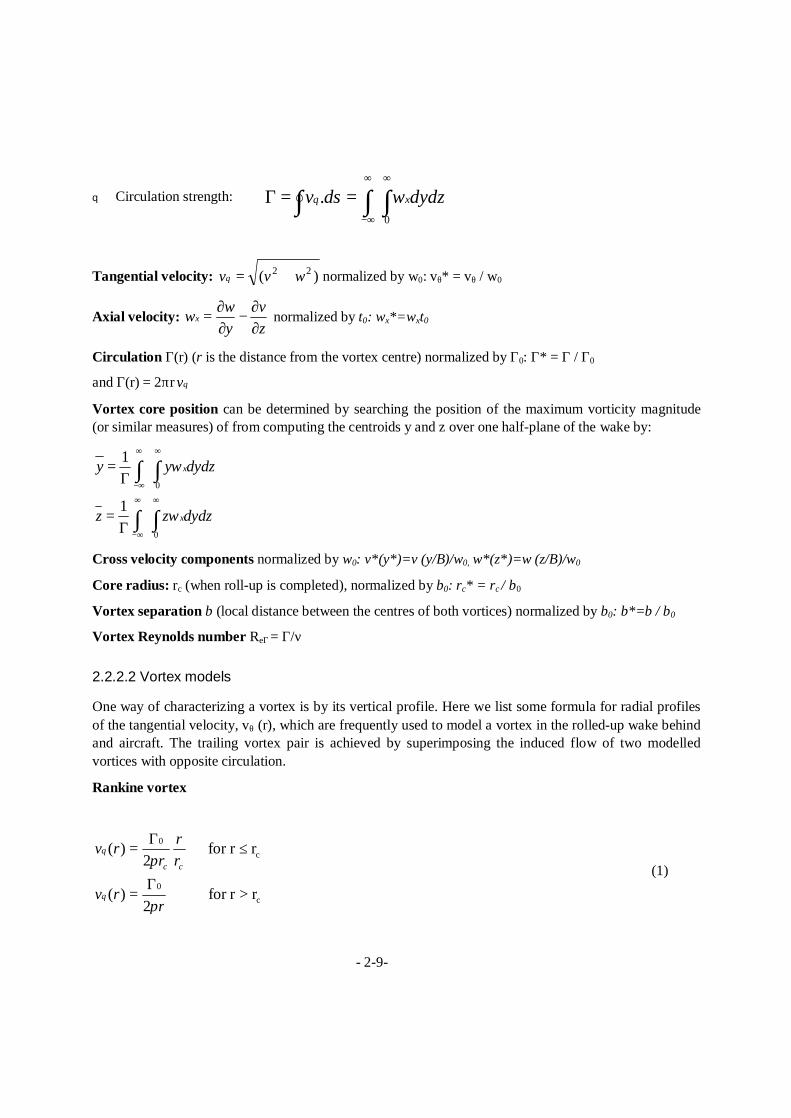
2.2.2.1 Parameter definitions:
Table 2-4 Respective parameters and their definitions
Mass of aircraft M [Kg] Wing span B [m] Aircraft speed, free stream velocity in wind tunnel V [m/s] Local chord C (y) [m] Lift coefficient (local) cL (y) [-] Lift coefficient (global) CL [-] Wing aspect ratio AR [-] Gravitational acceleration G [m/s2] Air density ρ [Kg/m3] Root circulation Γ0 [m2/s] Mean circulation Γ [m2/s] Vortex core radius (maximum tangential velocity) rc [m] Distance from vortex centre r [m] Reference length, initial vortex spacing bo = s.B [m] Reference velocity, descent speed of vortex pair wo = Γ0/(2π bo) [m/s] Reference time to = bo / wo [s] Distance behind aircraft X [m] Time after fly-by T [s] Normalized length, usually used x* = x/B [-] Normalized time, recommended t* = t / to [-] Normalized velocity v* = V / wo [-] Lateral coordinate y [-] Vertical coordinate z [-] Vertical velocity component w [m/s] Lateral velocity component v [m/s] Spanwise load factor s [-]
We define a coordinate system with origin in the centre of gravity of the aircraft and x, y, z defining the axes of flight, span and height. For allowing comparison of data from different sources it is recommended to properly normalize parameters, which characterize the wake in terms of vortex strength, decay, or encounter. In the following, we list proposed vortex parameters and propose respective normalizations.
q Axial velocity (Vorticity):
(concentrated in vortex cores and vorticity layers)
zv
yw
x∂∂
−∂∂
=ω
- 2-9-
∫ ∫∫∞∞
∞−
==Γ0
. dydzsdv xωθ
q Circulation strength:
Tangential velocity: )( 22 wvv +=θ normalized by w0: vθ∗ = vθ / w0
Axial velocity: zv
yw
x∂∂−
∂∂=ω normalized by t0: ωx*=ωxt0
Circulation Γ(r) (r is the distance from the vortex centre) normalized by Γ0: Γ* = Γ / Γ0
and Γ(r) = 2πr θv
Vortex core position can be determined by searching the position of the maximum vorticity magnitude (or similar measures) of from computing the centroids y and z over one half-plane of the wake by:
0
0
1
1
x
x
y y dydz
z z dydz
ω
ω
∞ ∞
−∞
∞ ∞
−∞
=Γ
=Γ
∫ ∫
∫ ∫
Cross velocity components normalized by w0: v*(y*)=v (y/B)/w0, w*(z*)=w (z/B)/w0
Core radius: rc (when roll-up is completed), normalized by b0: rc* = rc / b0
Vortex separation b (local distance between the centres of both vortices) normalized by b0: b*=b / b0
Vortex Reynolds number ReΓ = Γ/ν
2.2.2.2 Vortex models
One way of characterizing a vortex is by its vertical profile. Here we list some formula for radial profiles of the tangential velocity, vθ (r), which are frequently used to model a vortex in the rolled-up wake behind and aircraft. The trailing vortex pair is achieved by superimposing the induced flow of two modelled vortices with opposite circulation.
Rankine vortex
rrfor 2
)(
rrfor 2
)(
c0
c0
>Γ
=
≤Γ=
rrv
rr
rrv
cc
π
π
θ
θ
(1)

- 2-10-
Lamb-Oseen vortex
2
c1.256( )0( ) {1 }
2
rrv r e
rθ
π−Γ= − (2)
Hallock-Burnham vortex
2
0
2 2( )2 c
rv rr r r
θπΓ=
+ (3)
Adapted vortex (Proctor, 1998)
c
0.75 20
c
0.750
For r r :
( ) 1.4 {1 exp( 10( / ) )}.{1 exp( 1.2526( / ) )}2
For r > r :
( ) {1 exp( 10( / ) )}2
c cv r r B r rr
v r r Br
θ
θ
π
π
≤Γ
= − − − −
Γ= − −
(4)
Smooth blending vortex profile (Winckelmans et al., 2000)
2
0
5/ 4 1/
0
( )( ) {1 exp( )}
2 {1 [ ( ) ] }
i
p pi
rBv r rr
B
θ
β
βπβ
Γ= − −
+ (5)
with β0,βi, and p = 10, 500 and 3 respectively.

- 2-11-
Multiple scale vortex (Jacquin et al., 2001)
0
0i1/ 2
0i 01/ 2
0
00
i 0
( ) for r r2 ( )
( ) for r r r2 ( )
( ) for r r2
with r 0.01 and r 0.1
i i
rv rr r r
v rr r
v rr
B B
θ
θ
θ
π
π
π
Γ= ≤
Γ= ≤ ≤
Γ= ≥
≤ ≈
(6)
The multiscale model (6) is a fit of wind tunnel data and provides inner and outer core radii. In models (1) through (5) the core radius appears explicitly, hence the ratio rc / b0 is a free parameter. For comparing all models in Figure 2, it is used the ratio rc / b0 = 0.052, which results implicitly from model (5), to scale all other models.
Figure 2-2 Normalized tangential velocity profiles of mostly used and adopted vortex models
The Rankine vortex consists of a core flow, which rotates like a solid body containing constant vorticity and an outer potential flow without vorticity. The Lamb-Oseen model blends the core region with the potential region of the Rankine vortex and decays with 1/r at 0.1b0 (roughly 2rc).
The multiple-scale vortex model results from the analysis of wind tunnel data gathered in a wake of a small transport aircraft (A300 type model). Proctor (1998) adapted his model to lidar field measurement data. This model has smoothly been blended by Winckelmans et al. (2000) and adjusted to a wind tunnel experiment with a rectangular wing (no flaps, no fuselage) and in two-dimensional vortex roll-up studies (using vortex methods). It is worth to emphasize that the model by Hallock and Burnham progresses very similar as Winckelman’s proposition; their model also has been adapted from data of field measurements

- 2-12-
campaigns. Note that models (3), (4) and (5) meet the potential flow beyond 0.25b0 only, i.e., these vortices contain vorticity over a very large radius compared to the other vortex models.
2.2.3 Age of the vortices
The evolution of the wake behind the aircraft is often described versus its distance x to the aircraft, normalized by the aircraft span B. Here it is recommended, instead, to use the non-dimensional time, t* = t/t0 to characterize the evolution of a wake. The reference time t0, as defined below, is better suited than a length scale, since it allows comparing of various flight stages (cruise, landing, take-off), experimental approaches (wind tunnel, water tank, catapult facilities, or flight).
The initial vortex spacing bo (after roll-up) always scales with the wingspan B, where the parameter s is the span wise load factor and depends on the local circulation Γ (y),
:20
2
0 0 ΓΓ== ∫ dy
ΓΓ(y)
B s
B/
(7)
From measurements it is straightforward to obtain bo when one vortex pair is present after roll-up. When more than one vortex behind each wing is considered, the reference length bo can be computed from the separation of the vortex centroids. Alternatively, one can compute s and thus bo when the local circulation or the span wise wing load
( ) 0.5 ( ) ( )Ly c y c y VΓ = (8)
is known. Often it is found that s is very close to π/4, the value for elliptically loaded wings, even if the wing is not elliptically loaded. However, for some investigations with, e.g., simplified wing geometries or high-lift configured wings, s may deviate from π/4.
Reference time scale
The time scale t0 describes the time in which the vortex pair, shed by the aircraft or aircraft model, propagates the distance of one initial vortex spacing downward. From the definitions in Table 2.1 we conclude that this time scale is given by
2 2
200
0 0
2 2b Bt sπ π= =Γ Γ
(9)
Since the equation includes vortex spacing (wing span) and circulation, this time comprises two major parameters of a given experimental or numerical set-up.
An airplane with velocity V, lift coefficient CL, wing aspect ration AR and span B has a lift which is equal to the flux of vertical momentum of its rolled-up wake,
2 20 02
L
R
C B V VbA
ρρ= Γ (10)
Hence, Γ0 can be expressed in terms of aircraft parameters,

- 2-13-
L0
C= 2 R
VBsA
Γ (11)
When the forces that act on the aircraft are in equilibrium (as for really flying aircraft but, e.g., not in wind tunnels where the models are held by a strut), the aircraft lift and the flux of wake vertical momentum are also equal to the weight of the aircraft M.g, and Γ0 can then be obtained by
0MgsBVρ
Γ = (12)
The “root circulation” Γ0 represents the half-plane circulation of the far wake for a given real aircraft including fuselage, horizontal tail and so forth. With equations (9) and (11) the reference time scale now reads
30 4 R
L
Bt s AC V
π= (13)
With this equation it becomes evident that the scaling parameter s of the initial vortex spacing has a large influence on t0.
Normalized time, length, and velocity
From equation (13) and Table 2-4, we see that the reference velocity w0 and the normalized velocity v* of an experiment can be expressed by
00 2
0 0 4L
R
b C VsBwt t s Aπ
= = = (14)
and 2
0
* 4 R
L
AVv sw C
π= = (15)
In order to establish a relationship between time and distance, it’s finally assumed constant flight or wind speed such that t = x / V. This converts into equation for a normalized time t* as
30
** ** 4
L
R
Cx xt xVt sv s Aπ
= = = (16)
making use of definitions in Table 4 and eq. 15.
Equation 16 shows that the often used non-dimensional length x*= x / B only scales with the normalize age t* if CL / (s3AR) is constant. In other words, to determine the age of a vortex system, x* can be used non-ambiguously between different experiments (especially in different facilities with different models) only when v* is constant. For describing the age of aircraft wakes, it is therefore recommended to use t* instead of x*. The use of t* becomes a prerequisite when data from different aircraft (and aircraft models) at different flight stages (cruise, landing, take-off) with different flight characteristics shall be compared.
- 2-14-
2.2.4 Decay
In general, diffusion and decay depend on a number of parameters:
Ratio of vortex core to spacing, rC/b controls the evolution of short-wave instabilities but has no significant effect on decay.
Ambient stratification in terms of the vertical gradient of the virtual potential temperature or Brunt-Vaisala frequency 0/ /vN g v d dz= Θ Θ , normalized by t0: N* = N.t0 also accelerates the decay of
a downward trailing vortex pair.
Ambient shear in terms of the vertical gradient of horizontal crosswind (perpendicular to wake vortex axis) /cS du dz= , normalized by t0: S* = St0 may cause vortices to stall, rebound and separate and is therefore a crucial parameter for safety corridor considerations.
Ambient crosswind uc, normalized by w0: uc* = uc/w0; uc does not influence vortex decay but it transports
the vortices laterally and, thus, is of major importance for safety corridor definitions.
Aircraft induced turbulence qac* = qac / w0 This amount of turbulence constitutes the minimum
turbulence level always present in the wake behind the aircraft even if the atmosphere is absolutely calm.
Some hot-wire data from wind tunnel measurements and only a few samples for aircraft-induced
turbulence from flight measurements are available in order to allow guesses of the intensity of the aircraft
induced turbulence.
Ambient turbulence in terms of turbulence velocity 2 2 2' ' 'q u v w+ + (where the primes denote
velocity fluctuations around a properly derived mean value), normalized by w0: q* = q / w0, or in terms of
turbulence energy dissipation rate ε, normalized by w0 and b0:
ε* = (εb0) 1/3/ w0, has the strongest effect of a quick vortex decay. The latter scaling is especially
appropriate when the wake relevant scales of the ambient turbulent flow lie in the inertial sub range of
turbulence. In this case no additional information on the length scale of turbulence is required.
Maximum axial flow umax, normalized by maximum swirl: umax / vθmax. Here normalization by w0 is not
appropriate, since the neighboring vortex is probably of secondary importance for decay mechanisms
induced by axial flow.
Crow-linking factor is defined as: max min( )
max mint
b bb b
β−
=+
, where bmax and bmin are the maximum and
minimum lateral vortex separations. The vortex system is considered linked when the linking factor is
greater than 0.85 and coherent ring-like structures are present.
- 2-15-
Ground linking factor can be defined similarly to the Crow linking factor as follows: max min( )
max mint
z zz z
β−
=+
,
where zmax and zmin are the maximum and minimum altitude of one of the vortices. When the ground-
linking factor exceeds 0.85 the vortex can be considered linked with its ground image.
2.2.5 Ground effect
“A physics-based parametric model for the prediction of (operational) real-time response constitutes the essence of the problem.” (Sarpkaya, 2004)
The encounter of a vortex with a solid body is always a complex event involving turbulence enhancement, unsteadiness, and very large gradients of velocity and pressure. Wake encounter in ground effect (IGE) is the most dangerous of them all. Interaction of diverging, area-varying, and decaying aircraft wake vortices with the ground is very complex because both the vortices and the flow field generated by them are altered to accommodate the presence of the ground (where there is very little room to manoeuvre) and the background turbulent flow. The answer is somewhat arbitrary because the vortices “feel” the presence of the ground the moment they are created. However, assuming ideal vortices of equal strength and no wind/shear, one can calculate when a chosen quantity will differ more than (say) 1% due to the presence of the ground (conceptually similar to the definition of a boundary layer thickness). One may use the relative height at which u component or the v component of velocity, or the ratio u/v, or lateral spacing will change by 1% or more % relative to the NO IGE case. Such calculations show that:
Ideal (parallel) vortices do not come closer than a distance of bo/2 to the runway and they ‘feel’ the ground at about z ≈ 2 bo. This is rather approximate because the real vortices decay, have finite ro, their shape is not circular, they are affected by wind-shear, and ambient turbulence, etc.
We must note that any assessment of the ground effect is certain to be incomplete. There is too much that we do not know for us to give a definitive account of the subject but a great deal has also been learned in the past decade and many aspects of wake vortices and their interaction with each other and with the environment have been understood. Many of the unresolved problems are related to our inability to define and quantify the environment, to our lack of understanding of the physics of the phenomenon, and to our limitations to compute the behaviour of unsteady turbulent flows with sufficient accuracy. Most of our current understanding comes from field experiments, Large Eddy Simulations, a handful of laboratory experiments, and a few fundamental studies of the physics of the stability of vortices and vortex pairs.
2.2.6 Atmospheric influence on wake vortices
It is evident that the atmosphere has a strong impact on drift and decay of aircraft wake vortices. The key atmospheric parameters that influence vortex transport and lifetime are ambient wind, turbulence, wind shear and thermal stratification. The physics of wake vortex decay in the atmosphere is now better understood (Gerz 1996, Risso 1997, Han 1999, Holzapfel 2000 & 2001, Proctor 2000). Generally it is the interaction of the primary wake vortices with ambient atmospheric turbulence, thermal stratification, engine jets etc. which forms coherent secondary structures of azimuthal and vertical vorticity which wrap around the primary (axial) vortices and penetrate into the vortex oval (Holzapfel, 2003). The underlying
- 2-16-
mechanism is vortex stretching and tilting. Vertical streaks of counter-rotating vorticity are generated midway between the wake vortices that are effective in exchanging fluid in between the wake vortex pair. This exchange of fluids across the centre plane enables the rapid mutual compensation of wake vortex intensity.
Wind shear or wind-shear layers are candidates that may cause tilting of the vortex pair, accompanied by increased vortex separation and larger lifetimes of one of the vortices; furthermore, vortices may rebound or stall in the shear layers (Robins 1990, Proctor 1996, 1997, Hofbauer 2000). The vortex with the same rotation sense as the background shear layer penetrates through the layer and continues its descent while drifting with the wind. The vortex with a rotation opposite to the shear layer decelerates stalls and eventually may rebound. This motion is induced by the background shear layer which breaks and rolls up into a secondary vortex. Parametric investigations carried out by numerical simulation have demonstrated that vortex trajectories are very sensitive to vortex and shear layer parameters (Hofbauer, 2003). From an operational point of view neither predictions nor actual measurements can be accurate and representative enough to allow forecasting the trajectory of a vortex which interacts with background wind shear in a deterministic manner. Similar arguments hold for the impact of atmospheric turbulence on the wake vortex evolution. Since the dynamic and thermodynamic processes in the atmospheric boundary layer – turbulence, wind shear, thermally stable and unstable stratification – are highly stochastic by nature and random especially at temporal and spatial scales at which the trailing vortices evolve, also the prediction of wake vortices must be probabilistic.
Cross-wind carries the vortices away from the flight corridor. An analysis of observed wake vortices out of ground proximity from databases collected at Memphis Airport (Frech, 2004) revealed that a cross-wind of 2 m/s is sufficient to carry away all vortices out of the corridor of 30 m width in less than 70 seconds such that the next aircraft can safely follow in 2.5 nautical miles distance. Climatology surveys show that such cross-wind levels exist in many major airports around the world (Agnew 2002). Moreover, a downward trailing vortex pair tends to clear the glide path vertically (unless it hits the ground). On the other hand, if only wake demise is considered, the Memphis data also indicate that at best 88% (70%) of the vortices are decayed for a combination of medium-weight (heavy-weight) aircraft behind heavy-weight aircraft separated by 5 (4) nautical miles (Frech 2004, de Bruin 2003). This implies that even for aircraft which are separated according to the ICAO rules a fraction of the vortices still possesses significant intensity. However, the interaction of the atmospheric turbulence with the trailing vortex pair does not only provoke vortex decay but beforehand results in a quick loss of alignment and a reduction of coherence of the vortices as the atmospheric eddies locally deform part of the vortex tube by advection. Flight observations and results from computer simulations clearly show that turbulence in convective (thermally unstable) weather situations enforces a strong deformation and decay of the vortices throughout the boundary layer (Holzapfel 2000, Proctor 2000). In American and European flight tests one could further observe that the vortex tubes are twisted and turned already by weak atmospheric eddies at least at low altitudes (below about 300m).
Hence, even in the case of weak cross-wind, reduced vertical vortex descent, and long-living wake portions, the ICAO separations – and most of the time also the 2.5 NM separation applicable under VMC – are safe because a) the wake vortices loose coherence and become patchy, b) the probability to encounter those patches is already small, c) the probability that the fuselage hits the vortex core (to induce maximum roll moments) is even smaller; and finally d), the exposure time is very short compared to the

- 2-17-
time needed to cause significant roll due to the inertia of the aircraft. We can conclude that even when an aircraft encounters a vivacious section of a vortex on final approach; it will not automatically roll or pinch in a dangerous manner (Loucel, 2004). The wake turbulence incident and encounter statistics confirm that reasoning: No major incidents or accidents ever happened when pilots obey the ICAO separations rules. Moreover, an evaluation of several thousand flight data records conducted in S-WAKE (de Bruin 2003) showed that aircraft do encounter wake vortices during approach statistically a few times a day on a large airport (about 4 to 5 encounters out of 700 landings) but the crew do not recognize these harmless encounters as wake turbulence but as atmospheric turbulence.
To sum up, the mechanisms to account for in a wake vortex based future spacing systems are:
1. horizontal transport
2. downward vertical transport
3. vortex tube deformation (loss of vortex alignment)
4. wake vortex decay
In altitudes lower than about one wing span the vortices are also in contact with the surface which results in an additional (reduced) lateral drift of the vortex, a rebound away from the ground and an accelerated decay compared to low turbulence conditions. Hence, for vortices in ground proximity the mechanisms above are altered as 1) is reduced, 2) is not effective or reversed, 3) is increased and 4) remains unchanged or is increased.
2.3 Safety
2.3.1 Introduction to safety
During the past 50 years of commercial aviation, the aviation safety has increased dramatically with thanks to advance of technology and the maturity of operational procedures. Although the absolute number of fatal accidents and fatalities per year over the past 50 years do not appear to have changed significantly (Figure 2-3), the accident rate has declined remarkably (Figure 2-4), considering the increase of air traffic volume. In commercial aviation, the technological advances that led to this reduced rate have included the replacement of large, piston-engine aircraft with jet airplanes that have more reliable engines, the development of navigational equipment to warn pilots of potential collisions, better ground navigation aids, improved aircraft instruments and increased air traffic coverage.

- 2-18-
Figure 2-3 Aviation accidents and fatalities over 1945 – 2001 (Boeing 2002)
Figure 2-4 Aviation accident rates and fatalities 1959 – 2001 (Boeing 2002)
If the current fatal accident rate holds steady and aviation activity grows as expected, the increased air traffic will result in larger numbers of crashes and fatalities. According to the General Accounting Office (GAO, 2000), the average of 6 commercial accidents per year in 1994-1996 will likely rise to 9 per year by 2007. The prospect of more accidents and fatalities is unacceptable to the public, regulation authorities and the aviation industry.

- 2-19-
Safety is a general concept and it is usually studied from three different perspectives (Royal Society, 1992). The first perspective is personal perception of safety. People who participate in the air transport operations, such as pilots, air traffic controllers, passengers, etc. can perceive the safety of a specific flight, an operational procedure or any piece of the whole system. Their feeling about safety is the personal safety perception. Because of the subjectivity of safety perception, it is not appropriate to be used to measure the safety level of a system. The second perspective of safety is reliability or dependability, which is based on the reliability of physical equipment in a system. It looks at when technical systems fail but not necessarily when an accident results from the failure. The third perspective is accident risk, which considers all of the factors that may result in an accident. Risk management is widely used in finance (Wunnnicke, 1992), health management (Kipp, 1996), insurance (Vaughan 1992), chemical industry (Rodricks, 1982) and nuclear industry (Knief, 1991). The aviation industry is concerned most about aircraft collision with each other or any obstacles. ICAO requires that the probability of a catastrophic collision accident should not be higher than 2,88.10-9 per flight hour (IFALPA, 2005).
The scarcity of data on commercial safety makes it difficult to relate the macroscopic statistics of fatal accidents and fatalities are hard to any specific change of operational procedures or technological deployments. Meanwhile, the indispensable information for safety analysis, like the deviation of system performance, or human performance, is not historically obtainable. Therefore, numerical analysis and computational simulation methods are the most effective tools to evaluate safety performance of aviation systems. Researchers of aviation safety in the USA and Europe have made distinguished accomplishments over the last 40 years. Reich (1996) has developed a collision evaluation model to analyze the collision risk of aircraft over the North Atlantic region.
The process of estimation, based on a set of assumptions, is to piece together the transient risks to individual aircraft so as to give the expected number of collisions arising from all traffic during the period considered (Reich, 1966). Different with the Reich model that is based on aircraft specific theory, Hsu (1981) deployed the level crossing theory of Rice (1944) to approximate the collision risk between two aircraft by integrating the in-crossing rate over the time period when the two airplanes may be close to each other, assuming the physical shape of an airplane is a cuboid. The Reich model requires that the components of involved position process are differentiable with respect to time, and all components be independent. The Reich theory only applies when the scalar level crossing process is differentiable with respect to time and independent. Bakker and Blom (1993) relaxed the differentiability and stationarity of Reich theory and Rice theory, and developed a more general Reich model for collision risk evaluation. The new model takes into account possible collision both between aircraft in a same network arc and between aircraft in different arcs. The general Reich model is integrated into TOPAZ (Traffic Organizer and Perturbation AnalyZer) research tool set, developed at the National Aerospace Laboratory NLR (Blom, 2003).
Another safety issue related to the reduction of aircraft separation in terminal area is the risk of wake vortex encounter. According to Gerz, wake vortex encounters occur in daily operations, e.g. around 80 encounters per year on average at London Heathrow airport (including only British Airways aircraft). However the data of aircraft spacing in terminal airspace are not officially recorded or available to the public both in Europe and the United States. Haynie (2002) took the effort to collect aircraft landing data at Hartsfield airport in Atlanta (ATL), La Guardia in New York City (LGA), Ronald Reagan National Airport in Washington DC (DCA) and Baltimore airport (BWI). In his PhD dissertation he provides
- 2-20-
evidence that safety, demand and capacity are inextricably linked. All reported wake vortex accidents have happened under VFR (Gerz, 2002).
2.3.2 Safety assessment and analysis
The use of integrated wake vortex safety and capacity systems in ATC, i.e. predicting safe optimum aircraft spacing for a certain time horizon and monitoring wakes and weather for alert in case of unforeseen events or system failure, must contribute to and guarantee the all-over safety. All subsystems need to be thoroughly assessed in terms of functionality, stability, reliability and area of applicability of all its components. Furthermore a safety analysis has to estimate safety levels related to wake vortex encounters. In particular, safety estimates are required of current wake vortex separation standards, as well as estimates based on new wake avoidance technologies and new separation standards.
Tools for safety assessment and analysis have been developed in the S-Wake project (de Bruin, 2003) for wake vortex induced risk related to single runway approaches under reduced and standard (ICAO) aircraft separations. NLR has developed the probabilistic wake vortex induced risk assessment (WAVIR) tool (Speijker, 2003). The methodology is based on a stochastic framework that incorporates sub-models for wake vortex evolution, wake encounter and flight path evolution. It relates severity of encounters to possible risk events. Appropriate separation distances for different operational and weather conditions were derived, using a method with proposed risk requirements derived from historical wake encounter incident data. It was confirmed that the largest runway capacity improvements might be achieved through exploiting favourable wind conditions. In particular cross-wind and strong head-wind conditions appear favourable and might allow reduced separation minima. The evaluated wake vortex risk mitigation measures further show that the risk related to single runway approaches is reduced most effectively in the area close to the runway threshold. Therefore, weather based prediction monitoring and warning systems should focus on keeping the safety level high near the runway threshold.
2.4 Capacity
2.4.1 Introduction
Airports hold a key role in the commercial aviation system by allowing airlines and their customers to converge. However, they now face the challenge of meeting the growing demand for air transport. In fact, a lack of airport capacity has been forecasted by the Federal Aviation Administration (FAA) to be one of the most serious constraints to the growth of commercial and private aviation (Wells, 2000). One main reason for this lack of capacity is that airport development projects are enormously capital-intensive and probably some of the largest infrastructure development projects that are undertaken. Hence, it is a challenging task for airports to keep pace with the rapidly growing demand for air transport (Dempsey, 2000). European commission is also emphasizing the need of new operational concepts and systems that permit aircraft to operate in all weather conditions, to fly closer together at lower risk - while limiting as far as possible the construction of new airports and runways (RGP, 2001). One of the possible ways how to increase the runway throughput would be the reduction of wake vortex separations between two aircraft during the approach and departure.

- 2-21-
An airport’s capacity may be broadly defined as its ability to handle a given volume of traffic (demand). Congestion occurs when demand exceeds capacity. The Airports Council International (ACI) and International Air Transport Association (IATA) guidelines for airport capacity/demand management define the most significant aspect of an airport’s capacity, Runway System Capacity, as the hourly rate of aircraft operations which may be reasonably expected to be accommodated by a single or a combination of runways under given local conditions. The Runway System Capacity is primarily dependent on the runway occupancy times and separation standards applied to successive aircraft in the traffic mix. Other key items affecting runway capacity include: availability of exit taxiways, especially that of high speed exits that help minimize runway occupancy times of arriving aircraft; aircraft type/performance; traffic mix; Air Traffic Control (ATC) and wake vortex constraints on approach separation; weather conditions [Visual Meteorological Conditions (VMC) / Instrument Meteorological Conditions (IMC)]; spacing between parallel runways; intersecting point of intersecting runways; mode of operation, i.e., segregated or mixed.
To better explain the capacity measures introduced here, we can begin with the concept of “Practical Capacity.” This is defined as the number of operations that can be accommodated in a given time period, considering all constraints incumbent to the airport, and with no more than a given amount of delay (Wells, 2000). On a typical delay curve, this may be depicted as in Figure 2-5 (Raguraman, 1999). Maximum throughput capacity or Saturation capacity may be measured as the number of operations that can be accomplished in a given period of time disregarding any delay that aircraft might experience and assuming that the aircraft will always be present, waiting to land or take-off (Ashford, 1992). This may be depicted as in Figure 2-6.
Figure 2-5 Practical capacity λp
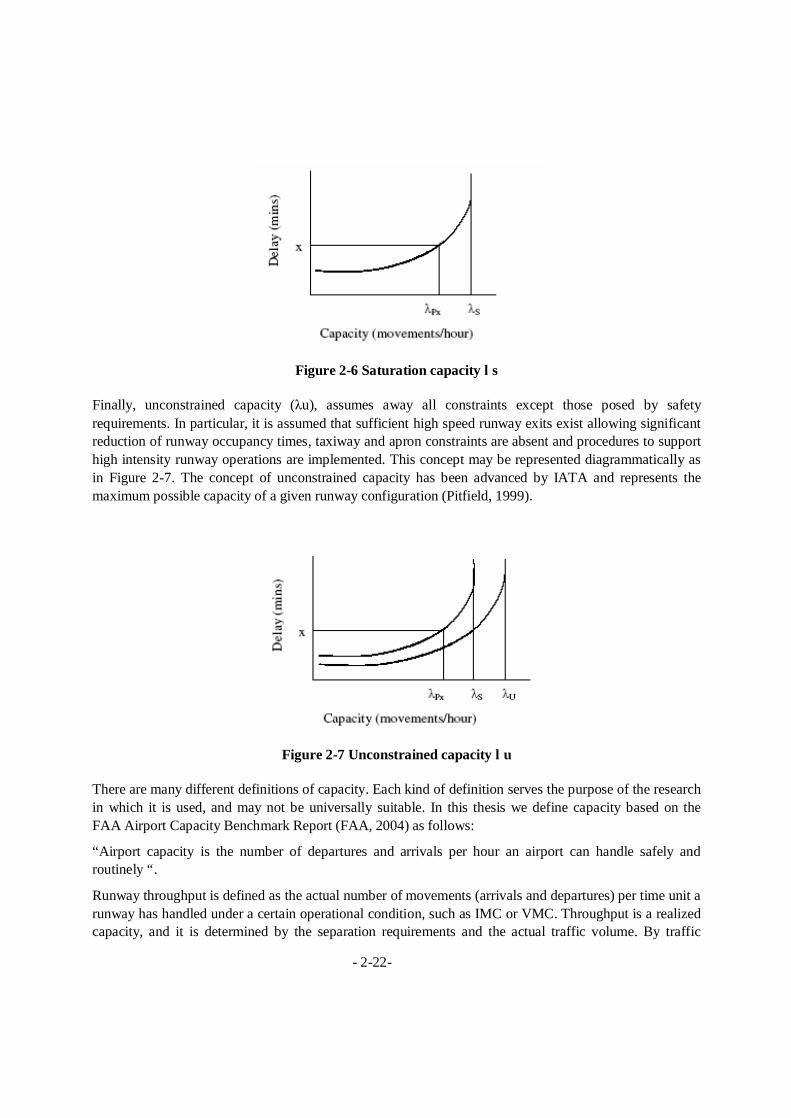
- 2-22-
Figure 2-6 Saturation capacity λs
Finally, unconstrained capacity (λu), assumes away all constraints except those posed by safety requirements. In particular, it is assumed that sufficient high speed runway exits exist allowing significant reduction of runway occupancy times, taxiway and apron constraints are absent and procedures to support high intensity runway operations are implemented. This concept may be represented diagrammatically as in Figure 2-7. The concept of unconstrained capacity has been advanced by IATA and represents the maximum possible capacity of a given runway configuration (Pitfield, 1999).
Figure 2-7 Unconstrained capacity λu
There are many different definitions of capacity. Each kind of definition serves the purpose of the research in which it is used, and may not be universally suitable. In this thesis we define capacity based on the FAA Airport Capacity Benchmark Report (FAA, 2004) as follows:
“Airport capacity is the number of departures and arrivals per hour an airport can handle safely and routinely “.
Runway throughput is defined as the actual number of movements (arrivals and departures) per time unit a runway has handled under a certain operational condition, such as IMC or VMC. Throughput is a realized capacity, and it is determined by the separation requirements and the actual traffic volume. By traffic

- 2-23-
volume, we mean the average departure / arrival rate of outbound / inbound flights from / to the airport terminal airspace. When traffic density is low, the throughput can be much inferior than assigned capacity; while traffic is heavy, throughput may be very close to or even more than the capacity because actual aircraft separation may be less than the required separation.
2.4.2 Understanding capacity and delays at European airports
At an airport, the runways mostly act as “single servers” processing one aircraft at a time. A degree of departure and arrival queuing is the inevitable consequence of airports being used close to their capacities – even with ATC optimising sequencing and spacings – albeit that the two queues can be a traded-off (arrivals for departures and vice versa) at single runway airports or at mixed-mode multiple runway airports. There is a clear trade-off between airport utilisation levels (i.e. setting of hourly schedule rates v. capacity) and arrival / departure queuing. For example, given the commercial pressure for slots, Heathrow is scheduled at around 98% utilisation (peak scheduling 87 movements / hour) during busy hours against a 10 min average delay and 20 min peak (95%) delay criteria. In contrast, Frankfurt mostly operates at <90% utilisation and avoids stacking by having spare arrival capacity (in good weather) and through close-in path stretching (Hunter and Simonsson, 2005).
Average queuing times and the effects of weather conditions on queuing (e.g. wet runways, strong winds, low visibility, etc.) are well understood. But there remains a tendency to think of the variability of queue time / lengths as a shortcoming of the ATM process, when – for the most part – it is simply a basic property of queuing to use heavily utilised runways.
European airport capacities range from 25 to 110 per hour depending on number of runways and layout, and on traffic mix (e.g. the proportion of “Heavies”) and the level of delay accepted by the airport user community. In the UK, examples of single runway operation scheduling rates1 are Gatwick (50/hr) and Stansted (50/hr); dual runway operation scheduling rates are Manchester (61/hr with closely spaced parallel runways) and Heathrow (87/hr with segregated operations2).
The recent growth in airport capacities is best illustrated by the evolution of hourly and daily summer scheduling rates at the major airports where demand approaches or exceeds capacity – and therefore capacity is under pressure. Current hourly movement rates at Heathrow (parallel runways) and Gatwick (single runway) exceed those achieved for twin and single runway airports elsewhere in Europe, having been reached through continuous refinement of operational procedures. At Heathrow, the compensating “firebreak” periods – to enable delays to dissipate – have been gradually eroded such that maximum throughput now applies for most of the day. The increased throughput at Manchester reflects two-runway operations since 2001; Stansted’s throughput reflects demand generated by low-cost airlines.
1 While “capacity” is the theoretical limit of runway, a management decision is taken to set a “scheduling rate”
below the actual theoretical limit that recognizes a number of factors such as the runway’s supporting infrastructure
and agreements on service levels and congestion delay. The ratio of scheduling rate to runway capacity = runway
utilisation (expressed as a percentage) 2 One runway being used for arrivals, the other for departures

- 2-24-
The very high airport schedule rates at Heathrow (LHR) and Gatwick (due to pressure of demand in the absence of additional runways) leads to the regular use of stacks and holding delays. Airborne holding at Heathrow is compounded by its segregated operations which provide little flexibility to balance arrival and departure queues. This is the commercial trade-off between utilisation levels (i.e. the setting of scheduled rates and thus availability of airport slots) and the amount of queuing that results.
In comparison, other major European airports Frankfurt (FRA) and Paris Charles de Gaulle (CDG) tend to operate at lower schedule rates vis-à-vis their capacities and – with multiple runways and/or mixed mode operations that allow arrivals to be prioritised at the expense of departures (delays) where necessary – avoid the need for regular airborne holding. In addition, they use arrival management tools (Compass at FRA, Maestro at CDG) to assist streaming and sequencing, and make much greater use of ATFM flow regulations for airport reasons than is the case in the UK.
In extreme weather conditions (e.g. thunderstorms, heavy snow), flying is necessarily suspended for safety reasons and major delays and cancellations result. More regularly airport capacities are reduced in strong winds or low visibility conditions because:
Ø Aircraft may need to occupy the runway for longer periods than normal
Ø Pilots’ ability to navigate and maintain separation on the ground is diminished due to loss of visibility
Ø ATC capacity is reduced due to a loss of visibility from the tower
Ø Increased spacing between aircraft during low visibility procedures (LVPs) are needed to maintain the signal integrity of the instrument landing system (ILS)
All of this leads to the need for greater aircraft spacings to assure safety, which in turn results in the imposition of airport ATFM restrictions and hence delays. The figure below illustrate the approximate frequency and scale of these effects at Heathrow, the consequence being a knock-on effect for delays throughout much of the day as traffic recovers (Hunter and Simonsson, 2005).
Figure 2-8 Effect of adverse weather on Heathrow’s capacity
2.4.3 Airport capacity estimation models
A distinction between analytical and simulation models may be made based on the methodology used to compute capacity, delay or other such metrics. Analytical models are primarily mathematical representations of airport and airspace characteristics and operations and seek to provide estimates of

- 2-25-
capacity by manipulation of the representation formulated. These models tend to have a low level of detail and are mainly used for policy analysis, strategy development and cost-benefit evaluation (Odoni, 1997)
Simulation of the airport environment has been increasingly used recently to obtain more realistic estimates of capacity by randomizing the various input parameters. In fact, meteoric improvements in computer technology, especially in the areas of computer graphics; human computer interaction; computer networks; and the World Wide Web, have had a significant impact on modelling and simulation (Nannce, 2002). Fishburn and Stouppe (1997) have suggested that simulation modelling and analysis be integrated into the airport planning process rather than being simply used for final evaluations.
Microscopic models can be either node-link or 3-dimensional (3-D). Node-link models such as SIMMOD and the Airport Machine separate the airport and airspace into a number of nodes and links over which aircraft move. Conflict occurs when more than one aircraft try to pass one node. 3-D models such as TAAM and HERMES (Heuristic Runway Movement Event Simulation), allow flight over random 3-dimensional routes (Odoni, 1997). A detailed compilation of all existing and required modelling capabilities for ATM systems and concepts is provided by Odoni et al. (1997). This study also presents an exhaustive list of airport capacity estimation models together with extensive insights into and comparisons between these.
To summarize, a variety of techniques may be used to evaluate runway capacity. These may range from basic analytical models, through more sophisticated Monte-Carlo and other random number probabilistic models, to complex computer-intensive discrete event models requiring extensive input data. The compromise in the choice of a technique lies between the higher reliability of the results of the higher-order model versus the increased effort and cost (Mumayiz, 1997).
2.4.4 TAAM Review
Since we have chosen to use TAAM version 2.3 (Total Airspace & Airport Modeler) in our study, we provide more details of the model in this chapter. Developed by The Preston Group (now Preston Aviation Solutions) in cooperation with the Australian Civil Aviation Authority, TAAM is a large scale detailed fast-time simulation package for modelling entire air traffic systems. The model is a four dimensional flight path simulator and allows greater realism than mesh based simulations such as SIMMOD (Odoni, 1997). A number of factors may be randomized in the simulation to reflect day-to-day fluctuations. A versatile simulation model, TAAM has been used in a wide variety of applications including airport capacity estimation (gate, taxiway, runway capacity), planning airport improvements, extensions, de-icing, noise impact, effect of severe weather, design of terminal area procedures (SIDs / STARs) and terminal area Air Traffic Control (ATC) sectors, controller workload assessment, impact of new ATC rules, system wide delays and cost/benefit studies. Being a large scale simulation of an air traffic system, TAAM requires comprehensive input data files describing the entire Air Traffic system. The level of detail, however, is variable and can be adapted to suit individual project needs. Typical inputs include the airport layout, air traffic schedule, environment description, aircraft flight plans and air traffic control rules. These are used to investigate the usage of the airport and airspace, conflict detection and resolution, and to compute aggregate metrics using TAAM’s internal algorithms and user specified rules (Odoni, 1997). These aggregated metrics include system delay and its distribution; costs: fuel, non-fuel, and total; airport movements; operations on taxiways and runways; runway occupancy and airspace
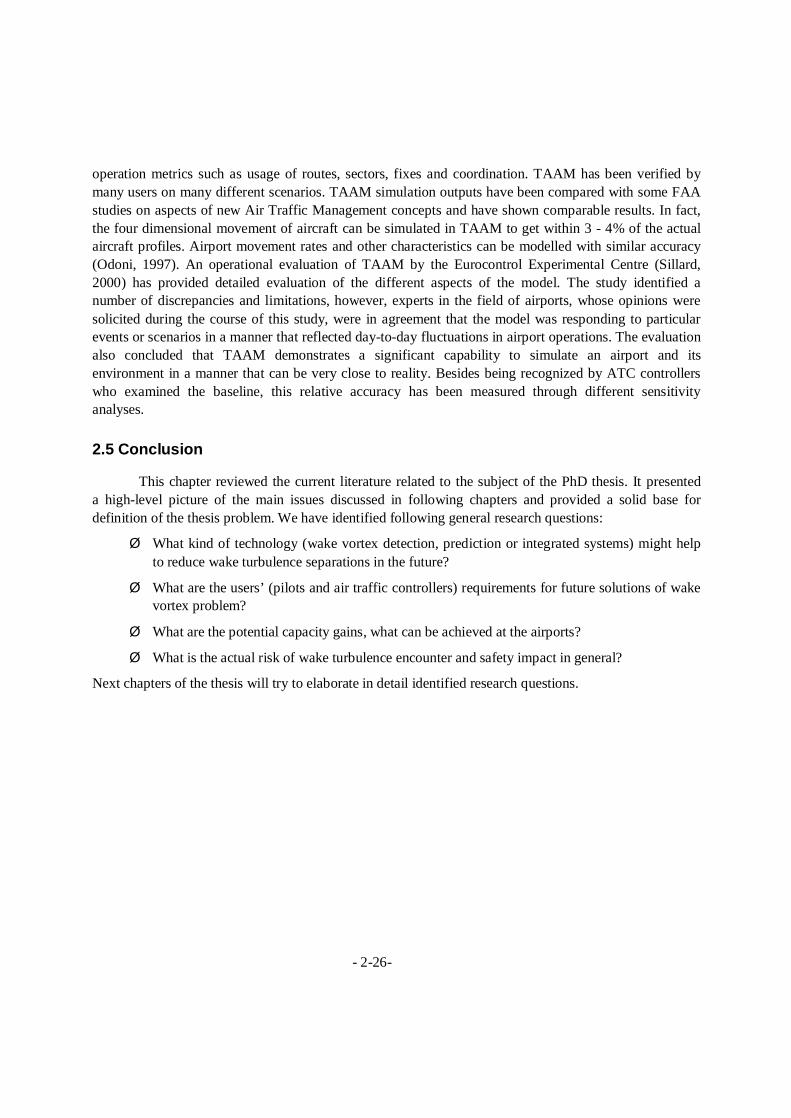
- 2-26-
operation metrics such as usage of routes, sectors, fixes and coordination. TAAM has been verified by many users on many different scenarios. TAAM simulation outputs have been compared with some FAA studies on aspects of new Air Traffic Management concepts and have shown comparable results. In fact, the four dimensional movement of aircraft can be simulated in TAAM to get within 3 - 4% of the actual aircraft profiles. Airport movement rates and other characteristics can be modelled with similar accuracy (Odoni, 1997). An operational evaluation of TAAM by the Eurocontrol Experimental Centre (Sillard, 2000) has provided detailed evaluation of the different aspects of the model. The study identified a number of discrepancies and limitations, however, experts in the field of airports, whose opinions were solicited during the course of this study, were in agreement that the model was responding to particular events or scenarios in a manner that reflected day-to-day fluctuations in airport operations. The evaluation also concluded that TAAM demonstrates a significant capability to simulate an airport and its environment in a manner that can be very close to reality. Besides being recognized by ATC controllers who examined the baseline, this relative accuracy has been measured through different sensitivity analyses.
2.5 Conclusion
This chapter reviewed the current literature related to the subject of the PhD thesis. It presented a high-level picture of the main issues discussed in following chapters and provided a solid base for definition of the thesis problem. We have identified following general research questions:
Ø What kind of technology (wake vortex detection, prediction or integrated systems) might help to reduce wake turbulence separations in the future?
Ø What are the users’ (pilots and air traffic controllers) requirements for future solutions of wake vortex problem?
Ø What are the potential capacity gains, what can be achieved at the airports?
Ø What is the actual risk of wake turbulence encounter and safety impact in general?
Next chapters of the thesis will try to elaborate in detail identified research questions.

3-1
Chapter 3
Objectives and methodology
3.1 Introduction
Chapter 2 identified several research questions. Chapter 3 describes the objectives of the thesis and the methodology used to provide data to investigate identified research questions. An introduction to the methodology was provided in section 1.4 of Chapter 1. This chapter aims to build on that introduction and to provide assurance that appropriate procedures were followed. The chapter is organized around three major topics:
Ø Objectives of the thesis
Ø Methodology and justification
Ø Research process
3.2 Objectives of the thesis
The central research theme of this thesis is: “A comprehensive study of the wake vortex phenomena to the assessment of its incorporation to ATM for safety and capacity improvements.” A general unknown in this thesis is the understanding of wake vortex in ATM from safety and capacity point of view. Based on the identified general research questions in Chapter 2, we defined objectives of the thesis as follows:
Ø Description of basic phenomena’s behaviour like genesis, process until decay and meteorological influence
Ø Elaboration of some fundamental techniques and classifying many existing systems and approaches by several criteria (detection and prediction systems, weather forecast and nowcast tools, wake vortex warning systems)
Ø Assessment of limitations and advances in physics that might influence either the technology or operation
Ø Definition of users requirements based on analysis of questionnaire’s data (questionnaire to “users”: pilots and controllers)
Ø Assessment of operational requests that may require further investigation on physics or technology
Ø Elaboration of some existing operational procedures and proposing new operational requirements, concepts and procedures according to today’s knowledge of wake turbulence and taking into account modern technology
Ø Assessment of expected benefits in terms of capacity, safety and efficiency
Ø Overview of safety assessment techniques incl. risk assessment of wake vortex encounter

- 3-2-
Defined objectives are aligned with dissertation minimum (Choroba, 2002), which was defended and published in November 2002 at University of Zilina (Slovak Republic) as a PhD proposal.
High-level contribution we would like to achieve is the knowledge of the wake vortex in ATM by exploring the interrelationships of physics – technology – operation in relation to safety and capacity of ATM. This goal will be achieved in following steps:
Ø Comprehensive study of technology and operational procedures
Ø Operational survey – users’ requirements
Ø Capacity estimation of new dynamic separation concept
Ø Safety analysis
3.3 Methodology and justification
In elaboration of research objectives we use following research methods:
Ø Synthesis and analysis – critical review of physics, state-of-the-art technology, operational procedures
Ø Survey research and interview – a questionnaire design, data collection and data analysis
Ø Case study - capacity assessment by fast-time simulation, modelling of several scenarios including our proposal for new dynamic separation concept
Ø Mathematical modelling and simulation - safety assessment – hybrid analytical model (numerical probabilistic method and Monte Carlo simulation)
Research material in the first part of the thesis (Phase I) is synthesized and carefully analyzed. We use classification techniques and organize the technologies into several groups.
Quantitative statistical survey could not be performed, due to inability to obtain a sufficient number of responses, which would statistically enable to represent the entire community of users (controllers and pilots). Therefore, we chose qualitative survey research (with carefully chosen small samples) and interview for validation of questionnaire design. Questionnaires are published on the web in the form of HTML and responses are automatically saved in the survey database. Basic descriptive statistical methods are applied in data analysis.
Our new proposed dynamic separation concept will be evaluated in a case study with three major European airports. We decided to use a sophisticated fast-time simulator Total Airspace Airport Modeller (TAAM), which features more advanced functions than competitive tools like SIMMOD or RAMS Plus.
In safety analysis part of the thesis, we introduce a hybrid analytical model to evaluate a conservative probability of a vortex encounter based on the P2P model. It uses a numerical probabilistic method to calculate the risk while Monte Carlo simulations are conducted to obtain probability distributions of aircraft positions and vortex characteristics. Numerical methods have the advantage of computational efficiency over pure simulations in evaluating the probability of a rare event, such as a serious wake
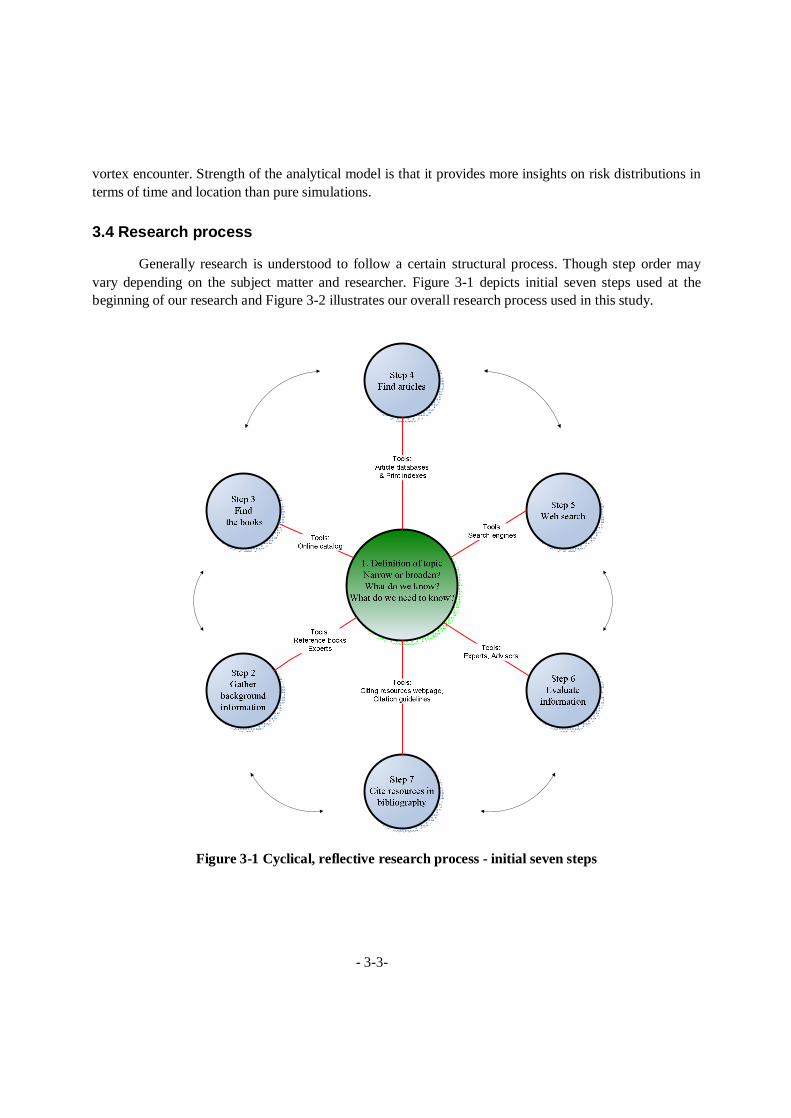
- 3-3-
vortex encounter. Strength of the analytical model is that it provides more insights on risk distributions in terms of time and location than pure simulations.
3.4 Research process
Generally research is understood to follow a certain structural process. Though step order may vary depending on the subject matter and researcher. Figure 3-1 depicts initial seven steps used at the beginning of our research and Figure 3-2 illustrates our overall research process used in this study.
Figure 3-1 Cyclical, reflective research process - initial seven steps

- 3-4-
Formation of the topic
Literature survey
State-of-the-art technology, physics,
ops procedures
Capacity estimation –fast-time simulation
Operational survey -users’ requirements
Safety analysis –probabilistic risk
assessment
Research objectives -Hypothesis
Theoretical and practical
contributions
Conclusion and future work
Figure 3-2 Overall research process used in our PhD research
4-1
Chapter 4
Research process – Results
4.1 Introduction
This chapter presents detailed parts of the research process (as described in chapter 3) including results. It is divided to four sub-chapters:
Ø Comprehensive study of technology and operational procedures (Section 4.2)
Ø Operational survey (Section 4.3)
Ø Capacity estimation (Section 4.4)
Ø Safety analysis (Section 4.5)
4.2 Phase I – Comprehensive study of technology and operational procedures
4.2.1 Introduction
Wake vortices, as described in Chapter 2, can be detected and predicted by several types of systems. Future solutions of wake vortex problem, currently limiting airport capacities, depend on the state-of-the-art technology. This section provides a critical analysis of current technologies classified into the following domains:
Ø Wake vortex detection technology
Ø Wake vortex prediction models
Ø Weather forecast
Ø Weather monitoring
Ø Operational procedures and systems
4.2.2 Technology
4.2.2.1 Wake vortex detection
Many different types of sensors have been used for detecting wakes, some of which are listed here. Of this list, the most currently useful and often-used sensors are the windline, the CW LIDAR, and the Pulsed LIDAR. The detection and monitoring of WV means that the following parameters must be obtained:
Ø The position of each vortex
Ø The circulation (strength) of each vortex

- 4-2-
4.2.2.1.1 Windline
The windline is a set of poles with wind sensors placed in a line at 90 degrees to the flight path. When the wake sinks near to the poles, the increased wind from the wake is sensed by the windline. The windline can only be used for low-altitude measurements because it relies on the wake to be near the poles, and because the height of the poles is restricted due to obstruction concerns. The windline is an excellent sensor for reporting the lateral position of the wake with respect to the flight path. It is fairly inexpensive, can be used in all weather conditions, and extensive windline measurements of wakes are available (over 50,000 aircraft). One weakness of the windline is that it cannot definitively say that a wake is not present since the wake may bounce or be above the height the windline can sense. Another weakness is that it cannot report the circulation strength of the wake. However, for certain applications such as parallel runway procedures, the extensive database of measurements is very valuable. The windline lateral position estimates can be used to estimate the performance of other sensors. When complemented with a SODAR, the windline may prove to be an excellent sensor for many applications. However, additional development to enable the use of SODARs for operational use should be expected.
4.2.2.1.2 LIDAR
LIDAR (LIght Detection And Ranging) – is similar to the more familiar radar and can be thought of as laser radar. In radar radio waves are transmitted into the atmosphere, which scatters some of the power back to radar’s receiver. LIDAR transmits and received electromagnetic radiation but at a higher frequency (ultraviolet, visible and violent region). Different types of physical processes in the atmosphere are related to different types of light ring. Choosing different types of scattering processes allows atmospheric composition, temperature and wind to be measured. LIDAR in general consists of 3 main parts: transmitter, receiver and detector system.
Figure 4-1 General architecture of Lidar
LIDARs use extremely sensitive detectors so called photo multiplier tubes. An individual quantum of light is converted first into electric currents and then into digital photo counts, which can be stored and processed on a computer. The received photo counts are recorded for fixed time intervals during the return pulse. The times are converted to heights called range bins since the speed of light is well known. The range-gated photo counts are then stored and analyzed by a computer. LIDAR measurements can

- 4-3-
contribute to a better understanding of the hazard presented to other landing aircraft in two ways. First it allows a detailed picture to be built of the vortex in terms of its strength, persistence and trajectory. This data can then be used to aid the further development of theoretical models. Secondly by gathering bulk information on the persistence of vortices and correlating this to aircraft type and meteorological conditions a database can be compiled that can be used to predict the vortex hazard on subsequent occasions. Lidar measures wind velocities by scattering coherent laser radiation from dust particles, aerosols, present in the atmosphere and detecting the shift in frequency of the scattered light. This Doppler shift is proportional to the line of sight component of velocity for the aerosols illuminated by the beam. For the application of lidar to wake vortex characterization the probe beam needs to be passed through the rotational flow of the wake vortex. Subsequent analysis of the Doppler shifts enables the creation of a detailed description of the air motion along the beam that is a high resolution mapping of the vortex flow.
The general technique is that the lidar beam is aimed at the vortex and the beam brought to a focus as it passes through the rotational flow. The diameter of the laser beam in the focal range is about 10 mm so in order to build a picture of the complete vortex the probe beam is either scanned or held stationary while the vortex descends or drifts through the beam. The returned signal is strongest at the chosen focal range and falls off gradually on either side of the focal region. The sensitive region along the beam is conventionally defined as the section where the signal strength is within 3 dB of the peak. For the QinetiQ wake vortex lidar the length of this region is given by 6*(F/100)2m-1, where F is the focal range. For actual application the depth of the probe beam extends over several meters and there is a returned signal from scattering along the length of the probe region. Hence the bulk of this scattering will be away from the region of peak rotational velocity and so most of back-scattered signals power resides at lower Doppler frequencies. As the depth of field is proportional to the square of the focal range, measurements made at greater altitude will probe a larger volume of space and as a consequence produce measurements with more of the signal at the lower end of the Doppler frequency range in comparison to those made at low altitude.
LIDARs for wake vortex sensing use eye-safe invisible laser beams that scan across a portion of the flight path and can sense the wind pattern in a wake. LIDAR technology has rapidly advanced in the last decade. Already current generation wake vortex LIDARs are considerably more capable than sensors made only 5 years ago. It is expected that within the next few years LIDARs will be robust enough for operational applications.
CW LIDARs can only make short-range measurements (to about 1000 ft range), but can get very detailed pictures of wakes. A CW LIDAR was used extensively in AVOSS to provide field measurements to wake modellers. That CW LIDAR can automatically detect and track wakes, though improvements are needed in the detection algorithm. One role for the CW LIDAR is in performance evaluation of other wake sensors or low-altitude measurements, such as for intersecting runway procedures.
By comparison, the Pulsed LIDAR can make long range measurements of wakes (to at least 1 mile), but the spatial and velocity resolution is much less than that of CW LIDARs. The performance of the last generation system used in AVOSS was marginal. The performance of the current generation commercial system with respect to its position and circulation estimates, the minimum detectable circulation, the measurement range and the automatic detection accuracy has not been assessed; but recent improvements in laser technology have clearly improved the scanning rate of the sensor. The longer-range capability

- 4-4-
makes a pulsed LIDAR a candidate for use in takeoff measurements as well as arrival applications. Modified LIDAR concepts such as the dual pulsed LIDAR are being considered for WV applications. If proved feasible, they may provide higher resolution in circulation and position. LIDAR can be used not only for vortex detection, but also for accurate wind measurements, wind shear detection, and turbulence detection (from buildings).
The most mature technique is based on 2µm Thulium–Holmium-YAG lasers, designed, built and sold by CTI (Coherent Technology Inc, Colorado, US). This 20years old company is leader in coherent wind LIDARs both for ground and airborne applications. The Wind Tracer system is now operating in different airports and commercially in the Hong Kong Airport. A new LIDAR technique is based on 1.5µm Erbium fibre lasers and is currently developed in Europe in different laboratories (QinetiQ, ONERA, DLR...). Much cheaper than the 2µm LIDARs, this technique benefits of the large technological effort in telecom components. Lasers are less powerful than 2µm ones but are well suited for short and middle range applications. An effort is conducted to reach comparative powers, with the support of EEC (Fidelio Strep project, 6th FTP).
Figure 4-2 indicates how the lidar range depends on the visibility. Maximum range is achieved in haze. The different black lines are separated by a factor 5 in pulse energy. Visibility dependence is less sensitive for short range operation. So, if the lidar is designed with clear atmosphere parameters (i.e. visibility =10km or extinction κ = 0.1km-1), it will perform better in lower visibility, since the visibility is better than 200 m. If the visibility is less than 100m, the maximum range shouldn’t exceed 150 m, whatever the pulse energy is.
Figure 4-2 Maximum LIDAR range vs. visibility
- 4-5-
As for WV detection, coherent LIDARs are able to monitor wind speed and direction as long as they have 3D scanning capabilities. They can reach very high spatial accuracy up to a few meters in the low layers through slant path measurement or vertical scanning. They may be used to both monitor wind and wake vortex. However, up to now, these systems are still quite expensive (CTI version) from 500 000 Euros up to 1M Euros, with no maintenance or training included. Next version of long range coherent LIDARs will certainly benefit of new laser technologies and be substantially cheaper (FIDELIO project).
4.2.2.1.3 SODAR
Beginning in the early 1970s some companies started the development of commercial acoustic remote sensing systems. SODAR (Sound Detection and Ranging) is built on the same principle as RADAR but using acoustic waves instead of RADAR wavelengths (S, C or X Band for example). It has been used for years for boundary layer wind measurements on several airports and nearby industrial plants. It measures wind velocity profiles based on Doppler shifts in the speed of sound. Typical SODAR systems use three offset transmitter / receiver units to get the direction of the wind and the horizontal wind speed. SODAR provides quiet accurate data in height. Longer range SODAR as those built by METEK or REMTEK can reach altitudes up to 1500m (advertised by manufacturer), with a low time resolution (10minutes) and good vertical resolution (30m). Mini SODARs have been also built and allow a better resolution in the low layers (1minute time resolution and 10m of vertical resolution). However as pointed by Zack (Zack et al, 2003) for SODAR an altitude achievable 70 percent of the time is on the order of a half to one third of the maximum listed. New developments that have been recently conducted raise the capabilities of these sensors. Nevertheless, it seems to stay a poor candidate for upper areas - ILS, glide slope and climbing.
SODAR can be associated with a RASS sensor (Radio Acoustic Sounder) to retrieve temperature profile data. SODAR is very limited in noisy environment (65dB for mini SODAR) as airports and in some atmospheric conditions as during strong thermal inversions, heavy precipitation and cold dry atmosphere. Hence, winds exceeding 10m/s may also move the signal out of the cone of the receiver. Eventually, this system must be deeply evaluated to be sure of its real capacities in such conditions.
There are different SODAR applications, like:
Ø Aircraft wake vortex monitoring
Ø Wind and turbulence profiles
Ø Wind shear warning
Ø Wind energy sitting and characterization
Ø Pollution transport and diffusion characterization
Ø Emergency response (e.g. fire fighting) wind monitoring
Ø Thermal plume characterization
Ø Mixing height, strength and time evolution
- 4-6-
4.2.2.1.4 S or X-band radar
A small and low cost (<100 -120k euros) S-Band RADAR is in development at CETP (Vélizy, France). This system has been first designed for retrieval of wind above the urban canopy. Its height accuracy is much higher than COTS RADAR, which is 10 to 20m on the vertical. This system could be steerable. The radial wind speed can be retrieved in 2sec. The horizontal wind and direction is found in 1minute with an accuracy of 0.5m/s. This system configuration enables to measure between 20m and 500m. First test campaign started in January 2005. The long-range configuration will be available in 2006, depending on the emission source availability.
This sensor may be used for Wake vortex detection. But it requires more development on the hardware and on specific software.
4.2.2.1.5 Tep radar
A TEPwind profiler (Turbulent Eddies wind profiler) has been designed and built by the Microwave Remote Sensing Laboratory (MIRS) of the University of Massachusetts. This system is atmospheric remote sensing RADAR that focuses on small scales atmospheric phenomenon about 10m scale. A digital beam forming technique can be applied to improve the resolution. Then EDR could be retrieved from this instrument. Also information on the wake vortices may be found depending on the range. Actual range is 300 to 1800m.
4.2.2.1.6 Phased-array acoustic imaging
WV leaves an acoustic trail. A recent field trial at Denver International Airport has demonstrated a technology for mapping wake vortices using a large number of microphones, high performance data acquisition hardware and beam forming software, called an aero acoustic phased array. This system is not easy to deploy as it needs many precisely positioned microphones to draw an unambiguous map of the sound source. The array deployed at Denver international Airport was built with 252 Panasonic electrets microphones.
4.2.2.1.7 Conclusion
Up to now, LIDAR appeared to be the only reliable technology for wake vortex detection. It has been validated during several short and long term field campaigns as in WAKETOUL (Tarbes), WAKEOP (Oberpfaffenhofen) or St Louis Airport. The analysis of COTS (commercial of the shelf) and mature research sensors shows that new capabilities will soon be available, especially for low layers monitoring. Resolution of RADARs and SODARs will be enhanced. Also new processing techniques have been developed for both wind data retrieving and for noise filtering. New high resolution LIDARs, RADARs and SODARs may be available in 2 to 5 years enabling to monitor for wind and turbulence in the critical areas. Also, LIDARs developers have made efforts to enhance the range of their systems. New laser components have also arisen since the 90’s. Those efforts enable to consequently decrease the price of LIDAR systems. Against other technologies, long ranges LIDARs are the only tools that may control landing areas of parallel runways. Also one must check whether these systems may monitor wake vortices in the ILS interception area.
- 4-7-
Each sensor in the list will require additional development if they are to be included as a real time component of any operational procedure. However, many of the procedural enhancements do not require a wake sensor for operation of the procedure, but will need data sets to prove the procedural risk. In these cases, some of the sensors may be mature enough, but a confirming performance assessment of these sensors has not been conducted. For definitive measurements it is important that a number of sensors with complementary features be used in data collections.
We can conclude that single LIDAR is currently not able to scan the ranges required. Current stand off distances are in order of 10km. Any demand for greater range will imply the development of more powerful lasers or multi-lidar systems. Such lasers may not be simple or cheap to develop and their subsequent deployment may invoke questions of safety. LIDAR is also highly weather dependent. It works best under the meteorological conditions which produce the most hazardous vortices, but is this acceptable? LIDAR is still generally a research tool. Any deployed system will need to be developed to a level of ruggedness and ease of maintenance equivalent to an operational system. Critical issue might be also responsiveness. Can the LIDAR data be processed and the subsequent results assessed in an acceptable short time? For very bad weather conditions, windlines and Met tower with sonic anemometers will be necessary to get WV position near the ground and high resolution wind profile in the low layers (0 to 40meters). Also a RASS/SODAR needs to be added to this package for temperature profile retrieval.
4.2.2.2 Wake vortex prediction
The primary objective of a parametric wake vortex model is to reliably predict vortex positions and strengths in real-time in order to guide readjustment of aircraft separations. For this purpose, the model should consider all effects of the first order impact parameters that are aircraft configuration, wind turbulence, temperature stratification, wind shear and proximity of the ground. To take into account the stochastic characteristics of wake vortex behaviour, the model should not merely provide deterministic predictions. Quite the contrary, it should predict envelopes for vortex trajectories and strengths combined with clearly specified probabilities. From the number of suggested wake vortex models (see Holzapfel, 2003 for a list of models) only a few comply with most of the listed requirements. In the following, two models will be introduced to illustrate challenges, methods and capabilities connected to current real-time wake vortex modelling.
4.2.2.2.1 The probabilistic two-phase decay model P2P
The Probabilistic Two-Phase wake vortex decay and transport model (P2P) has been developed by DLR and is described in details in (Holzapfel 2003, Holzapfel 2004). P2P considers all of the above listed requirements. It is designed to include as much knowledge as possible gained from both experimental and numerical wake vortex research with a focus on operational needs. The model concept comprises the following elements:
Ø P2P employs a well defined and experimentally accessible definition for vortex strength, i.e. a mean circulation Γ5-15. For theoretical reasons and properties of the LIDAR technique it is beneficial to compute the circulation as an average over distances from the vortex core centre (here for radii between 5 and 15m) (Holzapfel, Gerz et al., 2003)
- 4-8-
Ø The complex wake vortex behaviour found in observations and simulations illustrates the challenges connected with the development of a thorough real-time model. Therefore, the concept used for model development was the conferment of the detailed and complex wake vortex behaviour found in LES upon simple equations for vortex evolution. Since there is no rigorous solution for the evolution of turbulent vortex pairs, the hydro dynamical basis of P2P relies on the equation that describes the spatial-temporal circulation evolution of the decaying potential vortex. In P2P this relation is extended and adapted to LES results of different research groups to describe vortex decay and descent.
Ø For the prediction of vortex circulation, the concept of two-phase circulation decay is pursued, as anticipated by LES (Proctor, 2000) and confirmed by Doppler LIDAR measurements (Kopp, 2004). The equation to parameterize vortex decay reads: * 2 * * * 2 * * *
5 15 1 1 2 2exp[ / ( )] exp[ / ( )],A R v t T R v t T−Γ = − − − − − − where all quantities have been normalized (marked by*) by intrinsic wake, thus aircraft, parameters as initial vortex spacing and descent speed. The slow turbulent diffusion phase is described by the second term, the rapid decay phase by the third term of the equation. The onset time of rapid decay at *
2T and the respective decay rate, which is adjusted by the
effective viscosity *2v , are functions of ambient turbulence and stratification, where the former is
characterized by the normalized eddy dissipation rate. *1T and *
1v control decay in the diffusion
phase, R corresponds to a mean radius, and A is a constant to adjust *5 15−Γ at * 0t = .
Ø Linear relations between descent speed and circulation hold only if the circulation value attributed to the wake vortices represents the velocity induced at the neighbouring vortex. For a radii-averaged circulation as *
5 15−Γ , this is not valid. Therefore, the parameterized descent rate obeys a non-linear dependence on circulation which allows for a reduction of circulation without the reduction of the descent rate during the early vortex evolution and for stagnating and rebounding vortices with non-zero circulation in strongly stably stratified environments. These features are in accordance with LES and observation data.
Ø P2P predicts probabilistic wake vortex behaviour. Precise deterministic wake vortex predictions are not feasible operationally. Primarily, it is the nature of turbulence that deforms and transports the vortices in a stochastic way and leads to considerable spatial-temporal variations of vortex position and strength. Therefore, P2P varies decay parameters in subsequent model runs and it adds various static and dynamic uncertainty allowances that consider the increased scatter of vortices in turbulent and sheared environments.
Recently, further developments of P2P were accomplished regarding circulation decay, effects of axial wind and glide slope angle, and axial and cross-wind shear. Wake vortex shear-layer interaction is extremely sensitive to a number of shear layer parameters (Hofbauer, 2003). Correspondingly, ref. (Holzapfel, 2004) illustrates that sufficiently precise observations and in particular predictions of shear-layer characteristics are hardly feasible. Therefore, deterministic predictions that aim to directly emulate

- 4-9-
the interaction of wake vortices and the vorticity in the shear layer do not seem to have potential for operational applications. At most, probabilistic approaches may cover shear-layer effects.
Figure 4-3 P2P vs. Lidar measurements
Figure 4-3 shows the evolution of vertical (z) and lateral (y) positions and circulation (Γ) of wake vortices against time from WakeOP campaign as measured by two Lidar pairings (symbols) and predicted by P2P (solid lines limit confidence intervals, dashed lines mark mean evolution). Flight path corridor is indicated by straight dashed lines.
4.2.2.2.2 Vortex Forecast System –VFS
The VFS is a deterministic WV predictor based on the method of discrete vortices (discrete “vortex particles”): those are used to model the aircraft wake vortices (the “primary” vortices) and the “secondary” vortices generated near the ground when IGE. The VFS was developed by an international team (SABIGO
- 4-10-
of Russia, Oracle Telecomputing Inc. and M. Yaras of Canada, and G. Winckelmans of Belgium), in the framework of the 1994-2000 Transport Canada (TC) “Wake Vortex Project”, see (Jackson et al., 2001). The VFS produces one deterministic WV prediction (transport and decay) in each “computational gate” (a vertical 2-D slice of space), taking into account the generator aircraft type (span, weight), speed and altitude. A summary description of the models implemented in VFS, including the further improvements done after completion of the TC project, can be found in (Winckelmans et al., 2004). All models are implemented using an “accumulated damage” approach, so as to capture the variations of the input profiles with altitude. The evaluation of the “demise time” uses the formulation based on the atmospheric turbulence (using the “eddy dissipation rate”, EDR) and modified for stratification effects: following (Holzapfel 2003 & 2004). Two decay models are implemented: the EDR-based decay model, but further calibrated based on large-eddy simulations (LES), and the TKE-based model. The two-phase decay approach is also implemented in VFS; this is done by increasing the coefficient in the decay model after the demise time has been reached. A two-equation model is used to capture the stable stratification effects (Winckelmans et al., 2004), acting on both the circulation decay and the vertical acceleration, and consistent with behaviour obtained from LES (Holzapfel, Gerz, 2001). A non-uniform wind shear model is also implemented (Winckelmans, 2000) which also accounts for tilting effects of the WV system. The in viscid NGE are modelled using image vortices; the viscous IGE effects are modelled using secondary vortex particles produced near the ground at the location of the separating boundary layers. The stratification, wind shear, and ground models allow capturing complex WV behaviours (e.g., tilting effects and rebound effects).
Precise deterministic WV predictions are however not feasible operationally. Primarily, turbulence, by its nature, deforms and transports the vortices in a stochastic way and leads to considerable spatial-temporal variations of vortex positions and strengths. This is even truer in complex situations such as near ground behaviour and behaviour under wind shear conditions. Moreover, the uncertainties on aircraft parameters (weight, speed, position) and the variability of environmental conditions must also be taken into account. Probabilistic modelling and assessment is clearly required. An upper software layer was thus developed by UCL, for “probabilistic use of the VFS”: the “P-VFS”. It is based on Monte Carlo type simulations (many VFS runs) using the uncertainties/variations of the aircraft generator parameters, of the input weather profiles, and of the model coefficients. An example of prediction results, for one computational gate, is shown in Fig. 4-4.

- 4-11-
Figure 4-4 Example of P-VFS prediction bounds (shaded area) versus measured data (symbols) for
a case with head and cross wind from DLR WakeOp campaign
4.2.2.2.3 Conclusion
Nowadays, the WV evolution models take into account the aircraft conditions (weight, wingspan), the flight conditions (position, velocity and trajectory), the weather conditions (wind profile, stratification profile, turbulence, wind shear), the ground proximity conditions (in viscid near ground effects (NGE), viscous in ground effects (IGE) with secondary vorticity being produced at the ground).
It is however essential to also recognize the probabilistic/stochastic aspects of WV behaviour. This is especially true for complex aspects such as WV behaviour IGE, behaviour under wind shear conditions, determination of time of WV demise and two-phase decay modelling. Clearly, the real-time modelling/assessment must be macroscopic (global transport, global decay of wake strength) and probabilistic. The P2P approach is a bit different than that of the P-VFS. Yet, the net result (probabilistic assessment of WV transport and decay) is similar: they provide as output confidence intervals for vortex position and strength.
- 4-12-
Both modelling approaches (P-VFS and P2P) can be complementary. Their parallel use could allow increasing even further the probabilistic assessment of the WV behaviour, and thus enhancing the quality of the ATC decisions based on those probabilistic predictions. For instance, the result of the benchmark for WV behaviour in ground effect (Winckelmans et al., 2004 and Holzäpfel, et al. 2004) illustrates well the good performance and potential complementarities of those probabilistic predictions, even in complex situations where ground effects are combined with cross-wind and non-uniform wind shear effects.
4.2.2.3 Weather forecast
The basis for prediction of wake vortex behaviour is the knowledge of the key meteorological parameters as function of forecast time, location and height. This information in principle can be provided by numerically solving the basic equations which approximate the atmospheric state (i.e. its momentum, mass, heat, water content) as done in weather forecast models or by measurements around the airport from which the future conditions are obtained by extrapolation. For air traffic scheduling purposes with a time horizon of the order of one hour the former method is appropriate whereas for shorter forecast periods the latter method is better suited. In that case, the so-called persistency forecast extrapolates the measured profiles into the future with uncertainty allowances which result from the measurement statistics and increase with time (Frech, Holzapfel, 2002).
The prediction of future state of the atmosphere with a numerical forecasting system is in mathematical terms an initial-value and boundary-value problem. Short-term forecasting (or nowcasting) the weather in a local area like an airport environment is particularly delicate since it requires an adequate spatial resolution of local details in orography, land-use, and soil type to compute correct fluxes of kinetic energy, sensible and latent heat, and turbulence from the surface into the atmosphere and vice-versa. Further, a sufficient temporal resolution of all meteorological parameters at the lateral boundaries is necessary to capture frontal passages and smaller-scale events like e.g. thunderstorms which travel from outside into the forecast domain.
The level of turbulence in the atmospheric boundary layer is the key quantity to predict wake vortex decay. Measures for turbulence are the kinetic energy of the small-scale eddies (turbulence kinetic energy, TKE) and the rate at which the energy of these eddies dissipates (energy dissipation rate, EDR). For aircraft wake vortices the atmospheric eddies in the scale range of one meter to a few hundred meters (i.e., from vortex core size to some aircraft spans) are responsible for vortex deformation and dissolution. Averages in time should correspond to the typical vortex life time, hence 2 to 3 minutes. However, in meteorology turbulence quantities are typically averaged over 30 minutes, hence including fluctuations which are by far too large for the dimensions of a trailing vortex pair. As the value of TKE depends on the averaging time whereas EDR as “energy per time” or “intensity cubed per length scale” does not, it is appropriate to use EDR as the turbulence measure in the wake vortex context in order to reduce the effect of an averaging window on the result obtained. If the flow obeys Kolmogorov’s inertial sub-range theory the choice of EDR would be ideal because the result is indeed robust (independent) with respect to averaging times or length scales as long as they lie within that sub-range. The EDR concept works quite well under turbulent atmospheric conditions but it may fail when the turbulence is weak and sporadic and basis assumptions are not fulfilled. Moreover, measurements tend to overestimate EDR when the
- 4-13-
turbulence levels are low. Pragmatic parameterizations of EDR may be acceptable for operational solutions as long their limits are understood.
Taking all these requirements into account, the weather nowcasting system NOWVIV (nowcasting of wake vortex impact variables) has been developed at DLR. The kernel of NOWVIV is a version of the mesoscale model MM5, developed at the Pennsylvania State University and the National Centre of the Atmospheric Research, as used by the Forecasting System Laboratory in the National Oceanic and Atmospheric Administration in the USA (Grell et al., 2000). NOWVIV has been adapted to particular sites in Europe (Oberpfaffenhofen and Frankfurt in Germany, Tarbes in France) taking into account detailed terrain, land-use and soil-type information. In order to capture advective weather features, as e.g. fronts and adequately represent their evolution by the models’ physics before they enter the terminal area of the airport, two model domains have been centred on each airport site. The outer domain has a horizontal grid resolution of 6.3 km and the inner domain, the so called nest, has a gird size of 2.1 km. Each of them has 40 grid points in both horizontal directions and covers a domain of about 245km2 and 80km2 respectively. The domains interact “two-way”, i.e. computed quantities in the nest are fed back to the outer domain. As a good representation of the boundary layer is of particular importance for predicting wake vortex impact variables, a quite high vertical model resolution has been chosen for the lower model atmosphere, starting with 8 m at the ground and increasing to about 50m at 1km and nearly 100m at 2km height. For initial and boundary conditions, NOWVIV employs data from the operational weather forecast model (“Lokalmodell – LM”) of the German Weather Service (Doms, Schaettler, 1999). LM covers most of the area of Europe, has a resolution of 7km horizontally and increases vertically from about 60m at the ground to 200m at 1km and 400m at 2km altitude. A new set of forecasted quantities is provided every 12 hours which serve for updating the boundaries of the MM5’s outer domain at 1 hour time increments. At grid points surrounding the runway and also along the glide slope time series of vertical profiles of wind, virtual potential temperature, turbulence kinetic energy, and eddy dissipation rate are computed. At output NOWVIV transfers these wake vortex impact parameters in 10 minutes intervals to the parametric wake vortex transport and decay models P2P and VFS.
4.2.2.4 Weather monitoring
Besides a weather forecasting tool, future wake vortex system further requires meteorological measurement equipment which is capable to monitor the key quantities in the terminal area of an airport or along the aircraft glide paths from ground up to at least 1200m altitude with an adequate temporal and spatial resolution. Such sensors are wind and temperature profilers, as RADAR or SODAR combined with a radio acoustic sounding system (RASS), wind LIDAR and sensors installed in commercial aircraft.
A SODAR emits an (audible) acoustic pulse in the frequency range at about 1500 to 4500 Hz into the atmosphere and receives a back scattered signal caused by natural atmospheric turbulence. Scattering of the acoustic waves occurs while the pulse propagates through natural density fluctuations. The received acoustic signal is shifted in frequency (Doppler Shift) from the emitted acoustic signal which allows determining the velocity component of the wind field. At least three independent measures are required to obtain the three orthogonal components of the wind vector. SODAR use 3 or 5 beams with one beam pointing vertically and with the other beams tilted by about 5 to 10º and different by 90º in azimuth. The RASS technique uses artificially generated sound waves (e.g. by a SODAR) which propagate through the

- 4-14-
atmosphere. The basic measurement quantity is the propagation speed of sound waves from which the virtual temperature can be inferred. In the same way as the RADAR or SODAR technique is based on the scattering of the radar waves or acoustic waves at natural atmospheric fluctuations (clear air scattering) also a sound wave itself can cause back scattering of RADAR waves if they are propagating through his acoustic wave field. This back scattered signal shows much better statistical properties compared to the SODAR or RADAR signal The RASS effect of back scattering of radar waves on acoustic waves requires an essential relation between the two wave fields: the radar wave length must be exactly two times of the acoustic wave length in order to allow a constructive interference for the scattered radar wave field (North, Peterson 1973). Depending on equipment, configuration and analysis technique a SODAR/RASS can provided 2-10 min averages of wind and temperature profiles with a vertical resolution of 10 to 50m. The variance of a (e.g. vertical) velocity component serves as a measure for turbulence.
A Doppler LIDAR emits light into the atmosphere and receives the signals reflected by aerosols and small dust particles. The Doppler shift between the transmitted and received signals is a measure of the velocity of the air volume which contains the reflecting material along the line-of-sight (LOS) of the laser beam. Such a system is capable to measure both the ambient wind and the velocity signatures of wake vortices. The 2 µm pulsed Doppler LIDAR developed by DLR is based on the transceiver unit MAG-1 from CLR photonics (Henderson et al. 1993). It transmits pulses of 2 mJ energy and 500 ns length into the atmosphere with a pulse repetition rate of 500 Hz. The transmit-receive telescope is an off-axis type with an aperture of 108 mm. The amplified return signal and the reference signal are fed to the data-acquisition and recording unit where it is sampled with a rate of 500 MHz (Kopp et al. 2004). The LOS spatial resolution is 3m. The DLR LIDAR functions in two modes: In the conical scan mode the laser beam points upward and amoving around a cone, measures vertical profiles of the three wind components and turbulence above the LIDAR (Smalikho et al., 2002); in the vertical scan mode the laser pulses oscillate between elevation angles of 0º to 30º and, hence, measure vertical profiles of the LOS velocity (i.e. one component of roughly the horizontal wind vector). Two independently programmable rotating wedges allow to scan alternately in the linear and the conical mode. In the atmospheric boundary layer the range of the pulsed LIDAR is more than 10 km to measure wind velocities; it is limited to about 2 km for measurement of the velocity signatures of aircraft wake vortices, due to the increasing separation of the measurement radials with increasing range.
Modern aircraft are capable of measuring wind, temperature, and turbulence profiles when on stable, straight paths during landing and departure. There are about 130,000 meteorological reports from aircraft per day (Moninger, 2003). These automated reports are called ACARS3 data from US carriers. The more generic term is AMDAR (Aircraft Meteorological Data Relay) reports. ACARS data are sometimes called MDCRS (Meteorological Data Collection and Reporting System), but this refers more to the database of aircraft reports residing at ARINC. AMDAR data have the advantage to deliver measurements along the glide slope where the wake vortices evolve. Measured and transferred data include time, position-latitude, position-longitude, pressure altitude, wind speed and direction, and static air temperature. Winds are measured from the air speed via a pitot static probe and ground speed from inertial navigation systems. Total air temperature is usually measured by an immersion thermometer probe. Turbulence in the form of eddy dissipation rate is obtained from algorithms developed by NCAR (Cornman, 1995). There are presently only about 75 aircraft equipped for EDR measurements, and EDR data are not yet useful from departing and landing aircraft. Accuracies of winds and temperatures have been reported to be equivalent

- 4-15-
to those from standard radiosonde soundings (Benjamin, 1999). Pertinent operational performance characteristics of aircraft measurements are shown in Table 4-1. About 70 % of ACARS data is available for use within 20 minutes after the measurements are made in the existing ARINC communications system. Special arrangements must be made for aircraft data acquisition and use. The reporting frequency (and therefore vertical resolution) is not yet standardized in this country. While the maximum vertical resolution on a stabilized three degree glide slope is about 20 m, assuming a 5 sec average of 15 measurements, more typical altitude resolution reported is on the order of 40-300 m.
Table 4-1 Aircraft measurements operational performance characteristics
Sensor Parameter
output
Averaging
period
Output
rate
Vertical
resolution
Horizontal
resolution Accuracy
ACARS Wind speed 1-30 seconds 1-3 samples 20 - 110 m 70 - 210 m ~ 1-2 m/s and direction per second Temperature ~ 0.4 - 1.5 C Turbulence
4.2.2.5 Conclusion
Advances in technology development are progressing very fast and each year brings a significant improvement in wake vortex sensors’ range, accuracy and reliability. Wake prediction algorithms are also becoming more mature, taking into account the stochastic behaviour of wake vortices with predicting safe confidence intervals of wake vortex strength and location. Detection and prediction systems are well supported by weather forecast and nowcast systems and they can be integrated to a large scope integrated solutions providing separation advices to air traffic controllers or enabling a less technology dependent advanced operational procedures.
4.2.3 Operational procedures and systems
4.2.3.1 SOIA
SOIA (Simultaneous Offset Instrument Approaches), procedure developed by FAA, allows simultaneous approaches to be flown to runways spaced less than 2500 ft apart i.e. closely spaced runways (Lankford, 2000). Some airports do not conduct approaches to closely spaced runways but, rather, operate single stream traffic. Other airports conduct parallel visual approaches to closely spaced runways when the weather (i.e., ceiling and visibility) permits the aircraft approaching the adjacent runways to establish visual contact with one another in sufficient time to be issued visual approach clearances. Ceilings for such approaches are normally only available down to 4000-5000 ft above ground level (AGL). As the weather deteriorates, the airport must change to single flow arrival streams, which significantly reduces the potential capacity.
SOIA utilizes an ILS on one runway and an offset LDA (Localizer Directional Aid) with glide slope on an adjacent runway to allow simultaneous approaches to ceilings down to about 1500 ft and visibility of 3 to 4 miles. ATC monitors a standard 2000-ft wide No Transgression Zone (NTZ) for aircraft deviations

- 4-16-
between approach courses. The FAA requires the use of a PRM (Precision Runway Monitoring) system to provide controllers with aircraft position data once every second. The NTZ extends from the point on final where vertical separation of 1000 ft is lost to the LDA Missed Approach Point (MAP). Outside of the MAP, the geometry of the approach courses permits the application of current FAA regulations for simultaneous approaches. The LDA MAP is located where the approach course separation is 3000 ft adjacent aircraft are "paired." A specified ceiling provides the pilot of the trailing aircraft at least 25 seconds after exiting the overcast to visually acquire the leading aircraft on the adjacent runway and receive a "maintain visual separation" clearance prior to reaching the MAP.
Aircraft perform SOIA to runways spaced less than 2500 ft apart; therefore, controllers must apply all applicable wake turbulence criteria between aircraft on the same and adjacent finals.
Figure 4-5 SOIA procedure
San Francisco International Airport (SFO) was the first candidate airport for SOIA. At SFO the arrival rate is 60 aircraft per hour in clear weather using both parallel runways, which are 750 feet apart. In times of heavy fog and low-ceiling conditions, aircraft are placed in-trail to one runway, reducing the airport arrival rate by half. The SOIA procedure enables SFO to maintain an arrival rate of up to 40 aircraft per hour with a cloud base as low as 1,600 feet and four miles visibility. The FAA has completed fly ability, collision risk, and preliminary wake turbulence analyses for the SOIA procedure. Other potential sites for SOIA include St. Louis, Atlanta, Newark, Cleveland, and Miami airports.
4.2.3.2 HALS / DTOP
HALS / DTOP (High Approach and Landing System / Dual Threshold Operation) was developed for Frankfurt Airport by DFS (Deutsche Flugsicherung). It consists of the use of an artificial displaced landing threshold on 25L, displaced by 1500 meters from the approach end of the 25L, designated as 26L. Only medium or light aircraft (the ICAO wake classification) are authorized for using the displaced threshold. By using the displaced threshold, the glide slope fro 26L in nearly 270 feet above the glide slope of 25R. This procedure is based on DFS data gathered at Frankfurt showing that the highest the wakes have been observed to climb there is 72 m (236 ft).

- 4-17-
During normal operations at Frankfurt, when IFR separations are used (i.e., when visual separation is not used), aircraft are typically cleared to alternate runways and are staggered by wake turbulence separation. Thus, if a medium aircraft followed a heavy aircraft on 25R on 25L, the medium aircraft would be staggered behind the heavy by 5nm. When the HALS/DTOP procedure is used, a heavy aircraft would use 25R; a following medium aircraft could use runway 26L, and would be separated by standard radar separation (2.5 nm within 10 nm of threshold) behind the heavy aircraft.
Figure 4-6 High approach landing system / Dual threshold operation
HALS/DTOP has been deployed in two phases. Phase I consisted of using the displaced threshold on 26L without any modifications in the separation standards used. Phase II, now underway, reduces the separation standard for aircraft following heavies to the standard radar separation. Phase I started in September 1999 and phase II in June 2001. HALS is designed for use down to CAT I minima.
At Frankfurt airport, it was expected that the introduction of HALS/DTOP would increase capacity from 78 movements to 80 movements per hour, an improvement of 2.5% (Frankfurt airport 2000). To estimate the potential capacity improvement at airports other than Frankfurt, the runway layout and runway usage of those airports must be compared. Paris CDG, Frankfurt, London Gatwick, Rome Fiumincino, Copenhagen Kastrup and Zurich are suitable for HALS/DTOP operations. Highest potential improvement could be achieved at Copenhagen Kastrup (Roelen, 2001).
4.2.3.3 WAKE VORTEX WARNING SYSTEM
The Wake Vortices Warning System (WVWS) is a wake advisory system that forecasts the wake vortex transport to determine the risk to other approaching aircraft. It utilizes a wind line on approach, about 3000 feet from the threshold, consisting of 10 ultrasonic anemometers each 15 meters high, separated by 50 meters with a sampling frequency of 25 Hz. This system is still in research and development status. WVWS uses algorithms developed by DLR (Deutsches Zentrum fur Luft-und Raumfahrt) for predicting
- 4-18-
winds and the wake vortex transport for up to 20 minutes into the future. The WVWS forecasts whether the downwind wake vortices can reach the safety area of the parallel runway. This safety area is a cuboid 80 meters in height and extends outward from the runway. The width of the safety area is 90 meters and assumes that the aircraft could be off its runway centreline by 15 meters and the core of the wake must be farther from the aircraft than 30 meters to reduce the hazard to an acceptable level. If the wake vortex is forecasted not to enter this safety area based on the wind measurements, then standard non-vortex separation can be provided between the aircrafts.
There are four approach procedures, which have been contemplated to take advantage of this system:
1. Staggered approach
2. Modified staggered approach 25L
3. Modified staggered approach 25R
4. Single runway approach
For the staggered approach procedures, which have been contemplated, is less than about 2 m/s. Under these conditions, the design expects that the wakes will not be transported to the adjacent runway, which is 518 m away. Aircraft landing in-trail on the same runway are separated by the wake vortex separation. However, minimum radar separation is applied between aircraft landing on the adjacent parallel runway. Even though the runways are still operated dependently, the separation is reduced over the current wake vortex separation, hence allowing a greater arrival throughput to these runways.
For the modified staggered approach (2 and 3 above), the cross wind is stronger, and WVWS expects that the wake could be transported over to the downwind runways if the aircraft creating the wake is landing on the upwind runway. Again, all in-trail aircraft on the same runway will be separated by the wake vortex separation. However, the aircraft landing on the upwind runway landing behind a heavy aircraft on the downwind runway need only be separated by the minimum radar separation standard. On the other hand, the aircraft landing on the downwind runway behind a heavy aircraft on the upwind runway must be separated by the wake vortex separation. This asymmetric dependence on the runway operations allows some relief from the wake vortex separation standards.
If the crosswind was greater than 6 m/s then single runway approach procedure would be used. In this procedure all aircraft would land on the downwind runway and they would be separated by the minimum in-trail radar separation. It is not expected that this procedure will be used because sustained crosswinds of this magnitude to these runways is not common.
A significant feature that differentiates the German WVWS from the US’s VAS is that a forecast is made that estimates how long the conditions will persist (out to 20 minutes) such that the appropriate procedure can be used. WVWS only uses surface winds for its measurements, and uses no real time verification of wake behaviour.
4.2.3.4 AVOSS / WAKEVAS
The AVOSS project provided an impetus to advance the state-of-the-art in wake modelling and sensing technology, as well as weather sensing to support predictions of wake behaviour. These technologies were

- 4-19-
integrated to address the single runway arrival radar separation rules. Current weather conditions relevant to wake behaviour were sensed and used as a persistence-based forecast to provide inputs to real-time wake prediction algorithms that were valid for a specified time interval. The predicted wake behaviour was applied to a region of monitored airspace called the safety corridor, which was a rectangular region centred on the Instrument Landing System (ILS) localizer and glideslope. Wake hazard or residence times in the corridor were used to compute required spacing for wake avoidance. Wakes could cease to be a hazard by 1) sinking below the floor of the safety corridor, 2) being advected laterally from the corridor by crosswinds, or 3) decaying to intensity below a specified threshold. Real-time wake sensing systems such as pulsed and continuous-wave (CW) Light Detection and Ranging (LIDAR) systems, and wind-lines were used to check the results of the prediction system. A prediction of wake vortex behaviour is required in addition to wake sensor observations since spacing recommendations need to have some practical amount of lead-time and be stable for a certain time interval. For detailed descriptions of the AVOSS see ref. (Hinton 2001, Hinton et all 2000).
AVOSS was demonstrated at Dallas/Forth Worth International Airport in July 2000. Using real-time data AVOSS averaged a 6% potential throughput increase over current standards.
The follower of AVOSS project was defined within WakeVAS concept. WakeVAS architecture is shown conceptually in Figure 4-7.
Figure 4-7 WakeVAS architecture
Starting from the left of the figure, data fusing algorithms integrate wake measurements, as well as atmospheric inputs from aircraft, terminal and National Weather Service (NWS) ground sensor systems,
- 4-20-
and NWS Numerical Weather Prediction (NWP) models. The atmospheric data provides inputs to the wake behaviour prediction algorithms that estimate the mean and variance of wake positions and strengths. Aircraft information such as type, speed, and weight are also inputs to the wake prediction algorithms. The observed atmospheric data provides feedback for the training of probabilistic forecast guidance tools derived from NWP models, which are used to estimate how the atmospheric conditions that influence wake behaviour will vary over time. Wake sensors monitor the actual wake behaviour. The wake and atmospheric observation and prediction subsystems are integrated in a closed-loop system that constantly compares the predictions to observations. The measurements determine divergence in predicted and observed wake behaviour. The comparison will contribute feedback to the entire prediction system by 1) providing short term corrections to the predictions, by applying the observed divergences to increase the variance in the wake parameters used to compute wake hazard durations and 2) provide the necessary databases for improving probabilistic wake prediction algorithms (Glahn and Lohry, 1972) and training (Krishnamurti, 2000) of meteorological model ensembles (Stensrud et al., 1999, Hamill & Colluci, 1997) for terminal area NWP. To compute wake hazard durations, the predicted behaviour is applied to a region of protected airspace defined for the particular airport operation targeted, and safe spacing intervals between aircraft are derived. A safety monitor function adjusts wake hazard durations appropriately based on the variance in wake and weather parameters reported by the system.
The spacing data becomes an input to a controller tool or interface, the nature of which depends on the resolution of spacing adjustments, as discussed previously. The information can also be up linked to aircraft equipped to use the information in flight deck displays.
The WakeVAS concept relies on a number of enabling technologies, some of which were demonstrated during the AVOSS project. They are listed as follows, with notes on their maturity level:
1. Wake sensors – The AVOSS utilized pulsed and CW Lidar (Campbell et al., 1997) for measurements of vortex location and strength. A windline (14) was also used for measurements of vortex lateral position. Each sensor system used in AVOSS could be classified as a research sensor, but commercial pulsed LIDARs with wake-measuring capabilities can now be already purchased. Detailed performance specifications of even the commercial LIDAR have yet to be determined. In addition, none of the AVOSS sensors could measure both wake position and strength in all weather conditions. Due to this and other limitations research continues on other candidate wake sensors.
2. Weather sensors - AVOSS used a variety of commercial weather sensors to characterize the wake relevant terminal area ambient conditions. A down-select of the weather sensors used in AVOSS is required to determine the minimum necessary WakeVAS sensor suite. Candidates include an instrumented tower (for low-level wind, temperature, and turbulence measurements), a UHF profiler with a Radio Acoustic Sounding System (RASS) (low to middle level winds and temperature), a pulsed LIDAR (serving the dual task of wake and wind measurement), and aircraft measurements. Aircraft have the potential of measuring all the parameters of interest at a high resolution, under all weather conditions, over the entire region of interest, and thus represent the primary means of collecting weather information. Some corroboration with ground sensors is likely to still be required.

- 4-21-
3. Terminal Weather Predictor – A WakeVAS will cause dynamic changes to airport departure and arrival rates. In order for affected parts of the NAS to react and take advantage of the changes, sufficient advance knowledge of the changes will be required. This can be achieved with an accurate terminal-area-scale prediction of the relevant environmental parameters that affect wake behaviour. A technology for accomplishing this was demonstrated in the AVOSS project, called the Terminal Area Planetary Boundary Layer Prediction System (TAPPS) (Kaplan et al., 2000). Emerging technologies (e.g. ensemble forecasts) are also under consideration for improving terminal-area scale NWP (Stensrud et al., 1999, Hamill & Colluci, 1997 ).
4. Sensor Fusing Algorithms - Data from a variety of sensors with different resolutions/effective ranges, and operational constraints will have to be integrated into single profiles of winds, temperature, and turbulence. Algorithms for fusing these sensor inputs (the sensor data often disagrees, as discovered during AVOSS) must be developed. These algorithms must include quality control measures so the confidence in the reported parameters can be determined. The AVOSS included a prototype for this function; see references (Hinton, 2001) and (Hinton, 2000).
5. Wake Prediction Algorithms - The real-time wake behaviour prediction algorithm used in AVOSS (Robins, 2002) represents the state-of-the-art in a real-time wake model. Despite its sophistication it will not be adequate for an operational system because it does not specify the wake behaviour in a probabilistic manner. A mean and variance of the wake position and strength is required along with a confidence measure of those values to perform a formal safety analysis of the system. The wake prediction algorithm should also be integrated with the weather predictions, observations, and wake observations in a closed-loop system that adjusts for predictions diverging from observations. This configuration has not previously been tested.
6. Aircraft Meteorological Data - As mentioned in the discussion on weather sensors, aircraft may be the only way to get all the required environmental data over the region of interest. Aircraft already measure and report meteorological parameters, but the resolution of the data is not adequate for a WakeVAS. The feasibility of obtaining the required resolution data from the aircraft systems has been demonstrated, but not in real-time.
7. Air/Ground Data Link - The concept requires both meteorological and aircraft state data (e.g. speed, weight) to be communicated to the ground prediction system. The bandwidth of the link is still an open research question.
8. Controller Tools/Displays - No controller tool was tested during the AVOSS project. The system was designed, however to interface through a dynamic set of weight-category dependent spacing standards to CTAS. A high-resolution spacing tool such as what is included in CTAS is one option, and at the other spacing resolution extreme is a wake-factor/no-factor with duration advisory, possibly displayed in a similar manner as the ITWS (Integrated Terminal Weather System) wind shear alerts. The controller tool is an open design issue.
9. Flight Deck Displays - Similar to the controller tools, no flight deck displays for wake information have been tested; so many issues such as human factors for the design, symbology, coding, alerting and display location remain open research questions. A synthetic vision system is one

- 4-22-
candidate technology for displaying wake information. Another is a CDTI stand-alone display, or information integrated with the NAV/Guidance/Multifunction display.
The interface of a Wake Vortex Avoidance System (WakeVAS) system into the National Airspace System (NAS) will be accomplished through the implementation of decision support systems (DSS) and automation tools. These may include approach spacing tools to provide sequencing, spacing, and runway assignment of aircraft on final approach to congested airports; including refined considerations for wake vortex and specific aircraft characteristic algorithms. Information display techniques will integrate surface, terminal, and wake vortex information into a simplified format to support departing and arriving traffic sequencing. The controller, traffic flow managers, airline operation centres, pilots, and other NAS users will have access to the same DSS and automation tools, which will enable a collaborative decision making capability. Controller-pilot data link communications (CPDLC) service supporting air-ground data exchange used in conjunction with advanced cockpit displays may allow pilots to fly self-separation manoeuvres during IFR conditions in the terminal area.
Studies have been performed to date (Hemm, 1999 & Shaw, 2002) attempting to quantify the predicted benefit of a WakeVAS implementation to the NAS. The difficulty in deriving an overall benefit of such a system is twofold:
1) The complex inter-relationships between the numerous pieces of the system
2) The lack of high resolution meteorological data at the sites of interest.
Since the NAS is a complex system with many dependencies between its elements, changing the performance of one factor (such as airport arrival rate) has an unknown impact on the system as a whole. An increased aircraft arrival rate could cause congestion on the taxiways or at the gates, problems with baggage claim, and increases in ground traffic around an airport. Increases in capacity will likely create issues with noise abatement, which is a highly sensitive issue at some locations. Comprehensive system level simulations that take all of the factors into account will be required to quantify overall impacts and benefits.
A second issue in quantifying WakeVAS benefits is that since the premise of the system operation is to compute wake-safe spacing that is a function of high-resolution local meteorological conditions, this high resolution data must be collected from all the airports where a WakeVAS will be used. The conditions will vary by time of day, time of year, and geographic location. Studies such as in (Hemm, 1999) only use surface wind speed and direction as inputs to a WakeVAS decision model. As was observed in the AVOSS field deployment (Donohue, 2001), ignoring a wake behaviour factor such as lateral movement or strength in the hazard computation reduces the projected benefit by as much as 50%. The Dallas departure study in (Shaw, 2002) is an example of what can be done for a location where high-resolution meteorological data above ground level was collected for a significant period of time.
Given the complications described above, benefits analysis to date suggests changes to the wake vortex separation standards will have positive impacts on terminal capacity. In (O’Connor, 2001) the average 6% potential throughput increase achieved in the Dallas AVOSS demonstration would result in as much as a 40% delay reduction at airports operating near capacity limits, such as Atlanta International Airport. The Massachusetts Institute of Technology’s Lincoln Labs benefit study using a simulation of departure operations at Dallas/Ft. Worth projected a yearly savings of five to ten million dollars from reduced delays

- 4-23-
resulting from reducing wake separations. The potential savings at many closely spaced parallel runway airports that must reduce operations from two to one runway under IMC may be even greater. As discussed in the previous section, not every factor that balances the parameters analyzed in a system as complex as the NAS has been addressed in these studies, and consequently the potential benefit may be reduced because of these factors. Therefore, the WakeVAS concept of operations is designed to be adaptable and able to improve wake-constrained efficiency in a variety of operations.
4.2.3.5 ATC-WAKE
Main objective of ATC-WAKE project is the development of an Air Traffic Control Wake Vortex Safety and Capacity Integrated Platform. The part of the project is to evaluate interoperability with existing ATC systems, to assess possible safety and capacity improvements, and to evaluate operational usability and acceptability for air traffic controllers. This platform is an essential step for installation of an “integrated ATC decision support system” at airports, enabling air traffic controllers to safely apply new optimised weather based aircraft spacing. The system integrates a Separation Mode Planner component, a Predictor component, a Detector component, a Monitoring and Alerting component, as well as Human Machine Interfaces to the controllers (Astegiani et al., 2003). Used in combination with new wake vortex safety regulation, the ATC-Wake System will provide both tactical and strategic benefits, while maintaining the required level of safety.
The Separation Mode Planner (SMP) handles the planning phases. It is based on weather forecasting and nowcasting, and is coupled to safety assessment of the various conceivable separation distances using the WAVIR toolset (Speijker et al., 2004). For landing, the SMP forecasts a safe landing rate 40 minutes in advance: this allows the Arrival MANager system (AMAN) to organise the traffic en-route before the entrance in the TMA.
ATC-Wake Predictor predicts for individual aircraft the wake vortex behaviour in the pre-defined arrival or departure area(s). Prediction is performed using real-time available meteorological data from the time the aircraft reaches a critical arrival area entry until it lands and from the take-off until it leaves the critical departure area. It is made using the probabilistic wake vortex behaviour prediction systems (PVFS and P2P), and uses inputs from weather nowcasting and monitoring, surveillance systems (radar), flight data processing systems, and databases on airport layout and aircraft characteristics (span, weights, speeds). The meteorological data consist of the most recent nowcast data as well as ground or down-linked airborne measurements (wind/temperature profiler, wind/temperature aloft). The ATC-Wake Predictor determines, in real-time, the part of the flight track that potentially might be affected by wake vortices. The quality of wake vortex behaviour prediction is directly related to the quality of the input data (meteorological and radar data). A safety buffer has to be applied to satisfy accuracy requirements of Air Traffic Controllers and/or regulatory authorities. The prediction is updated in short intervals (6 seconds) and the information is provided to ATC through a Human Machine Interface, in the form of a Wake Vortex Vector (WVV). The HMI was evaluated, tested, and further improved through real-time approach/tower research simulator sessions. The prediction is also vaulted / assessed by measurements of the wake vortex behaviour of preceding aircraft: the task performed by the wake Detector.
LIDARs are able to detect and monitor wake vortices in real time. Since LIDAR is a fair weather tool (it requires a certain amount of visibility), it may be complemented by Radar techniques to detect wake

- 4-24-
vortices. Ideally the whole glide path should be monitored for wakes while the focus should be on the wake detection close to the surface where a wake encounter may be most critical. During the two measurement campaigns WakeOP and WakeToul wakes were scanned perpendicular to the flight path in order to characterize the strength and position of the wake. The wake vortex monitoring system acts as a safety net in the ATC-Wake system and is part of the ATC-Wake Monitoring & Alerting System. The actual wake position is analysed and a warning is issued if a wake is found in the safety corridor of an approaching aircraft.
The output of the ATC-Wake Predictor is the Wake Vortex Vector (WVV) of an aircraft in the so-called critical area. This information is presented as an enhancement on a Plan View Display (PVD). The PVD shows, in a God's eye view, the information received from the airport radar's, combined with flight track data (call sign, aircraft type, height, speed etc.). Each controller has a PVD; but the range, labelling and details are dependent on the task of the controller. Because the WVV is only calculated in the critical area (an area close to the glide slope) only changes to the PVD of the Final Approach controller and Tower controller are foreseen. Other guidelines for a new HMI are that the WVV should be presented in an unambiguous way, is easy to understand, will not be used for separation planning, and will not add additional workload. Furthermore, it should draw the attention of a controller in case of an alarming situation (such as a WVV in the critical area). Interviews with air traffic controllers resulted in three different HMI formats. To select the best HMI, a small real-time simulation experiment has been executed on the NARSIM (Tower and Approach) simulators of NLR. The different HMI's and the whole ATC-Wake concept have been integrated and tested in the Schiphol environment. Nine controllers from 5 different countries participated; all have chosen the "Variable Wake Vortex" HMI as the best solution. Figure 4-8 shows the "Variable Wake Vortex" for the Approach controller. New is the blue coloured vector behind each aircraft, representing the WVV and varying (using information from the Predictor) along the glide slope. Also a micro-label with the distance to the preceding aircraft is proposed.
Figure 4-8 ATC-WAKE HMI for approach controller
In case of an alarm, the colour of the WVV will change to orange and an audio alarm will be raised (see Fig. 4-9). The selected HMI and ATC-Wake concept have been received very well by the controllers, which certainly support the expected benefits of the concept.

- 4-25-
Figure 4-9 ATC-Wake alarm for Tower controllers
ATC-Wake proposes a dynamic separation concept, which uses in reduced mode of operation a static separation value (e.g. 3NM) for entire sequence of arrivals. This approach relies on the favourable weather conditions and application of WVV. However it does neglect the type of aircraft (wake category) in the sequence. It is understood that the implementation of a new ATC system, allowing reduction of separation during landing or take-off phase, will have to ensure the same, or even higher, level of safety as the current flight procedures. New proposed wake vortex safety regulation will have to comply with the Eurocontrol Safety Regulatory Requirements (ESARR 4) to ensure that the new services provided by ATC-Wake meet minimum levels of safety. The ESARR 4 requirements concern the use of a quantitative risk based-approach in ATM when introducing and/or planning changes to the ATM system. Once system changes have been introduced, in the context of “safety monitoring”, it then becomes important to monitor the actual number of wake vortex encounters. Results from these wake vortex safety monitoring activities at an airport would then be fed back into the ATC-Wake Predictor in order to tailor its use to the airport, and thereby increase the performance and reliability of the ATC-Wake system.
4.2.3.6 TIME-BASED SEPARATIONS
In response to the continually increasing demand for extra capacity in the ATM system, the Time Based Separations (TBS) Project was launched by Eurocontrol as a research project in 2002. Specifically, it addresses the problem whereby, in conditions of significant headwinds, the capacity of runways where aircraft on approach are separated by current ICAO distance minima can fall considerably. The project is investigating the possibility of replacing these distance separations with suitable time separations. The project will not provide increased capacity but is intended to recover the capacity usually lost under these conditions of significant headwinds.
Today, in conditions of strong headwinds on final approach, the runway arrival capacity reduces as the ground speed decreases if no compensating increase in airspeed is made by the pilot. This is directly due to the application of standard distance separations which take longer to run with the reduced groundspeeds. To counteract this phenomenon, the time based project investigates the proposal to replace these distance separations between successive arriving aircraft by suitable time intervals chosen,

- 4-26-
nevertheless, to maintain the required level of safety. It would appear that if time separations were to be applied instead of distance separations then, in conjunction with the use of appropriate controller working methods and procedures and suitable support systems, the potential loss of runway arrival capacity could, at least partially, be recovered.
The Time-based project is nearing the completion on an initial, general proof of the concept. First phase was completed in 2005 with the analysis of the rapid prototyping study and the development of an interactive demonstrator of the time-based concept. Final feasibility report was produced in 3Q 2005. Second phase is application on specific airport. This phase will use real-time simulation to show the safety and benefits of applying the concept.
4.2.3.7 SYAGE
The Service Technique de la Navigation Aérienne (STNA) has launched a study program to remedy the wake turbulence problem, in order to improve safety and boost airport capacity. “SYAGE is designed to produce an ATC tool which, by optimising separation distances in real-time to take into account weather changes and the pairs of aircraft involved, will help controllers manage the separation distances. The architecture adopted for this study, to enable ATC services to determine whether the runways can be used safely for landing and take-off (in other words whether the turbulence generated by the previous aircraft no longer poses a threat).
The basis of this architecture is the Vortex numerical model, which enables calculation and display of how vortices behave with time. SYAGE has two databases:
- The “formation” database containing the main characteristics of the vortices created by the different aircraft types.
- The “hazard” database, which gives the danger threshold acceptable for the following aircraft.
Using the airport weather data, plus any synoptic information and nowcasting of wind direction and velocity forecasts, the ATC service would be able to determine the separation minima and optimise traffic flow. By taking account of the behaviour of the vortices in the atmosphere, vortex would have given the safe separation times.
Finally, the objective is to obtain a WVAS function, based on the VORTEX model, which could be connected either to the SMGCS, or to future DMAN (Departure Management) and AMAN (Arrival Management) architecture. This function would consist in freezing the runway in service between t1 corresponding to the time of effective take-off of a heavy aircraft, and t2, at which the controller could authorize the following medium aircraft to take-off in turn. If Td (potential danger time) is greater than Tr (time before the following aircraft reaches the potential danger area) then:
t2 = t1 + Td - Tr

- 4-27-
Figure 4-10 Definition of SYAGE
Otherwise (the potential danger time is very short) t1 = t2 and take-off clearance can be given to the second aircraft as soon as the first has actually taken off. A possible architecture for such a system is proposed in figure 5 for take-off, which will be examined initially.
So that this “WVAS Departure” function allows optimum sequencing, the wind characteristics are estimated using a forecast duration Tr. This time will never exceed 50s in the case of a follower aircraft departing from the runway threshold.
In the case of low wind (total wind less than 10 Kt. and crosswind under 5 Kt.), the current ICAO take-off rules should be retained.
The results obtained so far were promising. However, the limitations of the wind vane anemometers mean that many approximations had to be made when setting the vortex parameters.
Subsequently, equipment such as this could be installed on one of the Paris airports (in principle CDG) for testing. The objective would be to make a real-time comparison of the accuracy of the VORTEX model when an aircraft passes and simultaneous detection of the turbulence phenomenon measured by the installed anemometers.
Development of SYAGE has already stopped without developing a final product, but the wake vortex prediction model VORTEX is still being used in a few other European projects.
4.2.4 Conclusion
Phase I described technologies enabling detection and monitoring of wake vortices, two most promising prediction algorithms, weather nowcast and forecast systems and special operational procedures supported either by knowledge of the physics of the phenomena or by advanced technologies.
LIDARs are powerful tools, but in the low visibility conditions they have to be complemented by advanced radar solutions. Windline proves to be a cheap alternative for basic wake vortex measurements. P2P and P-VFS provide very good accuracy in predicting the location and strength of the vortices. Their parallel use can enhance even further the probabilistic estimation of wake vortex behaviour. Integrated wake vortex advisory systems must include a sophisticated weather sub-system providing accurate weather monitoring and forecasting. Such systems are still in the development phase and their cost will be rather very high once they reach an implementation maturity. They will have to prove to be highly

- 4-28-
accurate in order to provide sufficient safety and capacity increase. We do not expect the implementation of such systems before 2012. In the near-term, the research will be focused on the procedural changes, using only very limited (and not so expensive) technology. Operational procedures will mostly rely on the lateral displacement of the vortices out of the danger zone, rather than their decay mechanism. This implies very accurate wind measurements. Fortunately, Europe doesn’t have many airports with closely space parallel runway layout (CSPR) with high level of traffic, which is the most significant problem in USA (more than 40 CSPR layouts). NASA and FAA launched recently their wake vortex program focused on the three major development terms (near, medium and far-term). This program is very well structured and it is aptly complemented by thematic network Wakenet USA, similar to European Wakenet 2 Europe. European wake vortex research is not so clearly structured, since a few countries do their research on the national level, even though European commission recognises the importance of wake vortex problem and is regularly funding large European projects developing future solutions.

- 4-29-
4.3 Phase II – Operational survey
4.3.1 Introduction
Definition of operational requirements is an essential part of each concept development. The sooner main users get involved in the research / development phase, the more acceptable system can be developed at the end. Therefore it is very important to understand users’ (pilots and air traffic controllers) perception of the wake vortex phenomena as well as their beliefs and worries.
European researchers have been working in wake vortex domain for a long time, trying to develop reliable detection technologies, prediction models as well as integrated air traffic control wake vortex system. Since, this effort missed an active participation of users (controllers and pilots), we have decided within our research process to plan and conduct a Europe-wide operational survey with a general aim to map users’ perception of wake vortex problematic and their requirements for future developments.
4.3.2 Survey description
We assumed that users have only very basic knowledge of wake turbulence phenomena with existing differences in phenomena’s risk perception between air traffic controllers and pilots. We assumed also that differences appear as well at different sized European airports. Therefore not only air traffic controllers and pilots from top ten airports in Europe (by number of movements) were interviewed but as well controllers from “less busy” ATC centres and pilots of smaller airlines. Fifteen European APP centres and pilots from 15 European airlines have been contacted.
Pilots and controllers were asked to complete a questionnaire consisting of 38 questions (pilots) / 37 questions (controllers). The questions provided a feedback about primary data, their current knowledge of wake turbulence phenomena, incident reporting, reduced separations, requirements for provision of wake vortex info and finally their beliefs and expectations for the future research in this domain. The majority of the questions were close-ended with very few multiple-choice or essay questions.
4.3.3 Data collection
Draft versions of both questionnaires have been validated by operational experts in EEC. Trial face-to-face interviews have been conducted with several pilots and controllers. Their feedback was taken into account in producing the final version of questionnaires, which were published at the specific website in the form of HTML form. Disadvantage of this form of survey is the lack of direct contact between surveyor and subjects leading to possible misunderstandings, even though the survey design took this weakness into account by constructing the questions as clear as possible. Survey was written in English, which could possibly lead to non-understanding of question text by specific users with lower level of English knowledge.
We have contacted Heads of Approach area control (APP) centres and airline chef-pilots by phone, mail, email and we requested the completion of our survey by their staff. Staff had to be chosen randomly,

- 4-30-
without any specific age, experience or current post restrictions. Regular reminders have been sent by email, until an acceptable response rate was achieved. Once online survey was completed, results have been automatically stored in the database on the server.
The collection of the completed questionnaires was spread in 12 months horizon (June 2002 - June 2003), due to low number of responses in first couple of months. Figures 4-11 and 4-12 show the number of responses per airline / APP centre. In total, 62 pilots (men only) and 61 (56 men, 6 women) air traffic controllers (ATCOs) have responded from 14 airlines and 9 APP centres.
Airlines
012345678
Air Slova
kia
Austrian
Airli
nes
CSA
Maers
k Air
SAS
Sky E
urop
e
Slovak A
irlines
British
Airw
ays
Iberia
Air Fran
ce
Virgin Exp
ress JA
T
Edelweis
s Air
Thomas Cook A
irlines
Airline
No
of p
ilots
Figure 4-11 Number of pilot responses per airline
- 4-31-
ATC centre location
02468
101214
Vienna
Prague
Bratislava
Heathrow
AmsterdamZuric
h
BrusselsRome
Paris CDG
Location
No
of A
TCO
s
Figure 4-12 Number of ATCO responses per APP centre
4.3.4 Data analysis
This chapter presents the most important results of the survey grouped into seven dimensions while comparing answers of pilots and controllers. Processed results express solely the opinion of questioned group of users. Hence they do not represent entire community of neither controllers nor pilots, since our sample has not reached the required size for being a representative sample.
More detailed results of both questionnaires incl. question headings, graphs and tables can be found in Appendix A.
4.3.4.1 Primary data
Survey was completed by 61 ATCOs (56 men, 6 women) with an average age 38 and 62 pilots (men only) with average age 42. Sample was well balanced by age including age range from 24 to 60.
Average ATCO’s experience was 15 years of service (ranging from 2 to 35). Pilots have flown in average 8400 flight hours (ranging from 1.400 to 18.000).
Almost 90 % of ATCOs control traffic mix including all major aircraft category groups Heavy, Medium and Light and only 15 % of them are using an Arrival management tool (AMAN). We have to note here, that the last figure would have been slightly higher if the question heading used more detailed description of AMAN. In particular French controllers using AMAN called MAESTRO didn’t recognize the abbreviation and responded negatively.
All pilots fly European routes and 40 % of pilots fly also long-haul routes incl. North and South America, Asia and Africa.
- 4-32-
4.3.4.2 Knowledge of wake vortex
Both pilots and ATCOs think that their knowledge of wake turbulence physics is average, but they have only basic knowledge of wake turbulence detection and prediction technologies. They claim to have an average knowledge of special wake turbulence (WT) ATC procedures. In contrary they have very limited knowledge of current worldwide WT research programs and they expressed a wish to find out more.
It seems that pilots have gained more knowledge in the flying operation than in the basic training whereas ATCOs knowledge comes mostly from combination of basic training and ATC operation.
An alarming result proving our initial assumption can be observed in the knowledge of LIDAR technology. Majority of both users (93 %) are not familiar with most promising technology in wake turbulence research domain.
4.3.4.3 Safety
Highest hazard severity as a function of phase of flight was attributed by pilots and ATCOs to landing. Take-off phase was also rated as a high hazard (more by pilots). En-route phase of flight is perceived with very low hazard severity by pilots (95%) but 28 % of ATCOs perceive also this phase of flight as a high hazard for wake turbulence encounter. This result was probably caused by introduction of Reduced Vertical Separation Minima (RVSM) which recently led to increased number of en-route incidents.
An interesting result was obtained in the question related to current ICAO separation standards. 48 % of ATCOs think that current separations are safe but too conservative (waste of capacity), whereas 90 % of pilots perceive the standard only as a safe, 8% as safe but too conservative and 2 % (1 pilot) even as unsafe separation standard. Hence an obvious support in wake turbulence research can be expected by ATCOs. Pilots are simply more safety concerned.
Almost 75 % of respondents have already heard about wake turbulence related accident in IFR operation.
When we asked how many wake turbulence related incidents do occur per year at the local airport, the answer was quit surprising, since 19 % ATCOs and 25 % pilots answered with value zero. Average number of incidents was 31 (ATCOs) and 36 (pilots) with medians 10 and 12.
Both pilots and ATCOs recognize the highest importance in detecting wind shear, followed by wake turbulence. Hazard with lowest importance for pilots is bird strike and for ATCOs volcanic ashes.
4.3.4.4 Wake turbulence encounters - Incident reporting
Our survey shows, that all pilots (100%) have already encountered a wake of preceding aircraft, but there are only 21 % of pilots who always report such encounter; other pilots do report either very often, or frequently and only negligible number (1 pilot) never gives a report. Only 8 % of ATCOs receives very seldom or never a wake turbulence encounter report from pilot, the others receive always, very often or frequently.
An alarming result proving our expectations is the fact, that neither airlines nor ANSPs collect wake turbulence encounter reports in a specific database (based on 73 % ATCOs, 65 % pilots).
- 4-33-
More than a half (56 %) of pilots finds very difficult to distinguish wake turbulence encounter from atmospheric turbulence, even though majority of the pilots (85%) have been trained how to react with such encounter.
Meteo service can inform users about higher risk of wake turbulence encounter caused by current weather. More than 60 % of pilots get this type of information into the cockpit, but 82 % ATCOs never get such message.
Almost 70 % of both pilots and ATCOs consider very weak cross-wind with strength 0 – 3 kt as the worst case scenario for wake turbulence encounter at single runway. Recent research shows that this value is not the worst case, since the vortices are not getting stronger; they just persist longer, while sinking. A wind with strength 3-6 kt empowers one of the vortices which might cause more severe upset. This wind is still not strong enough to transport vortices laterally completely out of the glide slope.
4.3.4.5 Reduced separations
One half of ATCOs regularly apply current ICAO separations, the other half applies ICAO separations with local changes. More than 60% of pilots think that ICAO separations are applied and 40 % counts with local changes in separations.
Fifty percent of pilots think that it’s only them who ask for visual approach and reduced separation on final. Fifty-two percent of ATCOs think that both of them (ATCOs & pilots) usually suggest visual approach and reduced separation.
More than a half (65 %) ATCOs would apply reduced wake turbulence separations in good visibility conditions and with crosswind value more than 15 knots. Sixteen percent would apply reduced separation under strong headwind and 17 % would never apply reduced separations. Most of the pilots (85%) would ask for reduced separations in good visibility conditions and with crosswind value more than 10 knots. Only 6 % would do it under strong headwind and only 1 pilot would never ask for it.
Low visibility conditions, calm wind and specific aircraft pair are three almost equal reasons for not reducing separations (for both pilots and ATCOs). Three pilots would not ask for reduced separations in case of tailwind.
In case of reduced wake turbulence separations, both groups of users agree to have a common responsibility for maintaining the separation.
4.3.4.6 Provision of wake vortex info – users’ requirements
Most of the ATCOs (85%) and pilots (92%) would like to have wake turbulence (WT) visualization at the controller working position (CWP) and in the cockpit. They think (97% ATCOs, 79% pilots), that WT information is important for both of them.
More than a half of ATCOs (54%) prefer combined WT information (detection and prediction) and 31 % even asks for automated integrated WT system. Same percentage of pilots as ATCOs prefer combined WT information in their cockpits, but 40 % of pilots prefers information only about the detected wake turbulence.
- 4-34-
Fifteen percent of ATCOs and only 11 % of pilots would like to have the WT info on separated display; the others prefer integrated solution to their current working environment.
When discussing a possible human machine interface (HMI), 49 % of ATCOs prefer simple vector representing danger separation, 33 % would choose a triangle danger area behind an aircraft and 18 % would go for a full 3D visualization. Pilots, in contrary prefer mostly full 3D visualization (45 %), 26 % would choose triangle and 29 % prefer a simple vector.
Three quarters of respondents of both groups think that integration of WT info into their working environment will be rather difficult.
Slightly more than a half of ATCOs (56%) would like to have prediction of wake turbulence decay (time) whereas the rest of ATCOs would prefer prediction of transport of the vortices out of the glide slope.
Pilots are not so much concerned by increased workload caused by new equipment (WT info) and only 45 % think that their workload will be a bit higher. In contrary 69 % of ATCOs think that workload will be a bit higher and 5 % (3 controllers) even thinks that their workload would be much higher.
Both groups of users would feel safer with provided WT info, even though pilots with a higher percentage than controllers (94% vs. 84%).
4.3.4.7 Users’ beliefs
A bit more than half of pilots (55%) and most of the controllers (87%) think that ICAO wake turbulence categorization (Heavy, Medium, Light) should be changed and harmonised worldwide.
Most of users (97 % ATCOs, 98% pilots) believe, that integration of WT info can enhance flight safety. Pilots are a bit more optimistic than controllers when believing in airport capacity enhancements thanks to WT info integration (71% pilots, 61 % ATCOs). Finally almost three quarters of users (72% ATCOs and 81% pilots) believe in enhancing both capacity and safety at the same time, thanks to integration of WT info.
4.3.5 Conclusion
This chapter presented an operational survey focused on perception of wake turbulence phenomena. Its major aim was to map users’ (pilots and air traffic controllers) understanding of wake vortex problem, their knowledge of physics, technology, impact on safety, incident reporting, their requirements and valuable beliefs for future developments.
Among the most interesting results we might mention:
Ø Users are supportive in wake vortex research and they definitely would like to have WT info integrated in their working environment
Ø The WT info should be provided in the automated and integrated form, not leading to increased workload, but providing an extra feature enabling to increase capacity while respecting current safety levels

- 4-35-
Ø Users don’t know a lot about current worldwide research in this domain; in particular they are not familiar at all with LIDAR technology. Their knowledge of physics of the phenomena is very basic and is very much based on their working experience
Ø Both pilots and controllers would like to see ICAO wake turbulence categories changed and harmonized worldwide, even though they do believe in the current high level of safety
Ø Wind shear and wake turbulence are two hazards with highest level of detection importance for both pilots and controllers
Ø Users do feel current airport capacity pressure and they are willing to cooperate with advanced technologies in order to reduce separations
Ø Many controllers in the current practice are not in favour of reducing separations below ICAO recommended separations, even though they would support the future solutions if it was legally approved
Ø ICAO 4444 can be applied without problems at less busy airports, but controllers at airports like London Heathrow are forced to use local changes in the separation matrix and in the way of managing very dense traffic with tighter separations
Ø Alarming result is related to incident reporting, where many improvements have to be done in the future
Ø Pilots should be trained to distinguish wake turbulence encounters from atmospheric turbulence, which might be a difficult exercise.
Processed results express solely the opinion of questioned group of users. Hence they do not represent entire community of neither controllers nor pilots. Despite the fact, outcome of the survey is very valuable source of information and feedback, which might be used in many other wake vortex related projects or studies. Complete results (graphs) of both questionnaires can be found in Appendix A.

- 4-36-
4.4 Phase III – Capacity estimation
4.4.1 Introduction
Objective of capacity estimation part of this thesis is to evaluate potential impact of introduction of dynamic wake turbulence separations with specific reference to airport delay and runway throughput. We introduce one particular concept of dynamic separations. This concept is simulated and compared to current ICAO standards at three busiest European airports: Paris Charles de Gaulle (CDG), Frankfurt am Main (FRA) and London Heathrow (LHR). Scenarios were simulated in sophisticated Total Airspace Airport Modeller3 (TAAM®) version 2.3.
Results of this study can assist in more advanced future airport capacity, delay and safety studies focused on validation or implementation of new wake vortex operational concepts and procedures.
4.4.2 Definition of scenarios
In general scenario is associated of one traffic sample, one environment / layout airport, one mode of separation and procedures. For comparative measures different scenarios have to represent exactly the same situation in terms of airport design and airport configuration, with identical procedures. The main differences between the various scenarios are separation mode and traffic density.
As part of this investigation we developed twenty-one different scenarios. Starting from a basic scenario using ICAO separations and current traffic density up to a scenario with dynamic separations and cloned future traffic sample.
Seven scenarios were simulated in mixed mode (arrivals + departures) for each of the three airports. By using the arrival / departure sequencing rules we have enforced application of separations under following 3 modes:
Ø ICAO separations (scenario ICAO)
Ø Reduced wake vortex separations (R-BT, R-FT)
Ø Dynamic wake vortex separations with transitions between ICAO and Reduced mode (BT1, BT2, FT1, FT2) = our main focus
Table 4-2 shows the ICAO and Reduced separation matrix used in the simulation. In our study, we did not take into account the possibility of reduction of departure separations under ICAO up to 1 min in case of aircraft flying on tracks diverging by at least 45 degrees immediately after take-off. However this rule is commonly applied at London Heathrow airport. Therefore the results of our fast-time simulation at LHR might be less realistic. At Frankfurt airport, we did not simulate segregated approaches on the closely space parallel runways (25L, 25R) due to malfunction of the particular feature in the model. We also neglected the usage of HALS/DTOP (Section 4.2.3.2) during the simulated day at FRA. The most important factor for us was the difference between any static (either ICAO or REDUCED) separation 3 Preston Aviation Solutions – A Boeing Company

- 4-37-
mode and dynamic mode (BT1, BT2, FT1, FT2). Reduced mode proposed by ATC-WAKE project (as described in Section 4.2.3.5) in their transition phase enforces one single value of separation for entire sequence of aircraft on approach (e.g. 3NM) and it uses the same principle for departure for certain “static” period of time. It neglects the type of aircraft while assuming almost homogeneous fleet mix and positive meteo conditions. Based on our findings in understanding of the physics of wake vortices, results of our operational survey (change and harmonization of separation standards needed) and hazard evaluation we proposed in our simulation supposable less efficient (from runway throughput increase point of view), hence more conservative but safer reduced separation mode. Proposed concept still does distinguish particular aircraft in regard to the wake category. Especially medium aircraft from lower band of weight category (medium light in TAAM) are at higher risk when they follow heavy or upper-medium aircraft.
Arrivals (NM) Departure (min)
Leader Follower ICAO Reduced ICAO Reduced
Heavy 4 3 2 1
Heavy Medium 5 4 3 2
Light 6 5 3 2
Heavy 3 2,5 2 1
Medium Medium 3 2,5 2 1
Light 5 4 3 2
Heavy 3 2,5 2 1
Light Medium 3 2,5 2 1
L 3 2,5 2 1
Table 4-2 Separation matrix – ICAO vs. Reduced separations
As depicted in the Figure 4-13, dynamic separation modes (BT1, BT2, FT1, FT2) have several transitions during the day between ICAO and REDUCED modes. Depending on the wake category, aircraft have to apply the separations shown in Table 4-2 for a specific period of time. We have defined two dynamic scenarios for current traffic (BT1, BT2) and additional two for future (cloned) traffic samples (FT1, FT2). After careful analysis of peak times during the day at all three airports, we have created two scenarios reflecting the positive weather impact (allowing REDUCED mode in peak times) and negative weather impact (enforcing ICAO mode in peak times).

- 4-38-
CDG_BT1 CDG_BT2 CDG_FT1 CDG_FT2Time Mode Time Mode Time Mode Time Mode
< 0510 ICAO <0500 ICAO < 0510 ICAO <0540 REDUCED0510-0750 REDUCED 0500-0700 REDUCED 0510-0750 REDUCED 0540-0655 ICAO0750-1010 ICAO 0700-0910 ICAO 0750-1010 ICAO 0655-0920 REDUCED1010-1520 REDUCED 0910-1200 REDUCED 1010-1520 REDUCED 0920-1150 ICAO1520-1700 ICAO 1200-1540 ICAO 1520-1700 ICAO 1150-1540 REDUCED1700-2015 REDUCED 1540-1845 REDUCED 1700-2015 REDUCED 1540-1845 ICAO2015-2400 ICAO 1845-2400 ICAO 2015-2400 ICAO 1845-2100 REDUCED
2100-2400 ICAO
LHR_BT1 LHR_BT2 LHR_FT1 LHR_FT2Time Mode Time Mode Time Mode Time Mode<0530 ICAO <0740 ICAO <0530 ICAO <0740 ICAO
0530-1330 REDUCED 0740-1530 REDUCED 0530-1330 REDUCED 0740-1530 REDUCED1330-1520 ICAO 1530-1810 ICAO 1330-1520 ICAO 1530-1810 ICAO1520-1930 REDUCED 1810-2120 REDUCED 1520-1930 REDUCED 1810-2120 REDUCED1930-2400 ICAO 2120-2400 ICAO 1930-2400 ICAO 2120-2400 ICAO
FRA_BT1 FRA_BT2 FRA_FT1 FRA_FT2Time Mode Time Mode Time Mode Time Mode
< 0510 ICAO <0500 ICAO < 0510 ICAO <0500 ICAO0510-0840 REDUCED 0500-0700 REDUCED 0510-0840 REDUCED 0500-0700 REDUCED0840-1040 ICAO 0700-0910 ICAO 0840-1040 ICAO 0700-0910 ICAO1040-1520 REDUCED 0910-1200 REDUCED 1040-1520 REDUCED 0910-1200 REDUCED1520-1700 ICAO 1200-1540 ICAO 1520-1700 ICAO 1200-1540 ICAO1700-2015 REDUCED 1540-1845 REDUCED 1700-2015 REDUCED 1540-1845 REDUCED2015-2400 ICAO 1845-2400 ICAO 2015-2400 ICAO 1845-2400 ICAO
Figure 4-13 Transition periods in scenarios with dynamic separation mode
4.4.3 Metrics measured
4.4.3.1 Runway throughput
We suppose, that application of dynamic wake vortex separation has the potential to increase runway throughput. Runway throughput indicates the average number of movements that can be performed on all runways in one hour (N) in the presence of continuous demand, while adhering to all the separation requirements imposed by the air traffic management. As indicators of runway throughput performance we introduce the average number of movements per hour (NAVE) as well as the hourly peak value (NMAX), but mostly the potential percentage of hourly runway throughput increase (N∆) in the evening peak-time (15h00 – 21h00).
4.4.3.2 Delay
Cumulative airport delay (D) per hour is calculated as a sum of runway delay (Dr), sequencing delay (Ds), taxiway (Dt) and gate delays (Dg) in the particular hour.
D = Dr + Ds + Dt + Dg (sec)

- 4-39-
Average airport delay per aircraft (DA/C) is equal to sum of cumulative airport delays per hour divided by total number of movements in the particular time period.
24
i=1A/C 24
i=1
1 Di60D = (min)
Ni
∗∑
∑
We have simulated 24 hours of traffic but due to lack of high demand at certain periods of the day, we calculate the average runway throughput only with values between 05h00 – 22h00 (17 hours of traffic).
4.4.4 Data input
4.4.4.1 Traffic sample
Traffic samples used in fast-time simulation trials are extracted from actual real-life traffic plans and recordings. In such a case, it is vitally important that the selected traffic samples are carefully chosen. To ensure that simulation results are sound and that the model represents reality, the traffic sample has been collected from the Eurocontrol Central Flow Management Unit (CFMU). The reference day is an average summer day and has been chosen to insure that the traffic sample is “busy” enough to guarantee the possibility of running scenarios allowing the application of dynamic separations. The selected day is the 25th of July 2003 (00h00-24h00). Traffic samples contain following data:
Ø Callsign
Ø Departure airport
Ø Departure time
Ø Requested flight level
Ø Aircraft type
Ø Destination airport
Arrival time was automatically calculated by IDIS (TAAM input sub-tool). We have chosen three busy European airports: Paris Charles de Gaulle (CDG), Frankfurt am Main (FRA) and London Heathrow (LHR) with inbound and outbound flows. CDG traffic sample includes 1561 flights, FRA 1359 flights and LHR 1341 flights. Comparison of scheduled traffic at all 3 airports is shown in the Figure 4-14 and distribution of aircraft types in the Figure 4-15. These traffic samples are used in the base case scenarios representing current traffic loads. Base case scenarios are compared to the future traffic samples - being cloned from the base case in order to represent forecasted traffic with levels of the year 2010 (35% more flights than 2003), when we expect much higher capacity benefit resulting from dynamic wake vortex separations. Baseline growth from STATFOR Long-term forecast 2010-2025 was averaged by 2010 traffic forecasts of Airbus and Boeing before running the cloning mechanism in TAAM (STATFOR, 2004). Cloning algorithm was run on each hour of traffic sample separately, in order to maintain similar peak times in the future schedule. If we run the cloning only once on the whole schedule, algorithm would

- 4-40-
have the tendency to smoothen the traffic - peaks and drops would be lost. This is unlikely to happen in the real world, since airports will still cope with several peak times a day even in the future.
Scheduled traffic LHR vs. CDG vs. FRA
0
20
40
60
80
100
120
1 3 5 7 9 11 13 15 17 19 21 23Time
Num
ber o
f mov
emen
ts p
er
hour
LHR total FRA total CDG total
Figure 4-14 Scheduled traffic (arrivals + departures) at LHR, FRA and CDG
Traffic sample - aircraft mix
20
3726,5
80
6373
0 0 0,50
102030405060708090
CDG LHR FRAAirport
% o
f tra
ffic
Heavy Medium Light
Figure 4-15 Aircraft mix - Heavy, Medium, Light

- 4-41-
4.4.4.2 Traffic orientation
The traffic orientation implies no restriction. The traffic follows the shortest route available between the origin SID (Standard Instrument Departure route) and the destination STAR (STandard Arrival Route) of each particular flight, without taking into account flow constraints of any kind. Out of the TMA (Terminal Manoeuvring Area) standard horizontal and vertical separations have been applied between aircraft.
4.4.4.3 Airport layout and usage
The runway usage of the airports could change during the day according to wind direction, but for this study one configuration is considered sufficient to obtain valid and generic results. Runways and taxiways have been used in accordance to current common practices as described in Aeronautical Information Publications (AIPs). Schedule did not include gate details and therefore an automatic gate allocation was used in the simulation. Blocks of gates were allocated to airlines respecting reality and algorithm has allocated free gates in the blocks in the alphabetical order. Airport layouts have been designed in special graphical sub-tool of TAAM – GTOOL, based on the Jeppessen airport layout maps, with high level of detail including all runways, taxiways, aprons, terminals, gates and hangars. Following figures depict simulated airport layouts.
Figure 4-16 Paris Charles de Gaulle airport layout created in TAAM
- 4-42-
Figure 4-17 Frankfurt am Main airport layout created in TAAM
Figure 4-18 London Heathrow airport layout created in TAAM

- 4-43-
4.4.4.4 Ground movements
The effect of the wake vortex is considered around airports and even if the contribution given by transportation does not influence the values of the parameters, taxiways and gates are taken into account (where applicable) to give a more realistic view of the scenario. Ground movements are neglected only in future traffic scenarios (FT1, FT2 and FT-R) at LHR and FRA airports, where we suppose the current infrastructure and operating modes simply cannot easily accommodate such level of traffic.
4.4.4.5 Airspace
Waypoints were defined by its geographical location (latitude and longitude) and name. We have also specified for each waypoint the type of navaid (VOR, NDB, DME), if it is a holding point or not. Holding stack parameters have been also defined based on the current operational procedures at all airports. However, from current LHR practices we neglected the aircraft batching method used at exiting stacks and transition from distance based separation into time-based separation on the glideslope (after 4DME).
TMA & En-Route airspace is normally divided into sectors, but in our simulation the main focus of the study remained on the ground – runway throughput and airport delay. Hence we have used only a limited number of sectors: three TMA sectors around the airports and one extra large en-route sector covering the area of all three airports.
4.4.4.6 Aircraft performance
The following data regarding aircraft characteristics had to be analyzed in the phase of the preparation of the simulation: aircraft type, haul, wake turbulence category, classification, range, maximum take off weight. Aircraft performance data of the models used in this study are close to real life performances. However some discrepancies might appear between the results of the analytical and fast-time studies.
4.4.5 Model validation & limitations
The design process of the model was constantly discussed with operational experts of Eurocontrol Experimental Centre (former air traffic controllers from selected airports and simulation experts) for validation purposes. Several trials of scenarios have been conducted; inaccurate situations and bugs were reported and fixed. Technical support from Preston Aviation Solutions (TAAM developer) was also used.
Base case scenarios, once approved by operational experts, were validated by analytical spreadsheet modelling and results were compared to historical data observed at the specific airports.
TAAM was not designed for research purposes. It can calibrate an airport with a very good level of accuracy. Nevertheless, some elements of the simulations could be difficult to model and may lead to side factors that could affect the full achievement of the objectives. Initially planned dynamic separation concept (not using aircraft wake turbulence categories) could have not been simulated, due to insufficient ability to run the model against its predefined logic of handling separations. We encountered also a serious problem with configuring the Frankfurt’s closely spaced parallel runway staggered approaches. This function was present in the model, but it was not working properly. We were not able to use it in the dedicated timeframe of our study. Achieved separations at FRA were less realistic, which influenced

- 4-44-
I-BT R-BT BT1 BT2 R-FT FT1 FT2CDG - Nmax 96 108 107 111 138 150 136LHR - Nmax 68 90 96 92 101 104 98FRA - Nmax 84 87 84 88 105 105 102
accurate fulfilling of the objective – measuring the potential runway throughput increase and delay reductions by introduction of the dynamic separations. Current London Heathrow practices could not have been entirely simulated. We finally didn’t perform aircraft batching in holding stack exit procedure, nor the transition from distance spaced separation to time-based separation on the glideslope after 4DME. However, our main goal was to compare static and dynamic concepts of separations and above mentioned matters have a little effect on that.
4.4.6 Analysis of the results
At the end of each of 21 scenarios simulation runs, using TAAM Reporter (sub-tool of TAAM for simulation output processing and analysis) the following outputs were recorded and analyzed:
Ø Runway movements per hour
Ø Runway delays per hour and aircraft
Excel was used for post-processing of specific TAAM outputs. Additional analysis like relative inter-arrival time calculation, runway occupancy time, sequencing actions, and detailed delay distributions was also conducted and can be found in Annex B.
4.4.6.1 Runway throughput
Seven scenarios run at each airport confirmed our hypothesis about too conservative ICAO wake turbulence standards – limiting airport capacity. ICAO scenarios reached the lowest maximum number of movements per hour (Nmax), 96 at CDG, 68 at LHR and 84 at FRA. LHR would perform much better in this scenario if 1min departure separation was applied (as it is allowed in ICAO 4444 document for single runway and diverging tracks by at least 45 degrees). Due to several limitations (mentioned in Subsection 4.4.5) in simulating LHR airport, we will consider performance achieved in reduced scenario (R-BT) as a base case scenario, which performed only a bit better than declared maximum hourly throughput (86 movements per hour) in summer 2003 (Hunter and Simonsson, 2005). Dynamic scenarios BT1, BT2, FT1 and FT2 were the key scenarios in this study and the result is very promising. Table 4-3 shows the comparison of runways’ throughput peaks per day at the airports under various scenarios. Maximum hourly number of movements climbed up to 111 at CDG, 96 movements at LHR and 88 at FRA with baseline traffic sample.
Table 4-3 Maximum number of movements achieved in specific scenarios
Figures 4-19, 4-20 and 4-21 illustrate comparison of runways’ throughput peaks (Nmax) and average number of runway movements (Nave) per day at the airports under various scenarios.

- 4-45-
Paris CDG - RWY throughput
80
80
80
79
102
101
98
96
108
107
111
138
150
136
0 50 100 150 200
ICAO BT
Reduced BT
BT1
BT2
Reduced FT
FT1
FT2
Scen
ario
Number of movements (Arr+Dep)
Nave Nmax
Figure 4-19 Paris CDG - average and maximum hourly RWY throughput
London Heathrow - RWY throughput
90
92
101
104
57
6968
69
8881
80
68
96
98
0 20 40 60 80 100 120
ICAO BT
Reduced BT
BT1
BT2
Reduced FT
FT1
FT2
Scen
ario
Number of movements per hour (Arr+Dep)
Nave Nmax
Figure 4-20 LHR - average and maximum hourly RWY throughput
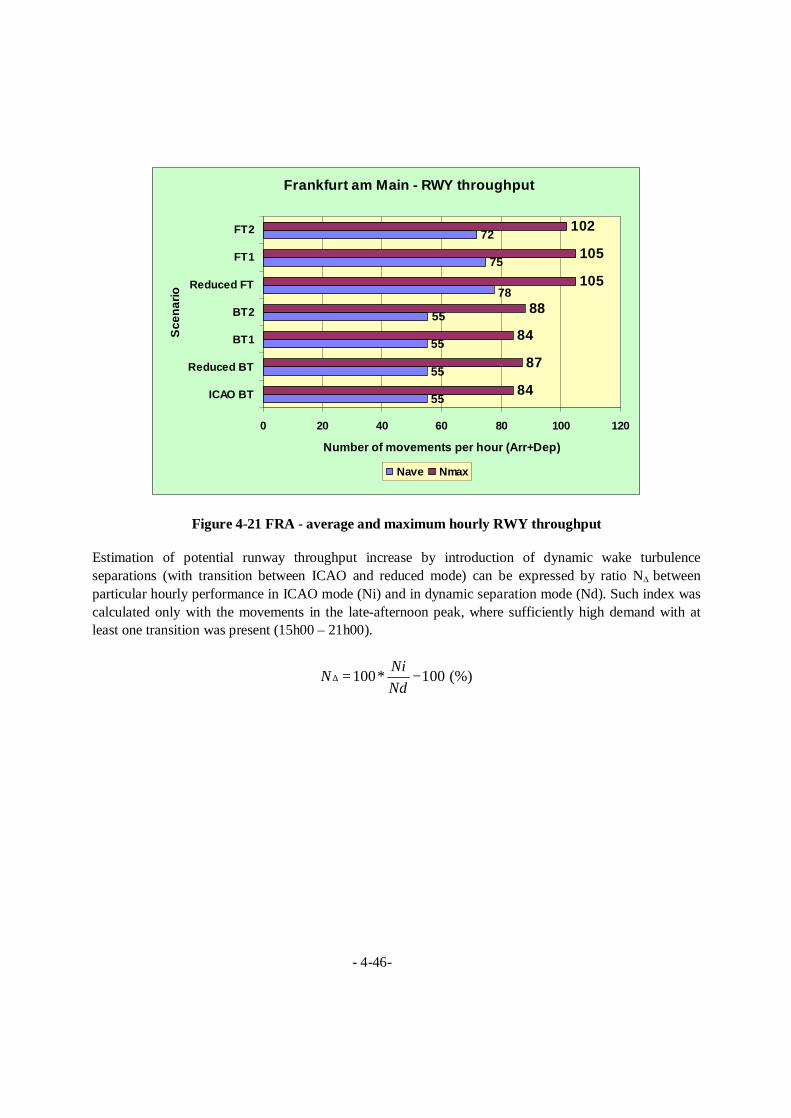
- 4-46-
Frankfurt am Main - RWY throughput
55
55
55
55
75
72
84
87
84
88
105
105
102
78
0 20 40 60 80 100 120
ICAO BT
Reduced BT
BT1
BT2
Reduced FT
FT1
FT2
Sce
nario
Number of movements per hour (Arr+Dep)
Nave Nmax
Figure 4-21 FRA - average and maximum hourly RWY throughput
Estimation of potential runway throughput increase by introduction of dynamic wake turbulence separations (with transition between ICAO and reduced mode) can be expressed by ratio N∆ between particular hourly performance in ICAO mode (Ni) and in dynamic separation mode (Nd). Such index was calculated only with the movements in the late-afternoon peak, where sufficiently high demand with at least one transition was present (15h00 – 21h00).
100* 100 (%)NiNNd
∆ = −
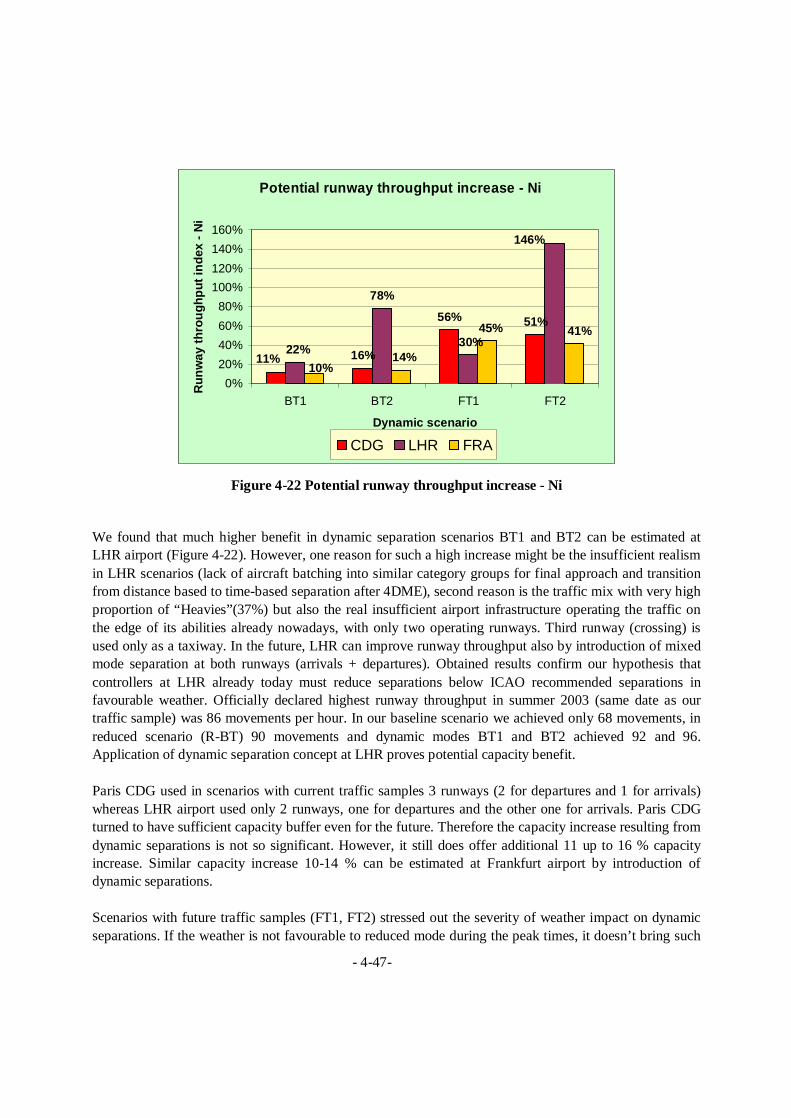
- 4-47-
Potential runway throughput increase - Ni
16%
56% 51%
78%
11%30%
146%
22%10%
14%
45% 41%
0%20%40%60%80%
100%120%140%160%
BT1 BT2 FT1 FT2
Dynamic scenario
Run
way
thro
ughp
ut in
dex
- Ni
CDG LHR FRA
Figure 4-22 Potential runway throughput increase - Ni
We found that much higher benefit in dynamic separation scenarios BT1 and BT2 can be estimated at LHR airport (Figure 4-22). However, one reason for such a high increase might be the insufficient realism in LHR scenarios (lack of aircraft batching into similar category groups for final approach and transition from distance based to time-based separation after 4DME), second reason is the traffic mix with very high proportion of “Heavies”(37%) but also the real insufficient airport infrastructure operating the traffic on the edge of its abilities already nowadays, with only two operating runways. Third runway (crossing) is used only as a taxiway. In the future, LHR can improve runway throughput also by introduction of mixed mode separation at both runways (arrivals + departures). Obtained results confirm our hypothesis that controllers at LHR already today must reduce separations below ICAO recommended separations in favourable weather. Officially declared highest runway throughput in summer 2003 (same date as our traffic sample) was 86 movements per hour. In our baseline scenario we achieved only 68 movements, in reduced scenario (R-BT) 90 movements and dynamic modes BT1 and BT2 achieved 92 and 96. Application of dynamic separation concept at LHR proves potential capacity benefit. Paris CDG used in scenarios with current traffic samples 3 runways (2 for departures and 1 for arrivals) whereas LHR airport used only 2 runways, one for departures and the other one for arrivals. Paris CDG turned to have sufficient capacity buffer even for the future. Therefore the capacity increase resulting from dynamic separations is not so significant. However, it still does offer additional 11 up to 16 % capacity increase. Similar capacity increase 10-14 % can be estimated at Frankfurt airport by introduction of dynamic separations. Scenarios with future traffic samples (FT1, FT2) stressed out the severity of weather impact on dynamic separations. If the weather is not favourable to reduced mode during the peak times, it doesn’t bring such

- 4-48-
high benefit. Future scenarios at CDG used already all four runways (2 for departures and 2 for arrivals). 35% traffic increase compared to 2003 traffic level still doesn’t cause congestion at Paris CDG airport. On the other hand, Heathrow and Frankfurt will definitely have to improve the airport infrastructure, preferably by adding a new parallel runway. Their current mode of operation doesn’t provide sufficient capacity buffer for the future, aircraft would have quit significant delays (departure queuing or arriving).
4.4.6.2 Delay
Dynamic separations proved the possibility of significant reduction of average delay per aircraft. Strictly applied ICAO separations in baseline scenario caused very big delay especially at LHR airport. LHR with 2 and 3 minutes departure separations and with only one departure runway was operating the traffic with significant runway and taxing delay, caused by insufficient infrastructure. 130 minutes delay per aircraft (mostly generated by departures) is not really acceptable and realistic. Airport encountered serious congestion problems in baseline scenario already in the AM hours. As mentioned earlier, the real current operational performance of the airport lies somewhere between our scenarios I-BT and R-BT. LHR most likely operates the traffic with reduced departure separations up to 1 minute (or less) and arrival separation up to the radar minimum 2.5 NM, and application of aircraft batching (creating an optimal sequence of Heavies and Mediums). Aircraft fleet mix at LHR is even more critical than fleet mix at CDG. LHR has 63% Mediums and 37 % Heavies whereas CDG operates 80 % Mediums and only 20 % Heavies.
I-BT R-BT BT1 BT2 R-FT FT1 FT2CDG - Da/c 24 5 9 17 7 11 18LHR - Da/c 130 2 12 10 11 45 52FRA - Da/c 9 4 8 26 24 64 59
Table 4-4 Average airport delay per aircraft (min) in various scenarios
Table 4-4 shows the numerical overview of average delay per aircraft (Da/c) for each specific scenario at the airports. Application of dynamic separation rules confirmed our hypothesis – reduction of average airport delay per aircraft. However, as we can see in scenario BT2, overall performance is very much dependent on the number of transitions occurred and their timing. If ICAO modes have to be applied in most of the peak hours, generated delays may spread also to reduced mode and it takes longer time to dissipate. The worst case occurred at Frankfurt airport, where extremely high average delay occurred in scenario BT2. ICAO mode was applied from 18h45 until the end of the day, hence it affected the entire evening peak. Until 18h45 the average delay per aircraft was still below ICAO Da/c, but it started to build up very quickly. The airport became congested in very short period of the time. This happened mostly due to insufficient infrastructure and not very well optimized taxing rules in our simulation (departure queue blocking arrivals from taxing to gates). Non-optimal runway allocation (especially for departures) may have contributed as well. Controllers have the opportunity to make decisions real-time, based on the current situation. Our model, respected pre-assigned runways for all flights. Further tuning of this scenario would enable to achieve better result and prove the benefit of dynamic separation rules also in this case.
Figures 4-23, 4-24 and 4-25 illustrate the relationship between average airport delay per aircraft (Da/c), mode of separation and the maximum hourly number of movements at the airports (Nmax).
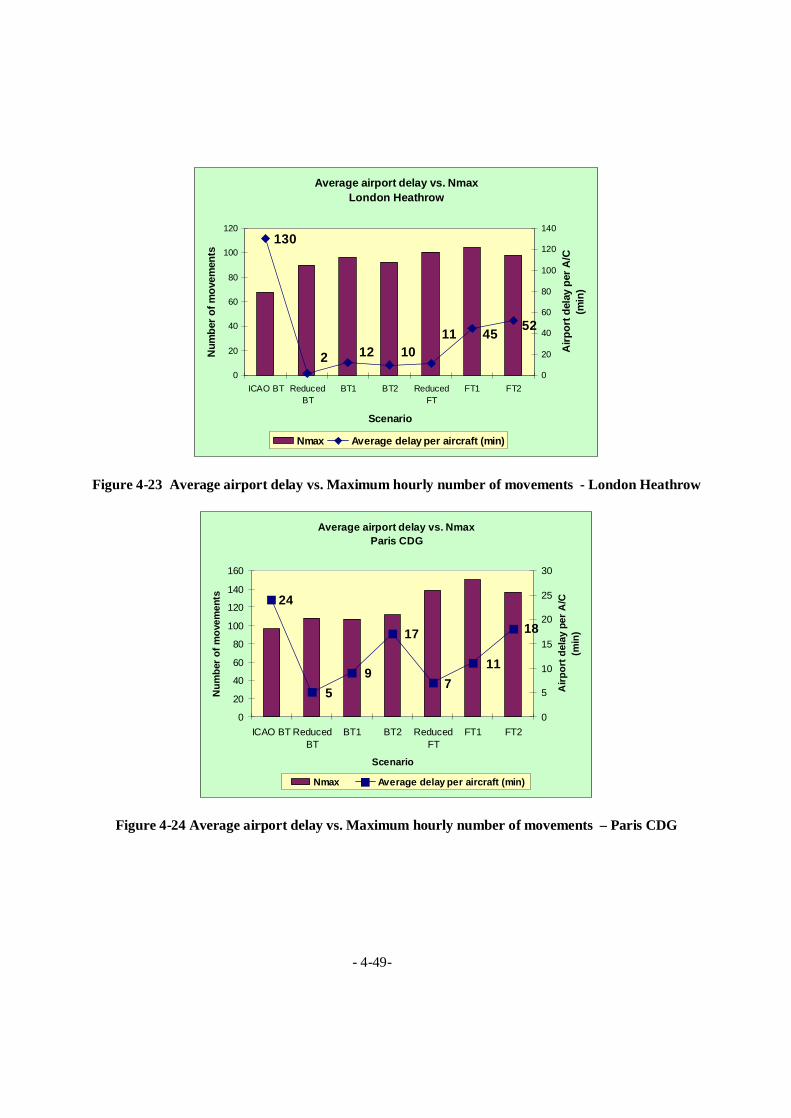
- 4-49-
Average airport delay vs. Nmax London Heathrow
130
52451110122
0
20
40
60
80
100
120
ICAO BT ReducedBT
BT1 BT2 ReducedFT
FT1 FT2
Scenario
Num
ber o
f mov
emen
ts
0
20
40
60
80
100
120
140
Airp
ort d
elay
per
A/C
(m
in)
Nmax Average delay per aircraft (min)
Figure 4-23 Average airport delay vs. Maximum hourly number of movements - London Heathrow
Average airport delay vs. NmaxParis CDG
24
18
117
17
95
0
20
40
60
80
100
120
140
160
ICAO BT ReducedBT
BT1 BT2 ReducedFT
FT1 FT2
Scenario
Num
ber o
f mov
emen
ts
0
5
10
15
20
25
30A
irpor
t del
ay p
er A
/C
(min
)
Nmax Average delay per aircraft (min)
Figure 4-24 Average airport delay vs. Maximum hourly number of movements – Paris CDG

- 4-50-
Average airport delay vs. Nmax - Frankfurt
5964
2426
849
0
20
40
60
80
100
120
ICAO BT ReducedBT
BT1 BT2 ReducedFT
FT1 FT2
Scenario
Num
ber o
f
mov
emen
ts
0
10
20
30
40
50
60
70
Airp
ort d
elay
per
A/C
(min
)
Nmax Average delay per aircraft (min)
Figure 4-25 Average airport delay vs. Maximum hourly number of movements –
Frankfurt am Main
As illustrated in previous three figures, we can observe that average delay per aircraft was reduced by application of dynamic separation concept, especially in scenario BT1 (Reduced mode applied in peak times). Weather has a significant impact on efficiency of dynamic separations, what can be observed in scenario BT2 (ICAO mode applied in peak times), where delay reduction was smaller when compared to BT1. Traffic in future scenarios FT1 and FT2 generated already significant delays at airport LHR and FRA. These airports will have to change their current mode of operation (introduction of mixed mode at LHR and HALS/DTOP at FRA) or simply improve their infrastructure (building new runway), if they want to manage such high amount of traffic with acceptable level of the average delay. Proper functionality of staggered parallel approach procedure at Frankfurt airport might have improved the overall performance achieved in our simulation. As mentioned earlier, in our timeframe we were unable to find an alternative work-around for fixing this shortcoming. CDG proved to have very good runway layout and spare capacity even for the future (2010). Average airport delays per aircraft reached in dynamic scenarios only 11 and 18 minutes. Following Figure 4-27, 4-28 and 4-29 depict the comparison of daily distribution of average airport delay per aircraft (Da/c) in two scenarios – static ICAO separation mode and dynamic mode BT1. We can observe, that scenario with dynamic separation concept BT1 performed better (overall reduction of airport delay) than baseline ICAO scenario throughout the day. Unexpected increase of airport delay (especially runway delay component, as depicted in Appendix B) in BT1 scenario at FRA in the evening peak can be explained by insufficient realism of exact runway allocation and mal-function of staggered approach procedure in simulation, leading to very long departure queues at parallel runways (25L, 25R).

- 4-51-
Averaged delay per aircraft ICAO vs. BT1Paris CDG
0102030405060
0:00:00
2:00:00
4:00:00
6:00:00
8:00:00
10:00:00
12:00:00
14:00:00
16:00:00
18:00:00
20:00:00
22:00:00
0:00:00
Time
Ave
rage
del
ay p
er
airc
raft
(Da/
c)
ICAO BT1
Figure 4-26 Averaged delay per aircraft ICAO vs. BT1 at Paris CDG
Average delay per aircraft ICAO vs. BT1London Heathrow
0100
200
300
400
500
600
0:00:00
2:00:00
4:00:00
6:00:00
8:00:00
10:00:00
12:00:00
14:00:00
16:00:00
18:00:00
20:00:00
22:00:00
0:00:00
Time
Ave
rage
del
ay p
er a
ircra
ft (D
a/c)
ICAO BT1
Figure 4-27 Averaged delay per aircraft ICAO vs. BT1 at London Heathrow
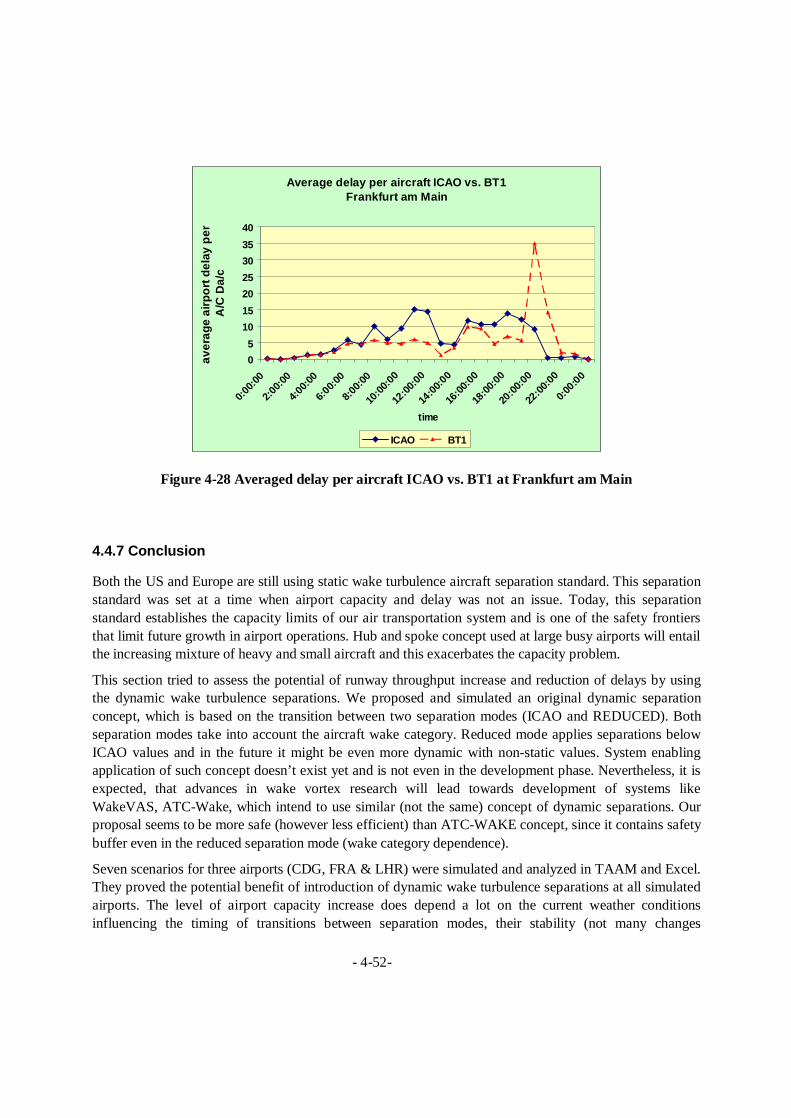
- 4-52-
Average delay per aircraft ICAO vs. BT1Frankfurt am Main
05
10152025303540
0:00:0
0
2:00:0
0
4:00:0
0
6:00:0
0
8:00:0
0
10:00
:00
12:00
:00
14:00
:00
16:00
:00
18:00
:00
20:00
:00
22:00
:00
0:00
:00
time
aver
age
airp
ort d
elay
per
A
/C D
a/c
ICAO BT1
Figure 4-28 Averaged delay per aircraft ICAO vs. BT1 at Frankfurt am Main
4.4.7 Conclusion
Both the US and Europe are still using static wake turbulence aircraft separation standard. This separation standard was set at a time when airport capacity and delay was not an issue. Today, this separation standard establishes the capacity limits of our air transportation system and is one of the safety frontiers that limit future growth in airport operations. Hub and spoke concept used at large busy airports will entail the increasing mixture of heavy and small aircraft and this exacerbates the capacity problem.
This section tried to assess the potential of runway throughput increase and reduction of delays by using the dynamic wake turbulence separations. We proposed and simulated an original dynamic separation concept, which is based on the transition between two separation modes (ICAO and REDUCED). Both separation modes take into account the aircraft wake category. Reduced mode applies separations below ICAO values and in the future it might be even more dynamic with non-static values. System enabling application of such concept doesn’t exist yet and is not even in the development phase. Nevertheless, it is expected, that advances in wake vortex research will lead towards development of systems like WakeVAS, ATC-Wake, which intend to use similar (not the same) concept of dynamic separations. Our proposal seems to be more safe (however less efficient) than ATC-WAKE concept, since it contains safety buffer even in the reduced separation mode (wake category dependence).
Seven scenarios for three airports (CDG, FRA & LHR) were simulated and analyzed in TAAM and Excel. They proved the potential benefit of introduction of dynamic wake turbulence separations at all simulated airports. The level of airport capacity increase does depend a lot on the current weather conditions influencing the timing of transitions between separation modes, their stability (not many changes

- 4-53-
desirable), as well as on the other issues like aircraft fleet mix (homogenous or not) or airport infrastructure (runway layout).
We analyzed only the total number of movements and average airport delay per aircraft in this section. More detailed results (graphs only) of our fast-time simulation can be found in Annex B. In general we can conclude, that CDG airport has the best airport infrastructure among all simulated airports. The only weak part, limiting the higher benefits, is the necessity for arrivals to cross departure runway. In dynamic scenarios BT1 and BT2 potential capacity increase is between 11 and 16 %. Similar benefits can be expected at Frankfurt airport, with values 10 - 14 %. Much higher benefits can be expected at London Heathrow airport, which operates the high level of traffic only on two runways and has a high proportion of “Heavies” among “Mediums”. As mentioned earlier, the current operational performance lies somewhere between our I-BT and R-BT scenarios. Unfortunately we couldn’t simulate all current operational procedures at LHR; hence the figures of potential benefit are not very accurate. Despite of the fact, we assume, the runway throughput increase might be between 15 – 20 % with introduction of dynamic separations.
Dynamic separations would reduce average airport delay per aircraft at all three airports. Increase of sequencing and runway delay will occur in the phase with ICAO separations, especially during and short after the transition. If the weather is favourable and allows application of reduced mode in peak times, significant reduction of delays can be expected. On contrary, if peak times will be operated with ICAO separation rules, delays may build up and will dissipate in reduced mode (while limiting the high potential benefit). Nevertheless this case would at least prevent the losing of capacity and delay increase while in certain cases it would enable a small benefit.
TAAM was not designed for research purposes. It can calibrate an airport with good accuracy but it is rather difficult to “run it against the logic”. The accuracy and realism of simulated scenarios could be further improved and more detailed and trustful capacity estimations can be achieved.
One major shortcoming of TAAM is that it is not really capable of modelling the aviation safety-critical combinations of non-nominal events; it often does not even model the single non-nominal event. Another major shortcoming is that an accident rate of, say, 10-9 per aircraft flight hour can not in a practically reasonable way be reached through a straightforward simulation, since this would require a simulation of 1010 aircraft flight hours. Collision risk should be definitely calculated by using e.g. the TOPAZ (Traffic Organization and Perturbation AnalyZer) methodology including the probabilistic model for wake vortex induced risk. Next chapter will be focused on the safety analysis of wake vortex induced risk.
4.5 Phase IV – Safety analysis
4.5.1 Introduction
The aim of this chapter is to basically demonstrate not only a new method to analyze the risk of wake vortex encounters during the final approach phase, but also to provide a quick overview of risk based policy making and incident reporting problematic. The chapter is organized as follows:

- 4-54-
The next sections will briefly describe risk metrics, safety requirements, risk based policies, the existent methods to evaluate wake vortex safety, present a new analytical method to assess the probability of a wake vortex encounter. An illustration of the proposed method is followed by discussion about the assumptions of the method and future work. The chapter ends with a section on incident reporting.
4.5.2 Risk based policy making
Safety assessments should be expressed in metrics that convey the risks clearly to the decision makers, in a way that builds on the safe foundation incorporated into the design of the existing system and also in a form that can be incorporated into cost benefit analysis (FAA/Eurocontrol Action plan 3, 1999). It is proposed that risk characterization should be a decision-driven activity, directed toward informing choices and solving problems. Moreover, it was found, that the manner in which risks are expressed has a major impact on people perception of safety and their behaviour.
This stresses the importance of proper risk characterization and consequently using suitable and agreed upon risk metrics. Following subchapters present initial guidelines for the development of a risk criteria framework. In addition, it is discussed how to proceed towards risk based policies that are agreed upon by the involved interest groups.
4.5.2.1 Identification of risk metrics
Up to now several technical metrics have been used in research studies to quantify the hazard imposed by wake vortices: e.g. bank angle, roll angle, roll rate a roll control ratio. Unfortunately, it is not sufficiently clear how these wake encounter type of metrics are related to the safety perception of most involved interest groups (i.e. human operators, regulatory authorities, ATM developers, human society, passengers, and controllers). In order to improve this situation, one should develop a probabilistic relation between the occurrence of wake vortex encounter severity and risk metrics that are related to the severity of accidents, incidents and related conditions.
For incident and accident investigation purposes, ICAO consequence definitions are (ICAO Annex 3, 1998; ICAO Annex 13, 1994):
Ø Accident
Ø Serious incident, for an incident involving circumstances indicating that an accident nearly occurred
Ø Non-serious incident
Ø Not determined incidents
For safety assessment purposes, Joint Aviation Authorities (JAA) has defined severity classes for adverse conditions (JAR 25, 1995):
Ø Catastrophic condition
Ø Hazardous condition
Ø Major condition

- 4-55-
Ø Minor condition
The above two classification schemes can be combined into a classification of wake vortex induced consequences as follows:
Ø Catastrophic accident – the aircraft encountering a wake vortex hits the ground, resulting in loss of life
Ø Hazardous accident – the wake vortex encounter results in one or more on-board fatalities or serious injuries (but no crash into the ground)
Ø Major incident – the wake vortex encounter results in one or more on-board serious injuries, but no fatality, on-board the encountering aircraft
Ø Minor incident – the wake vortex encounter results in inconvenience to occupants or an increase in crew workload
The next step is to introduce for each of these four classes suitable risk metrics to regulate and control wake vortex induced risk, such as:
Ø Risk event probability per movement
Ø Risk event probability per year
4.5.2.2 Safety requirements
Speijker et al. 1997 give initial guidelines for the assessment of safety requirements. Two possible safety management approaches are discussed: the Target Level of Safety (TLS) and the As-Low-As-Reasonably-Practicable (ALARP) approach. The basic idea behind these approaches is to divide the risk continuum into three respectively two risk judgment regions, as sketched in Figure 4-12.
TLS approach ALARP approach
Unacceptable Unacceptable
Negligible
Acceptable
TLS ALARP
Figure 4-29 Possible risk criteria frameworks
The ALARP approach contains a tolerable region bounded by maximally negligible and minimally unacceptable levels of risk. Within the tolerable region the risk must be prove to be As Low As

- 4-56-
Reasonably Practicable (ALARP) in order to be acceptable (DNV Technica, 1999). CBA is a method that can be used to demonstrate that any further risk reduction in the tolerable region is unpractical. The development of the ALARP approach for use in aviation risk management has been investigated within the context of Reduced Vertical Separation Minima (RVSM). It was argued that a combination of these two safety management approaches might be beneficial to aviation risk management under certain conditions.
4.5.2.3 Towards risk based policies
The ICAO separation minima form a good example of the current prescriptive approach towards safety management in civil aviation. In two studies (RTCA 1999, Blom, Nijhuis 1999) this problem and directions for improvement have been studied. In a study of the Radio Technical Commission for Aeronautics (RTCA, 1999) emphasis was on developing improvements within the existing prescriptive approach towards safety. The resulting recommendations are largely addressing the issues to be addressed by authorities in order to improve the situation. In Blom and Nijhuis, 1999 the emphasis was on what could be learned by all parties concerned from experiences in other safety critical industries. A key learning example came from the offshore petrochemical industry. Safety policy was there based on a prescriptive approach. However, in reaction to the Piper-Alpha catastrophe in the North Sea in 1988, a major change in safety policy has been developed and introduced in United Kingdom. The key change is the introduction of a goal-setting safety management approach, as described in Figure 4-13.
Set goals
Plan to meet goals
Act to meet goals
Check against goals
Feedback loops
Figure 4-30 Goal-setting safety management
The basic idea is that safety monitoring and feedback to all management levels in an organization becomes standard practice and that top management has the responsibility to agree with the authorities

- 4-57-
with respect to the safety goals and the safety monitoring and feedback mechanisms. Most remarkably, top management in offshore industry has become an active promoter of such goal-setting safety management approach.
For wake vortices the adoption of a goal-setting safety management approach would give service providers the possibility to develop and optimize operations for technological developments and the local conditions of a particular airport (airport layout, meteorological conditions, equipment level, etc.) without the need to await authority initiatives. One of the important feedback tools is to start the building of modern safety cases for a new operation under development in collaboration with other stakeholders. The key stakeholders to collaborate with are the major airport users, the airport service provider and the manufacturers of ground/airborne equipment and aircraft.
In Europe, Eurocontrol Safety Regulatory Requirement (ESARR) 4 concerns the use of risk assessment and mitigation, including hazard identification, in air traffic management when introducing and/or planning changes to the ATM system. Risk assessment and mitigation are being addressed adopting a total aviation system approach (targeted level of safety approach). This requirement shall apply to all providers of ATM services in respect of those parts of the ATM system for which they have managerial control.
Wake encounters are very rare events – strongly weather dependent. Therefore there is a need for probabilistic safety assessment. Next chapter outlines our probabilistic approach to estimation of probability of wake vortex encounter by using P2P model.
4.5.3 Quantitatively estimating wake vortex safety using P2P decay model4
4.5.3.1 Existing wake vortex safety analysis
Numerical description of wake vortices and the Probabilistic Two Phase (P2P) decay model, used in our method, are described in more details in Chapter 2.2.3 and Chapter 4.2.2.2.
Modelling of wake vortex evolution is one step in analyzing encounter risk. To quantify the various levels of safety related with vortices, researchers must also integrate aircraft dynamics, induced roll moment and compensation against roll. Further evaluation even should include pilot’s response at the moment of encounter.
NLR proposed a probabilistic methodology and developed a corresponding toolbox to assess vortex-induced risk (Kos, Blom, et al. 2000; Blom, Bakker, et al. 2001). The probabilistic methodology first evaluates the wake vortex encounter probability based on the Monte Carlo simulations of aircraft dynamics and wake vortex evolutions; then it identifies the seriousness of encounters considering vortex strength and the trailing aircraft’s rolling controllability. WAVIR (WAke Vortex Induced Risk) is the toolbox developed to integrate the simulation models. To estimate the wake vortex encounter probability, the probability density distributions (PDF’s) of aircraft positions and vortex positions and strengths are 4 The work presented in this chapter has been conducted in collaboration with Dr. Yue Xie and Dr. John Shortle,
members of Air Transport System Engineering Department of George Mason University, VA, USA.

- 4-58-
obtained from the aircraft model and the vortex model. PDF’s are inputted in another Monte Carlo simulation to count encounters.
A statistically significant estimation of such a rare event as wake vortex encounter from pure Monte Carlo simulations may be very computationally expensive. We introduce below a mathematical method to evaluate a conservative probability of a vortex encounter based on the P2P model. The method provides another perspective to investigate the wake vortex risk by numerically assessing the encounter risk with vortices at various ages. Furthermore, the conservatism inherent in the probabilistic model and the P2P model will help to provide a safety margin.
4.5.3.2 A conservative probabilistic model
Consider the final approach process described in Figure 4-31. Aircraft fly a desired 3o glide slope to land and the altitude deviation from the desired path shrinks while aircraft get close to the runway. Wake vortices generated by a leading aircraft will decay and transport for a certain period depending on the characteristics of aircraft and current meteorological conditions. If vortices stay in the flight corridor for enough time, it is possible that a following aircraft will encounter the vortices. To mathematically express the probabilistic event, we identify aircraft as they arrive in succession by the index I. Thus, if the leading aircraft is I, the following aircraft is I+1. We assume that aircraft I+1 can encounter a wake generated by aircraft I, but not by aircraft I-1 or earlier. For notational purposes, x refers to longitudinal position, t refers to the age of a vortex, t is a small time step, and x is a small distance step. Let wv(y, z ; I, [x, x + x] , [t, t + t]) be the latitudinal and altitudinal positions of vortex at time [t,t + t] and longitudinal position x, the one generated by aircraft I. Similarly, acft(y, z ; I+1, [x,x + x], [t,t + t]) is the location of aircraft I+1 at time [t, t + t] after the previous one and at longitude [x, x + x]. Since x and t are small, we will use x and t in sentences instead of their intervals for simplicity.
Figure 4-31 The Profile of Final Approach Phase
Suppose t seconds after aircraft I passed the location x, define the event that a following aircraft passes x at this moment as:
Is_acft(I+1, [x,x + x], [t,t + t]) = 1,

- 4-59-
then the probability of this event is solvable if the distribution function of the separation is known. The ranges x and t are chosen to be very small. Define:
Is_wv(I, [x,x + x], [t,t + t]) = 1
as the event that the wake generated by aircraft I when it passed x is still alive at age t, then when a following aircraft flies by x at t, the vortex is still alive with probability Prob(Is_wv(I, [x,x + x], [t,t + t]) = 1). We define an encounter as the event that the aircraft position (y,z) is in the estimated bounds of the vortex of age t at x, and the notation for the event is :
( , )( , ; 1,[ , ],[ , ])
( , ; ,[ , ],[ , ])
A x tacft y z I x x x t t t
wv y z I x x x t t t
≡+ + ∆ + ∆
∈+ ∆ + ∆
If there is no following aircraft passing by x at t seconds after the previous one, or the vortex dies out at age t, Prob(A(x,t)) is 0; only when there is a following aircraft flying by x at t, AND the vortex is still alive then, Prob(A(x,t)) can be larger than 0. So let M(I, x, t) be the probability of an encounter with the vortex of age t longitude x, its value is (Equation 1):
( , , ) ( ( , ))( ( , ; 1,[ , ],[ , ])
( , ; ,[ , ],[ , ]),_ ( 1,[ , ],[ , ]) 1,
_ ( ,[ , ],[ , ]) 1)
M I x t prob A x tprob acft y z I x x x t t t
wv y z I x x x t t tIs acft I x x x t t t
Is wv I x x x t t t
= =+ + ∆ + ∆
∈+ ∆ + ∆
+ + ∆ + ∆ =+ ∆ + ∆ =
We go ahead to formulate the probability of an encounter of aircraft I+1 at longitude x with a vortex at any age. When vortices at age t0 and tn are concerned, the probability of an encounter is:
' ' '
0 1( ( )) ( ( , ))* ( ( , ))* ... ( ( , ))*nt t tP A x P A x t P A x t P A x tt t t
∆ ∆ ∆= + + +∆ ∆ ∆
where A(x,t0), A(x,t1), … , A(x,tn) are mutually exclusive events. t’ is the sampling time step, and P(A(x,t)) is assumed to be identical in the interval [t, t + t’]. Let M(I, x)=P(A(x)), since M(I, x, t) = P(A(x,t)), then if t’ and t are small enough (Equation 2),
0
'
0
( , ) ( ( , ))* ( , , )ntn
ii t
tM I x P A x t M I x t dtt=
∆= ≈
∆∑ ∫
Since the strengths of vortices are strongly correlated with vortex ages, the probability of encountering vortices at various ages can be used to represent the probability of encountering vortices with various strengths. For example, vortices generated by a large aircraft at an age younger than 60 seconds may be viewed as young vortices, and those older than 60 seconds may be viewed as old. The encounters with young vortices are generally more dangerous than those with old vortices.
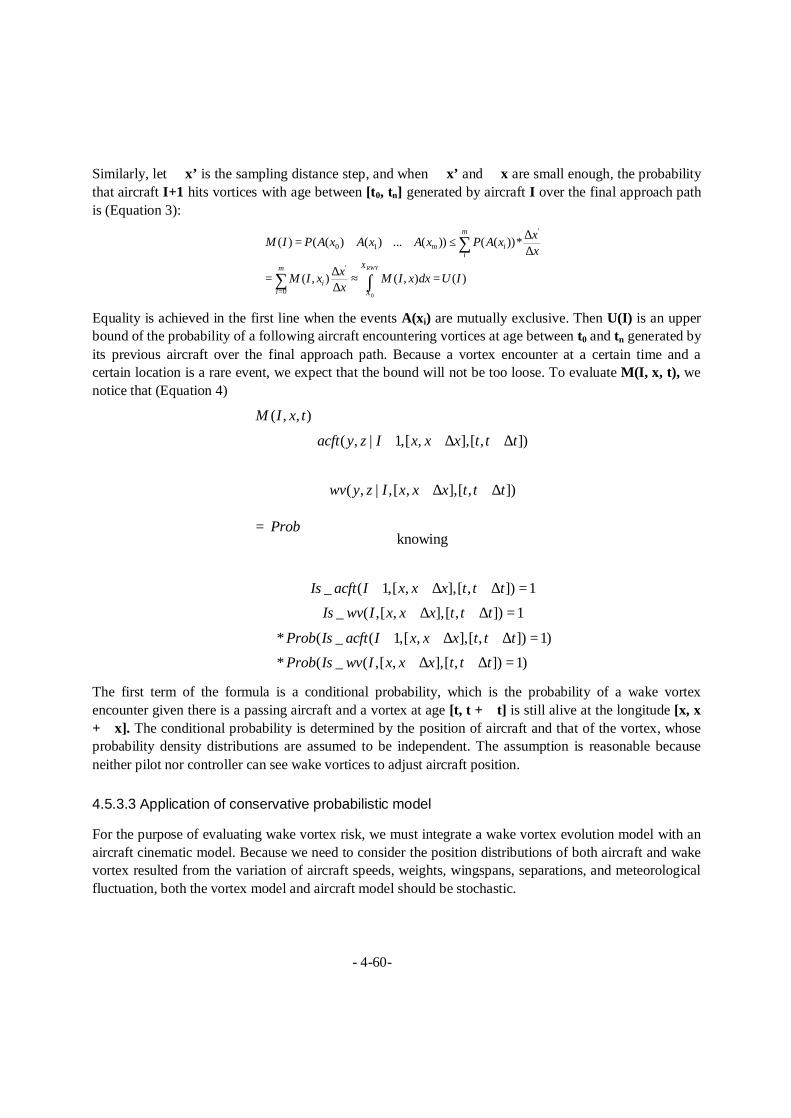
- 4-60-
Similarly, let x’ is the sampling distance step, and when x’ and x are small enough, the probability that aircraft I+1 hits vortices with age between [t0, tn] generated by aircraft I over the final approach path is (Equation 3):
0
'
0 1
'
0
( ) ( ( ) ( ) ... ( )) ( ( ))*
( , ) ( , ) ( )RWY
m
m ii
Xm
ii X
xM I P A x A x A x P A xx
xM I x M I x dx U Ix=
∆= ≤∆
∆= ≈ =∆
∑
∑ ∫
Equality is achieved in the first line when the events A(xi) are mutually exclusive. Then U(I) is an upper bound of the probability of a following aircraft encountering vortices at age between t0 and tn generated by its previous aircraft over the final approach path. Because a vortex encounter at a certain time and a certain location is a rare event, we expect that the bound will not be too loose. To evaluate M(I, x, t), we notice that (Equation 4)
( , , )
( , | 1,[ , ],[ , ])
( , | ,[ , ],[ , ])
knowing
_ ( 1,[ , ],[ , ]) 1_ ( ,[ , ],[ , ]) 1
* ( _ ( 1,[ , ]
M I x t
acft y z I x x x t t t
wv y z I x x x t t t
Prob
Is acft I x x x t t tIs wv I x x x t t t
Prob Is acft I x x x
+ + ∆ + ∆
∈
+ ∆ + ∆
=
+ + ∆ + ∆ =
+ ∆ + ∆ =
+ + ∆
,[ , ]) 1) * ( _ ( ,[ , ],[ , ]) 1)
t t tProb Is wv I x x x t t t
+ ∆ =
+ ∆ + ∆ =
The first term of the formula is a conditional probability, which is the probability of a wake vortex encounter given there is a passing aircraft and a vortex at age [t, t + t] is still alive at the longitude [x, x + x]. The conditional probability is determined by the position of aircraft and that of the vortex, whose probability density distributions are assumed to be independent. The assumption is reasonable because neither pilot nor controller can see wake vortices to adjust aircraft position.
4.5.3.3 Application of conservative probabilistic model
For the purpose of evaluating wake vortex risk, we must integrate a wake vortex evolution model with an aircraft cinematic model. Because we need to consider the position distributions of both aircraft and wake vortex resulted from the variation of aircraft speeds, weights, wingspans, separations, and meteorological fluctuation, both the vortex model and aircraft model should be stochastic.

- 4-61-
Aircraft evolution at final approach
Without losing generality, we first study the case that both the leading aircraft and the following one are large aircraft, Boeing 727, Boeing 737 or MD80, etc. The characteristics of the aircraft are list in Table 4-5. We assume all the three characteristics follow Normal distributions with means and standard deviations given in Table 4-5. The data in Table 4-5 are used only for the illustration of the model. They are hypothetical and not obtained from the collection of real data. The mean and the standard deviation are chosen to ensure that the maximum landing weight will not be exceeded. For instance, the maximum landing weight for a B727-100 is 64638 kg. The probability of a random number drawn from Normal (50000, 20002) larger than 64638 is around 10-13. The standard deviation of weight in Table 4-5 is difficult to estimate because it depends on the load of passengers and luggage.
Table 4-5 Hypothetical Aircraft Characteristics
Weight (kg)
Wingspan (meter)
Speed (mtr/sec.)
Mean 50,000 30 70 Std.Dev 2,000 2 4
We assume that each aircraft flies a constant, but randomly chosen, speed throughout the final approach. After determining the aircraft speed, the time it takes an airplane to fly from the final approach fix to a certain point in the approach path can be calculated. Let Tx-x0 be the time to fly from X0 to x, Tx-x0 = x/v, where v is the flight speed. We assume that v follows a Normal distribution. Although this technically implies that Tx-x0 mathematically is not normally distributed, since the values of v are far enough from zero, Tx-x0 can be approximated using a Normal distribution. Figure 4-32 shows the distributions of flight time it takes an airplane to fly to the locations 4000 meters and 7000 meters away from the final approach fix respectively, as well as their Normal distribution fit.
The variance of the flight time to a further point from the final approach fix is bigger with no controller’s interference. The increased variance will make the distribution of separation between two aircraft flatter.

- 4-62-
Figure 4-32 Flight time to a certain point
Define T1, T2 as the time of aircraft 1 and 2 passing the final approach gate, T1*, T2* as the time passing a certain point x, the separation at x is T2* - T1*= (T2 – T1) + (Tx-x0,2 - Tx-x0,1). Tx-x0,1 and Tx-x0,2 follow the same distribution. The expected value E[T2* - T1*] = E[T2 – T1], and the variance Var[T2* - T1*] = Var[T2 – T1] + 2*Var[Tx-X0,1]. For instance, if the separation at the final approach fix between two large aircraft is 64 seconds with a standard deviation of 5 seconds, the average flight time to the point with longitude of 7000 meters is 100 seconds, and its standard deviation is 6 seconds. Then T2* - T1* can be approximated using the distribution Normal (64, 52+2*62). Now the probability of a following aircraft passing the point at 7000 meters at the moment t seconds after the leading one passes it can be calculated.
Prob(acft(i+1, 7000, t) = 1) =
Prob(T2* - T1* = t)
≈ Prob(T2* - T1* < t + t) - Prob(T2* - T1* < t - t),
where t is the simulation time step. If t=90 and t =0.2, then :
Prob(acft(i+1, 7000, 90) = 1)
≈ Prob(T2* - T1* < 90 + 0.2) - Prob(T2* - T1* < 90 - 0.2) = 0.0013.
For the interest of space, t and x will not be shown from now on, but when we talk about t and x, we
mean [t, t + t] and [x,x + x].
Wake vortex evolution at final approach
We continue to use a homogeneous mix of all large aircraft to illustrate wake vortex evolution at the final approach phase. The major characteristics of aircraft are shown in Table 4-5, and the hypothetical values of the meteorological parameters are listed in Table 4-6. The variables are assumed to follow Normal distributions. Generally, given a certain level of turbulence represented by eddy dissipation rate (or stratification represented by Brunt-Vaisala frequency), the lower the stratification, the longer the lifespan of a vortex. The values listed in Table 4-6 are relatively small with respect to stratification and background turbulence, which result in longer lifespan of vortices. A more detailed discussion on the effects of these parameters on wake vortices can be found in (Holzaepfel, Gerz, and Baumann, 2001).

- 4-63-
Table 4-6 Hypothetical meteorological parameters
Air Density
(kg/m3)
Brunt–
Vaisala
Frequency
Eddy
Dissipation
Rate
Mean 1.0 0.016 3.2*10-5
Std.Dev 0.1 0.002 10-6
We only consider the evolution of wake vortices on the altitude dimension, and assume that we can ignore the drifting distance of vortices on the lateral dimension. Based on the values of aircraft characteristics and meteorological conditions listed in Table 4-5 and Table 4-6, we collected data on vortex circulation and descent distance at various ages from Monte Carlo simulations, based on the P2P model. The histograms of example data at age 20 seconds, 60 seconds, and 140 seconds are shown in Figure 4-33 and Figure 4-34 for the upper bounds of circulation and descent distances respectively. Unless explicitly stated, the circulations or positions calculated from the P2P model that we are using later on are upper bounds.
Figure 4-33 Circulation of vortices at different ages
Figure 4-33 shows that older vortices have a lower average value and variance for circulation strength than younger vortices. The phenomenon is reasonable since normalized circulation Γ *(τ ) reduces with the increment of vortex age τ .

- 4-64-
Figure 4-34 Descent distances of vortices at different ages
The distributions of vortices’ descent distance have larger spread when vortices get older. For the same reason with the situation of vortex’s circulation described above, the variances of vortex’s descent speed reduce as age increases, but it lead to larger variance of distance because distance is the integral of speed over time. Figure 4-34 demonstrates that it is more difficult to exactly predict vertical positions of vortices closer to the runway threshold. When aircraft fly closer to the runway threshold, the altitude deviations of their flight path will be diminishing, as illustrated in Figure 4-31. Our aircraft dynamics model reflects the change of deviation and the examples of the histograms of the aircraft altitudes and the upper bounds of wake vortex altitudes are shown in Figure 4-35. In Figure 4-35, the altitude distribution of a following aircraft at a certain location (e.g. 2000 meters from the final approach fix) is independent of the longitudinal separation with the leading aircraft. So the distribution of (t = 20 seconds) is overlapped with that of (t = 100 seconds). Old vortices descend more than young ones with larger variances, as illustrated by Figure 4-34. If we define a vortex encounter as the event that the following aircraft flies under the upper bound of vortex altitudes, the point that we can see from Figure 4-35 is that, at a certain location, a following aircraft is more likely to hit younger vortices if it passes by, given the configured meteorological conditions. For example, the conditional probability of hitting vortices at age 20 seconds is 0.032, while that of hitting vortices at age 100 seconds is 6*10-14. Here we assume that the probability of a trailing aircraft flying under the lower bound of vortices is ignorable.
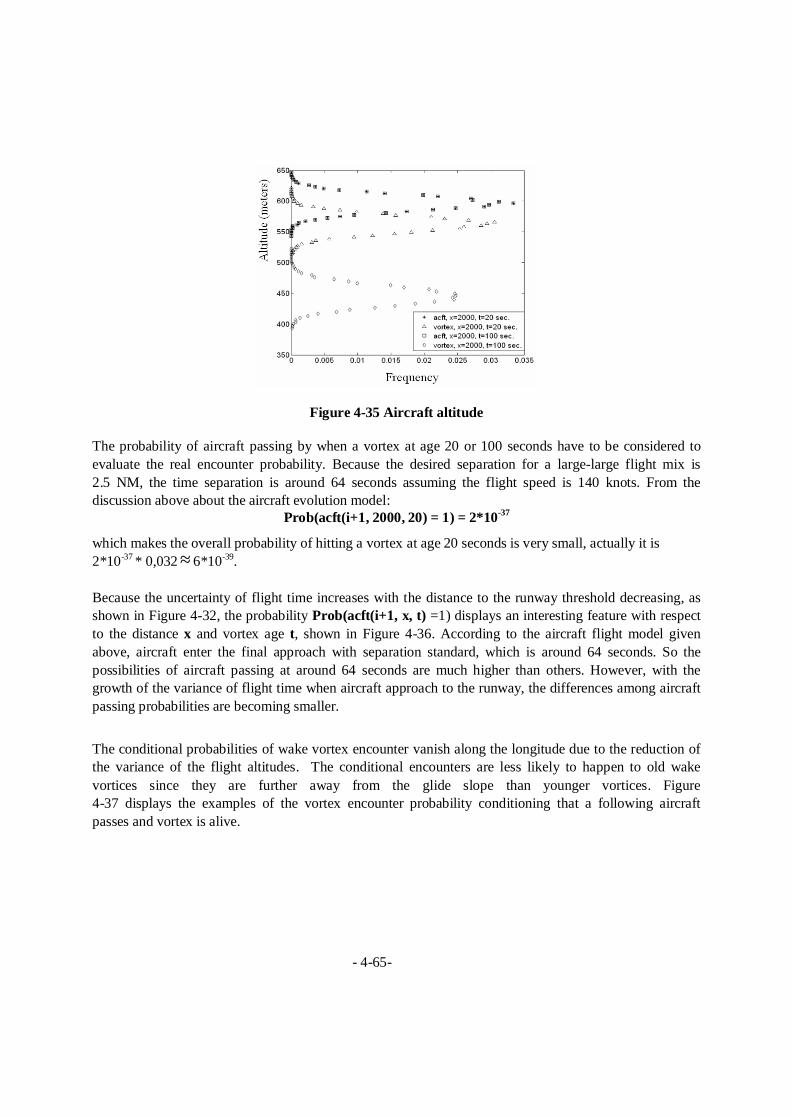
- 4-65-
Figure 4-35 Aircraft altitude
The probability of aircraft passing by when a vortex at age 20 or 100 seconds have to be considered to evaluate the real encounter probability. Because the desired separation for a large-large flight mix is 2.5 NM, the time separation is around 64 seconds assuming the flight speed is 140 knots. From the discussion above about the aircraft evolution model:
Prob(acft(i+1, 2000, 20) = 1) = 2*10-37
which makes the overall probability of hitting a vortex at age 20 seconds is very small, actually it is 2*10-37 * 0,032 ≈ 6*10-39. Because the uncertainty of flight time increases with the distance to the runway threshold decreasing, as shown in Figure 4-32, the probability Prob(acft(i+1, x, t) =1) displays an interesting feature with respect to the distance x and vortex age t, shown in Figure 4-36. According to the aircraft flight model given above, aircraft enter the final approach with separation standard, which is around 64 seconds. So the possibilities of aircraft passing at around 64 seconds are much higher than others. However, with the growth of the variance of flight time when aircraft approach to the runway, the differences among aircraft passing probabilities are becoming smaller.
The conditional probabilities of wake vortex encounter vanish along the longitude due to the reduction of the variance of the flight altitudes. The conditional encounters are less likely to happen to old wake vortices since they are further away from the glide slope than younger vortices. Figure 4-37 displays the examples of the vortex encounter probability conditioning that a following aircraft passes and vortex is alive.

- 4-66-
Figure 4-36 Probability of Aircraft Passing A Location at Different Time
Figure 4-37 Conditional Probability of Vortex Encounter
The evolution of the probability M(I, x, t) over the longitude x and vortex age t is more complicated, and it combines all the factors we have discussed above. Figure 4-38 shows the curves of M(I, x, t) when t are less than the assumed separation standard, 64 seconds. Some of the curves in Figure 4-38 are not monotonously decreasing, while the curves of M(I, x, t) are when t is close to 64 seconds, as shown in Figure 4-39. The integral of M(I, x, t) over the final approach path and over vortex ages is:
410*32.1),,()(0 0
−== ∫ ∫ dxdtxItMIURWYX
X
T
t
The value of U(I) means that the probability of the following aircraft I+1 hitting vortices generated by aircraft I should not be greater than 1.32*10-4.

- 4-67-
Figure 4-38 Probability of Vortex Encounter at A Location at Different Time
Figure 4-39 Probability of Vortex Encounter at A Location at Any Time
If we are interested in the probability of hitting vortices at certain range of age, the value can be calculated by adjudging the range of t in the integral. For example, the probability of hitting vortices at ages younger than 50 seconds is about 3*10-7, and the marginal probabilities over the longitude is shown in Figure 4-40. The probability of hitting vortices at ages between 50 seconds and 70 seconds are 1.31*10-4, and the marginal probability distribution is shown in Figure 4-41. It demonstrates that most of the likely encounters are related with vortices at age around the deployed separation. According to Gerz (Gerz et.al , 2001), about 80 encounters occur per year on average at London-Heathrow Airport. The amount of annual operations in 2003 is around 460,700 (BAA, 2004), so the estimated probability of a human-sensible encounter is about 1.7*10-4. Although we cannot use the Heathrow data to verify the vortex risk calculated from the Conservative Probabilistic Model, it shows that our estimation is located in a reasonably correct region. A detailed and comprehensive verification needs carefully collected data not only about aircraft operations, but the meteorological conditions.

- 4-68-
Figure 4-40 Probability of An Encounter with Vortices Younger than 50 Seconds
Figure 4-41 Probability of An Encounter with Vortices at Age Between 50 sec. and 70 sec
4.5.3.4 Discussion
The Conservative Probabilistic Model proposed in this chapter is based on a conservative model of wake vortex decay and transport, the P2P model. However, other numerical models of wake vortex are also applicable and the estimation of vortex risk is still conservative. Conservatism in risk evaluation is essential because the system involves uncertainties that are difficult to accurately identify or quantify, and a certain safety margin can help to reduce the impact of these unknown uncertainties.
The major concern about the model is that the estimation might be much larger than the true risk. This can be seen from Equation 3. When a part or all of events A(xi) are not mutually exclusive, M(I) might be much less than U(I). The upper bound would be close to the true risk only if events A(xi) are nearly mutually exclusive. As an alternate approach, Kos et al., 2000 choose the maximum value of P(A(xi)) over
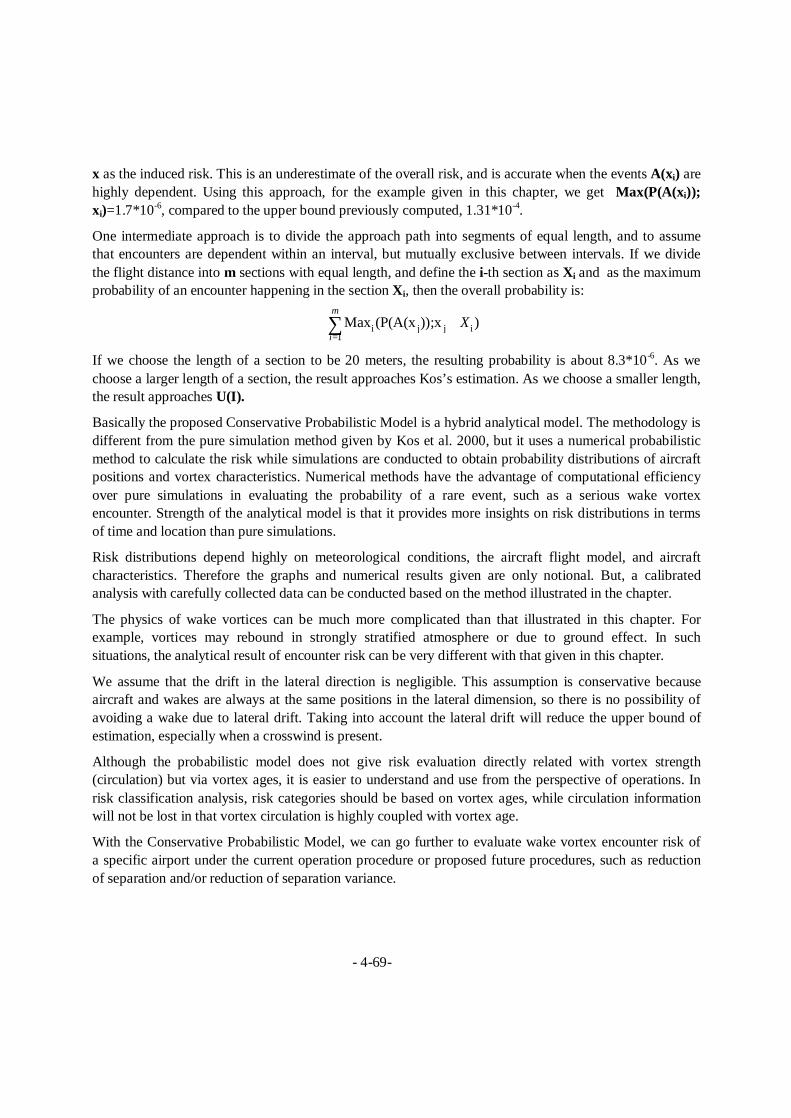
- 4-69-
x as the induced risk. This is an underestimate of the overall risk, and is accurate when the events A(xi) are highly dependent. Using this approach, for the example given in this chapter, we get Max(P(A(xi)); xi)=1.7*10-6, compared to the upper bound previously computed, 1.31*10-4.
One intermediate approach is to divide the approach path into segments of equal length, and to assume that encounters are dependent within an interval, but mutually exclusive between intervals. If we divide the flight distance into m sections with equal length, and define the i-th section as Xi and as the maximum probability of an encounter happening in the section Xi, then the overall probability is:
i j j i1Max (P(A(x ));x )
m
iX
=∈∑
If we choose the length of a section to be 20 meters, the resulting probability is about 8.3*10-6. As we choose a larger length of a section, the result approaches Kos’s estimation. As we choose a smaller length, the result approaches U(I).
Basically the proposed Conservative Probabilistic Model is a hybrid analytical model. The methodology is different from the pure simulation method given by Kos et al. 2000, but it uses a numerical probabilistic method to calculate the risk while simulations are conducted to obtain probability distributions of aircraft positions and vortex characteristics. Numerical methods have the advantage of computational efficiency over pure simulations in evaluating the probability of a rare event, such as a serious wake vortex encounter. Strength of the analytical model is that it provides more insights on risk distributions in terms of time and location than pure simulations.
Risk distributions depend highly on meteorological conditions, the aircraft flight model, and aircraft characteristics. Therefore the graphs and numerical results given are only notional. But, a calibrated analysis with carefully collected data can be conducted based on the method illustrated in the chapter.
The physics of wake vortices can be much more complicated than that illustrated in this chapter. For example, vortices may rebound in strongly stratified atmosphere or due to ground effect. In such situations, the analytical result of encounter risk can be very different with that given in this chapter.
We assume that the drift in the lateral direction is negligible. This assumption is conservative because aircraft and wakes are always at the same positions in the lateral dimension, so there is no possibility of avoiding a wake due to lateral drift. Taking into account the lateral drift will reduce the upper bound of estimation, especially when a crosswind is present.
Although the probabilistic model does not give risk evaluation directly related with vortex strength (circulation) but via vortex ages, it is easier to understand and use from the perspective of operations. In risk classification analysis, risk categories should be based on vortex ages, while circulation information will not be lost in that vortex circulation is highly coupled with vortex age.
With the Conservative Probabilistic Model, we can go further to evaluate wake vortex encounter risk of a specific airport under the current operation procedure or proposed future procedures, such as reduction of separation and/or reduction of separation variance.
- 4-70-
4.5.4 Incident reporting
Accidents hardly ever happen without warning. Incidents could be considered as accident precursors. A single occurrence or the recurrence of similar serious events may appear as an incomplete sequence of an accident scenario. Therefore such an occurrence tells us something about the risk of an accident.
A comprehensive reporting scheme, in combination with other safety monitoring resources, keeps an air navigation service provider informed about how it is actually performing. States have a (legal) obligation, as members of ICAO, the EU, EUROCONTROL and ECAC, to report specific occurrences to these bodies under various schemes (Ferrara, 2004):
Ø To ICAO under ADREP Accident Reporting Scheme for worldwide statistical purposes;
Ø To the EC/EU pursuant to Council Directive 2003/42/EC and Council Directive 94/56/EC for statistical purposes at European Union level
Ø To Eurocontrol’s Safety Regulation Commission (SRC) and ECAC under ESARR 2 -Eurocontrol Safety Regulatory Requirement 2 (Reporting and assessment of safety occurrences in ATM) for statistical purposes at ECAC level
Apart of mandatory reporting schemes, a voluntary reporting scheme has been set up in the framework of the Strategy Safety Action Plan (SSAP) for enhanced ATM safety. ATM regulators and air navigation service providers should urgently allocate sufficient resources for data collection, analysis, sharing and dissemination of lessons learned. They should implement the principles of “just culture” in safety occurrence reporting and cooperate with Eurocontrol in defining and adopting industry-wide harmonized mechanisms for sharing safety-related data. This should include cooperating with airlines to derive best practice where possible and to share data on “lessons learned”. An industry-wide awareness and education campaign for all stakeholders underlining the safety benefits of good reporting culture should be initiated.
Even though most European incident reporting schemes are mandatory, there is still perception, that not all incidents are reported. This has been proved also in our operational survey, as described in Chapter 4.2. Some voluntary (with no-blame culture) reporting schemes do exist and have been shown increase significantly the number of incident reports.5
It must be stressed that any reporting scheme depends on the wills of individuals to report, e.g. air traffic controller or pilot making a report after shift / flight. In addition to their responsibility, there are other good reasons why ANSPs and airlines should implement comprehensive reporting schemes:
Ø Moral obligation to investigate what went wrong in their operation and why
Ø Also, it is in their own interest, as they responsible for safety in a context of increased public interest, to be able to demonstrate at any time, that they are doing everything (reasonably) possible to mitigate identified risks
Ø Statistical data of collected occurrences significantly help researchers to validate their safety assessment exercises and consecutive approval of new operational concepts prior its implementation
5 In Denmark following an introduction of non-blame voluntary reporting system, the number of reports has tripled.

- 4-71-
Reasons for non-reporting include:
Ø Human limitations – occurrences not detected by controllers or pilots (which happens quit often in case of wake turbulence encounter, see Chapter 4.2)
Ø The potential reporter does not feel compelled to report certain occurrences that do not appear important
Ø Human factors aspects, such as “loss of face”
Ø Contradictions raised by the trade-off between capacity and safety
In this context, unreported occurrences may constitute the majority and may hide the information needed to detect main system or procedure weaknesses. No even reported does not mean that system is safe.
The challenge of current research is the detection of un-reported incidents by automated safety monitoring tools. Air Traffic Management safety monitoring tool (ASMT) as one of the automated tools tries to answer the challenge by detecting the occurrences in ATM, however it still does not include the detection of wake turbulence encounters, due to complexity of the way it might be detected. NLR have developed in European commission project S-WAKE an algorithm, which enables the detection of wake turbulence encounter by extracting and analyzing data from flight data recorders (FDR). This algorithm is based on VORTEX prediction model and it has been tested on several British Airways aircraft in 2001. It proved the correctness of research direction; however the accuracy of the detection mechanism will have to be improved in the future research activities. There is definitely a need for improvements in wake turbulence encounter reporting schemes/mechanisms. This issue is addressed by researchers and experts grouped under thematic network Wakenet 2 Europe – Working Group 1.
4.5.5 Conclusion
Safety in general and also in relation to wake turbulence encounters is an enormous domain, which could not have been entirely covered under the scope of this thesis. Despite of the fact, this chapter provided a brief outlook of risk based policy making incl. description of safety requirements. We demonstrated a new probabilistic method for analyzing the risk of wake vortex encounters during the final approach phase and we concluded with emphasized importance of incident reporting.
Safety was, it is and will remain the top priority in air transport industry. Reduction of wake turbulence separations will have to be supported by precise safety cases in order to achieve an increase in airport capacity without making a trade-off with safety. As it was confirmed by our operational survey, pilots are much more reluctant in case of reduction or revision of horizontal separations. Research community has to focus on finding a safe and efficient change in coping the wake vortex problem.

5-1
Chapter 5
Theoretical and practical contributions
5.1 Theoretical contributions
This PhD thesis contributes to theory by better understanding of wake vortex phenomena in ATM with specific focus on safety and capacity. Following theoretical contributions have been achieved:
Ø The state-of-the-art of wake vortex research incl. detailed description of wake vortex separation standards, wake vortex physics, general definitions of safety and airport capacity
Ø The critical analysis of emerging technologies classified into the following domains:
o Wake vortex detection technology
o Wake vortex prediction models
o Weather forecast
o Weather monitoring
o Operational procedures and systems
Ø Mapping users’ (pilots and air traffic controllers) understanding of wake vortex problem, their knowledge of physics, technology, impact on safety, incident reporting, their requirements and valuable beliefs for future developments
Ø Proposal of new method of dynamic separation concept, which was evaluated via fast-time simulation in Total Airspace Airport Modeller
Ø Detailed models of three major European airports (CDG, FRA, LHR) have been built with high level of detail in airport layout, ATC procedures incl. three separation concepts (ICAO, Reduced and Dynamic with transitions between ICAO and Reduced modes).
Ø Estimation of dynamic separation concept impact on airport capacity and delay
Ø Proposal of new analytical hybrid method for analyzing the risk of wake vortex encounters during the final approach phase
Ø Overview of risk based policy making and incident reporting problematic.
5.2 Practical contributions
Thesis can be in general used as a “reference book” for further research projects or studies. It provides also a solid base material for improving the knowledge of wake vortex research of potential users (pilots, air traffic controllers, but also airport operators). Specific parts and findings have been continuously used by wake vortex experts in Eurocontrol Experimental Centre. Following practical contributions have already been (or might be in the future) achieved:
- 5-2-
Ø State-of-the-art of technology was already practically used as a basic material for definition of operational concept in the ATC-WAKE (EC project in 5th FP). It was published as an annex to deliverable in Work Package 1100. It might be further used for more specific and detailed technology review studies, cost benefit analysis or future wake vortex system engineering development.
Ø Operational survey had a practical impact on the respondents (controllers and pilots) concerned, since it increased their knowledge of the wake vortex research twofold:
o directly by information included in the questionnaire
o indirectly by follow-up action - by feedback provided to respondents including the requested material
Ø Results of the survey can also be used for investigation concerning:
o Improvement of the theoretical and practical training process of controllers and pilots, by enriching their knowledge and consequent improving of the way of working (improved incident reporting, flight simulator exercises etc.)
o Design of a system acceptable by users, including appropriate Human Machine Interface and type of wake vortex information
Ø Results of the survey have already been requested and used by:
o A thematic network of EC – WAKENET 2 Europe – Working Group 1 (Incident reporting)
o I-WAKE – EC project in 5th FP aiming to develop an on-board LIDAR
o FLYSAFE – EC project in 6th FP aiming to develop an onboard integrated solutions for safety improvements and all weather operations
Ø TAAM model of three airports might be used in Eurocontrol for future fast-time simulations
Ø Results of capacity estimation might be used firstly for more advanced capacity estimation studies and secondly for cost benefit analysis studies
Ø New dynamic separation concept, when applied or integrated in the future wake vortex advisory systems at the airports, might provide a sound increase in terms of runway throughput and reduction of delays while not compromising current level of safety
Ø New probabilistic method (hybrid analytical model) for analyzing the risk of wake vortex encounters during the final approach phase can be further improved and used in the process of safety assessment (building safety cases).
Twenty papers, reports and articles have been published and presented at international conferences, seminars and workshops during the PhD research process. Full list of publications can be found in Annex C.
6-1
Chapter 6
Conclusions
6.1 Conclusions about research problem
This thesis is the final report of: “Comprehensive study of the wake vortex phenomena to the assessment of its incorporation to ATM for safety and capacity improvements”.
High-level contribution we wanted to achieve is the knowledge of the wake vortex in ATM by exploring the interrelationships of physics – technology – operation in relation to safety and capacity of ATM.
Based on the identified general research questions in Chapter 2, in order to support our hypothesis:
“We can use the current knowledge of physics along with technology in order to improve airport capacities while maintaining at least the current levels of safety,”
we have fulfilled following objectives of the thesis:
1. We have described basic phenomena’s behaviour like genesis, process until decay and meteorological influence. We also assessed the limitations and advances in physics which might influence either the technology development or operational procedures. Mechanisms to account for in a wake vortex based future spacing systems are: Horizontal transport, downward vertical transport, vortex tube deformation and wake vortex decay. Physics, in general, seems to be well understood, but we must note that any assessment of the ground effect is certain to be incomplete. There is still a lot that we do not know for us to give a definitive account of the subject but a great deal has also been learned in the past decade and many aspects of wake vortices and their interaction with each other and with the environment have been understood. Many of the unresolved problems are related to our inability to define and quantify the environment, and to our limitations to compute the behaviour of unsteady turbulent flows with sufficient accuracy.
2. We synthesized and analyzed the state-of-the-art of technology, many existing (or future) systems and concepts were classified by several criteria (detection and prediction systems, weather forecast and nowcast tools, operational procedures). LIDARs are powerful tools, but in the low visibility conditions they have to be complemented by advanced radar solutions. Windline proves to be a cheap alternative for basic wake vortex measurements. P2P and P-VFS provide very good accuracy in predicting the location and strength of the vortices. Their parallel use can enhance even further the probabilistic estimation of wake vortex behaviour. Integrated wake vortex advisory systems must include a sophisticated weather sub-system providing accurate weather monitoring and forecasting. Such systems are still in the development phase and their cost will be rather very high once they reach an implementation maturity.
3. Direct users (air traffic controllers and pilots) have not been actively involved in the wake vortex research in the past. Therefore we designed and conducted an operational survey with objective to define users’ requirements and beliefs for the future developments. Valuable findings of the survey

- 6-2-
helped to understand the current wake vortex perception by pilots and controllers. Now, we have a better picture of their understanding of wake vortex problem, their knowledge of physics, technology, impact on safety, incident reporting, and their requirements for future investigation on physics or technology.
4. While taking into account our finding in technology, physics and operational procedures, we proposed a new concept of dynamic separation rules. It consists of two modes of separation: ICAO and REDUCED. REDUCED mode still does distinguish the type of aircraft, and applies lower separations (than ICAO) between the aircraft groups. These modes will be dynamically applied throughout the day, based on the meteorological conditions. Transition times and application duration of specific modes will be proposed by automated integrated wake vortex advisory system (in architecture might be similar to ATC-WAKE or WakeVAS).
5. Assessment of expected benefits in terms of capacity was performed in the form of fast-time simulation. We used a sophisticated mathematical model: Total Airspace Airport Modeller developed by Preston Aviation Solutions. Case study with three major European airports, LHR, CDG and FRA has proved our hypothesis, that dynamic separation concept can increase the runway throughput (between 10 to 20% increase) and reduce delays. This part of the thesis has also shown, what are the critical issues (apart of weather) influencing airport capacities, like runway layout, traffic mix, operational procedures.
6. Finally, in the safety analysis part of the thesis, we provided a quick overview of risk based policy making, incident reporting and we proposed a new method for analyzing the risk of wake vortex encounters during the final approach phase. Since this task, requires a quantitative method, we introduced hybrid analytical method – it uses a numerical probabilistic method to calculate the risk while Monte Carlo simulations were conducted to obtain probability distributions of aircraft positions and vortex characteristics. The probability of hitting vortices at ages e.g. between 50 seconds and 70 seconds was calculated as 1.31*10-4. It demonstrates that most of the likely encounters are related with vortices at age around the deployed separation (<3NM). The estimated probability of a human-sensible encounter at London Heathrow airport (in 2003) was about 1.7*10-4. Although we cannot use the Heathrow data to verify the vortex risk calculated from the Conservative Probabilistic Model, it shows that our estimation is located in a reasonably correct region.
Current safe wake vortex separations are achieved with a set of rules for air traffic control and procedures for pilots. The rules and procedures are based on the general observation that wakes sink when out of ground effect, and tend to separate laterally when in ground effect. The previous 30 years of wake vortex research have enabled the development of technologies that have been shown feasible to produce a real-time knowledge of wake behaviour.
Transport and decay of aircraft wake vortices in the atmosphere is understood. Consensus has been achieved that predicting the wake evolution requires probabilistic approaches in order to account for the stochastic nature of the atmospheric processes at the temporal and spatial scales of the aircraft wakes, in particular in turbulent environments and for the complex interaction of vortices with wind-shear layers. Neither weather predictions nor actual measurements in the atmospheric boundary layer can be accurate and representative enough to allow to forecast the decay and trajectory of a vortex deterministically. Gaps in knowledge, however, still exist with respect to wake vortices in ground proximity and details of vortex
- 6-3-
instability mechanisms. To answer these open issues the FAR-Wake project has recently be launched in Europe.
The components for prediction, observation, and safety assessment, P2P, P-VFS, LIDAR, WAVIR, RADAR, SODAR, RASS etc…and their combinations, constitute the corner stones of the future integrated wake vortex advisory systems. Such systems are suited to fulfil / prove our hypothesis, hence safely optimise aircraft separations. The various components have been developed and are being improved within the European projects S-WAKE, ATC-Wake, MFLAME, I-WAKE, C-WAKE, AWIATOR as well as within the American wake vortex research problem.
Common solution in near term should be improvement of incident reporting necessary for development of new wake vortex operational procedures and their safety assessment. These procedures should not require special wake vortex monitoring and prediction. They might be supported only by accurate wind measurements at the airports. In mid-term, we foresee to have finished development of different wake monitoring and prediction systems and techniques in order to succeed in implementation of active WV advisory systems as ATC-WAKE, WAKEVAS, or WVWS. The local installation of the integrated system at the airports will require new safety regulation, since the present wake vortex safety recommendations and best practices do not take new modified ATC systems into account. Specific attention must be given to the issue of development and harmonization of new wake vortex safety regulation. To enhance acceptability of the integrated system (and other new technologies, including high capacity aircraft such as the Airbus A380 and on-board wake detection and warning instrumentation), possible end-users and regulatory authorities have to be involved in the development of such system to achieve the goal as soon as possible. As users (pilots and controllers) require, absolute safety cases must demonstrate that separations won’t be reduced by cutting down the safety margins.
Apart of constant improvements and advances in physics and technology development, the next step should take the concepts of safe reduced wake separation from the technically possible to practical application.
6.2 Limitations
Recognizing the large scope of the problem, a definitive solution could not be proposed. Each phase of the main part of the thesis (Chapter 4) is complex enough to be explored in a separate study with higher level of detail. Synthesis and review of state-of-the-art technology did not lead to a proposal of ideal technology set or a system. Users’ requirements were defined only in terms of our objective, not in the form of general requirements valid for future system development. This is limited due to statistically insufficient response rate of users in questionnaires. Estimation of potential airport capacity gains was conducted in the Total Airspace Airport Modeller a fast-time simulator tool, which was not designed as a research tool. Nevertheless estimated benefits might be a solid base for further more detailed airport capacity studies. Quantitative estimation of wake vortex safety was limited by lack of meteorological data, the aircraft flight model and aircraft characteristics. The physics of wake vortices can be much more complicated than it is used in our model.

- 6-4-
6.3 Future work
As mentioned above in the limitations, this thesis attempted to cover a very complex problem and it had a wide scope. We have identified several potential future improvements to the work presented in this thesis:
Ø State-of-the-art technology review could be further enhanced by more detailed comparison of ranges, limitations, costs, interoperability. It could also propose several “tool sets” for different types of airports. This action would be closely related to cost benefit analysis study.
Ø Definition of users’ requirements can be further improved by lessons learned, designing a new questionnaire, trying to achieve higher number of respondents, potentially also including airport operators and technology manufacturers
Ø New separation concepts or procedures could be proposed and evaluated
Ø Harmonization of aircraft groups could be suggested, including a new group for A380, which will most likely generate much stronger vortices, than it was anticipated
Ø Modelling of capacity benefits in TAAM can be improved with new system functionalities and simulating all current procedures, without neglecting a few of them. More airports can be included in the simulation as well as the evaluation of an impact of dynamic changes at one airport on the network could be conducted
Ø Successfully validated concepts in fast-time simulator could be further evaluated in the real-time simulations, by designing the HMI and including the human in the loop. This would enable to measure not only the potential capacity benefit, but also acceptability of the system by users, its impact on their workload etc.
Ø Much more work could be also done in the safety analysis part, including definition of hazardous wake vortex encounter, improving the probabilistic risk assessment model by accurate meteorological data and detailed aircraft performances
6-5
Appendix A
Detailed analysis of the survey
Operational survey - Air Traffic Controllers AQ1 Sample details Sample size: 61 respondents Sex Frequency Percent Male 56 91,8% Female 5 8,2% (Total) 61 100.0%

- 6-6-
Age groups
0
5
10
15
20
25 30 35 40 45 50 55 More
Age
Freq
uenc
y
Years of experience as ATCO (training incl.)
0
5
10
15
20
5 10 15 20 25 30 35Years
Freq
uenc
y
- 6-7-
Current position at ATC centre
5
40
4
111
HEAD OF DEPT.ATCO
Instructor / ATCOSupervisor / ATCO
Military ATCO
ATC centre location
02468
101214
ViennaPrague
Bratislava
Heathrow
AmsterdamZuric
h
BrusselsRome
Paris CDG
Location
No
of A
TCO
s
- 6-8-
AQ2 What do you think is your current knowledge (basic, average, very good) of wake turbulence in following areas?
AQ3 Did you get this knowledge in your ATC training or you got it later continuously during active ATC operation?

- 6-9-
AQ4 Are you familiar with LIDAR technology?
AQ5 How would you rate the potential hazard severity (High, Low) of the phenomena as a function of phase of flight
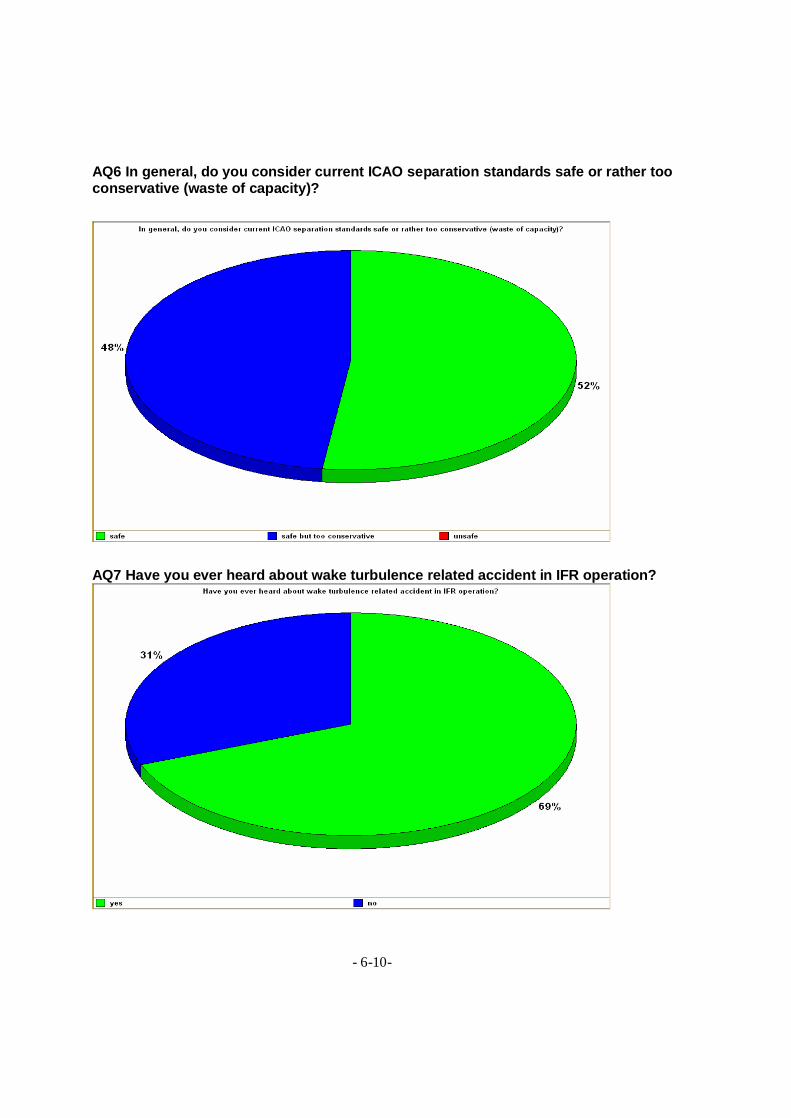
- 6-10-
AQ6 In general, do you consider current ICAO separation standards safe or rather too conservative (waste of capacity)?
AQ7 Have you ever heard about wake turbulence related accident in IFR operation?
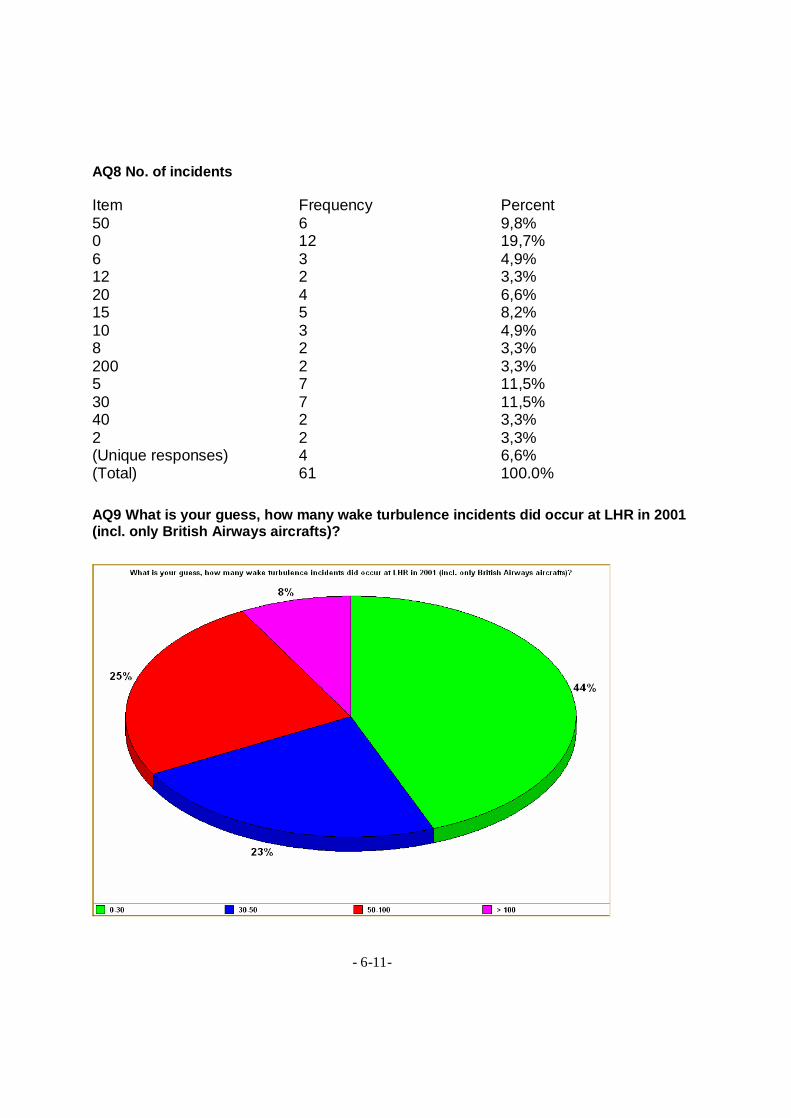
- 6-11-
AQ8 No. of incidents Item Frequency Percent 50 6 9,8% 0 12 19,7% 6 3 4,9% 12 2 3,3% 20 4 6,6% 15 5 8,2% 10 3 4,9% 8 2 3,3% 200 2 3,3% 5 7 11,5% 30 7 11,5% 40 2 3,3% 2 2 3,3% (Unique responses) 4 6,6% (Total) 61 100.0%
AQ9 What is your guess, how many wake turbulence incidents did occur at LHR in 2001 (incl. only British Airways aircrafts)?
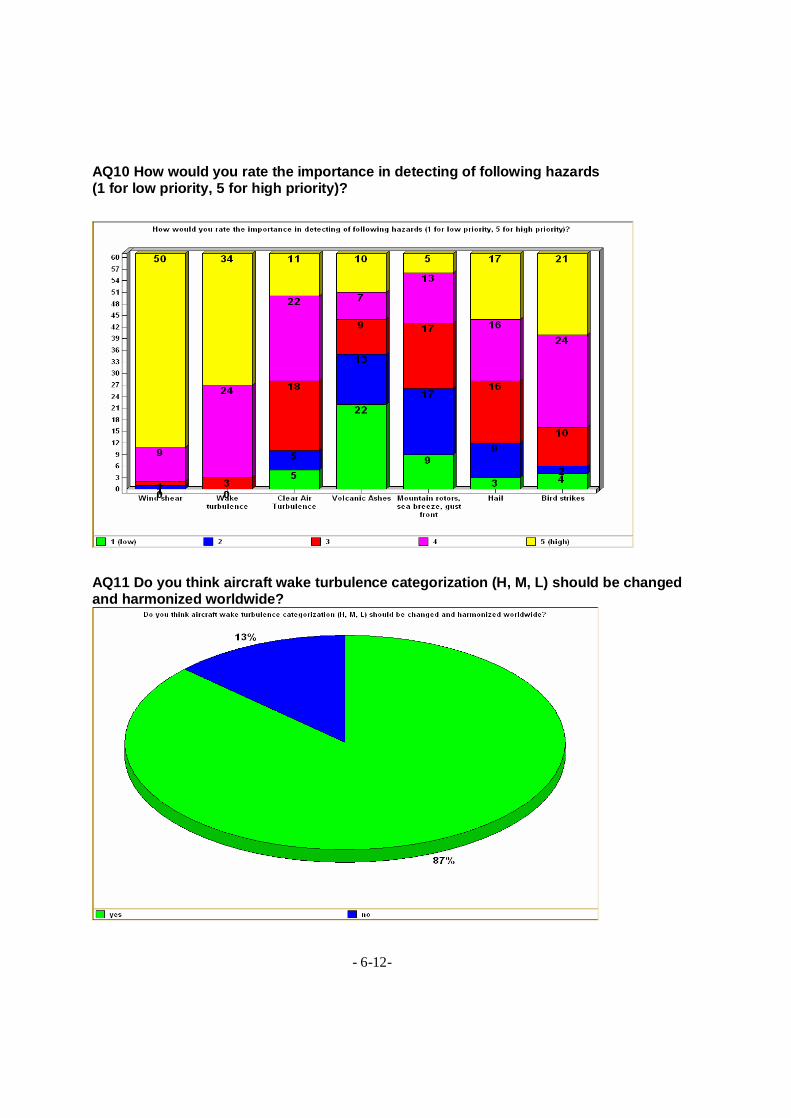
- 6-12-
AQ10 How would you rate the importance in detecting of following hazards (1 for low priority, 5 for high priority)?
AQ11 Do you think aircraft wake turbulence categorization (H, M, L) should be changed and harmonized worldwide?

- 6-13-
AQ12 What kind of traffic mix do you usually control?
AQ13 Are you using an AMAN?
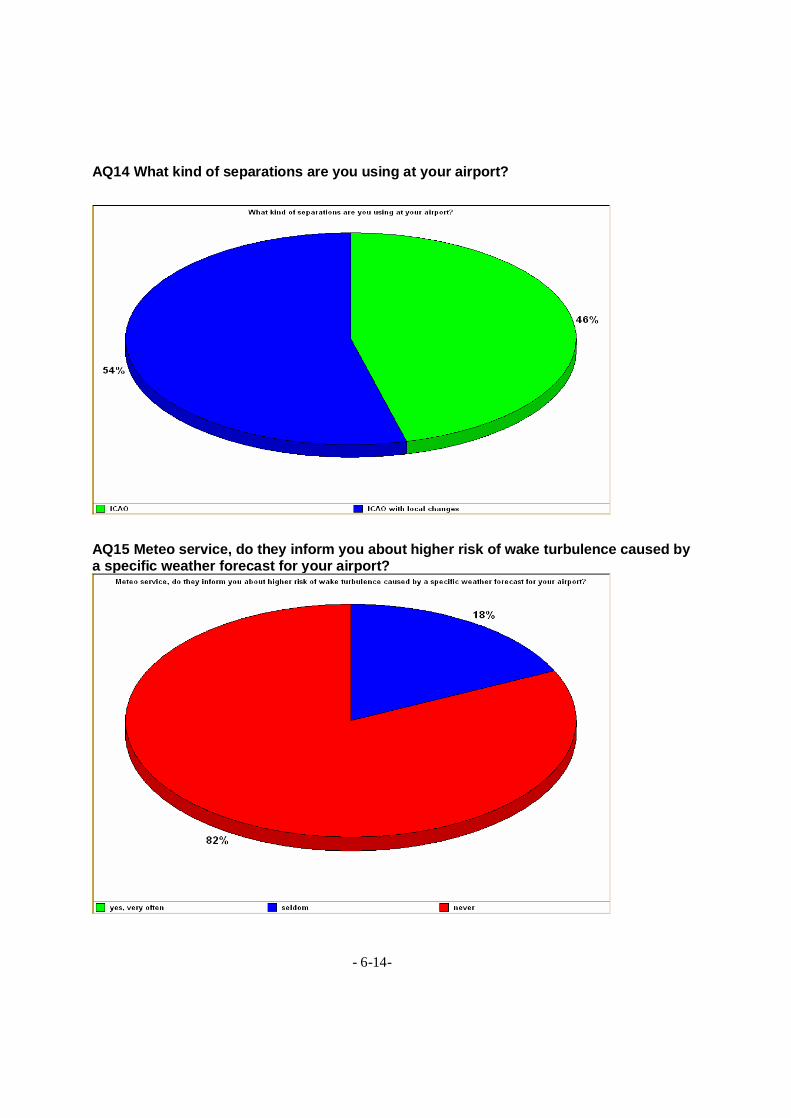
- 6-14-
AQ14 What kind of separations are you using at your airport?
AQ15 Meteo service, do they inform you about higher risk of wake turbulence caused by a specific weather forecast for your airport?
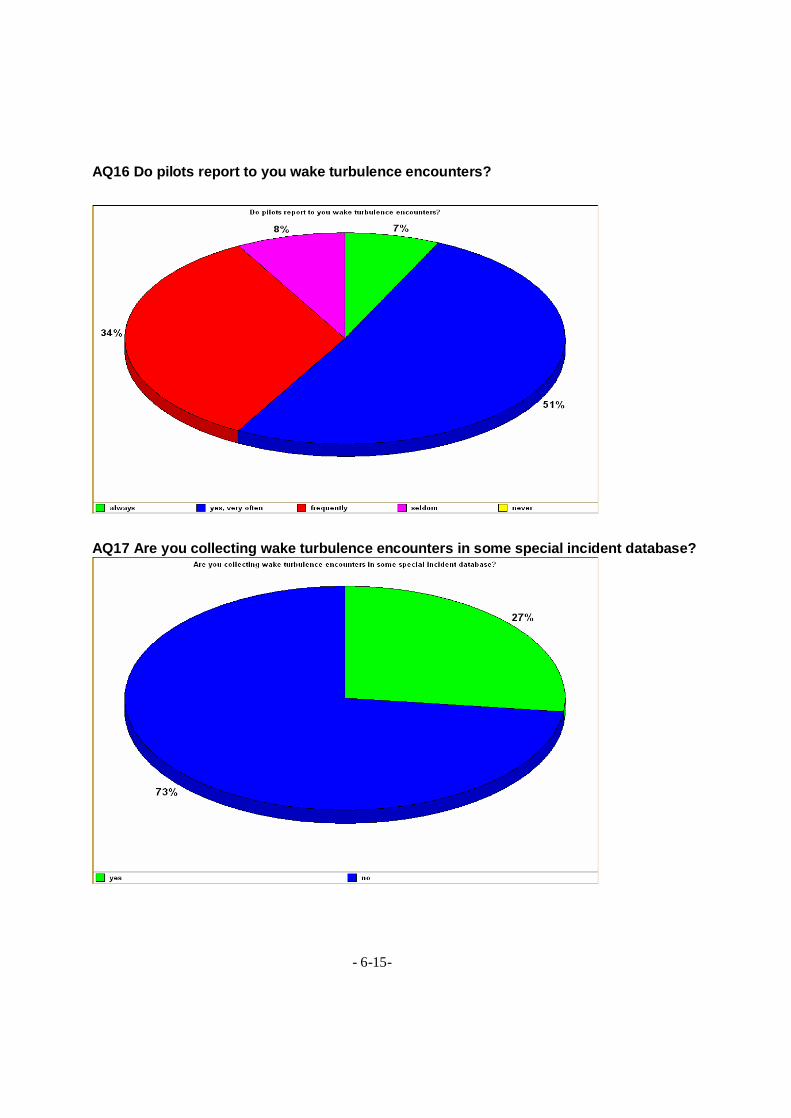
- 6-15-
AQ16 Do pilots report to you wake turbulence encounters?
AQ17 Are you collecting wake turbulence encounters in some special incident database?
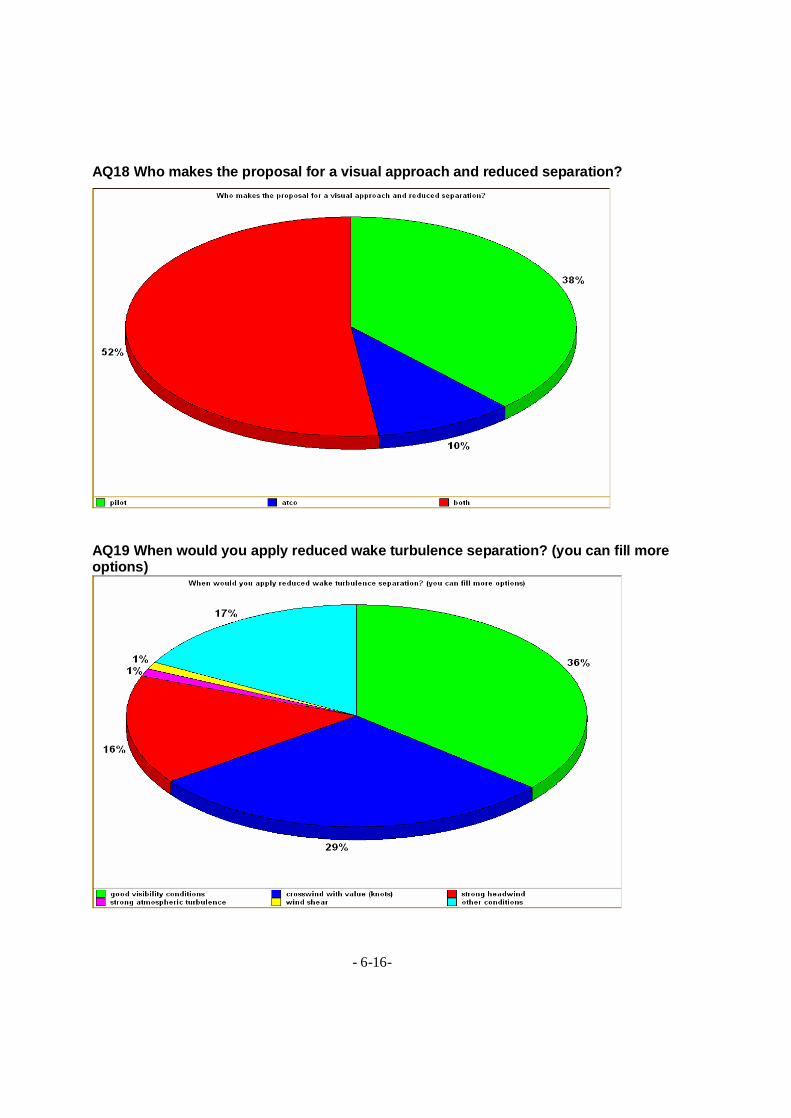
- 6-16-
AQ18 Who makes the proposal for a visual approach and reduced separation?
AQ19 When would you apply reduced wake turbulence separation? (you can fill more options)

- 6-17-
AQ20 What are the conditions you would never apply reduced wake turbulence separations?
AQ21 Who is responsible in case of reduced separation under ICAO?

- 6-18-
AQ22 What do you think is the worst-case scenario for wake turbulence encounter at single runway? Crosswind with value:
AQ23 Would you like to have WT visualization at your CWP?
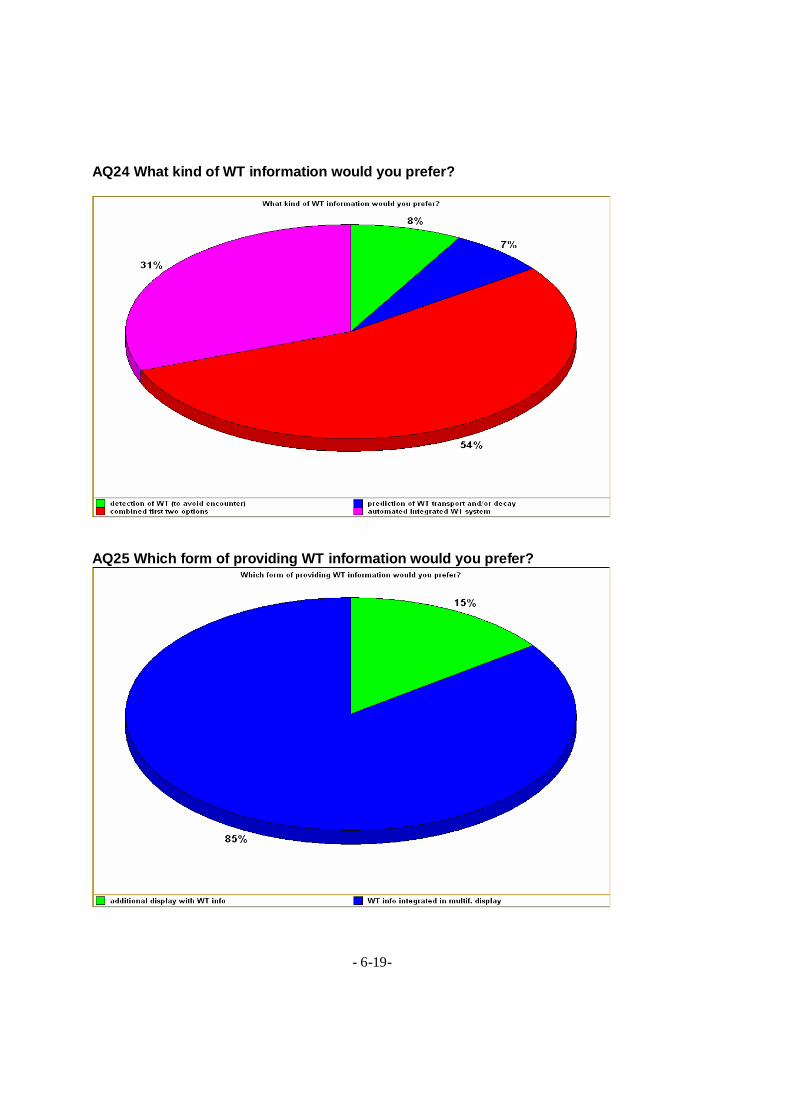
- 6-19-
AQ24 What kind of WT information would you prefer?
AQ25 Which form of providing WT information would you prefer?
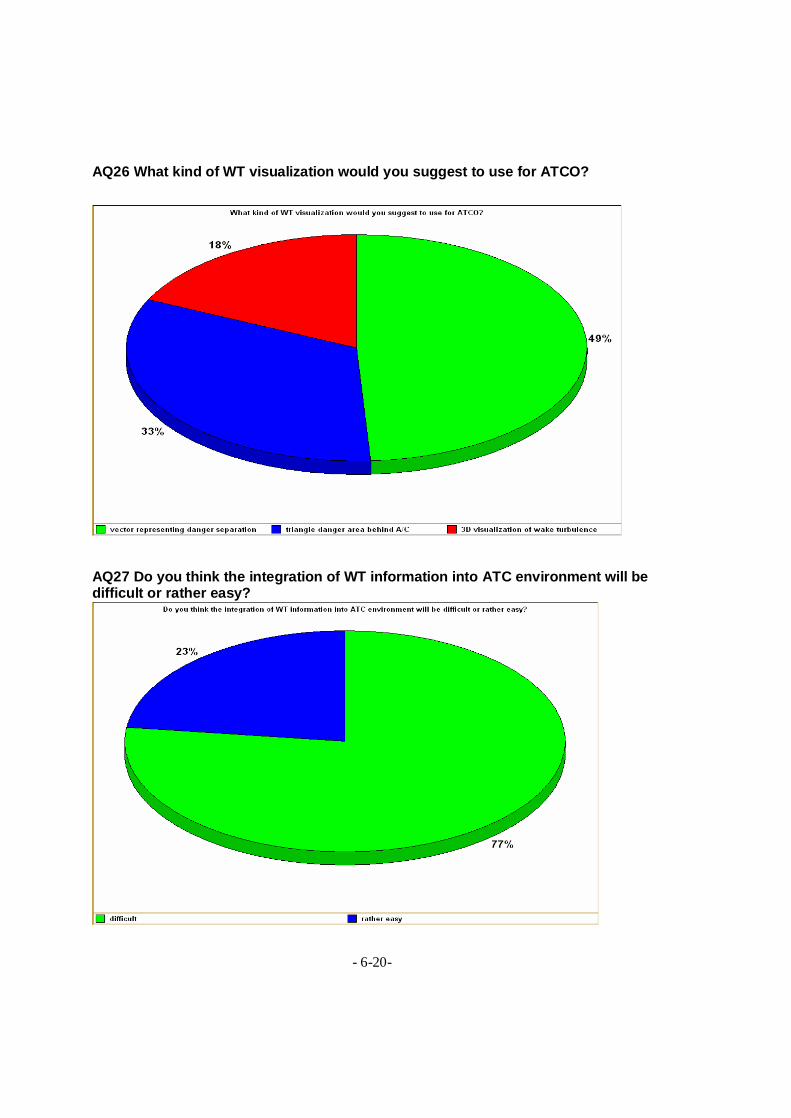
- 6-20-
AQ26 What kind of WT visualization would you suggest to use for ATCO?
AQ27 Do you think the integration of WT information into ATC environment will be difficult or rather easy?
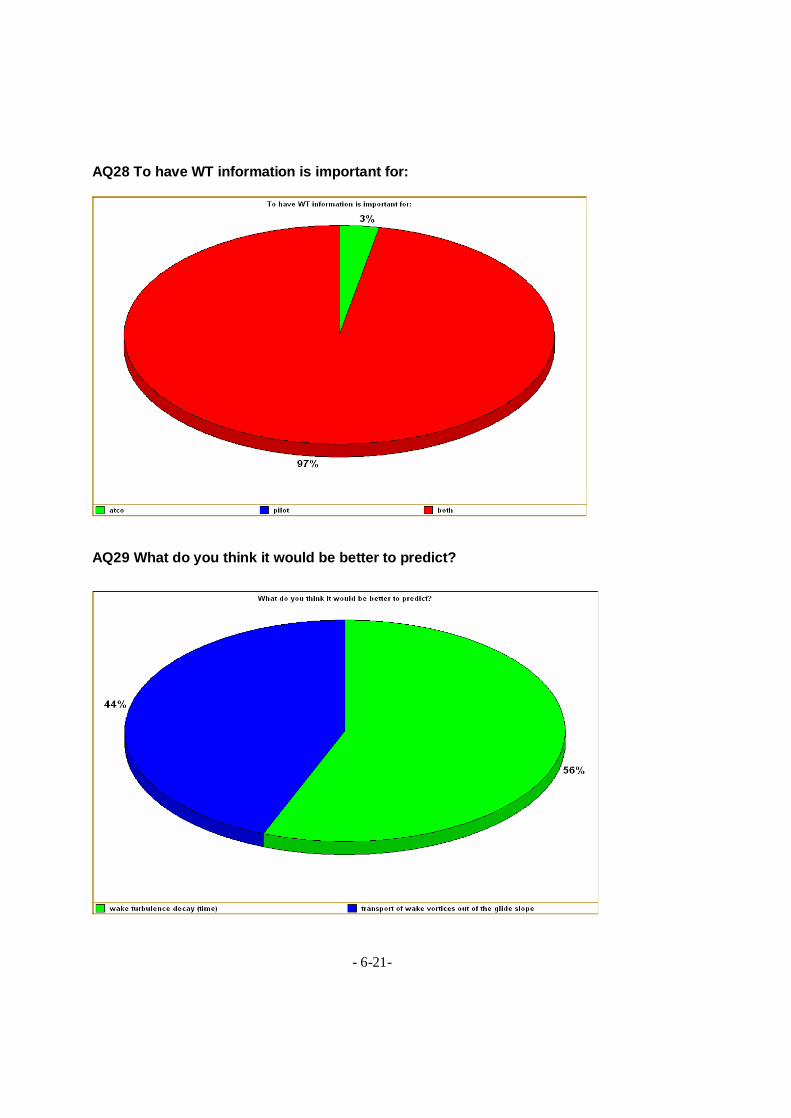
- 6-21-
AQ28 To have WT information is important for:
AQ29 What do you think it would be better to predict?
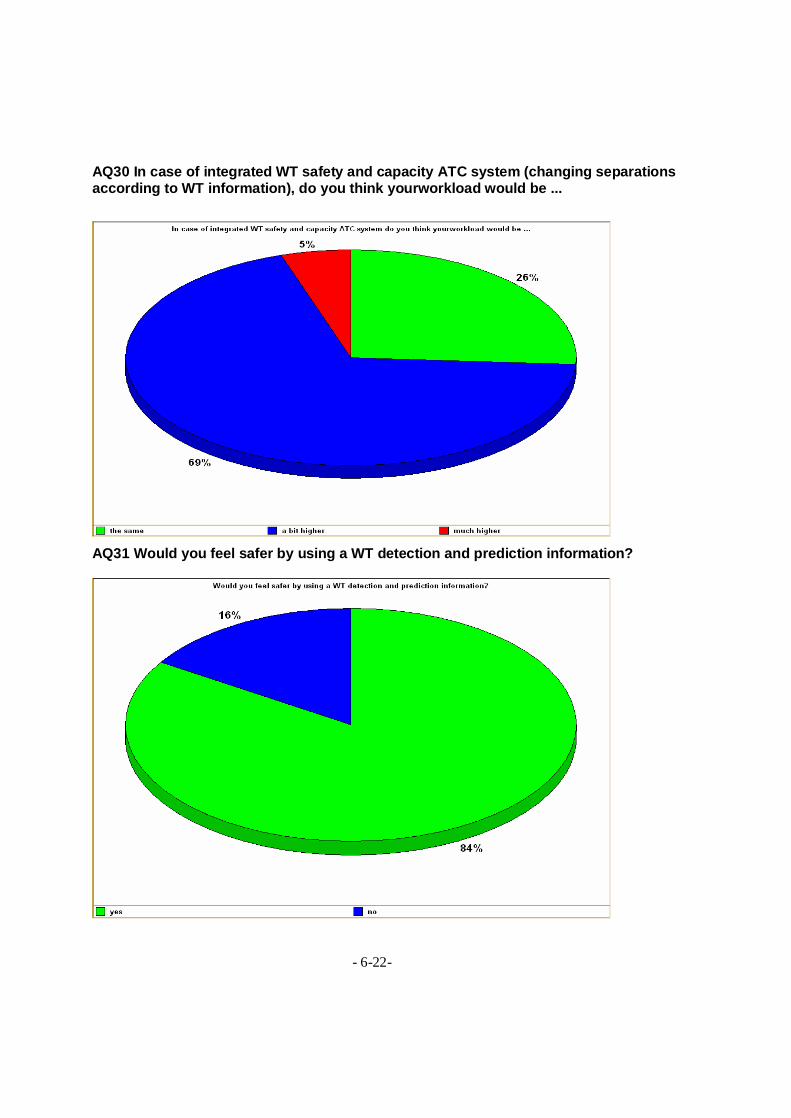
- 6-22-
AQ30 In case of integrated WT safety and capacity ATC system (changing separations according to WT information), do you think yourworkload would be ...
AQ31 Would you feel safer by using a WT detection and prediction information?
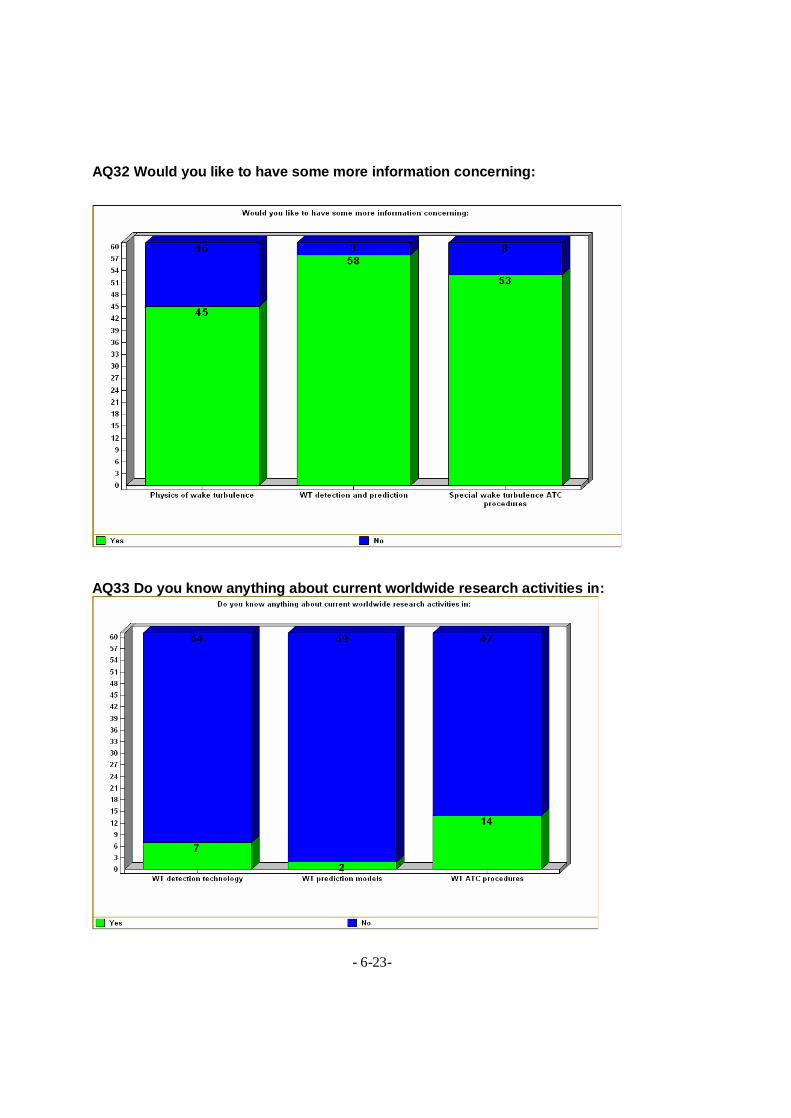
- 6-23-
AQ32 Would you like to have some more information concerning:
AQ33 Do you know anything about current worldwide research activities in:
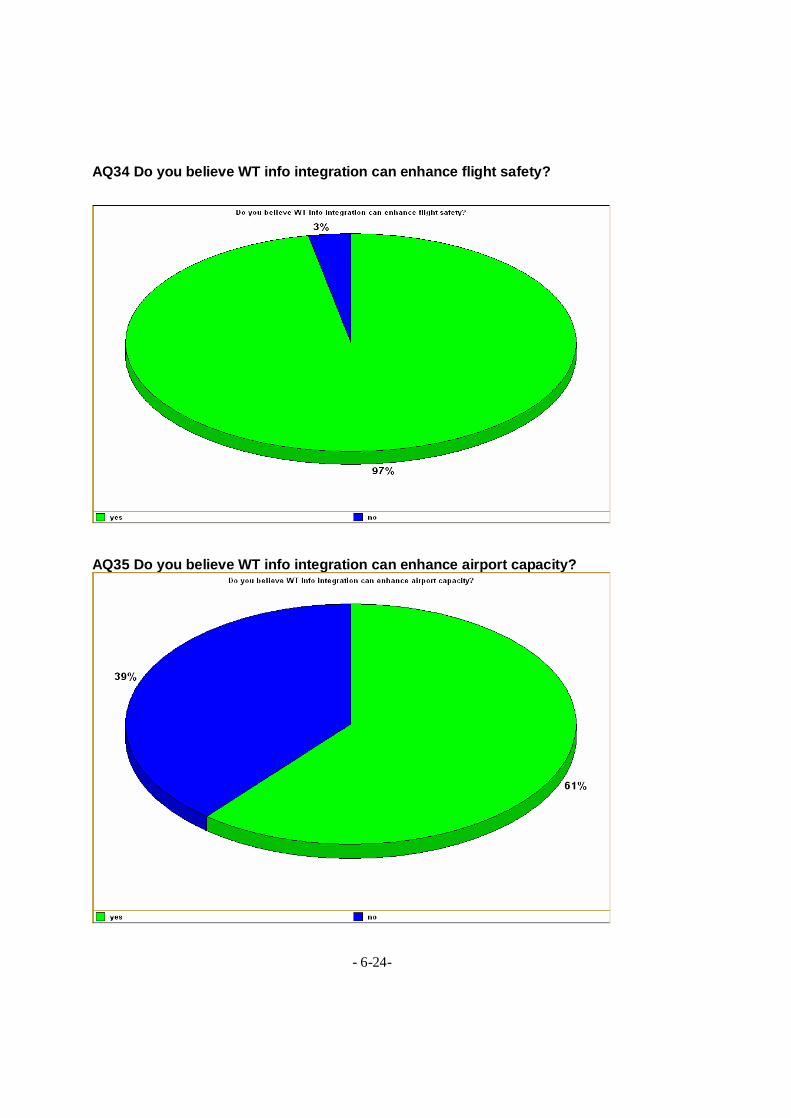
- 6-24-
AQ34 Do you believe WT info integration can enhance flight safety?
AQ35 Do you believe WT info integration can enhance airport capacity?
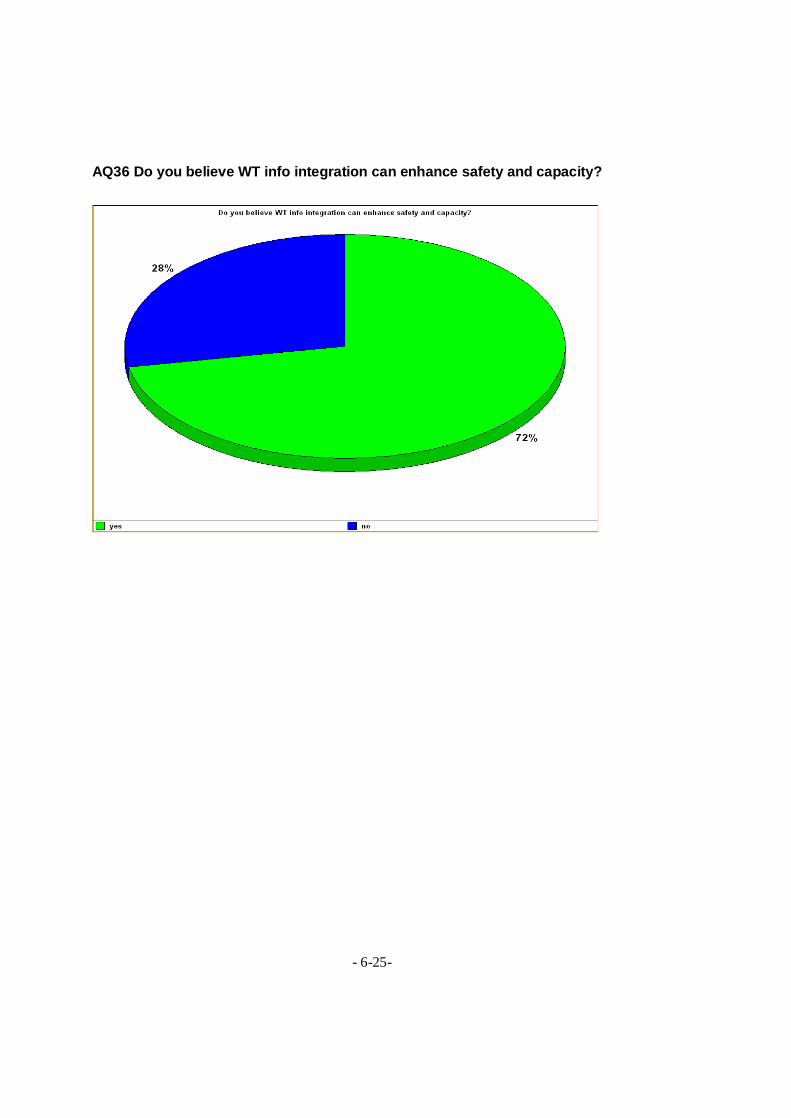
- 6-25-
AQ36 Do you believe WT info integration can enhance safety and capacity?
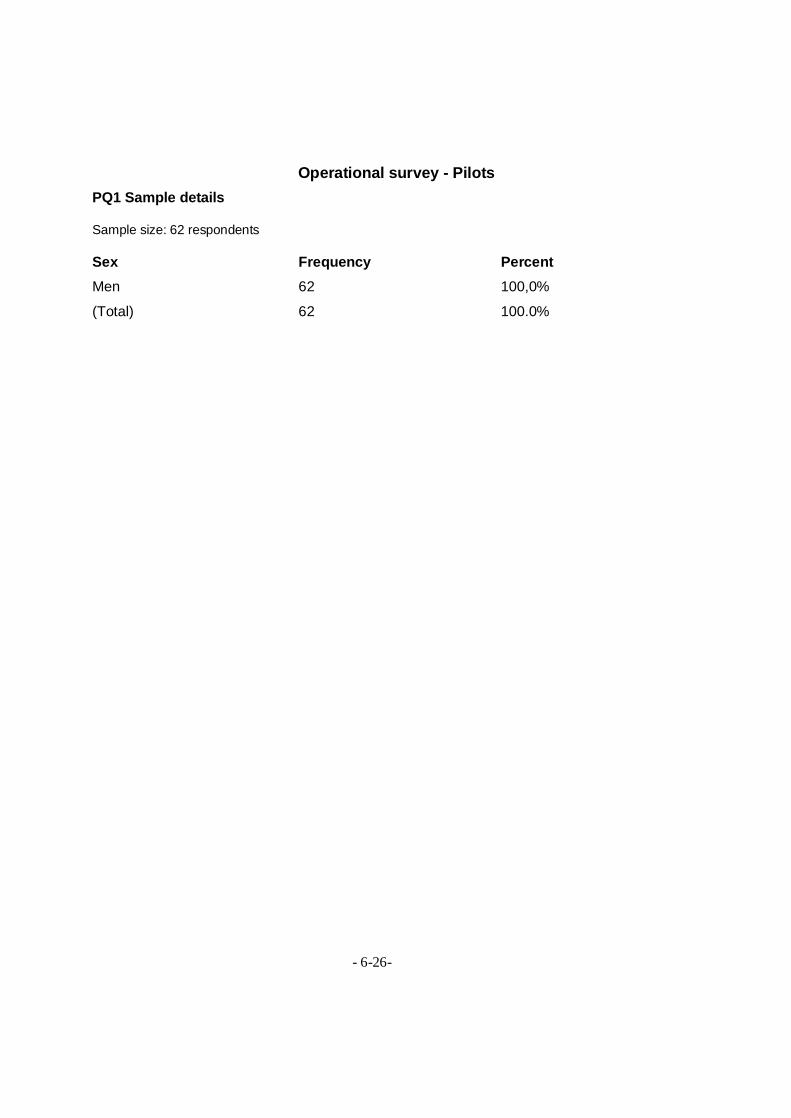
- 6-26-
Operational survey - Pilots PQ1 Sample details Sample size: 62 respondents Sex Frequency Percent Men 62 100,0%
(Total) 62 100.0%

- 6-27-
Age groups
02468
10121416
25 30 35 40 45 50 55 More
Age
Freq
uenc
y
Flight hours
0
5
10
15
20
25
30
4000 8000 12000 16000 More
Flight hours
Freq
uenc
y
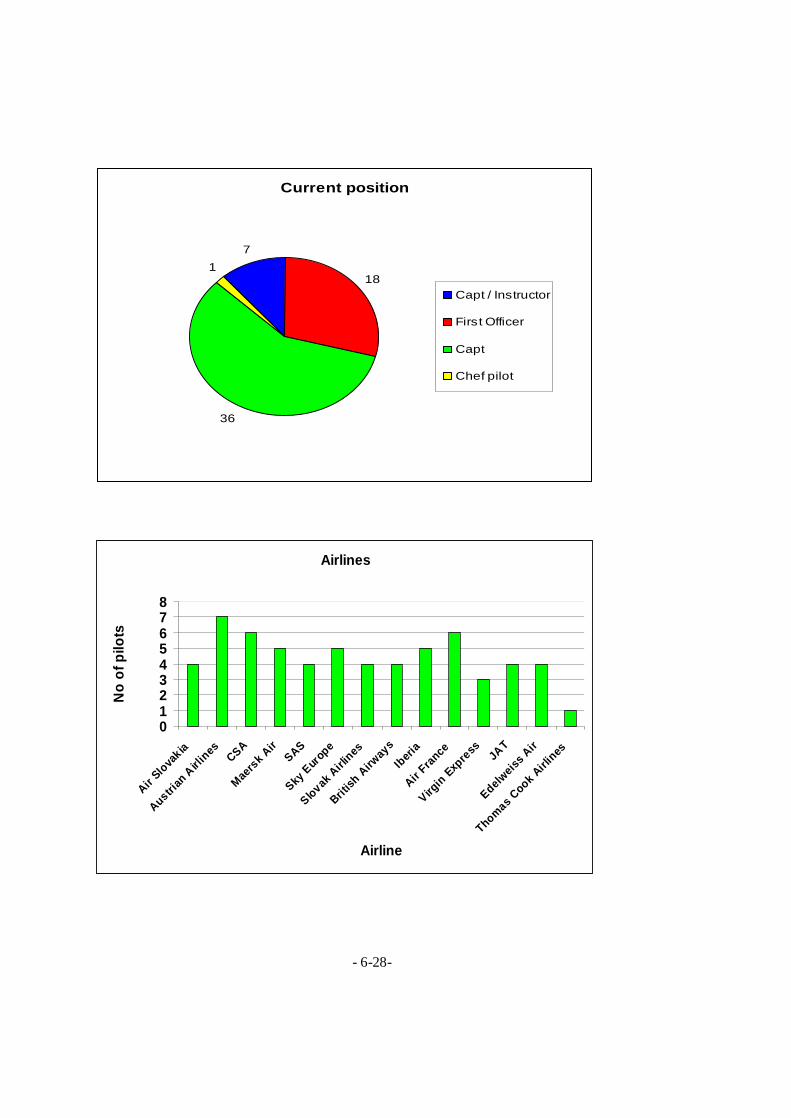
- 6-28-
Current position
7
18
36
1
Capt / Instructor
First Officer
Capt
Chef pilot
Airlines
012345678
Air Slova
kia
Austrian
Airli
nes
CSA
Maers
k Air
SAS
Sky E
urop
e
Slovak A
irlines
British
Airw
ays
Iberia
Air Fran
ce
Virgin Exp
ress JA
T
Edelweis
s Air
Thomas Cook A
irlines
Airline
No
of p
ilots
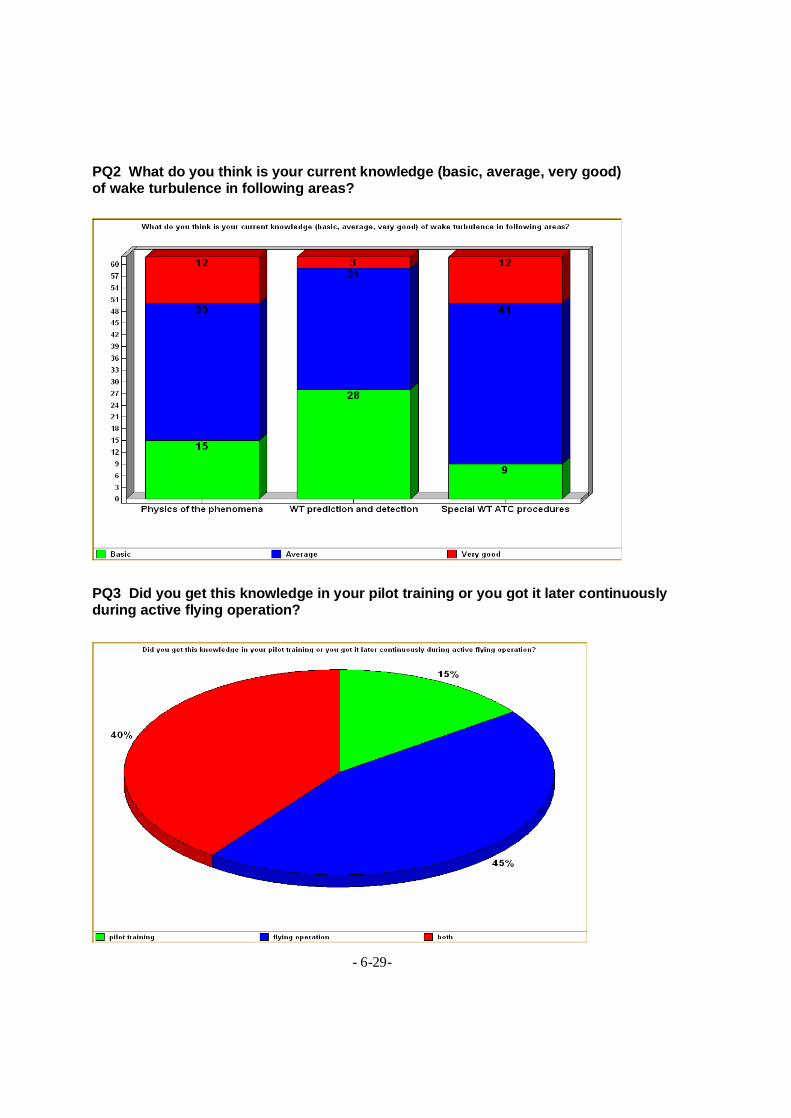
- 6-29-
PQ2 What do you think is your current knowledge (basic, average, very good) of wake turbulence in following areas?
PQ3 Did you get this knowledge in your pilot training or you got it later continuously during active flying operation?
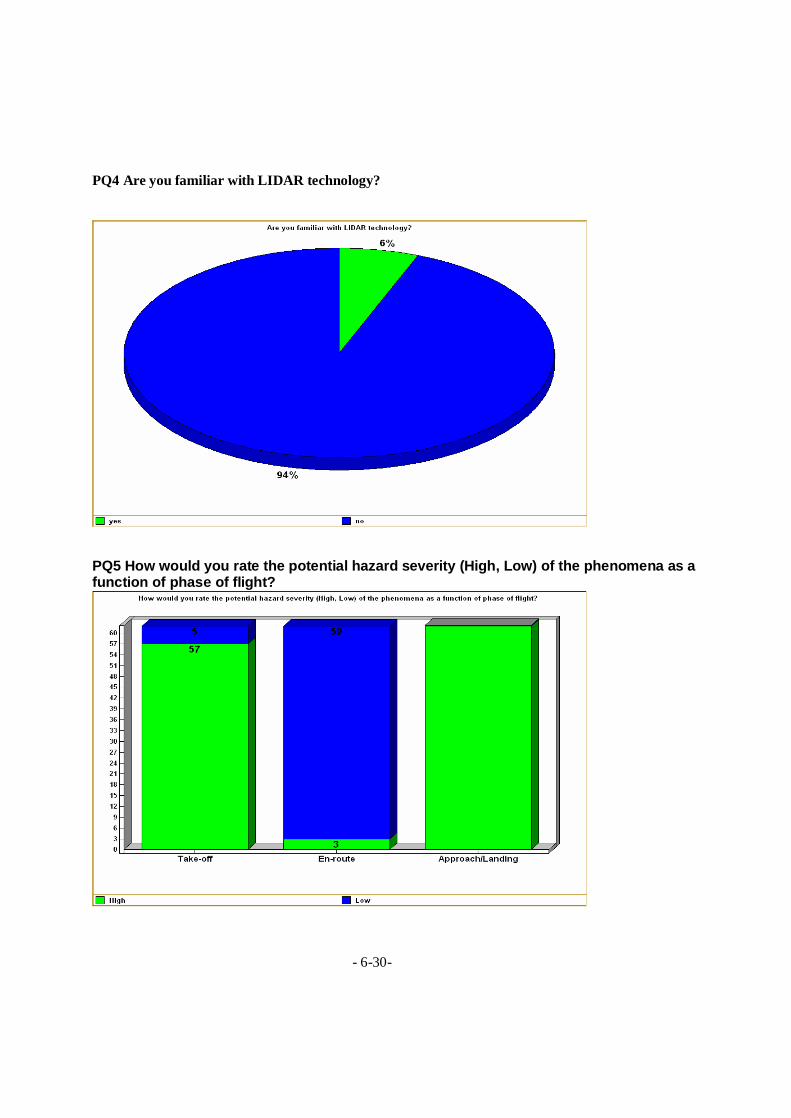
- 6-30-
PQ4 Are you familiar with LIDAR technology?
PQ5 How would you rate the potential hazard severity (High, Low) of the phenomena as a function of phase of flight?

- 6-31-
PQ6 In general, do you consider current ICAO wake turbulence separation standards safe or rather too conservative (waste of capacity)?
PQ7 Have you ever heard about wake turbulence related accident in IFR operation?
- 6-32-
PQ8 Number of incidents
no of incidents
0
5
10
15
20
25
30
0 5 1 10 30 3 50 20 150
no of incidents
perc
enta
ge
PQ9 What is your guess, how many wake turbulence incidents did occur at LHR in 2001 (incl. only British Airways aircrafts)?

- 6-33-
PQ10 How would you rate the importance in detecting of following hazards (1 for low priority, 5 for high priority)?
PQ11 Do you think aircraft wake turbulence categorization (H, M, L) should be changed and harmonized worldwide?

- 6-34-
PQ12 What destinations do you usually fly (at the present time)?
PQ13 What kind of separations are being used at your local airport?

- 6-35-
PQ14 Meteo service (or ATCO), do they inform you about higher risk of wake turbulence caused by a specific weather forecast for the airport?
PQ15 Have you already encountered wake turbulence of preceding aircraft in real operation?

- 6-36-
PQ16 Do you report wake turbulence encounters?
PQ17 Is your airline collecting wake turbulence encounters in some special incident database?
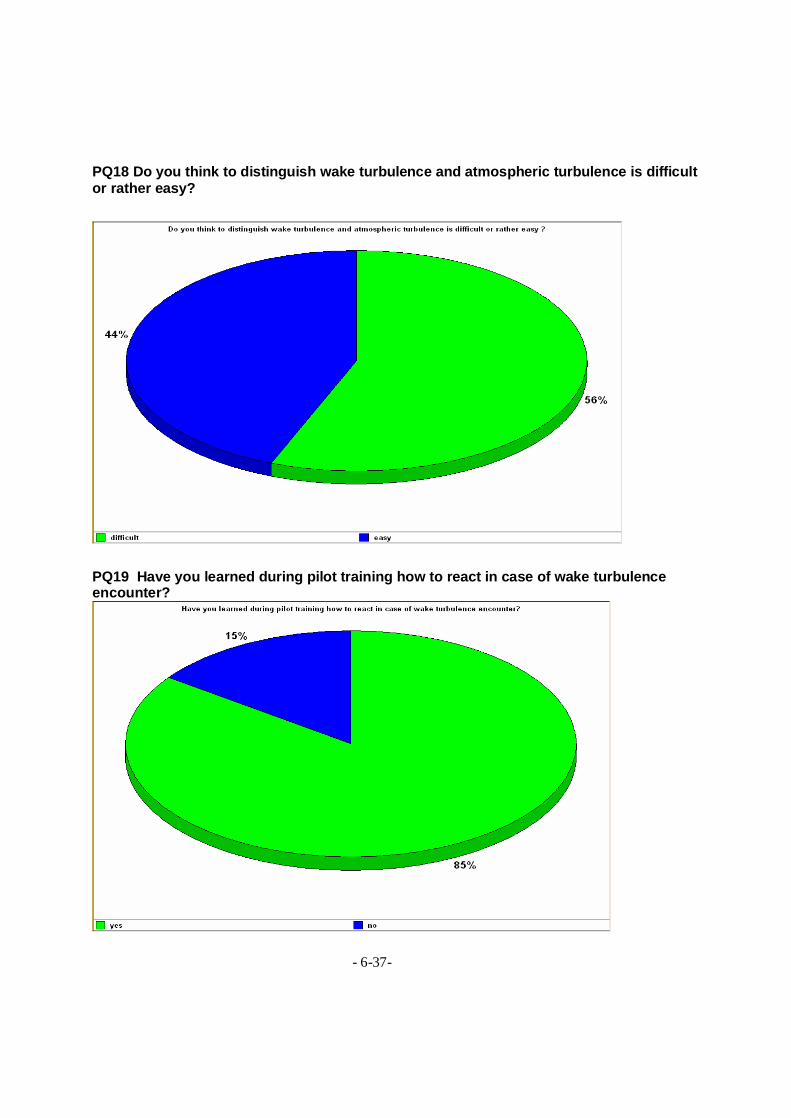
- 6-37-
PQ18 Do you think to distinguish wake turbulence and atmospheric turbulence is difficult or rather easy?
PQ19 Have you learned during pilot training how to react in case of wake turbulence encounter?

- 6-38-
PQ20 Who makes the proposal for a visual approach and reduced separation?
PQ21 When would you ask for a reduced separation (you can underline and/or fill more options)?
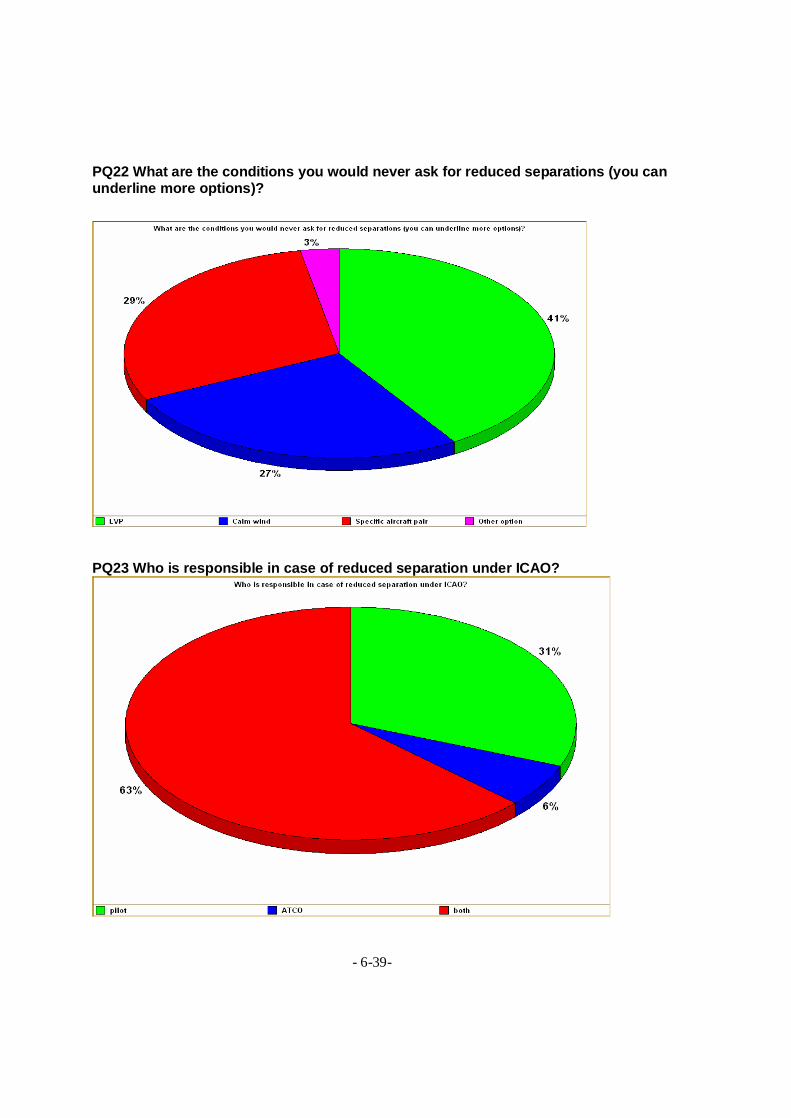
- 6-39-
PQ22 What are the conditions you would never ask for reduced separations (you can underline more options)?
PQ23 Who is responsible in case of reduced separation under ICAO?

- 6-40-
PQ24 What do you think is the worst-case scenario for wake vortex encounter at single runway? Crosswind with strength:
PQ25 Would like to have wake turbulence visualization in the cockpit?

- 6-41-
PQ26 What kind of WT information would you prefer?
PQ27 Which form of providing WT information would you prefer?
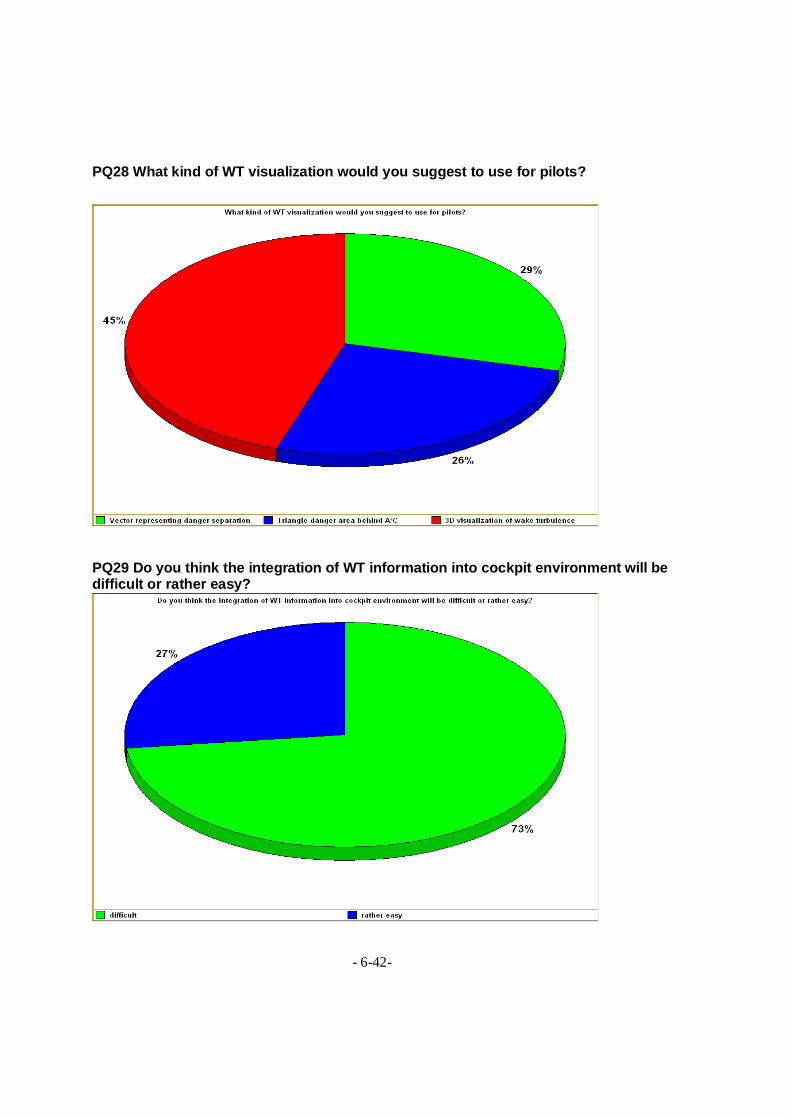
- 6-42-
PQ28 What kind of WT visualization would you suggest to use for pilots?
PQ29 Do you think the integration of WT information into cockpit environment will be difficult or rather easy?
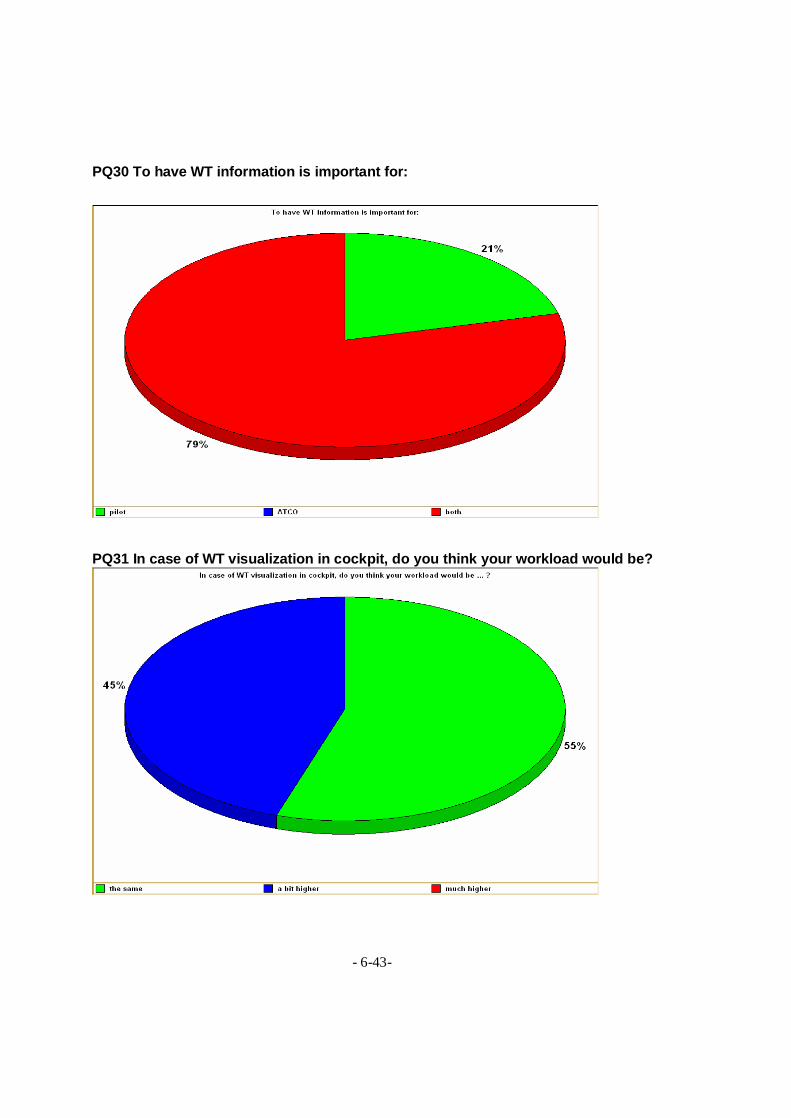
- 6-43-
PQ30 To have WT information is important for:
PQ31 In case of WT visualization in cockpit, do you think your workload would be?
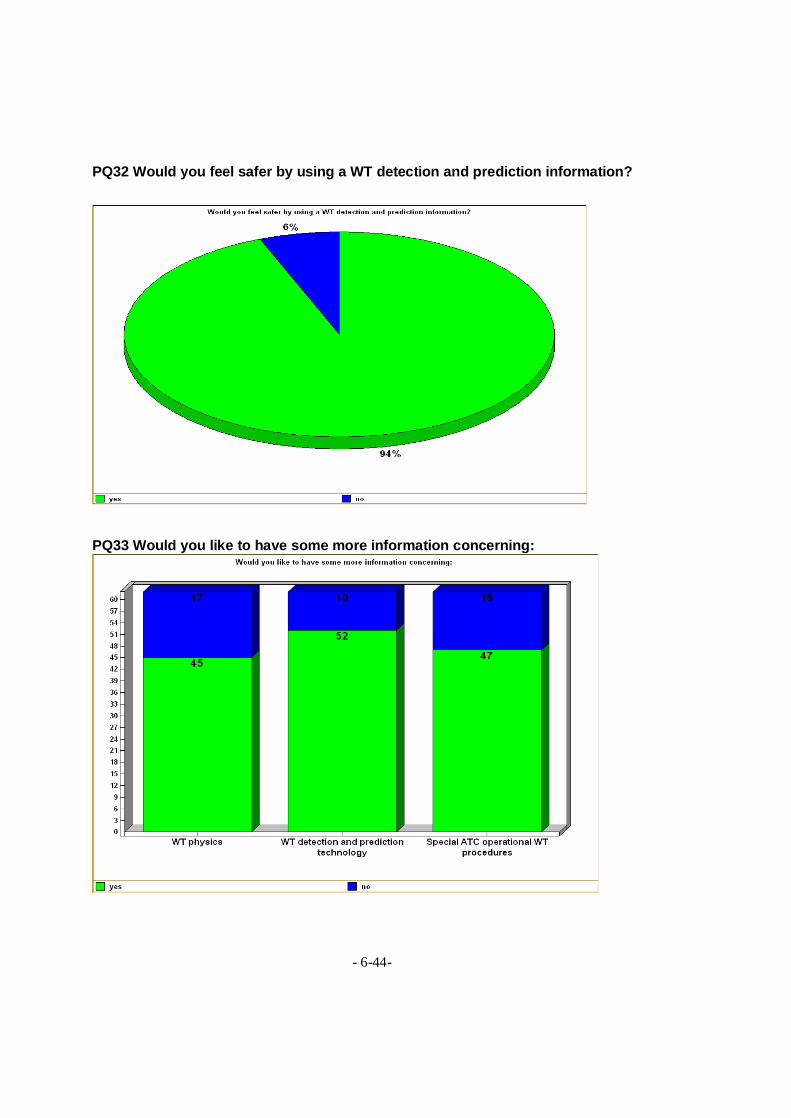
- 6-44-
PQ32 Would you feel safer by using a WT detection and prediction information?
PQ33 Would you like to have some more information concerning:
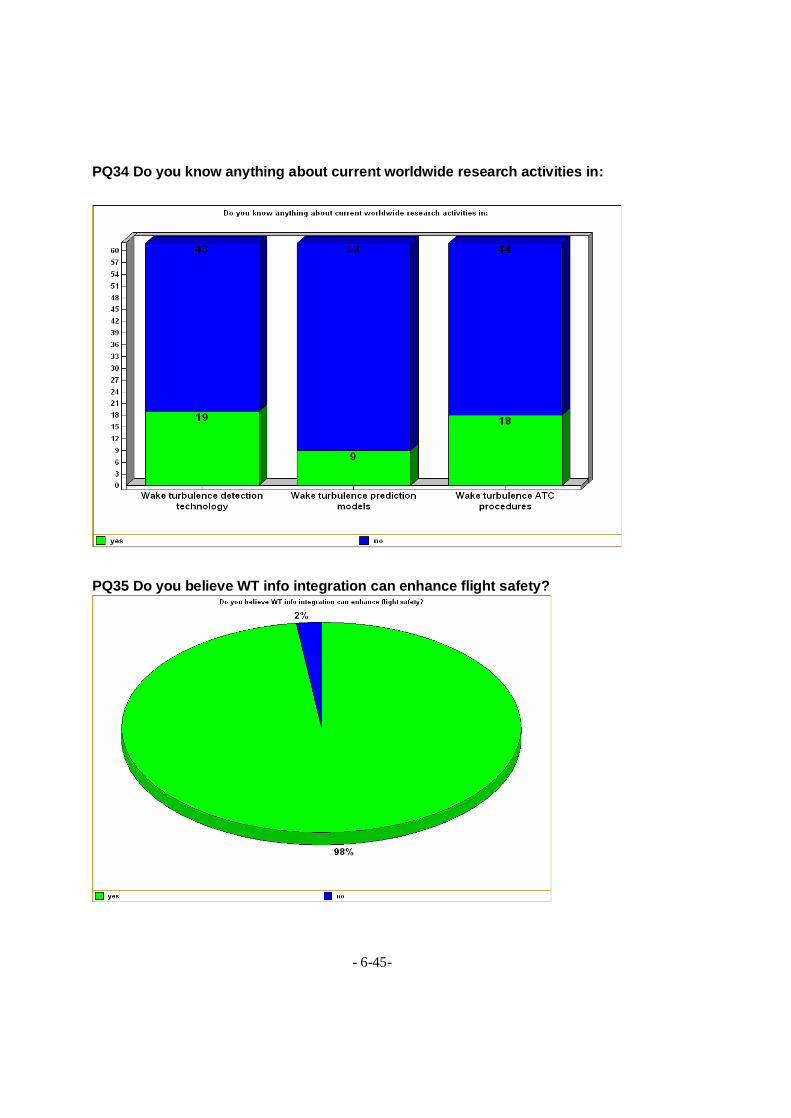
- 6-45-
PQ34 Do you know anything about current worldwide research activities in:
PQ35 Do you believe WT info integration can enhance flight safety?
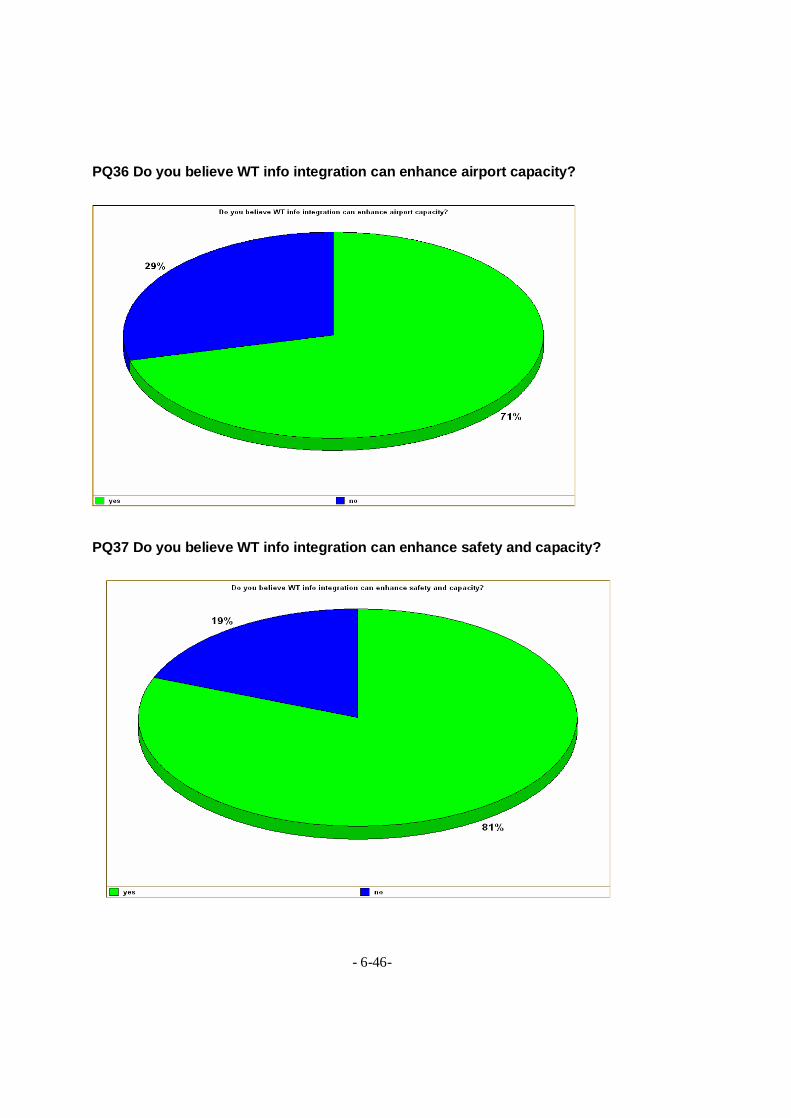
- 6-46-
PQ36 Do you believe WT info integration can enhance airport capacity?
PQ37 Do you believe WT info integration can enhance safety and capacity?
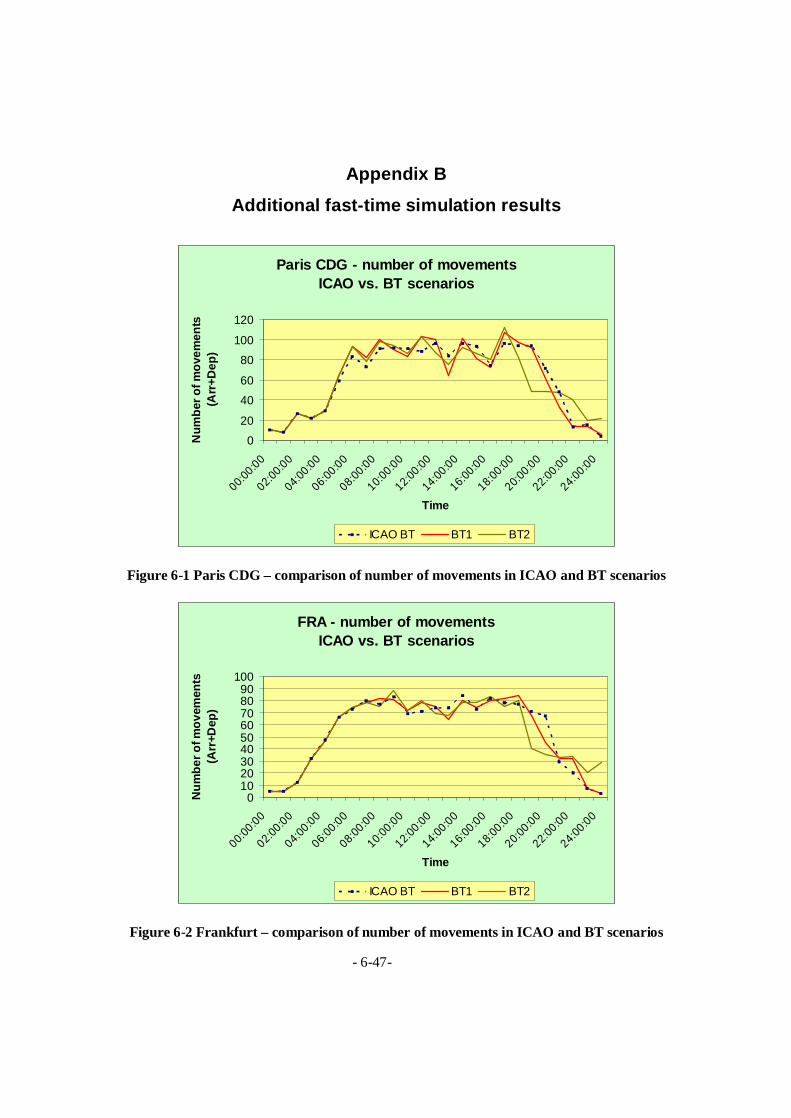
- 6-47-
Appendix B
Additional fast-time simulation results
Paris CDG - number of movements ICAO vs. BT scenarios
0
20
40
60
80
100
120
00:00:00
02:00:00
04:00:00
06:00:00
08:00:00
10:00:00
12:00:00
14:00:00
16:00:00
18:00:00
20:00:00
22:00:00
24:00:00
Time
Num
ber o
f mov
emen
ts
(Arr
+Dep
)
ICAO BT BT1 BT2
Figure 6-1 Paris CDG – comparison of number of movements in ICAO and BT scenarios
FRA - number of movements ICAO vs. BT scenarios
0102030405060708090
100
00:00:00
02:00:00
04:00:00
06:00:00
08:00:00
10:00:00
12:00:00
14:00:00
16:00:00
18:00:00
20:00:00
22:00:00
24:00:00
Time
Num
ber o
f mov
emen
ts
(Arr
+Dep
)
ICAO BT BT1 BT2
Figure 6-2 Frankfurt – comparison of number of movements in ICAO and BT scenarios

- 6-48-
LHR - number of movements ICAO vs. BT scenarios
020406080
100120
00:00
:00
02:00
:00
04:00
:00
06:00
:00
08:00
:00
10:00
:00
12:00
:00
14:00
:00
16:00
:00
18:00
:00
20:00
:00
22:00
:00
24:00
:00
02,02
:00:00
02,04
:00:00
02,06
:00:00
02,08
:00:00
Time
Arr
+Dep
ICAO BT BT1 BT2
Figure 6-3 London Heathrow – comparison of number of movements in ICAO and BT scenarios

- 6-49-
Paris CDG airport delay composition - ICAO
0
50000
100000
150000
200000
250000
00:00:00
02:00:00
04:00
:00
06:00:0
0
08:00:0
0
10:00:00
12:00:00
14:00:00
16:00:00
18:00:0
0
20:00:0
0
22:00:0
0
0 :00:00
Time
Cum
ulat
ive
dela
y pe
r ho
ur (s
ec)
Gate (secs) Taxiway (secs) Sequencing (secs) Runway (secs)
Figure 6-4 Airport delay composition at Paris CDG in ICAO scenario
Paris CDG airport delay composition - BT1
020000400006000080000
100000120000
00:00:00
02:00:00
04:00:00
06:00:00
08:00:00
10:00:00
12:00:00
14:00:00
16:00:00
18:00:00
20:00:00
22:00:00
00:00:00
Time
cum
ulat
ive
dela
y pe
r ho
ur (s
ec)
Gate (secs) Taxiway (secs) Sequencing (secs) Runway (secs)
Figure 6-5 Airport delay composition at Paris CDG in BT1 scenario
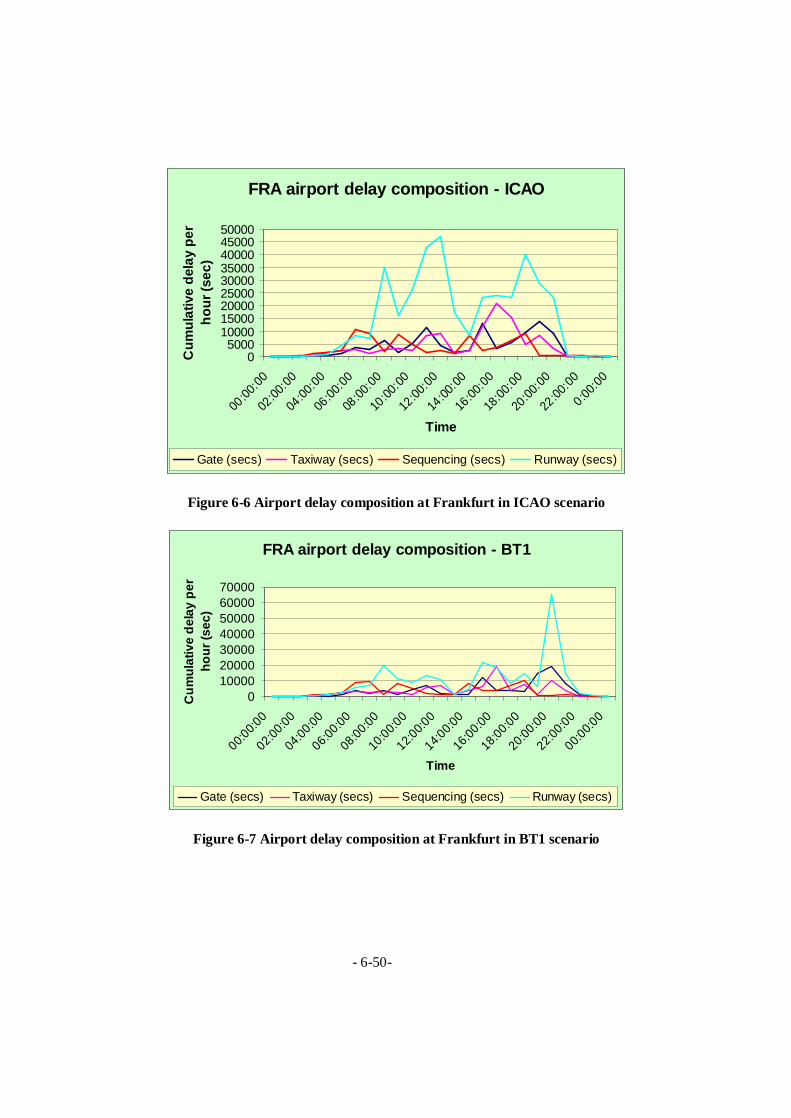
- 6-50-
FRA airport delay composition - ICAO
05000
100001500020000250003000035000400004500050000
00:00
:00
02:00
:00
04:00
:00
06:00
:00
08:00
:00
10:00
:00
12:00
:00
14:00
:00
16:00
:00
18:00
:00
20:00
:00
22:00
:00
0:00:00
Time
Cum
ulat
ive
dela
y pe
r ho
ur (s
ec)
Gate (secs) Taxiway (secs) Sequencing (secs) Runway (secs)
Figure 6-6 Airport delay composition at Frankfurt in ICAO scenario
FRA airport delay composition - BT1
010000200003000040000500006000070000
00:00:0
0
02:00:00
04:00
:00
06:00:00
08:00
:00
10:00:0
0
12:00:0
0
14:00:00
16:00
:00
18:00
:00
20:00
:00
22:00
:00
00:00:0
0
Time
Cum
ulat
ive
dela
y pe
r ho
ur (s
ec)
Gate (secs) Taxiway (secs) Sequencing (secs) Runway (secs)
Figure 6-7 Airport delay composition at Frankfurt in BT1 scenario

- 6-51-
LHR airport delay composition - ICAO
0200000400000600000800000
10000001200000140000016000001800000
00:00
:00
02:00
:00
04:00
:00
06:00
:00
08:00
:00
10:00
:00
12:00
:00
14:00
:00
16:00
:00
18:00
:00
20:00
:00
22:00
:00
0:00:00
Time
Cum
ulat
ive
dela
y pe
r ho
ur (s
ec)
Gate (secs) Taxiway (secs) Sequencing (secs) Runway (secs)
Figure 6-8 Airport delay composition at London Heathrow in ICAO scenario
LHR airport delay composition - BT1
020000400006000080000
100000120000
00:00
:00
02:00
:00
04:00
:00
06:00
:00
08:00
:00
10:00
:00
12:00
:00
14:00
:00
16:00
:00
18:00
:00
20:00
:00
22:00
:00
00:00
:00
Time
Cum
ulat
ive
dela
y pe
r ho
ur (s
ec)
Gate (secs) Taxiway (secs) Sequencing (secs) Runway (secs)
Figure 6-9 Airport delay composition at London Heathrow in BT1 scenario

6-52
Appendix C
List of publications
1. Wake turbulence as a reason of incidents, Safety seminar proceedings, University of Zilina,
June 2002
2. Wake vortex in air traffic control, University studies - Journal, University of Zilina, May 2002
3. Integrated air traffic control wake vortex safety and capacity system, In proceedings of New
trends in Civil Aviation, Prague, September 2002
4. Wake vortex related technology and procedures (state-of-the-art), published as Annex to
ATC-WAKE deliverable WP1100, ATC-Wake consortium, 2002
5. Dissertation minimum – Comprehensive study of the wake vortex phenomena to the
incorporation of its assessment to ATM for safety and capacity improvements, University of
Zilina, November 2002
6. Dynamic air traffic control wake vortex safety and capacity system, TRANSCOM 2003
proceedings, Zilina, June 2003
7. A vision of wake vortex research for next 20 years, 5th USA/EUROPE ATM R&D Seminar
proceedings, Budapest, June 2003
8. The concept of integrated air traffic control wake vortex safety and capacity system, IEEE
Intelligent Transportation System Conference proceedings, Shanghai, October 2003
9. Dynamic air traffic control wake vortex safety and capacity system, Komunikácie -
Communications, Special edition of Journal – best TRANSCOM papers, January 2004
10. General approach for assessment of capacity benefit for dynamic ATC wake vortex safety and
capacity system, Perner’s Contact seminar proceedings, Pardubice (Czech Republic),
February 2004
11. Summary of PhD thesis, INO annual report 2003, Eurocontrol 2004
12. Airport capacity assessment with fast time simulation, University studies – Journal, University
of Zilina, May 2004
13. Quantitatively estimating wake vortex safety using P2P model, 6th USA/EUROPE ATM
R&D seminar proceedings - Joint paper with Richard Xie and Dr. John Shortle from
George Mason University
14. TAAM study to investigate a potential runway throughput increase by reduction of wake
vortex separations, In proceedings of Research Innovation Vision Futur (RIVF)
conference, Can-Tho, Vietnam, February 2005

- 6-53-
15. Quantitatively estimating wake vortex safety using P2P model, INO annual report 2004,
Eurocontrol 2005
16. Safe ICAO separations limiting airport capacity – case study London Heathrow,
TRANSCOM 2005 proceedings, University of Zilina, June 2005
17. Can busy airports easily comply with ICAO recommended wake turbulence separations?,
Accident rate mitigation seminar proceedings, University of Zilina, May 2005
18. Dynamic wake turbulence separation criteria and its impact on airport capacity,
MOSATT (Modern Safety Technologies in Transportation) 2005 conference
proceedings, Slovak Academy of Sciences Kosice, October 2005
19. Airport capacity improvements by dynamic wake turbulence separations, accepted paper
to be published at International Congress of Aeronautical Sciences (ICAS) 2006 in
Hamburg in June 2006.
20. Introduction of dynamic wake turbulence separation criteria and its impact on airport
delays and runway throughput, accepted at IEEE Digital Avionics System Conference
2005, Washington DC, USA, October 2005 (finally not published in proceedings due to
IP agreement between DASC and Eurocontrol Experimental Centre) – this paper will be
updated, modified and re-submitted to 2nd ICRAT in February 2006

- 6-54-
Bibliography
Agnew P., Hoad D. 2002. Climatology study of world airports in the context of wake vortex behavior classes, Proceedings 10th Conference on Aviation, Range and Aerospace Meteorology, Portland, 2002.
Ashford F.A., Wright P.H. 1992. Airport engineering, 1992.
Astegiani G., Casanova D., Van Engelen J., Isambert E., Treve V. 2003. ATC-Wake Report for WP1000 System Requirements, ATC-Wake D1_5, 2003.
BAA 2004. BAA Heathrow sustainability report 2003/2004, BAA 2004.
Bakker, G. J. and H.A.P. Blom 1993. Air Traffic Collision Risk Modeling, Proceedings of the
32nd IEEE Conference on Decision and Control. Vol.2, Institute of Electrical and Electronics Engineers, New York, pp. 1464 – 1469, 1993.
Benjamin, S.G; Schwartz, B.E. and Cole, R.E. 1999. Accuracy of ACARS Wind and Temperature Observations Determined by Collocation, Weather and Forecasting, 14, 1032-1038, 1999.
Blom, H., B. Bakker, et al. 2003. Collision Risk Modeling Of Air Traffic. Final Report for HYBRIDGE Project, NLR, 2003.
Boeing 2002. Statistical summary of commercial jet airplane accidents (Worldwide operations 1959-2001), www.boeing.com , 2002.
Campbell S. et al 1997. Wake vortex field measurement program at Memphis, TN Data Guide, MIT Lincoln Laboratory Project report NASA/L-2, January 1997.
Cornman, L.B., Morse, C.S., and Cunning, J. 1995. Real-time estimation of atmospheric turbulence severity from in-situ aircraft measurements. J. Aircraft, 32 (1), 171-177, 1995.
de Bruin A., Speijker L, Moet H., Krag B., Luckner R., Mason S. 2003. S-Wake, Assessment of wake vortex safety, NLR Technical report 2003-243, 76pp, 2003.
Dempsey P.S. 2000. Airport planning and development, McGraw-Hill Professional , 2000.

- 6-55-
Doms G., Schaettler U. 1999. The nonhydrostatic limited area model LM (Lokal Modell) of DWD. Part I: Scientific documentation, Deutscher Wetterdienst, Offenbach 1999.
Donohue G., Rutishauser D. 2001. The effect of aircraft wake vortex separation on air transportation capacity, 4th USA/EUROPE ATM R&D Seminar, Santa Fe, USA, December 2001.
European Commission – Group of personalities 2001. European aeronautics – A vision for 2020, 2001.
FAA 2004. Pilot/Controller Glossary (P/CG), FAA, 2004
FAA/Eurocontrol 2003. FAA/Eurocontrol Action Plan 14 – Wake vortices, June 2003
FAA/Eurocontrol 1999. FAA/Eurocontrol Action Plan 3 - Air Traffic modelling for separation standards, November 1999.
Ferrara G. 2004. The SSAP initiative, Skyway Issue 33, Eurocontrol, 2004.
Fishburn, P., Stouppe, M.S.1997. Simulation: a powerful planning tool, 1997.
Frech M., Holzapfel F., Gerz T., Konopka J. 2002. Short term prediction of the horizontal wind vector within a wake vortex warning system, Meteorol. Applications Vol. 9, 2002.
Frech M., Holzapfel F. 2002. A probabilistic prediction scheme for wake vortex evolution in a convective boundary layer, Air Traffic Control Quarterly, Vol. 10, 2002.
Frech M., Zinner T. 2004. Wake vortex behaviour classes and their initial validation, Journal of Aircraft Vol. 41, 564-570, 2004.
GAO 2000. Aviation safety - Safer skies initiative has taken initial steps to reduce accident rates by 2007, Report to subcommittee on aviation, House of representative, General Accounting Office, 2000.
Gerz T., Ehret T. 1996. Wake dynamics and exhaust distribution behind cruising aircraft, AGARD CP 584, 1996.
- 6-56-
Gerz T., Holzapfel F. 1999. Wingtip vortices, turbulence and distribution of emissions, AIAA Journal Vol. 37, pp. 1270-1276, 1999.
Gerz, T., Holzaepfel, F., Darracq, D. 2002. Commercial Aircraft Wake Vortices. Progress in Aerospace Sciences, Vol. 38, No. 3, pp. 181-208, 2002.
Glahn H.R., Lowry D.A. 1972. The use of model output statistics (MOS) in objective weather forecasting, Journal of applied meteorology, Vol. 11, December 1972.
Grell G.A., Emeis S., Stockwell W.R., Schoenemeyer T., Forkel T., Michalakes J., Knoche R., Seidl W. 2000. Application of a multiscale, coupled MM5/chemistry model to the complex terrain of the VOTALP valley campaign, Atmos. Environment Vol. 34, 2000.
Hamill T.M, Colucci S.J. 1997. Verification Eta-RSM short-range ensemble forecasts, Monthly weather Review, Vol. 125, June 1997.
Han J., Lin Y.-L., Pal Arya S., Proctor F.H. 1999. Large eddy simulation of aircraft wake vortices in homogeneous atmospheric turbulence: vortex decay and descent, AIAA Proceedings 99-0756, 1999.
Haynie, R. 2002. An Investigation Of Capacity And Safety In Near-Terminal Airspace For Guiding Information Technology Adoption. George Mason University dissertation, George Mason University, 2002.
Hemm R., Shapiro G. Lee et al. 1999. Benefit estimates of terminal area productivity program technologies, NASA/CR-19990208989, January 1999.
Henderson S.W., Suni P.J.M., Hale C.P., Hannon S.M., Magee J.R., Bruns D.L., Yuen E.H. 1993. Coherent laser radar at 2um using solid state lasers, IEEE Transactions on Geoscience and Remote Sensing, Vol. 31, 1993.
Hinton D., Charnock J., Bagwell D. 2000. Design of an aircraft vortex spacing system for airport capacity improvement, AIAA, January 2000.
Hinton D. 2001. Description of selected algorithms and implementation details of a concept demonstration aircraft vortex spacing system, NASA, June 2001.

- 6-57-
Hinton et al. 2000. Design of an aircraft vortex spacing system for airport capacity improvement, AIAA Conference proceedings 2000-0622, 18pp, 2000.
Hofbauer T. 2003. Numerische Untersuchungen zum Einfluss von Windscherung und Turbulenz auf Flugzeugwirbelschleppen, DLR-FB 2003-01, Koln, 2003.
Hofbauer T., Gerz T. 2000. Shear layer effects on the dynamics of a counter rotating vortex pair, AIAA Proceedings 2000-0758, 2000.
Hofbauer T., Holzapfel F. 2003. Behavior of aircraft wake vortices subjected to wind shear, AIAA Proc. 2003-3813, 2003.
Holzaepfel, F., Gerz T., and Baumann R. 2001. The Turbulent Decay of Trailing Vortex Pairs in Stably Stratified Environments, Aerosp. Sci. Technol. 5 ,2001.
Holzafpfel F, Hofbauer T., Darracq D., Moet H., Garnier F., Ferreira Gago C. 2003. Analysis of wake vortex decay mechanisms in the atmosphere, Aerospace Science Technology Vol. 7, 263-275, 2003.
Holzafpfel F. 2003. A probabilistic two-phase wake vortex decay and transport model, Journal of Aircraft, Vol. 40, 2, 2003.
Holzafpfel F., Gerz T., Kopp F., Stumpf E., Harris M., Young R.I., Dolfi-Bouteyre A. 2003. Strategies for circulation evaluation of aircraft wake vortices measured by lidar, Journal of Atmospheric Oceanic Technology Vol. 20, 2003.
Holzapfel F. 2004. A probabilistic two-phase wake vortex decay and transport model: Application and assessment, Journal of Aircraft, Vol. 41, 2004.
Holzapfel F., Gerz T., Frech M, Dornbrack A. 2000. Wake vortices in a convective boundary layer and their influence on following aircraft, Journal of Aircraft Vol. 37, 1001-1007, 2000.
Hsu, D.A. 1981. The Evaluation Of Aircraft Collision Probabilities At Intersecting Air Routes. Journal of Navigation, Vol.34, pp.78-102, 1981.
Hunter R., Simonsson P. 2005. ATM Service strategy, NATS, July 2005.

- 6-58-
IFALPA 1998. IFALPA Wake vortex policy, IFALPA, July 1998
IFALPA 2005. Implementation of Reduced Vertical Separation Minima in the CAR/SAM Regions Flight Crew Information Notice. Safety Bulletin, No. 05SAB009, 2005.
Jackson W., Yaras M., Harvey J., Winckelmans G., Fournier G., Belotserkovsky A. 2001. Wake vortex prediction - An overview, Phase 6 and Project final report, P13629E, 2001.
Jacquin et al. 2001. The properties of a transport aircraft wake in the extended near field: an experimental study, AIAA Conference proceedings 2001-1038, 41pp, 2001.
Kipp, J., Loflin M. 1996. Emergency Incident Risk Management - A Safety & Health Perspective. Van Nostrand Reinhold, New York, 1996.
Knief R. 1991. Risk Management: Expanding Horizons In Nuclear Power And Other Industries. Hemisphere, 1991.
Kopp F., Rahm S., Smalikho I. 2004. Characterisation of aircraft wake vortices by 2-um pulsed Doppler lidar, Journal of Atmospheric Oceanic Technology, Vol. 21, 2004.
Kos, J., H.A.P. Blom, et al. 2000. Probabilistic Wake Vortex Induced Accident Risk Assessment, 3rd FAA/Eurocontrol R&D Conference, Naples, Italy, 2000.
Krishnamurti T.N, Kishtawal C.M, Shin D.W., Williford D. 2000. Improving tropical precipitation forecasts from a multianalysis supersensemble, Journal of climate, Vol.13, December 2000.
Krishnamurti T.N., Kishtawal C.M, Zhang Z. et al. 2000. Multimodel ensemble forecasts for weatherand seasonal climate, Journal of Climate, Vol.13, December 2000.
Lankford, Greene, McCartor 2000. SOIA procedures, FAA, 2000.
Loucel R.E., Crouch J.D. 2004. Flight simulator study of airplane encounters with perturbed trailing vortices, AIAA Proceedings 2004-1074, 2004.
Moninger, William R., Mamrosh, Richard D. and Pauley, Patricia M. 2003. Automated Meteorological Reports from Commercial Aircraft, Bulletin, American Meteorological Society, 2003.

- 6-59-
Mumayiz, S.A. 1997. Aiport modeling and simulation: an overview, 1997.
Nannce, R.E., Sargent R.G. 2002. Perspectives on the evolution of simulation, 2002.
North E.M., Peterson A.M. 1973. RASS, a remote sensing system for measuring low-level temperature profiles, Bulleting of the American Meteorological Society, Vol. 54, 1973.
O'Connor, Rutishauser D. 2001. Enhanced airport capacity through safe, dynamic reductions in aircraft separation. NASA's AVOSS, Journal of ATC, Vol. 43, October 2001.
Odoni, D.E. et. al. 1997. Existing and required modelling capabilities for evaluating ATM systems and concepts, 1997.
Pitfield, D.E., Jerrard E.A. 1999. Monte-Carlo comes to Rome, 1999.
Proctor F.H. 1996. Numerical simulation of wake vortices measured during the IDAO Falls and Memphis field programs, AIAA Proceedings 96-2496, 1996.
Proctor F.H. 1998. The NASA Langley wake vortex modelling effort in support of an operational aircraft spacing system, AIAA Conference proceedings 1998-0589, 1998.
Proctor F.H., Hinton D.A., Han J. 1997. Two-dimensional wake vortex simulations in the atmosphere: Preliminary sensitivity studies, AIAA Proceedings 97-0056, 1997.
Proctor F.H., Switzer G.F. 2000. Numerical simulation of aircraft trailing vortices, Proceedings 9th Conference on Aviation, Range and Aerospace Meteorology, Orlando, 2000.
Raguraman K. 1999. Getting planes off the ground: Key concepts and issues in airport capacity planning and management, 1999.
Reich, P.G. 1966. Analysis of Long-Range Air Traffic Systems, Separation Standards-I. Journal of Navigation, Vol. 19, 1966.
RGP (Report of group of personalities) 2001. European Aeronautics: A vision for 2020, 2001.

- 6-60-
Rice, S. O. 1944. Mathematical analysis of random noise, Bell System Tech. Journal 23 282-332, 1944.
Risso F., Corjon A., Stoessel A. 1997. Direct numerical simulations of wake vortices in intense homogeneous turbulence, AIAA Journal Vol. 35, 1030-1040, 1997.
Robbins R.E., Delisi D.P. 1990. Numerical study of vertical shear and stratification effects on the evolution of a vortex pair, AIAA Journal Vol. 28, 661-669, 1990.
Robins R., Delisi D. 2002. NWRA AVOSS Wake vortex prediction algorithm version 3.1.1, NASA/CR -20020211746, June 2002.
Rodricks, J., Tardiff R. 1982. Assessment And Management Of Chemical Risks (ACS symposium series). ACS Washington, D.C., 1982.
Roelen A.L.C, Molemaker R.J., Piers R.., Hayes P., Joyce A.., Graham G. 2001. A cost benefit analysis of wake vortex measures, NLR-CR-2001-610, 2001.
Rossow V.J. 1999. Lift generated vortex wakes of subsonic transport aircraft, Prog. Aerosp. Sci. 35, 507-660, 1999.
Royal Society: Risk 1992. Analysis, Perception and Management, The Royal society, London, 1992.
Shaw J, Cole R. 2002. Potential benefits of reducing wake related aircraft spacing at the Dallas Forth Worth Int.Airport, MIT Lincoln Laboratory Project report ATC 304, July 2002.
Sillard L., Vergne F., Desart D. 2000. TAAM operational evaluation, Eurocontrol, 2000.
Smalikho I., Banakh V., Kopp F., Werner Ch. 2002. Laser remote sensing of the mean wind, Atmos Oceanic Opt., Vol. 15, 2002.
Speijker L. 2003. S-Wake Final report for WP4 Probabilistic safety assessment, NLR Technical report 2003-248, 2003.
Speijker L., van Baren G., Sherry L., Shortle J., Rico Cusi F. 2004. Assessment of wake vortex separation distances using the WAVIR toolset, DASC, Santa Fe, 2004.
- 6-61-
Eurocontrol HQ 2004. STATFOR Group, Scenarios for the STATFOR Long-term forecast (2010-2025), 2004.
Stensrud D.J. et al. 1999. Using ensembles for short-range forecasting, Monthly Weather Review, Vol.127, April 1999.
Vaughan, E. 1992. Fundamentals Of Risk And Insurance. Wiley, New York, 1992.
Vyshinsky V.V. 1999. Flight safety, aircraft vortex wake and airport operational capacity. Tdury TsAGI 2641, 17pp, 1999.
Wells W.E. 2000. Airport planning and management, McGraw-Hill Professional, 2000.
Winckelmans et al 2000. Effect of non-uniform wind shear onto vortex wakes: parametric models for operational systems and comparison with CFD studies, Proceedings 4th Wakenet Workshop on Wake vortex encounter, NLR, Amsterdam, 2000.
Winckelmans G., Duquesne T., Treve V. 2004. Summary description of the models used in the Vortex Forecast System (VFS); VFS version with added improvements done after completion of the Transport Canada funded project, Internal Report, Sept. 16, 2004.
Winckelmans G., Thirifay F. and Ploumhans P. 2000. Effect of non-uniform wind shear onto vortex wakes: parametric models for operational systems and comparison with CFD studies, Proc. 4rth WakeNet Workshop "Wake Vortex Encounter", NLR, Amsterdam, The Netherlands, Oct. 16-17, 2000.
Wunnicke D.B., Wilson D.R. 1992. Corporate financial risk management: Practical techniques of financial engineering, Wiley, New York, 1992.
Zak J. A. 2003. Atmospheric Boundary layer sensors for application in a wake vortex advisory system, NASA/ CR 2003 – 212175, April 2003.