Embed Size (px)
Citation preview

Comprehensive characterization of three IgG forms using CESI-MS
Bryan Fonslow1, Olga V. Friese2, and K. Steven Cook2
1SCIEX, Brea, CA and 2Pfizer, Chesterfield, MO

mAbs, ADCs, biosimilars, and biobetters are generated from IgG molecules
Beck et al., Nature Reviews Immunology, 2010, 10, 345-352.

Capillary electrophoresis with mass spectrometry is ideally-suited for IgG characterization
High separation efficiency of biomolecules
High ionization efficiency of biomolecules with reduced ion suppression
CESI “The integration of Capillary Electrophoresis (CE) with Electrospray Ionization (ESI) into a single dynamic process within the same device”
Maltotetroase Intensity Neurotensin Intensity

Evaluation of CESI-MS for the characterization of different IgG forms
IgG1, IgG2, & IgG4
Peptide mapping
Reduce, alkylate, & digest
Disulfide mapping Alkylate & digest
Intact IgG Charge Heterogeneity & Reduced Analysis
IgG1
IgG2
IgG4
Reduced IgG4
Non-reduced IgG4
Intact IgG1

Evaluation of CESI-MS for the characterization of different IgG forms
IgG1, IgG2, & IgG4
Peptide mapping
Reduce, alkylate, & digest ~25 ng of digest analyzed

Separation and identification of small and large peptides
TISK (448.2766 Da ; +1) DYFPEPVTVSWNSGALTSGVHTFPAVLQS
SGLYSLSSVVTVPSSSLGTQTYICNVNHK
(6763.2573 Da ; +5)
VDK
(361.2082 Da ; +1)
SLSLSPG
(660.3563 Da;
+1)
QAPGK (500.2827 Da ; +2)

CESI separation and sensitivity contribute to comprehensive peptide mapping coverage of IgGs
Trypsin digestion only
~25 ng of digest analyzed
Identified Potential Critical Quality Attributes: • Glycosylation • Deamidation (Asp and IsoAsp) • Pyroglutamate formation • Methionine oxidation • C-terminal lysine
heterogeneity • Lysine glycation

Separation and relative quantification of glycopeptides
IgG1
G1F
G0F Man5
G2 G1
G0 G2F
G1F-linked peptide MS/MS spectra
MS/MS identification of glycan and peptide sequence

Separation and relative quantification of glycopeptides
IgG1
IgG2 IgG4
G1F
G0F Man5
G2 G1
G0 G2F
G1F
G0F A2G1F
A2G2
G2F
Man5
A2G1
G0
A2G2
G1F
G0F
Man7
G1
G2F
G0
Man5
Man5
Man6
Naturally peptide-“labeled” glycans as ionization and separation tags

Evaluation of CESI-MS for the characterization of different IgG forms
IgG1, IgG2, & IgG4
Disulfide mapping
Alkylate & digest
~25 ng of digest analyzed

Disulfide linkages identified on IgG4
LC88-LC23
HC
20
3-H
C3
21
HC
20
3-H
C1
47
HC
13
4-L
C1
94
HC
13
4-H
C1
47
HC134-LC194
HC261-HC321 HC226-HC229
LC134-LC194
Additional potential usages – positional disulfide isomers and more highly-linked peptides

Evaluation of CESI-MS for the characterization of different IgG forms
IgG1, IgG2, & IgG4
Intact IgG Charge Heterogeneity & Reduced Analysis
Intact IgG1
Reduced IgG1

Minutes
21 22 23 24 25 26 27
AU
0.050
0.075
0.100
0.125
0.150
AU
0.050
0.075
0.100
0.125
0.150
8.7
08
0 8.6
18
0
8.5
13
0
7.6
48
0
7.4
83
0
7.3
16
0
7.2
14
0
UV - 280nm
1 mg/mL Pfizer IgG1 w/ markers
Quality
Minutes
17.5 20.0 22.5 25.0 27.5 30.0 32.5 35.0 37.5
AU
0.050
0.075
0.100
0.125
0.150
AU
0.050
0.075
0.100
0.125
0.150
10
.10
20
9.5
42
0
6.7
14
0
5.3
72
0
4.3
71
0
UV - 280nm
1 mg/mL Pfizer IgG1 w/ markers
Quality
Minutes
23.0 23.5 24.0 24.5 25.0 25.5 26.0 26.5
AU
0.04
0.06
0.08
0.10
0.12
0.14
0.16
AU
0.04
0.06
0.08
0.10
0.12
0.14
0.16
7.5
22
0
7.4
76
0
7.3
59
0
7.2
96
0
7.2
44
07
.22
10
7.1
87
0
7.1
49
0
7.0
38
0
6.9
17
0
6.6
87
0
UV - 280nm
1 mg/mL Pfizer IgG4 w/ markers
Quality
Minutes
24.5 25.0 25.5 26.0 26.5 27.0 27.5
AU
0.050
0.075
0.100
0.125
0.150
0.175
AU
0.050
0.075
0.100
0.125
0.150
0.175
7.4
39
0
7.4
11
0
7.2
63
0
7.2
28
0
7.1
78
0
7.1
31
07
.11
80
7.0
96
0
7.0
41
0
6.9
75
0
6.8
96
06
.87
20
6.8
50
0
6.8
24
0
6.7
60
0
UV - 280nm
1 mg/mL Pfizer IgG2
Quality
cIEF charge heterogeneity analysis of IgGs with UV detection
IgG1 with pI markers
IgG1 IgG4
IgG2
pI 7.22 pI 8.65
pI 7.11
pI range – 0.29
pI range – 1.68
pI range – 0.56

Charge heterogeneity analysis of IgG1 by CESI-MS
Minutes
21 22 23 24 25 26 27 28
AU
0.02
0.04
0.06
0.08
0.10
AU
0.02
0.04
0.06
0.08
0.10
UV - 280nm
1 mg/mL Pfizer IgG1 w/ markers
pI 8.65
pI range – 1.68
~ 10 mg/mL sample desalted into 50 mM ammonium acetate, pH 4 BGE – 3% acetic acid (tITP-CZE mode) ~3.5 nL injection ~ 35 ng injected
cIEF-UV
CESI-TripleTOF® 6600 MS

Charge heterogeneity analysis of IgG1 by CESI-MS
~ 10 mg/mL sample desalted into 50 mM ammonium acetate, pH 4 BGE – 3% acetic acid (tITP-CZE mode) ~3.5 nL injection ~ 35 ng injected

Charge heterogeneity analysis of IgG1 by CESI-MS
~ 10 mg/mL sample desalted into 50 mM ammonium acetate, pH 4 BGE – 3% acetic acid (tITP-CZE mode) ~3.5 nL injection ~ 35 ng injected

Charge heterogeneity analysis of IgG1 by CESI-MS
Extracted ion electropherograms
of single charge states

Charge heterogeneity analysis of IgG1 by CESI-MS
Extracted ion electropherograms of single charge states
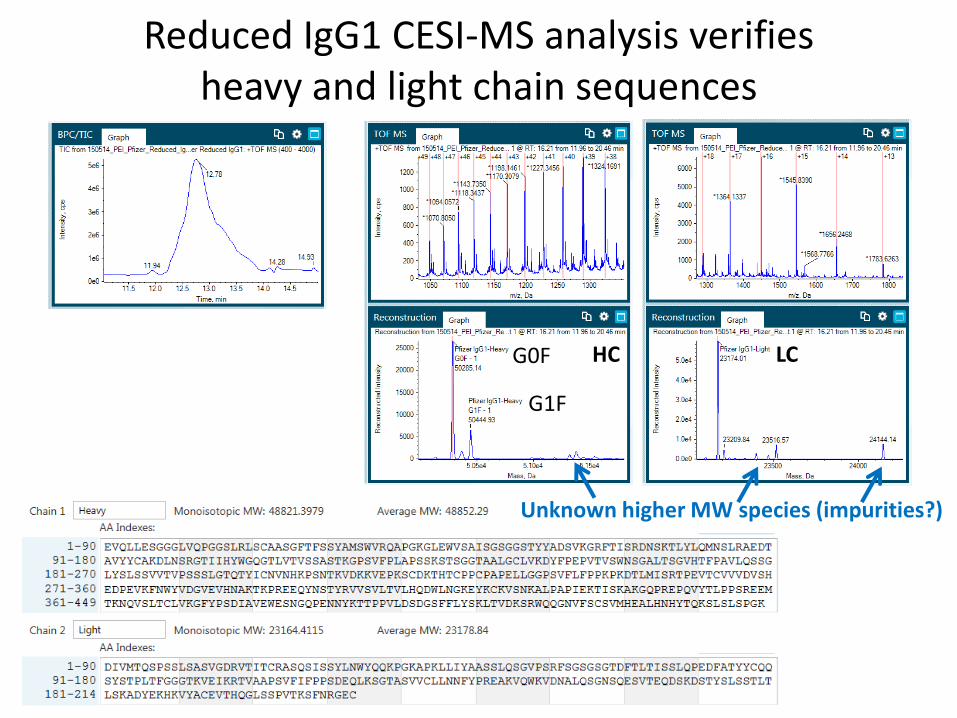
Reduced IgG1 CESI-MS analysis verifies heavy and light chain sequences
Unknown higher MW species (impurities?)
G0F
G1F
LC HC

Identification of main IgG1 charge isoform peaks
-2 deamidations +1 oxidation
Higher MW impurity? +4097 Da

Identification of IgG1 heavy chain dimer peak

Minutes
23.0 23.5 24.0 24.5 25.0 25.5 26.0 26.5
AU
0.04
0.06
0.08
0.10
0.12
0.14
AU
0.04
0.06
0.08
0.10
0.12
0.14
UV - 280nm
1 mg/mL Pfizer IgG4 w/ markers
Quality
Charge heterogeneity analysis of IgG4 by CESI-MS
pI 7.22
pI range – 0.56
cIEF-UV CESI-TripleTOF® 6600 MS
~ 10 mg/mL sample desalted into 50 mM ammonium acetate pH 4 BGE – 3% acetic acid (tITP-CZE mode) ~3.5 nL injection ~ 35 ng injected
CESI-TripleTOF® 6600 MS

Minutes
23 24 25 26 27 28 29 30
AU
0.04
0.06
0.08
0.10
0.12
0.14
0.16
AU
0.04
0.06
0.08
0.10
0.12
0.14
0.16UV - 280nm
1 mg/mL Pfizer IgG2
pI range – 0.29
pI 7.11
Charge heterogeneity analysis of IgG2 by CESI-MS
G0F-GlcNAc G1F
Deamidated Oxidized
Lys loss (2)

Charge heterogeneity analysis of IgG2 by CESI-MS

Charge heterogeneity analysis of IgG2 by CESI-MS
Different glycosylation and modification profiles

Charge heterogeneity analysis of IgG2 by CESI-MS
Different glycosylation and modification profiles
Deamidations

Charge heterogeneity analysis of IgG2 by CESI-MS
Different glycosylation and modification profiles
Deamidations

Charge heterogeneity analysis of IgG2 by CESI-MS
Different glycosylation and modification profiles
Deamidations and oxidation

Evaluation of CESI-MS for the characterization of different IgG forms
IgG1, IgG2, & IgG4
Peptide mapping
Reduce, alkylate, & digest
Disulfide mapping Alkylate & digest
Intact IgG Charge Heterogeneity & Reduced Analysis
IgG1
IgG2
IgG4
Reduced IgG4
Non-reduced IgG4
Intact IgG1

Combining CE & ESI-Mass Spectrometry
CESI 8000 High Performance Separation-ESI Module
TripleTOF® 6600 System High resolution, ultra-low flow rate CE separations coupled with high resolution, high sensitivity MS

Software analysis of CESI-TripleTOF® MS data • Peptide mapping experiments
– BioPharmaViewTM software and ProteinMetrics Byonic
• Disulfide mapping experiments – BioPharmaViewTM software and ProteinMetrics Byonic
• Intact charge heterogeneity experiments – BioPharmaViewTM software

Conclusions
• CESI-TripleTOF® MS analyses provides new and orthogonal information about IgG molecules
• Peptide and disulfide mapping achieve: – 100% sequence coverage from ~25 ng and single digest
– Characterization of potential critical quality attributes including glycosylation and disulfide bonds
• CZE-based charge heterogeneity analysis provides: – Separation resolution of major charge variants
– Charge variant-specific identification and correlation from deconvoluted MS spectra

Acknowledgements
• SCIEX
– Separations
• Chitra Ratnayake
• Rajeswari Lakshmanan
• Marcia Santos
• Clarence Lew
• Andras Guttman
– BioPharma
• Eric Johansen
• St John Skilton
• Pfizer
– Michael Jones
– James Carroll
• ProteinMetrics
– Eric Carlson
– Chris Becker
– Wilfred Tang