Embed Size (px)
Citation preview
GEN
ETIC
S
Comprehensive characterization of amino acidpositions in protein structures reveals moleculareffect of missense variantsSumaiya Iqbala,b,c,d,1 , Eduardo Perez-Palmae,2, Jakob B. Jespersenf,2 , Patrick Mayg,2, David Hokszag,h,Henrike O. Heyneb,d,i , Shehab S. Ahmedj, Zaara T. Rifatj, M. Sohel Rahmanj , Kasper Lageb,k, Aarno Palotieb,c,i,Jeffrey R. Cottrellb, Florence F. Wagnera,b, Mark J. Dalyb,c,d,i, Arthur J. Campbella,b,1, and Dennis Lalb,e,l,m,1
aCenter for the Development of Therapeutics, Broad Institute of MIT and Harvard, Cambridge, MA 02142; bStanley Center for Psychiatric Research, BroadInstitute of MIT and Harvard, Cambridge, MA, 02142; cProgram in Medical and Population Genetics, Broad Institute of MIT and Harvard, Cambridge, MA02142; dAnalytic and Translational Genetics Unit, Massachusetts General Hospital, Boston, MA 02114; eGenomic Medicine Institute, Lerner ResearchInstitute, Cleveland Clinic, Cleveland, OH 44195; fDepartment of Bio and Health Informatics, Technical University of Denmark, 2800 Kgs. Lyngby, Denmark;gLuxembourg Centre for Systems Biomedicine, University of Luxembourg, 4365 Esch-sur-Alzette, Luxembourg; hDepartment of Software Engineering,Faculty of Mathematics and Physics, Charles University, Prague 11636, Czech Republic; iInstitute for Molecular Medicine Finland, University of Helsinki,00100 Helsinki, Finland; jComputer Science and Engineering, Bangladesh University of Engineering and Technology, Dhaka-1205, Bangladesh; kDepartmentof Surgery, Massachusetts General Hospital, Boston, MA 02114; lCologne Center for Genomics, University of Cologne, 50931 Cologne, Germany;and mEpilepsy Center, Neurological Institute, Cleveland Clinic, Cleveland, OH 44195
Edited by G. Marius Clore, National Institute of Diabetes and Digestive and Kidney Diseases, NIH, Bethesda, MD, and approved September 9, 2020 (receivedfor review February 12, 2020)
Interpretation of the colossal number of genetic variants identi-fied from sequencing applications is one of the major bottlenecksin clinical genetics, with the inference of the effect of amino acid-substituting missense variations on protein structure and functionbeing especially challenging. Here we characterize the three-dimensional (3D) amino acid positions affected in pathogenic andpopulation variants from 1,330 disease-associated genes usingover 14,000 experimentally solved human protein structures. Bymeasuring the statistical burden of variations (i.e., point muta-tions) from all genes on 40 3D protein features, accounting forthe structural, chemical, and functional context of the variations’positions, we identify features that are generally associated withpathogenic and population missense variants. We then performthe same amino acid-level analysis individually for 24 proteinfunctional classes, which reveals unique characteristics of thepositions of the altered amino acids: We observe up to 46%divergence of the class-specific features from the general charac-teristics obtained by the analysis on all genes, which is consistentwith the structural diversity of essential regions across differ-ent protein classes. We demonstrate that the function-specific3D features of the variants match the readouts of mutagenesisexperiments for BRCA1 and PTEN, and positively correlate with anindependent set of clinically interpreted pathogenic and benignmissense variants. Finally, we make our results available througha web server to foster accessibility and downstream research. Ourfindings represent a crucial step toward translational genetics,from highlighting the impact of mutations on protein structure torationalizing the variants’ pathogenicity in terms of the perturbedmolecular mechanisms.
missense variant interpretation | protein structure and function | diseasevariation effect | 3D mutational hotspot | machine learning
Genetic screening is increasingly applied in clinical practice,especially for the diagnosis of rare monogenic diseases and
cancer, leading to the identification of a rapidly growing numberof genetic variations (1, 2). Most of these are missense vari-ations, which cause an amino acid substitution upon a singlenucleotide change in the protein-coding region of the genome.Detection of such missense variations by high-throughput DNAsequencing is now relatively straightforward. Predicting theirassociation with disease from sequencing output alone, instead,remains challenging because missense variations can be eitherbenign or pathogenic, and both types coexist in almost everydisease-associated gene (3). To discover how a missense variantis implicated in a disease requires knowledge of the conse-
quence of the amino acid substitution (i.e., variation) on theprotein structure and function. A plethora of disease-associated(“pathogenic”) and benign (“population”) variants has beencollected in multiple databases such as Online Mendelian Inher-itance in Man (OMIM) (4), Human Gene Mutation Database(HGMD) (5), ClinVar (6), Exome Aggregation Consortium(ExAC) (3), and Genome Aggregation Database (gnomAD)(7). These resources, along with an increasing amount of pro-tein structure data available in the Protein Data Bank (PDB)(8), now offer an unprecedented opportunity to characterizepathogenic and benign missense variants in the context of protein
Significance
Recent large-scale sequencing efforts have enabled the detec-tion of millions of missense variants. Elucidating their func-tional effect is of crucial importance but challenging. Weapproach this problem by performing a wide-scale charac-terization of missense variants from 1,330 disease-associatedgenes using >14,000 protein structures. We identify 3D fea-tures associated with pathogenic and benign variants thatunveiled the mutations’ effect at the molecular level. We fur-ther extend our analysis to account for the different essentialstructural regions in proteins performing different functions.By analyzing variants from 24 gene groups encoding for dif-ferent protein functional families, we capture function-specificcharacteristics of missense variants, which match the exper-imental readouts. We show that our results derived usingstructural data will effectively inform variant interpretation.
Author contributions: S.I., A.J.C., and D.L. designed research; J.R.C., F.F.W., A.J.C., andD.L. conceived the research question; S.I. performed research; S.I., E.P.-P., J.B.J., and P.M.collected data; S.I. analyzed data; S.I., P.M., M.J.D., A.J.C., and D.L. interpreted results;S.I., E.P.-P., J.B.J., P.M., D.H., H.O.H., S.S.A., Z.T.R., M.S.R., K.L., A.P., J.R.C., F.F.W., M.J.D.,A.J.C., and D.L. contributed new reagents/analytic tools; and S.I., A.J.C., and D.L. wrotethe paper.y
The authors declare no competing interest.y
This article is a PNAS Direct Submission.y
This open access article is distributed under Creative Commons Attribution License 4.0(CC BY).y1 To whom correspondence may be addressed. Email: [email protected],[email protected], or [email protected]
2 E.P.-P., J.B.J., and P.M. contributed equally to this work.y
This article contains supporting information online at https://www.pnas.org/lookup/suppl/doi:10.1073/pnas.2002660117/-/DCSupplemental.y
First published October 26, 2020.
www.pnas.org/cgi/doi/10.1073/pnas.2002660117 PNAS | November 10, 2020 | vol. 117 | no. 45 | 28201–28211
Dow
nloa
ded
by g
uest
on
Dec
embe
r 14
, 202
1

structure–function relationships. Progress in this direction canaid variant interpretation, inform experiments, and help accel-erate personalized drug discovery.
Current in silico methods for variant pathogenicity predic-tion employ a variety of machine learning algorithms, which aretrained on pathogenic and population variant data using manyfeatures such as evolutionary information (“conserved sites”),gene-level properties (e.g., “essentiality”), and specific aminoacid exchanges in protein sequences (9–12). Although the abilityto predict pathogenicity is improving (13, 14), the output scoresof the predictors do not advance our knowledge about the molec-ular pathology of the associated disorder. Since a computational“black box” model generates these scores, they are not biolog-ically interpretable; that is, it is not possible to understand whya particular missense variant is predicted to have a high or lowpathogenicity score or to establish what the molecular effect ofthe variation will be.
Biological insights into the effect of pathogenic missense vari-ants can reportedly be gained by analyzing the relationshipbetween point mutations and protein structures (15–18). Severalstudies have shown that the damaging consequences of missensevariations are linked to the properties (19–21) and localizationof the altered amino acid residues in the protein structure (22–26). Subsequently, resources have been developed to predictand report the impact of amino acid substitutions on proteinstructures: missense3D (27) predicts the changes in structureand free energy upon mutations, which is applicable to bothexperimental structures and homology models of the structures;SuSPect (28) predicts the association between missense vari-ations and their phenotypic impact leveraging information ofprotein–protein interaction networks; VarSite (29) presents arange of features associated with the variants (related diseases,structural annotations, pathways, tissue specificity, etc.).
The variant interpretation guidelines proposed by AmericanCollege of Medical Genetics and Genomics (ACMG) list thepresence of an amino acid substitution in mutational hotspots(PM1 criterion (30), i.e., sites displaying frequent occurrence ofpathogenic mutations and depleted in benign variants) as mod-erate evidence for pathogenicity. Such hotspots can be located inany “functional domain,” namely, a region of the protein knownto be critical for function, but also in “less well-characterizedregions.” Indeed, because proteins are molecules characterizedby a dense network of both intramolecular and intermolec-ular interactions, amino acid substitutions occurring in manydifferent positions can have far-reaching consequences on pro-tein structure and stability (31). Further, proteins performinga similar function often have conserved structural regions thatare intolerant to substitution, and such regions vary for pro-teins that carry out different functions (32, 33). For example,the “voltage-sensing” helical regions of the ion transporters(e.g., sodium channel family) are predominantly enriched withpathogenic missense variations, causing several forms of neu-rological channelopathies (34–36). Similarly, in certain enzymes(kinase, phosphatase, etc.), mutations of distinctive catalytic andregulatory sites in the structure are shown to be associated withdiverse phenotypes (37, 38).
With this study, we sought to bridge the gap between geneticvariation data and molecular phenotype through the analysis offeatures of single amino acids in the context of the native three-dimensional (3D) protein structure (“3D sites”). The rationalebehind this approach is that features of the 3D sites (“3D fea-tures”) that are more frequently mutated in pathogenic variantsthan in benign variants (“3D mutational hotspot”) are likely tobe important for protein fitness, and therefore could contributeto explaining the molecular determinants of pathogenicity. Con-comitantly, we speculate that knowledge of specific featuresof 3D mutational hotspots for individual protein functionalclasses (e.g., kinases, transporters, cytoskeletal proteins) can
considerably help with formulating informed hypotheses in theinterpretation of variant pathogenicity.
ResultsTo systematically identify the 3D features associated with“pathogenic” and “population” missense variants, we analyzedthe 3D sites affected in 32, 923 pathogenic (ClinVar and HGMDdatabases) and 164, 915 general population variants (gnomADdatabase) from 1, 330 disease-associated genes (Disease-Associated Genes with Structure [DAGS1330] set, Dataset S1;see Materials and Methods for details) using 14, 270 experimen-tally solved human protein structures. We investigated a set of40 3D features grouped in seven main feature categories report-ing on the affected amino acid’s physicochemical properties (e.g.,aromatic vs. charged or polar), structural context (e.g., α-helix,β-sheet, participation in hydrogen bonds), and their role in pro-tein activity (i.e., “functional features,” such as their involvementin an enzyme’s active site, ligand binding pocket, cellular signal-ing, etc.). A brief outline of the study design and objectives isshown in Fig 1.
Characteristic 3D Features of Pathogenic and Population MissenseVariants of 1,330 Genes. By statistical association analysis of allvariants from 1, 330 genes together, we identified 18 out of 40(45%) features that were significantly associated with pathogenicvariants, while 14 out of 40 (35%) features showed significantassociation with population variants (Fig. 2). The remainingeight protein features (20%) showed no significant associationwith any variant type. In the rest of the paper, we will onlyreport and discuss statistically significant results (with a correctedp value or “q” < 0.05; see Materials and Methods for details).
Disulfide bonds formed between covalently linked cysteinesof two different proteins in a complex were found to have thehighest enrichment of pathogenic missense variations among allinvestigated 3D features (19-fold; Fig. 2). The next highest bur-den for pathogenic variations was observed in the residues thatwere within 10 A of posttranslational modification (PTM) sitesin the structure [sites that undergo enzymatic addition of smallmolecules to certain amino acids after translation (45)], likeSUMOylation (OR = 5.8) and O-linked N-acetylglucosamine(O.GlcNAc) (OR = 5.6; Fig. 2) sites. Instead, in populationvariants, the solvent-exposed residues in protein structures wereobserved to be the most affected 3D sites (OR = 0.4; Fig. 2).
Interestingly, the group of amino acids (Cys/C, Gly/G, andPro/P) with peculiar characteristics (categorized as “special”in terms of their physicochemical properties in this study;Fig. 2), showed the highest association with pathogenic variations(twofold enrichment). Of these, cysteine (Cys) residues werefound fourfold enriched in pathogenic variations (SI Appendix,Fig. S1A), consistent with the cogent association between vari-ant pathogenicity and perturbation of disulfide bonds, as aCys mutation will eliminate that bond. The three aromaticamino acids (Phe/F, Trp/W, Tyr/Y), both as a group (OR =1.6; Fig. 2) and individually (SI Appendix, Fig. S1A), werefound enriched for pathogenic mutations. Among them, tryp-tophan (Trp) residues, which are often involved in key molec-ular interactions (e.g., hydrophobic and cation–π interactions)(46) showed the strongest association (OR = 3.3; SI Appendix,Fig. S1A) with pathogenic variants.
Additionally, out of the six “functional features” indicat-ing sites or regions of interest in proteins [as annotated inUniProt (43)], three were observed to be over threefold enrichedin pathogenic variants, namely the “modular domain,” “mod-ified residue,” and “functional/binding region” (Fig. 2). Wealso performed supplemental analyses on all of the 25 indi-vidual features that were initially collected from UniProt, thengrouped (see SI Appendix, Feature Set Mining and Annotation fordetails), and analyzed as six categories in Fig. 2. Results of these
28202 | www.pnas.org/cgi/doi/10.1073/pnas.2002660117 Iqbal et al.
Dow
nloa
ded
by g
uest
on
Dec
embe
r 14
, 202
1

GEN
ETIC
S
43,805 human protein 3D structures
Protein structure to sequence mapping
Protein feature annotation Protein class annotation
Statistical (burden) analysis:Two-tailed Fisher’s exact test with pathogenic and population variations on protein features
Calcium-binding protein LyaseChaperone Membrane traffic protein
Cell adhesion molecule Nucleic acid binding proteinCell junction protein OxidoreductaseCytoskeletal protein Phosphatase
Defense/Immunity protein ProteaseEnzyme modulator Receptor
Extracellular matrix protein Signaling moleculeHydrolase Transcription factorIsomerase Transfer/carrier protein
Kinase TransferaseLigase Transporter
Disease Associated Genes with Structure (DAGS1330) setse
1,330 genes164,915 population variations (gnomAD)
32,923 pathogenic variations (ClinVar and HGMD)
14,270 protein 3D structures
Step 1
Ensembl
UniProt
PANTHER
5,850 human genes
Protein sequence to variant annotation
pathogenic missense variations
population missense variations
Protein features (structural, physicochemical and functional) of pathogenic and population missense variation positions in the 3D structure
Disease-related vulnerable protein features of the 3D mutational hotspots for twenty-four functional classes
Filter: genes with both population and pathogenic variations mappable on structures
DSSP: 3-class secondary structure
DSSP: 8-class secondary structureDSSP: Residue exposure levelsPhysicochemical property of amino acidPDBsum: Protein-protein interactionsPhosphoSitePlus: Post-translational modificationUniProt: Functional features
Step 2 Step 3
Step 4
gnomADgenome aggregation database
HGMD ClinVar
PDBProtein Data Bank
Ensembl VeP
EMBL-EBI SIFTS
UniProt
Fig. 1. Illustration of the study design and objectives. Step 1: Dataset preparation and missense variant to protein structure mapping. Experimentallysolved human protein structures are collected from the PDB (8) (in January 2018) and mapped to UniProt-defined canonical protein sequences using the SIFTSdatabase (39). The missense variants are assembled from three databases: general population variants from gnomAD (public release 2.0.2), disease mutationsfrom HGMD (professional release 2018.4 and 2019.2), and pathogenic and likely pathogenic variants from ClinVar (February 2018 and 2019 releases). Finally,the analysis is restricted to the 1, 330 genes (DAGS1330 set) for which both population (n = 164, 915) and pathogenic (n = 32, 923) variations could bemapped on protein structures (n = 14, 270). Step 2: Protein feature annotation. Forty protein features from seven main feature categories for the aminoacid residues are collected from multiple databases, that is, DSSP (40) (version 3.0.2), PDBsum (41) (January 2018 update), PhosphoSitePlus (42) (February2018 update), and UniProt (43) (release 2018 02). Step 3: Protein class annotation. The protein functional class annotations for genes are obtained fromPANTHER (44) (release 13.1), Ensembl (version 93), and UniProt (43) (release 2018 02) databases. Step 4: Statistical analysis. Two-sided Fisher’s exact test isperformed to identify the protein features that are significantly associated with pathogenic or population missense variations (after Bonferroni correction).The analysis is performed taking all variants in the DAGS1330 gene set, and then individually for groups of genes encoding proteins in 24 functional classes,to identify features of 3D mutational hotspots that are shared across all proteins as well as those that are unique to proteins performing a specific function.
fine-grained analyses revealed additional associations forpathogenic variants (output presented and discussed in full in SIAppendix, Fig. S1B).
Characteristic 3D Features of Pathogenic and Population MissenseVariants for Protein Functional Classes. Protein structures presentevidence for conserved regions that are relevant for a specificfunction, and such essential regions vary substantially in differ-ent protein functional classes (44, 47). We thus anticipate thatfeatures of 3D mutational hotspots in proteins performing differ-ent functions can differ from the general characteristics obtainedby joint analysis of 1, 330 genes. To identify such shared and/orunique function-specific 3D features, we quantified the burden ofpathogenic variations compared to the population variations in40 3D features separately for groups of genes encoding for simi-lar protein functions (see Dataset S2 for protein class definitionand annotated genes). The identified characteristic 3D features
of pathogenic and population variants for all protein classes arelisted in Dataset S3, and the output is summarized as a heatmapof enrichment values (odds ratio, OR) in Fig. 3A. The detailedFisher’s exact test outputs for protein classes (OR, 95% CI andp values) are also presented in SI Appendix, Figs. S2–S8 for sevenmain feature categories.
Our class-specific analysis captured the 3D features that aresusceptible to pathogenic mutations across all protein classes,indicating a crucial location for protein fitness. The residue expo-sure level (defined by the relative solvent accessible area [RSA]of that amino acid) is one such 3D feature type (Fig. 3A). Core(RSA < 5%) and buried (5% ≤ RSA < 25%) residues, whichare usually embedded in a tight interaction network and are fun-damental for protein stability, were found to be 3D hotspotsof pathogenic mutations in all protein classes (Fig. 3A and SIAppendix, Fig. S4 A and B). Conversely, the residues relativelyexposed to solvent (“medium-buried,” “medium-exposed,” and
Iqbal et al. PNAS | November 10, 2020 | vol. 117 | no. 45 | 28203
Dow
nloa
ded
by g
uest
on
Dec
embe
r 14
, 202
1

Fig. 2. Association of pathogenic and population missense variations with 40 3D features (a combination of structural, physicochemical, and functionalfeatures of amino acids on protein structure) for 1,330 disease-associated genes (DAGS1330 set). The plot shows the results of two-sided Fisher’s exacttests of association between 32,923 pathogenic and 164,915 population amino acid variations with the features. Circles show the OR and are labeledwith the q values (the corrected p values; see Materials and Methods), showing the significance of the association (a value of 1.0e-297 should be readas <1.0e-297, indicating the maximum significance), and the horizontal bars show the 95% CI. The OR > 1 and OR < 1, along with q < 0.05, indicate thatthe corresponding feature (y axis) is enriched in pathogenic (red circle) and population (blue circle) variants, respectively. The vertical dashed line at OR = 1indicates no association between a variant type (pathogenic or population) and a feature. To facilitate the visualization, minimum and maximum values ofOR along the x axis are set to 0.2 and 20.0, respectively. For nonsignificant association (q ≥ 0.05), the circle, CI bar, and feature names are gray.
“exposed”; Fig. 3A) were found to be enriched with populationvariations in the majority of protein classes (SI Appendix,Fig. S4 C–E). Among the groups of amino acids, substitutionsof aliphatic and neutral amino acids were found more likely tobe tolerated in the general population (Fig. 3A and SI Appendix,Fig. S5 B and G) whereas mutations of aromatic and “special”
amino acids were, on average, more pathogenic (Fig. 3A and SIAppendix Fig. S5 C and H) for all protein classes. Finally, theprotein functional domain [according to the annotation avail-able in UniProt (43)] was found to be a uniform hotspot ofpathogenic mutations for all protein classes (Fig. 3A and SIAppendix, Fig. S8D).
28204 | www.pnas.org/cgi/doi/10.1073/pnas.2002660117 Iqbal et al.
Dow
nloa
ded
by g
uest
on
Dec
embe
r 14
, 202
1

GEN
ETIC
S
A
B
Fig. 3. Some features of 3D mutational hotspotsare conserved across different protein functionalclasses, whereas others are unique to specific classes.(A) Heatmap of ORs found from the burden anal-yses (two-sided Fisher’s exact test) on 40 3D fea-tures with pathogenic and population variants fromall 1,330 disease-associated genes (full DAGS1330dataset) and for subsets of genes grouped into 24protein classes based on their molecular functions.To facilitate the visualization, minimum and maxi-mum values of OR are set to 0.05 and 20.0, respec-tively. The red and the blue color gradients repre-sent different degrees of association to pathogenic(1.0 < OR ≤ 20.0 and q < 0.05) and population(0.05 ≤ OR < 1.0 and q < 0.05) variants; darkercolor indicates stronger association. The gray cellsin the heatmap represent features that are not sig-nificantly associated (q ≥ 0.05) with any variationtype. Thus, the rows with only red or blue cellsshow the characteristic features of pathogenic orpopulation variations that are consistent or con-served across all of the protein classes. In contrast,the rows with both red and blue cells indicate pro-tein class-specific diverging features. (B) Scatter plotshowing the correlation between the burden ofpathogenic variations on different features for allgenes along the x axis (ORDAGS1330) and for kinaseprotein class along the y axis (ORKinase). Each circlerepresents a protein feature (indicated by an arrow),and has a different color according to the sevenmain feature categories. The diagonal line repre-sents the agreement between the burden valuesfound for all genes and those for kinases. The fea-tures above the diagonal line and to the left of thevertical line are enriched with pathogenic variationsin kinases (hydrogen bond and salt bridge interac-tion sites), but are depleted of pathogenic variationsin the full DAGS1330 set. The features above thediagonal line and to the right of the vertical linehave an elevated burden of pathogenic variationsin kinases (y axis), indicating that these featuresare more intolerant to substitutions for this proteinclass compared to the general trend for all proteins(x axis). In contrast, the features below the diago-nal line and the horizontal line are enriched withpathogenic variations in the DAGS1330 set (disulfidebond and O.GlcNAc), but are depleted of pathogenicvariations in kinases.
Alongside the above described shared features, in numerouscases, we instead found marked differences between the 3Dfeatures of mutational hotspots of a specific protein class andthose obtained from the joint analysis of the full DAGS1330set (blue for those associated to population variants and redfor pathogenic variants in Fig. 3A). For instance, from the all-gene analysis, we observed that pathogenic variations are moreenriched in β-sheets (OR = 1.2, q = 2.4e-36) than in α-helices(OR = 0.9, q = 3.4e-01; Fig. 2), but the class-specific analy-sis highlighted significant enrichment of pathogenic mutationsin α-helices for five protein classes (Fig. 3A and SI AppendixFig. S3D): cell junction proteins (OR = 2.9), transcription factors(OR = 1.4), nucleic acid binding proteins (OR = 1.3), trans-porters (OR = 1.3), and kinases (OR = 1.2) (see Discussionfor further details). A particularly informative example is thatof kinases (Fig. 3B). Pathogenic variations for these enzymes
were found to largely substitute the residues forming salt bridgeinteractions (ORKinase = 2.3 vs. ORDAGS1330 = 0.5) and hydro-gen bonds (ORKinase = 1.6 vs. ORDAGS1330 = 0.8), whereas noassociation was observed with disulfide bonds, contrary to thetrend found by the joint analysis on all genes (ORKinase = 0 vs.ORDAGS1330 = 19.2; Fig. 3B). In addition to such a divergingpattern, for some features in kinases, we noticed an elevatedburden of pathogenic mutations compared to the general trendfor all proteins, indicating that these 3D sites are particularlyimportant for the function of kinases. Examples of these featuresinclude SUMOYlation sites (ORKinase = 18.1 vs. ORDAGS1330 =5.6; Fig. 3B), modular domain residues (ORKinase = 4.4 vs.ORDAGS1330 = 3.4; Fig. 3B), and functional sites (ORKinase = 3.5vs. ORDAGS1330 = 1.9; Fig. 3B). Similar results for other proteinclasses (SI Appendix, Table S1 and Figs. S2–S8) show that fea-tures of 3D mutational hotspots in proteins performing a specific
Iqbal et al. PNAS | November 10, 2020 | vol. 117 | no. 45 | 28205
Dow
nloa
ded
by g
uest
on
Dec
embe
r 14
, 202
1

function can substantially differ from the general trend, confirm-ing the importance of our function-specific characterization ofmissense variants.
Validation of 3D Features Associated with Pathogenic and PopulationMissense Variants on an Independent Set of Variants. Having char-acterized the pathogenic and population missense variants usingour set of 3D features (Figs. 2 and 3A and Dataset S3), we thencarried out a comparison with an independent set of variants(see Materials and Methods for the preparation of the valida-tion dataset) to assess how well we could recapitulate knownpathogenic mutations and the potential of our identified featuresfor helping with clinical interpretation of missense variants.
In order to quantify how deleterious an amino acid substitu-tion is, we derived a pathogenic 3D feature index (P3DFi) perresidue based on the difference between the pathogenic and pop-ulation variant-associated 3D features of the reference (altered)amino acid (see details in Materials and Methods). We expectthat the residues located in vulnerable 3D sites will have a highernumber of pathogenic variant-associated features (P3DFi < 0).Conversely, residues substituted in benign variants are expectedto have a greater number of population variant-associated fea-tures (P3DFi < 0). Thus, we calculated the P3DFi values foramino acids affected by 17, 983 pathogenic and 4, 712 benignmissense variants of 1, 286 genes. We then binned the variantsbased on their P3DFi values (from less than −2 to greater than2), and, as expected, the pathogenic and benign variants showedopposite distributions (Mann–Whitney U test or Wilcoxon test ofsignificance, p < 2.2e-06; Fig. 4) across different P3DFiDAGS1330values, with P3DFi computed based on the 3D features associ-ated with the pathogenic and population variants of all 1,330genes. Note that the most positive (P3DFi > 2) and negative(P3DFi < −2) values represent the 3D sites with highest and
11.3%1.4%
24.0%9.6%
10.1%21.0%
8.1%15.9%
2.2%5.4%
14.3%19.7%
P3DFiDAGS1330
Higher 3D features associated to pathogenic
variants
Higher 3D features associated to populationvariants
27.0%30.0%
Mann–Whiteney U test or Wilcoxon text, p < 2.2e-16
BenignPathogenic
< −2 = −2 = −1 = 0 = 1 = 2 > 20
2000
4000
6000
Fig. 4. Distribution of pathogenic 3D feature index (P3DFiDAGS1330) val-ues in an independent set of 22,695 variants (17,983 pathogenic and 4,712benign). The plot shows the count of pathogenic and benign variants (y axis)in different P3DFiDAGS1330 bins (x axis) for 1,286 genes of all protein classes.The bin labels report the fraction of pathogenic and benign variants ineach bin out of the total pathogenic and benign variants. In the plot, thepathogenic and benign variants show opposing distribution trends in thepositive and negative P3DFi values (Mann–Whitney U test or Wilcoxon testof significance, p < 2.2e-06).
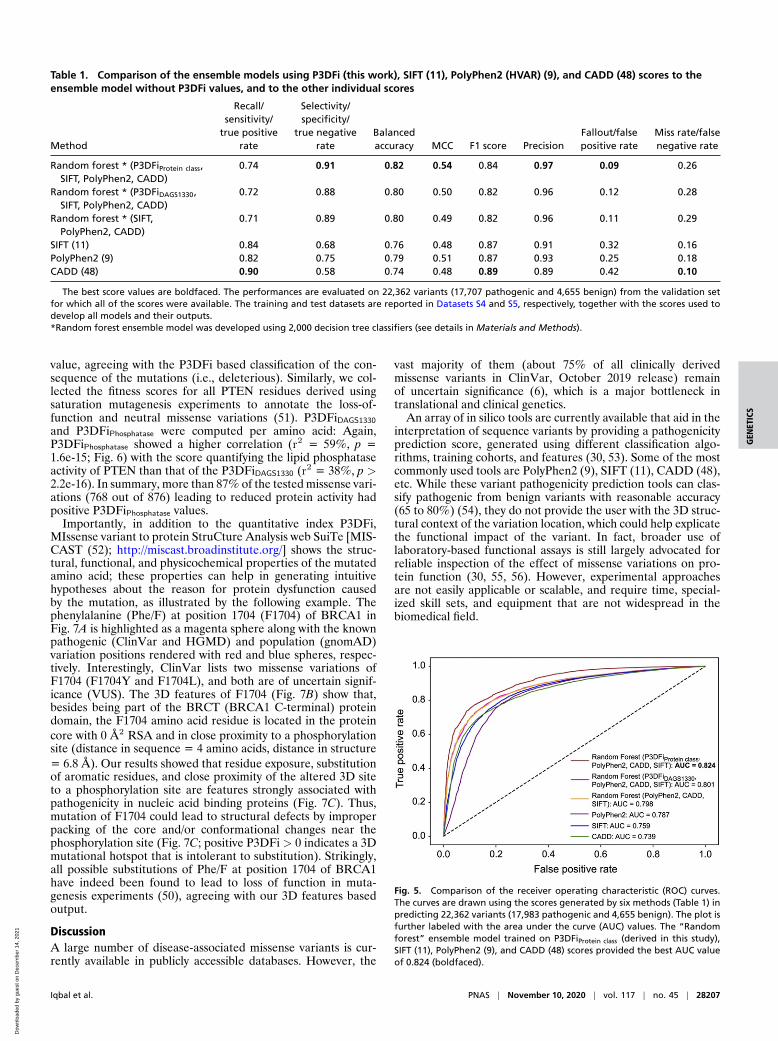
lowest difference between pathogenic and population variant-associated 3D features identified in this study (Figs. 2 and 3A).Although a relatively small fraction of the total pathogenic andbenign variants were in the highest and lowest index range, about90% (967 out of 1, 070) of all variants in the highest index range(P3DFiDAGS1330 > 2; Fig. 4) are pathogenic, and 68% (532 out of779) of all variants in the lowest range (P3DFiDAGS1330 < −2) arebenign. We further compared this high-confidence classificationof variants using P3DFi values with three state-of-the-art mis-sense variant pathogenicity predictors, SIFT (11), PolyPhen2 (9),and CADD (48) (SI Appendix, Table S3). Both P3DFiDAGS1330and P3DFiProtein class (see Materials and Methods for details) per-formed comparably with these existing methods. Importantly,P3DFiProtein class showed a better accuracy and precision than thatof the P3DFiDAGS1330.
However, it is worth noting that, unlike the other predic-tion scores, P3DFi values were not generated by a learningmodel that is trained on a set of features to classify pathogenicand benign variants. Instead, the P3DFi is purposely designedto characterize 3D mutational hotspots. We hypothesize thatP3DFi values can serve as an orthogonal dimension in the variantpathogenicity prediction (SI Appendix, Fig. S9) with respect tothe commonly used determinants employed by the existing meth-ods. To test our hypothesis, we developed three ensemble modelsusing the “Random forest” classifier (49) (see Materials andMethods for details): Two models were trained separately withthe P3DFiDAGS1330 and P3DFiProtein class values in addition to thescores from SIFT (11), PolyPhen2 (9), and CADD (48), and thethird model was trained without any P3DFi values (Table 1). Allthree models were trained using the variants in the DAGS1330dataset, and the performances were evaluated on the full val-idation dataset. The ensemble model including P3DFiDAGS1330values in addition to the other prediction scores performedcompetitively with the one without any P3DFi and with theindividual methods in terms of the balanced performance mea-sured by the Matthews correlation coefficient (MCC) (Table 1),highlighting that P3DFi indeed carries valuable informationfor effectively determining variants’ pathogenicity. CADD scoreclassified the variants with the highest true positive rate (∼90%),which, however, came at a cost of about 42% false positiverate. PolyPhen2, of the three independent predictors, showedthe highest balanced accuracy (∼79%). For comparison, theensemble model with P3DFiProtein class scored the best balancedaccuracy (∼82%), MCC (∼54%) (Table 1), and the highest areaunder the receiver operating characteristic (ROC) curve (82.4%)out of all six methods (Fig. 5), including the ensemble model withP3DFiDAGS1330.
Protein 3D Features Can Capture Missense Variations Leading toProtein Dysfunction. Unlike in silico variant pathogenicity predic-tion scores, our analysis of 3D features can often provide addi-tional and biologically interpretable information to rationalize themolecular effect of the variation on the protein. Here, we com-pare our feature-based characterization of 3D sites with the effectof amino acid substitutions obtained by functional assays for theenzyme PTEN and the DNA binding protein BRCA1 (Fig. 6).
We collected the saturation genome editing readouts foramino acid substitutions in the tumor suppressor gene BRCA1(13 exons in particular, encoding the RING and BRCTdomains) from the literature (50). Subsequently, we quan-tified the P3DFiDAGS1330 and P3DFiNucleic acid binding for 326residues in these two domains. While both the all-protein-based and function-specific P3DFi showed significant correla-tion (p = 3.9e-07 and 4.3e-10; Fig. 6) with the mutagenesisdata, the P3DFiNucleic acid binding was 21% more correlated thanthe P3DFiDAGS1330. Notably, most of the residues with loss-of-function missense mutations (67%, 165 out of 248) annotated bythe mutational screening also had a positive P3DFiNucleic acid binding
28206 | www.pnas.org/cgi/doi/10.1073/pnas.2002660117 Iqbal et al.
Dow
nloa
ded
by g
uest
on
Dec
embe
r 14
, 202
1
GEN
ETIC
S
Table 1. Comparison of the ensemble models using P3DFi (this work), SIFT (11), PolyPhen2 (HVAR) (9), and CADD (48) scores to theensemble model without P3DFi values, and to the other individual scores
Recall/ Selectivity/sensitivity/ specificity/
true positive true negative Balanced Fallout/false Miss rate/falseMethod rate rate accuracy MCC F1 score Precision positive rate negative rate
Random forest * (P3DFiProtein class, 0.74 0.91 0.82 0.54 0.84 0.97 0.09 0.26SIFT, PolyPhen2, CADD)
Random forest * (P3DFiDAGS1330, 0.72 0.88 0.80 0.50 0.82 0.96 0.12 0.28SIFT, PolyPhen2, CADD)
Random forest * (SIFT, 0.71 0.89 0.80 0.49 0.82 0.96 0.11 0.29PolyPhen2, CADD)
SIFT (11) 0.84 0.68 0.76 0.48 0.87 0.91 0.32 0.16PolyPhen2 (9) 0.82 0.75 0.79 0.51 0.87 0.93 0.25 0.18CADD (48) 0.90 0.58 0.74 0.48 0.89 0.89 0.42 0.10
The best score values are boldfaced. The performances are evaluated on 22,362 variants (17,707 pathogenic and 4,655 benign) from the validation setfor which all of the scores were available. The training and test datasets are reported in Datasets S4 and S5, respectively, together with the scores used todevelop all models and their outputs.*Random forest ensemble model was developed using 2,000 decision tree classifiers (see details in Materials and Methods).
value, agreeing with the P3DFi based classification of the con-sequence of the mutations (i.e., deleterious). Similarly, we col-lected the fitness scores for all PTEN residues derived usingsaturation mutagenesis experiments to annotate the loss-of-function and neutral missense variations (51). P3DFiDAGS1330and P3DFiPhosphatase were computed per amino acid: Again,P3DFiPhosphatase showed a higher correlation (r2 = 59%, p =1.6e-15; Fig. 6) with the score quantifying the lipid phosphataseactivity of PTEN than that of the P3DFiDAGS1330 (r2 = 38%, p >2.2e-16). In summary, more than 87% of the tested missense vari-ations (768 out of 876) leading to reduced protein activity hadpositive P3DFiPhosphatase values.
Importantly, in addition to the quantitative index P3DFi,MIssense variant to protein StruCture Analysis web SuiTe [MIS-CAST (52); http://miscast.broadinstitute.org/] shows the struc-tural, functional, and physicochemical properties of the mutatedamino acid; these properties can help in generating intuitivehypotheses about the reason for protein dysfunction causedby the mutation, as illustrated by the following example. Thephenylalanine (Phe/F) at position 1704 (F1704) of BRCA1 inFig. 7A is highlighted as a magenta sphere along with the knownpathogenic (ClinVar and HGMD) and population (gnomAD)variation positions rendered with red and blue spheres, respec-tively. Interestingly, ClinVar lists two missense variations ofF1704 (F1704Y and F1704L), and both are of uncertain signif-icance (VUS). The 3D features of F1704 (Fig. 7B) show that,besides being part of the BRCT (BRCA1 C-terminal) proteindomain, the F1704 amino acid residue is located in the proteincore with 0 A2 RSA and in close proximity to a phosphorylationsite (distance in sequence = 4 amino acids, distance in structure= 6.8 A). Our results showed that residue exposure, substitutionof aromatic residues, and close proximity of the altered 3D siteto a phosphorylation site are features strongly associated withpathogenicity in nucleic acid binding proteins (Fig. 7C). Thus,mutation of F1704 could lead to structural defects by improperpacking of the core and/or conformational changes near thephosphorylation site (Fig. 7C; positive P3DFi > 0 indicates a 3Dmutational hotspot that is intolerant to substitution). Strikingly,all possible substitutions of Phe/F at position 1704 of BRCA1have indeed been found to lead to loss of function in muta-genesis experiments (50), agreeing with our 3D features basedoutput.
DiscussionA large number of disease-associated missense variants is cur-rently available in publicly accessible databases. However, the
vast majority of them (about 75% of all clinically derivedmissense variants in ClinVar, October 2019 release) remainof uncertain significance (6), which is a major bottleneck intranslational and clinical genetics.
An array of in silico tools are currently available that aid in theinterpretation of sequence variants by providing a pathogenicityprediction score, generated using different classification algo-rithms, training cohorts, and features (30, 53). Some of the mostcommonly used tools are PolyPhen2 (9), SIFT (11), CADD (48),etc. While these variant pathogenicity prediction tools can clas-sify pathogenic from benign variants with reasonable accuracy(65 to 80%) (54), they do not provide the user with the 3D struc-tural context of the variation location, which could help explicatethe functional impact of the variant. In fact, broader use oflaboratory-based functional assays is still largely advocated forreliable inspection of the effect of missense variations on pro-tein function (30, 55, 56). However, experimental approachesare not easily applicable or scalable, and require time, special-ized skill sets, and equipment that are not widespread in thebiomedical field.
Fig. 5. Comparison of the receiver operating characteristic (ROC) curves.The curves are drawn using the scores generated by six methods (Table 1) inpredicting 22,362 variants (17,983 pathogenic and 4,655 benign). The plot isfurther labeled with the area under the curve (AUC) values. The “Randomforest” ensemble model trained on P3DFiProtein class (derived in this study),SIFT (11), PolyPhen2 (9), and CADD (48) scores provided the best AUC valueof 0.824 (boldfaced).
Iqbal et al. PNAS | November 10, 2020 | vol. 117 | no. 45 | 28207
Dow
nloa
ded
by g
uest
on
Dec
embe
r 14
, 202
1

Pea
rson
r2
BRCA1(Nucleic acid binding protein)
PTEN(Phosphatase)
p=
3.9e
-07
p =
4.3e
-10
p =
1.6e
-15
r2=
0.28 r2=
0.34
r2=
0.38
p <
2.2e
-16
r2=
0.59
0.2
0.3
0.4
0.5
0.6
0.7
Fig. 6. Comparison of the saturation mutagenesis screening readoutsand P3DFi values (derived in this study). The figure shows the output ofPearson’s product moment correlation tests between the mean fitness scoresfrom the mutagenesis experiment per amino acid (to all possible substi-tutions) and both the P3DFiDAGS1330 and P3DFiProtein class values for twoproteins: BRCA1 (50) and PTEN (51). The diamonds show the estimatedcorrelation values (Pearson r2). Vertical bars show the 95% CIs and arelabeled with the significance (p values) of the test result. The correla-tion between experimental outputs measuring the functional consequenceof mutations and the protein function-specific P3DFi (P3DFiPhosphatase forPTEN and P3DFiNucleic acid binding for BRCA1) are higher than that of theP3DFiDAGS1330 values for both proteins. These results illustrate that 3D fea-tures specific to the protein function can provide a substantial advantage incorrectly interpreting the consequences of missense variations.
In an effort to tackle this problem, and considering thatthe function of a protein is intimately linked to its structure,we hypothesized that characterizing the amino acid positionsaffected by pathogenic and benign missense variations in the con-text of the native protein structure can effectively decipher themolecular effects of a variant. Current studies analyzing missensevariants in protein structures are mostly focused on the field ofcancer research (22–24). Here we present a large-scale associa-tion study of germline pathogenic and population variations (SIAppendix, Fig. S10) with their respective 3D features for 1, 330genes, of which 1, 077 are implicated in noncancer Mendeliandisorders (4), using over 14, 000 experimentally solved proteinstructures.
The only structure-related criterion currently recognized bythe ACMG as a determinant of variant pathogenicity is the pres-ence of missense variations in known functionally critical proteindomains (30, 57). Our work also confirms the utility of thesedomains in variant pathogenicity assessment (over threefoldenrichment of pathogenic variants in “modular domain”; Fig. 2).However, it is worth noting that 28% of the pathogenic missensevariants in our dataset alter amino acids outside any domain cur-rently annotated in UniProt (58), indicating that the complexinterplay of factors governing protein stability and functional-ity cannot be reduced to domains alone. Indeed, we identifieddisulfide bonds and two PTM sites to have higher enrich-ment of pathogenic variations than that of “modular domains”(Fig. 2), in agreement with previous studies showing the link
between pathogenic variants and these structure-based features(21) at a relatively small scale (i.e., variants from 1000 GenomesProject).
Several studies have discretely analyzed different structure-related features of amino acid positions (16, 59, 60) affectedin missense variants. In contrast, we investigated a broad set offeatures, reporting on amino acids’ structural context as well astheir chemical and functional properties. An example illustrat-ing the benefit of our characterization using a more detailedset of features, for example, the eight-class description of sec-ondary structures compared to the classical three classes (20, 61),is the identification of π-helical residues as a feature significantlyassociated with pathogenic variants (Fig. 2 and SI Appendix,Fig. S3E). Although relatively rare (about 0.6% of all residues inthe 1,330 proteins analyzed in this study), 90 genes in our datasethad at least one disease-associated mutation changing a π-helicalresidue. These structural motifs are conserved and are knownto contribute to the stabilization of specific binding sites withinproteins (62, 63), so it is plausible that alteration of π-heliceswould be associated with serious perturbation of specific proteinfunctions.
To the best of our knowledge, no previous studies have statis-tically assessed the properties of missense variants separately forgenes encoding different protein functions, especially includingstructural information. Results obtained from analyzing variantsfrom all 1, 330 genes together revealed 3D features that are crit-ical, in general, for protein fitness. These general characteristicsof 3D hotspots that we (Fig. 2) and others (20–22, 64) haveidentified are necessary for making an educated guess aboutthe effect of missense variations in any protein without know-ing their function. But the insights gathered from these resultsare inherently limited because of the sheer diversity of proteins’structural and functional properties. We thus delved deeper intothe data and performed the same characterization of 3D muta-tional hotspots individually for 24 protein classes, which allowedus to identify many additional functionally relevant associations(Dataset S3 and Fig. 3A). Our results captured 3D features thathave 1) a similar type and level of association (pathogenic orpopulation, weak or strong) for every functional class (such asresidues exposure level to solvent; Fig. 3A) and 2) an oppositeor extremely elevated association for one/few classes comparedto the general trend (i.e., function-specific characteristics). Forexample, results in Fig. 2 alone (from the all gene-based analy-sis) suggest that a variant where a 3D site involved in a hydrogenbond is mutated is likely a nonpathogenic variant. However, ourfunction-specific analysis revealed four protein classes (trans-porter, protease, kinase, and nucleic acid binding proteins), forwhich residues forming interprotein hydrogen bonds are indeedassociated with pathogenic variants (Fig. 3A and SI Appendix,Fig. S6C), similarly to what had been previously reported for a setof proteins and protein complexes (18). Conversely, amino acidsnear phosphorylation sites were found enriched for pathogenicvariants in our joint analysis output (Fig. 3A, first column),recapitulating the findings of previous studies (59, 65, 66). Butwe observed an opposite pattern for hydrolases and cell adhe-sion molecules with frequent population variants near (<10 A)phosphorylation sites (Fig. 3A and SI Appendix, Fig. S7D),further underlining the importance of our function-basedanalysis.
In addition to identifying function-specific features of mis-sense variants in protein structures, our analysis could alsoexplain contrasting claims found in the literature. In a recentreview (20), both disease-causing and benign missense varia-tions were reported to be predominantly located in helices andcoil regions and less frequently in β-strands, whereas β-strandshad been found to be more intolerant to mutations than α-helices in separate studies (61, 67). Our analysis of 1, 330 genesdid identify β-strands/sheets to be intolerant to substitution in
28208 | www.pnas.org/cgi/doi/10.1073/pnas.2002660117 Iqbal et al.
Dow
nloa
ded
by g
uest
on
Dec
embe
r 14
, 202
1

GEN
ETIC
S
BA
C
Fig. 7. Protein features of missense variations on 3D structure provide intuitive insights into the effect of amino acid substitutions. (A) Structure (PDB IDcode 2ING, chain: X) of BRCA1 with pathogenic (red) and population (blue) variations mapped, with an additional phenylalanine (Phe/F) at position 1704(F1704) highlighted in pink for further analysis in this overview. (B) The 3D feature annotations for F1704. (C) Comparison of features of F1704 with proteinclass-specific 3D features associated to pathogenic and population variants (BRCA1 is annotated as a nucleic acid binding protein). A feature is highlightedin red if it matches a pathogenic variant-associated feature, or in blue if it matches a population variant-associated feature. In this example, F1704 possessessix pathogenic (3DFPATH) and zero population (3DFPOP) variant-associated 3D features. Thus, for F1704, P3DFiNucleic acid binding is equal to 6 – 0 = 6 (a positiveP3DFi value represents a 3D mutational hotspot).
general (Fig. 2), in agreement with the latter. Importantly, how-ever, we also identified five protein classes (cell junction proteins,kinases, nucleic acid binding proteins, transcription factors, andtransporters) that show enrichment of pathogenic variants in α-helical residues, in contrast to the general trend (Fig. 3A andSI Appendix, Fig. S3D). Interestingly, these residues tend to berelatively buried, with a probability of 46% (cell junction pro-teins) to 74% (kinases) of having a lower RSA than the averagepathogenic variant-associated helical amino acid in the wholeDAGS1330 set. These results show that characteristic featuresof 3D mutational hotspots vary based on the gene and variantset used for the analysis, which may be the reason underlyingthe diverging findings in the literature. Our study employinga unified dataset and workflow could detect such variabilitythrough the combined analysis over all genes and the individ-ual analysis of specific functional protein classes (SI Appendix,Table S1 and Dataset S3). In particular, it is important to stressthat we measured the statistical burden of pathogenic varia-tions on a feature compared to the population variations witha two-sided Fisher’s exact test (see Materials and Methods). Thismethod effectively reduces the possibility of obtaining a trivialresult due to biased statistics of features in the proteins of agiven functional class (e.g., findingα-helical residues significantlyassociated with pathogenic variants in predominantly α-helical
proteins; SI Appendix, Fig. S11), and should therefore return onlymeaningful associations. For further verification of our proteinclass-specific results, we computed the “relative risk” (RR) (68)of a mutation to be pathogenic given that the altered residuehas a 3D feature (for all 40 features) across the full dataset(DAGS1330 set) and for individual protein classes: Notably, theRR values were strongly correlated (Pearson r2 = 94%) withthe OR (Fig. 3), indicating that the ORs effectively approximatethe RRs for our study.
The validity of this approach in yielding significant resultsis supported by the performance of a 3D feature-based index(P3DFi) that we generated in this study for each amino acid toquantify the relative effect of their substitution. For the sameprotein, P3DFi can be calculated considering the “general” char-acteristic 3D features of pathogenic and population variantsfound by analyzing all genes together (P3DFiDAGS1330) and alsousing the function-specific 3D features (P3DFiProtein class) (seeMaterials and Methods). Germline mutations in the phosphataseand tensin homolog (PTEN) protein have been shown to be asso-ciated with diverse clinical phenotypes, including cancers andautism spectrum disorder, due to the structural defects caused bythe mutations (37, 51, 69). By comparing P3DFi values with theeffect of PTEN variants on the protein’s lipid phosphatase activ-ity in vivo as determined by saturation mutagenesis experiments
Iqbal et al. PNAS | November 10, 2020 | vol. 117 | no. 45 | 28209
Dow
nloa
ded
by g
uest
on
Dec
embe
r 14
, 202
1

(51), we noticed that the P3DFiPhosphatase is 55% more corre-lated (Pearson r2) with the mutational screen readouts than theP3DFiDAGS1330 (Fig. 6). To further validate our findings, we havealso assessed the predictive value of P3DFi by evaluating the per-formance of a random forest classifier. When the same classifieris trained with P3DFiProtein class in conjunction with other state-of-the-art variant pathogenicity prediction scores [from SIFT(11), PolyPhen2 (9), and CADD (48)], it can more accuratelyclassify pathogenic and benign variants (8% higher MCC value;Table 1) than the model built using P3DFiDAGS1330 and theexisting scores.
As is the case for functional classes, the characteristic fea-tures of 3D mutational hotspots can vary across different proteinstructural classes or folds (α–β barrel, β-propeller, α-horseshoe,etc.). Functional sites and regions have already been shown tobe enriched with pathogenic variations (Fig. 2 and SI Appendix,Fig. S1B and refs. 64 and 70), and the 3D configuration ofthese sites/regions may well differ across different structuralclasses (71). Future investigations in this direction can unveilstructure-specific insights into the impact of missense variationsin different folds. It is important to note that we characterizedthe positions of missense variations on experimentally solvedhuman protein structures as available in the PDB (8), whichcovers only one-third of the human proteome. For those caseswhere the gene is known but the corresponding protein struc-ture has not yet been solved, inclusion of homology modelscould increase the power of statistical analyses similar to theone performed here. However, to ensure a reliable characteri-zation of the 3D mutational hotspots, we employed only genesfor which both pathogenic and population variations were map-pable on experimentally solved structures, which still resulted inby far the largest study of this kind. It is also worth mention-ing that, out of the total variants of the 1, 330 disease-associatedgenes, we could map a higher proportion of pathogenic vari-ants (61% of 63, 606) onto protein structures compared to thepopulation variants (33% of 496, 869), which could plausibly bedue to a bias of the relevant scientific community toward solvingmainly the structure of the functionally relevant part of pro-teins (60) for structure-based target analysis and drug discoverypurposes.
To summarize, in this study, we went beyond widely appliedsequence- and conservation-based characterization of missensevariants, and quantitatively determined the 3D protein featuresof amino acids affected by pathogenic or population variantsfrom 1, 330 disease-associated genes. Furthermore, we identifiedspecific features that are important for the function of a certainprotein class, adding one important dimension to our under-standing of the functional effect of missense variations. We madethe outcome of this study (precomputed P3DFiDAGS1330 andP3DFiProtein class values for every possible amino acid exchange inproteins encoded by 1, 330 disease-associated genes, along withthe explicit listing of the 3D features of the altered site as therationale for the index) available through a dedicated web server(MISCAST; http://miscast.broadinstitute.org/). By bringing thegenetic variation into the 3D protein context, we believe that ourstudy outcome can serve as a powerful resource for the transla-tion of personal genomics to personal diagnostics and precisionmedicine: It can help to delineate variant pathogenicity, selectcandidate variants for functional assays, and aid in generatinghypothesis for drug development.
Materials and MethodsDetailed information is provided in SI Appendix.
DAGS1330 and Validation Dataset Preparation. Protein structures solved inhuman (in full or chimeric) were collected from the PDB (8). Protein-codingsingle nucleotide variants in the general population (hereafter referred toas “population” variant/variation) were obtained from gnomAD database,
public release 2.0.2 (7). In addition, the “pathogenic” missense variationswere collected from two sources: the ClinVar database (6), February 2018release, and HGMD® professional release 2018.4 (5) (SI Appendix, Table S1).For 1, 330 genes, we could map 164, 915 population and 32, 923 pathogenicvariations onto 14, 270 human protein structures (Fig. 1, step 1). This datasetis referred to as DAGS1330 (Dataset S1) and was used for the statisticalanalysis.
An additional validation set of pathogenic (n = 17, 983) and benign(n = 4, 712) missense variations was collected from ClinVar, February 2019release, and HGMD® professional release 2019.2. All variants present in theDAGS1330 set were removed (SI Appendix). Further, high-throughput muta-genesis readouts, classifying loss-of-function variations from neutral ones inBRCA1 and PTEN, were collected from literature (50, 51).
Protein Feature Mining and Annotation. The amino acid residues were anno-tated with 40 protein features (a combination of structural, physicochemi-cal, and functional features) from seven main feature categories (Fig. 1, step2; see detailed definitions in SI Appendix). The secondary structure and sol-vent accessible area of amino acid residues were calculated using the DSSP(dictionary of protein secondary structure) program (40). Protein–proteininteractions, PTMs, and functional features were obtained from the PDBsum(41), PhosphoSitePlus (42), and UniProt (43) databases, respectively.
Protein Class Annotation. The protein class information for the genes wasaggregated from 1) PANTHER (Protein Analysis Through Evolutionary Rela-tionships) database (44), 2) Ensemble family description (version 93), and 3)molecular function and/or biological process annotation available in UniProt(Fig. 1, step 3). Note that a protein may have multiple functions and so canbe assigned into multiple classes (see the full list in Dataset S2).
Statistical Analysis. We used two-sided Fisher’s exact test of association toquantify the burden of pathogenic or population variations for each fea-ture (Fig. 1, step 4). An estimate of enrichment or burden (OR), 95% CI, andthe p value (p) showing the significance of the observed burden or associ-ation were obtained from the test output. All p values were corrected togenerate “q” as p × 1,000 (total number of tests). Therefore, a 3D featureis considered to be a characteristic feature of pathogenic variants when thetest outputs OR > 1 and q < 0.05. In contrast, when the test outputs OR <
1 and q < 0.05, the feature is referred to as a characteristic 3D feature ofpopulation variants.
Computation of P3DFi per Amino Acid. For each amino acid residue of theproteins encoded by the 1, 330 disease-associated genes, we generated the3D feature annotations (Fig. 7B) and counted the number of pathogenicand population variant-associated 3D features of the amino acid, denotedas 3DFPATH and 3DFPOP, respectively. Thereafter, the P3DFi per amino acid iscomputed as 3DFPATH minus 3DFPOP (P3DFi 0 thus indicates a 3D mutationalhotspot; Fig. 7C). Note that we identified the pathogenic and popula-tion variant-associated 3D features for all 1, 330 genes analyzed togetheras one pool (Fig. 2) and also for 24 different protein classes (Fig. 3A).Therefore, P3DFi can be derived using the full DAGS1330-based 3D fea-tures (P3DFiDAGS1330) and also using protein class-specific (P3DFiProtein class)3D features.
Development of Ensemble Model. All models were developed using theclassical random forest method, which was implemented using the scikit-learn machine learning library for Python. The model parameters wereset to number of estimators or decision trees = 2, 000, quality mea-sure = “gini,” and the maximum depth of the trees = 10. Both thetraining and test datasets, along with the prediction scores (>0.5: dele-terious/pathogenic, ≤0.5: neutral/benign), are available in Datasets S4and S5.
Data Availability. All data that are used and generated in this studyare made available through Datasets S1–S5 and the MISCAST webserver(http://miscast.broadinstitute.org/).
ACKNOWLEDGMENTS. We acknowledge Costin Leu, Giulio Genovese, andJon Bloom for insightful discussions that motivated some of the analy-sis presented in this manuscript. This work was supported by the StanleyCenter for Psychiatric Research. P.M. received research grants from FondsNational de la Recherche de Luxembourg: the National Centre for Excel-lence in Research on Parkinson’s Disease (NCER-PD, Grant FNR11264123)and the Mitochondrial Risk factors in Parkinson disease (MiRisk-PD, GrantC17/BM/11676395).
28210 | www.pnas.org/cgi/doi/10.1073/pnas.2002660117 Iqbal et al.
Dow
nloa
ded
by g
uest
on
Dec
embe
r 14
, 202
1

GEN
ETIC
S
1. G. Glusman, Clinical applications of sequencing take center stage. Genome Biol. 14,303 (2013).
2. S. A. Dugger, A. Platt, D. B. Goldstein, Drug development in the era of precisionmedicine. Nat. Rev. Drug Discov. 17, 183–196 (2018).
3. M. Lek et al., Analysis of protein-coding genetic variation in 60,706 humans. Nature536, 285–291 (2016).
4. V. A. McKusick, Mendelian inheritance in man and its online version, OMIM. Am. J.Hum. Genet. 80, 588–604 (2007).
5. P. D. Stenson et al., The human gene mutation database: Building a comprehen-sive mutation repository for clinical and molecular genetics, diagnostic testing andpersonalized genomic medicine. Hum. Genet. 133, 1–9 (2014).
6. M. J. Landrum et al., ClinVar: Improving access to variant interpretations andsupporting evidence. Nucleic Acids Res. 46, D1062–D1067 (2018).
7. K. J. Karczewski et al., The mutational constraint spectrum quantified from variationin 141,456 humans. Nature 581, 434–443 (2020).
8. H. M. Berman, P. E. Bourne, J. Westbrook, C. Zardecki, “The protein data bank” inProtein Structure, D. Chasman, Ed. (CRC, 2003), pp. 394–410.
9. I. A. Adzhubei et al., A method and server for predicting damaging missensemutations. Nat. Methods 7, 248–249 (2010).
10. M. Kircher et al., A general framework for estimating the relative pathogenicity ofhuman genetic variants. Nat. Genet. 46, 310–315 (2014).
11. P. C. Ng, S. Henikoff, SIFT: Predicting amino acid changes that affect protein function.Nucleic Acids Res. 31, 3812–3814 (2003).
12. E. H. Baugh et al., Robust classification of protein variation using structuralmodelling and large-scale data integration. Nucleic Acids Res. 44, 2501–2513(2016).
13. L. Sundaram et al., Predicting the clinical impact of human mutation with deep neuralnetworks. Nat. Genet. 50, 1161–1170 (2018).
14. V. Pejaver, S. D. Mooney, P. Radivojac, Missense variant pathogenicity predictors gen-eralize well across a range of function-specific prediction challenges. Hum. Mutat. 38,1092–1108 (2017).
15. A. David, M. J. Sternberg, The contribution of missense mutations in core and rimresidues of protein–protein interfaces to human disease. J. Mol. Biol. 427, 2886–2898(2015).
16. H. Nishi, J. Nakata, K. Kinoshita, Distribution of single-nucleotide variants on protein–protein interaction sites and its relationship with minor allele frequency. Protein Sci.25, 316–321 (2016).
17. N. Sahni et al., Widespread macromolecular interaction perturbations in humangenetic disorders. Cell 161, 647–660 (2015).
18. S. Stefl, H. Nishi, M. Petukh, A. R. Panchenko, E. Alexov, Molecular mechanisms ofdisease-causing missense mutations. J. Mol. Biol. 425, 3919–3936 (2013).
19. M. Petukh, T. G. Kucukkal, E. Alexov, On human disease-causing amino acid variants:Statistical study of sequence and structural patterns. Hum. Mutat. 36, 524–534 (2015).
20. T. G. Kucukkal, M. Petukh, L. Li, E. Alexov, Structural and physico-chemical effectsof disease and non-disease nsSNPs on proteins. Curr. Opin. Struct. Biol. 32, 18–24(2015).
21. M. Gao, H. Zhou, J. Skolnick, Insights into disease-associated mutations in the humanproteome through protein structural analysis. Structure 23, 1362–1369 (2015).
22. C. L. Araya et al., Identification of significantly mutated regions across cancer typeshighlights a rich landscape of functional molecular alterations. Nat. Genet. 48, 117–125 (2016).
23. A. Kamburov et al., Comprehensive assessment of cancer missense mutationclustering in protein structures. Proc. Natl. Acad. Sci. U.S.A 112, E5486–E5495 (2015).
24. R. M. Sivley, X. Dou, J. Meiler, W. S. Bush, J. A. Capra, Comprehensive analysis of con-straint on the spatial distribution of missense variants in human protein structures.Am. J. Hum. Genet. 102, 415–426 (2018).
25. M. J. Meyer et al., Mutation3D: Cancer gene prediction through atomic clustering ofcoding variants in the structural proteome. Hum. Mutat. 37, 447–456 (2016).
26. C. Tokheim et al., Exome-scale discovery of hotspot mutation regions in human cancerusing 3D protein structure. Cancer Res. 76, 3719–3731 (2016).
27. S. Ittisoponpisan et al., Can predicted protein 3D structures provide reliable insightsinto whether missense variants are disease associated? J. Mol. Biol. 431, 2197–2212(2019).
28. C. M. Yates, I. Filippis, L. A. Kelley, M. J. Sternberg, Suspect: Enhanced prediction ofsingle amino acid variant (SAV) phenotype using network features. J. Mol. Biol. 426,2692–2701 (2014).
29. R. A. Laskowski, J. D. Stephenson, I. Sillitoe, C. A. Orengo, J. M. Thornton, VarSite:Disease variants and protein structure. Protein Sci. 29, 111–119 (2020).
30. S. Richards et al., Standards and guidelines for the interpretation of sequence vari-ants: A joint consensus recommendation of the American College of Medical Geneticsand Genomics and the Association for Molecular Pathology. Genet. Med. 17, 405–423(2015).
31. A. Fersht, Structure and Mechanism in Protein Science: A Guide to Enzyme Catalysisand Protein Folding (Macmillan, 1999).
32. C. L. Worth, S. Gong, T. L. Blundell, Structural and functional constraints in theevolution of protein families. Nat. Rev. Mol. Cell Biol. 10, 709–720 (2009).
33. S. G. Williams, S. C. Lovell, The effect of sequence evolution on protein structuraldivergence. Mol. Biol. Evol. 26, 1055–1065 (2009).
34. S. J. Sanders et al., Progress in understanding and treating SCN2A-mediated disorders.Trends Neurosci. 41, 442–456 (2018).
35. J. Spillane, D. Kullmann, M. Hanna, Genetic neurological channelopathies: Moleculargenetics and clinical phenotypes. J. Neurol. Neurosurg. Psychiatry 87, 37–48 (2016).
36. H. O. Heyne et al., Predicting functional effects of missense variants in voltage-gatedsodium and calcium channels. Sci. Transl. Med. 12, eaay6848 (2020).
37. I. N. Smith, S. Thacker, R. Jaini, C. Eng, Dynamics and structural stability effects ofgermline PTEN mutations associated with cancer versus autism phenotypes. J. Biomol.Struct. Dyn. 37, 1766–1782 (2019).
38. H. E. Olson et al., Cyclin-dependent kinase-like 5 (CDKL5) deficiency disorder: Clinicalreview. Pediatr. Neurol. 97, 18–25 (2019).
39. S. Velankar et al., SIFTS: Structure integration with function, taxonomy and sequencesresource. Nucleic Acids Res. 41, D483–D489 (2012).
40. W. Kabsch, C. Sander, Dictionary of protein secondary structure: Pattern recognitionof hydrogen-bonded and geometrical features. Biopolym. Orig. Res. on Biomol. 22,2577–2637 (1983).
41. R. A. Laskowski, J. Jabłonska, L. Pravda, R. S. Varekova, J. M. Thornton, PDBsum:Structural summaries of PDB entries. Protein Sci. 27, 129–134 (2018).
42. P. V. Hornbeck et al., Phosphositeplus, 2014: Mutations, PTMs and recalibrations.Nucleic Acids Res. 43, D512–D520 (2015).
43. R. Apweiler et al., Uniprot: The universal protein knowledgebase. Nucleic Acids Res.32, D115–D119 (2004).
44. H. Mi et al., PANTHER version 11: Expanded annotation data from gene ontologyand reactome pathways, and data analysis tool enhancements. Nucleic Acids Res. 45,D183–D189 (2017).
45. A. Burkle, “Posttranslational modification” in Encyclopedia of Genetics, S. Brenner,J. H. Miller, Eds. (Academic, New York, 2001), p. 1533.
46. D. A. Dougherty, Cation-π interactions involving aromatic amino acids. J. Nutr. 137,1504S–1508S (2007).
47. I. Friedberg, H. Margalit, Persistently conserved positions in structurally similar,sequence dissimilar proteins: Roles in preserving protein fold and function. ProteinSci. 11, 350–360 (2002).
48. P. Rentzsch, D. Witten, G. M. Cooper, J. Shendure, M. Kircher, CADD: Predicting thedeleteriousness of variants throughout the human genome. Nucleic Acids Res. 47,D886–D894 (2019).
49. A. Liaw, M. Wiener, Classification and regression by randomforest. R News 2, 18–22(2002).
50. G. M. Findlay et al., Accurate classification of BRCA1 variants with saturation genomeediting. Nature 562, 217–222 (2018).
51. T. L. Mighell, S. Evans-Dutson, B. J. O’Roak, A saturation mutagenesis approach tounderstanding PTEN lipid phosphatase activity and genotype-phenotype relation-ships. Am. J. Hum. Genet. 102, 943–955 (2018).
52. S. Iqbal et al., MISCAST: MIssense variant to protein StruCture Analysis web SuiTe,Nucleic Acids Res. 48, W132–W139 (2020).
53. J. Li et al., Performance evaluation of pathogenicity-computation methods formissense variants. Nucleic Acids Res. 46, 7793–7804 (2018).
54. J. Thusberg, A. Olatubosun, M. Vihinen, Performance of mutation pathogenicityprediction methods on missense variants. Hum. Mutat. 32, 358–368 (2011).
55. L. M. Starita et al., Variant interpretation: Functional assays to the rescue. Am. J. Hum.Genet. 101, 315–325 (2017).
56. K. S. Raraigh et al., Functional assays are essential for interpretation of missensevariants associated with variable expressivity. Am. J. Hum. Genet. 102, 1062–1077(2018).
57. Q. Li, K. Wang, Intervar: Clinical interpretation of genetic variants by the 2015 ACMG-AMP guidelines. Am. J. Hum. Genet. 100, 267–280 (2017).
58. A. L. Mitchell et al., InterPro in 2019: Improving coverage, classification and access toprotein sequence annotations. Nucleic Acids Res. 47, D351–D360 (2019).
59. J. Reimand, O. Wagih, G. D. Bader, Evolutionary constraint and disease associationsof post-translational modification sites in human genomes. PLoS Genet. 11, e1004919(2015).
60. N. Del-Toro et al., Capturing variation impact on molecular interactions in the IMExConsortium mutations data set. Nat. Commun. 10, 1–14 (2019).
61. G. Abrusan, J. A. Marsh, Alpha helices are more robust to mutations than betastrands. PLoS Comput. Biol. 12, e1005242 (2016).
62. M. Fodje, S. Al-Karadaghi, Occurrence, conformational features and amino acidpropensities for the π-helix. Protein Eng. Des. Sel. 15, 353–358 (2002).
63. T. M. Weaver, The π-helix translates structure into function. Protein Sci. 9, 201–206(2000).
64. M. Hicks, I. Bartha, J. di Iulio, J. C. Venter, A. Telenti, Functional characterization of 3Dprotein structures informed by human genetic diversity. Proc. Natl. Acad. Sci. U.S.A.116, 8960–8965 (2019).
65. I. Aukrust et al., SUMOylation of pancreatic glucokinase regulates its cellular stabilityand activity. J. Biol. Chem. 288, 5951–5962 (2013).
66. M. Krassowski et al., ActiveDriverDB: Human disease mutations and genome variationin post-translational modification sites of proteins. Nucleic Acids Res. 46, D901–D910(2018).
67. E. Sitbon, S. Pietrokovski, Occurrence of protein structure elements in conservedsequence regions. BMC Struct. Biol. 7, 3 (2007).
68. R. Beaglehole et al., Basic Epidemiology (World Health Organization, Geneva,Switzerland, 1993).
69. L. Yehia, E. Keel, C. Eng, The clinical spectrum of PTEN mutations. Annu. Rev. Med.71, 103–116 (2019).
70. C. M. Yates, M. J. Sternberg, Proteins and domains vary in their tolerance of non-synonymous single nucleotide polymorphisms (nsSNPs). J. Mol. Biol. 425, 1274–1286(2013).
71. M. Knudsen, C. Wiuf, The CATH database. Hum. Genomics 4, 207–212 (2010).
Iqbal et al. PNAS | November 10, 2020 | vol. 117 | no. 45 | 28211
Dow
nloa
ded
by g
uest
on
Dec
embe
r 14
, 202
1
![Multi-Parametric Characterization of Amino Acid- and ... · amino acids, these materials exhibit diversified application targets. Grushka and Scott [] the originators of this type](https://img.dokumen.tips/doc/110x75/5e50db8b5ed3ba4cbc28e945/multi-parametric-characterization-of-amino-acid-and-amino-acids-these-materials.jpg)

![Biology - CCEA...(ii) Identify the amino acid positions at which the sequences of the chicken and the silkworm differ. [1] (iii) Calculate the percentage of amino acids which differ](https://img.dokumen.tips/doc/110x75/6125f64e110f03758f17eadf/biology-ccea-ii-identify-the-amino-acid-positions-at-which-the-sequences.jpg)


![Syntheses, Characterization and biological Activity of 4 ... … · Syntheses, Characterization and biological Activity of 4-{[(Z)-(2-methoxyphenyl) methylidene] amino} ... All complexes](https://img.dokumen.tips/doc/110x75/5ecce93a63134f68651a6edb/syntheses-characterization-and-biological-activity-of-4-syntheses-characterization.jpg)


