Embed Size (px)
Citation preview
Comprehensive Annual Financial Report for the Fiscal Year Ended
September 30, 2018 Prepared by
Yousry Zakhary
Interim City Manager
Karen Evans, CPA
Chief Financial Officer


COMPREHENSIVE
ANNUAL FINANCIAL REPORT
of the
City of Bellmead, Texas
For the Year Ended
September 30, 2018
Prepared by
Yousry Zakhary
Interim City Manager
Karen Evans, CPA
Chief F inancia l Off icer


City of Bellmead, TexasTABLE OF CONTENTS
September 30, 2018
INTRODUCTORY SECTION
Letter of Transmittal 1
Organization Chart 5
List of Principal Officials 7
FINANCIAL SECTION
Independent Auditor’s Report 11
Management’s Discussion and Analysis 17
Basic Financial Statements
Government-Wide Financial Statements
Statement of Net Position 28
Statement of Activities 32
Fund Financial Statements
Governmental Funds:
Balance Sheet 34
Reconciliation of the Balance Sheet to the Statement of Net Position-
Governmental funds 37
Statement of Revenues, Expenditures, and Changes in Fund Balance-
Governmental Funds 38
Reconciliation of the Statement of Revenues, Expenditures, and
Changes in Fund Balances of Governmental Funds to the Statement
of Activities 41
Proprietary Funds:
Statement of Net Position 42
Statement of Revenues, Expenses, and Changes in Fund Net Position 43
Statement of Cash Flows 44
Notes to Financial Statements 47
REQUIRED SUPPLEMENTARY INFORMATION
Schedule of Revenues, Expenditures, and Changes in Fund Balances-
Budget and Actual - General Fund 84
Schedule of Revenues, Expenditures, and Changes in Fund Balances-
Budget and Actual - Hotel/Motel Tax Fund 85
Schedule of Changes in Net Pension (Asset) Liability and
Related Ratios-TMRS 86

City of Bellmead, TexasTABLE OF CONTENTS
September 30, 2018
Schedule of Employer Contributions-Texas Municipal Retirement System 87
Schedule of Changes in OPEB Liability and Related Ratios 88
OTHER SUPPLEMENTARY INFORMATION
Combining Balance Sheet – Nonmajor Governmental Funds 90
Combining Statement of Revenues, Expenditures, and Changes in Fund
Balances – Nonmajor Governmental Funds 91
Schedule of Revenues, Expenditures, and Changes in Fund Balances –
Budget and Actual:
Cable PEG Fees Fund 92
Court Security and Technology Fund 93
Debt Service Fund 94
Balance Sheet – Discretely Presented Component Unit 95
Reconciliation of the Discretely Presented Component Unit Balance Sheet to
the Statement of Net Position 96
Statement of Revenues, Expenditures, and Changes in Fund Balance-
Discretely Presented Component Unit 97
Reconciliation of the Statement of Revenues, Expenditures, and
Changes in Fund Balances of the Discretely Presented Component Unit
to the Statement of Activities 99
STATISTICAL SECTION
Net Position by Component 102
Changes in Net Position 104
Fund Balances, Governmental Funds 108
Changes in Fund Balance, Governmental Funds 110
Assessed Value and Estimated Actual Value of Taxable Property 112
Property Tax Rates – Direct and Overlapping Governments 114
Principal Property Taxpayers 117
Property Tax Levies and Collections 118
Ratios of Outstanding Debt by Type 120
Ratio of General Bonded Debt Outstanding 122
Direct and Overlapping Governmental Activities Debt 123
Legal Debt Margin Information 125
Revenue Bond Coverage – Water and Sewer Fund 126
Demographic and Economic Statistics 128
Principal Employers 129
Full–Time Equivalent City Employees by Function 130
Operating Indicators by Function 132
Capital Asset Statistics by Function/Program 134

Waterworks and Sewer System Revenue Bond Tables
Monthly Water and Wastewater Rates 137
Waterworks and Sewer System Revenue Bond Tables
Waterworks and Sewer System Condenced Statement of Operations 138
OVERALL COMPLIANCE AND INTERNAL CONTROL SECTION
Report on Internal Control over Financial Reporting and on Compliance and
Other Matters Based on an Audit of Financial Statements Performed in
Accordance with Government Auditing Standards 143
Schedule of Findings and Responses 145
Summary Schedule of Prior udit Findings 146
Corrective Action Plan 147


INTRODUCTORY SECTION


March 25, 2019
To the Honorable Mayor, City Council, and Citizens of the City of Bellmead, Texas
State law requires that every general-purpose local government publish, within six months of the close of each fiscal year, a complete set of audited financial statements. This report is published to fulfill that requirement for the fiscal year ended September 30, 2018.
Management assumes full responsibility for the completeness and reliability of the information contained in this report, based upon a comprehensive framework of internal control that has been established for this purpose. Because the cost of internal control should not exceed anticipated benefits, the objective is to provide reasonable, rather than absolute, assurance that the financial statements are free from any material misstatements.
BrooksWatson & Co., a firm of licensed independent certified public accountants, have issued an unmodified (“clean”) opinion on the City’s financial statements for the year ended September 30, 2018. The independent auditor’s report is located at the front of the financial section of this report.
The independent audit of the financial statements of the City of Bellmead was part of a broader, federally-mandated, Single Audit designed to meet the special needs of federal grantor agencies. The standards governing Single Audit engagements require the independent auditor to report, not only on the fair presentation of the financial statements, but also on the audited government’s internal controls and compliance with legal requirements with special emphasis on internal controls and legal requirements involving the administration of federal awards. These reports are available in the federal single audit section of this report.
Management’s Discussion and Analysis (MD&A) immediately follows the independent auditor’s report and provides a narrative introduction, overview, and analysis of the basic financial statements. This letter of transmittal is designed to complement MD&A and should be read in conjunction with it.
Profile of the City
Bellmead was founded in the mid-1920’s when the site was chosen for the locomotive shops of the Missouri, Kansas, and Texas railroad. The first school was named Bellmead in honor of Belle Meade Farms, a prominent horse farm in Tennessee.
Waco Army Air Field (later called James Connally Air Force Base) opened in 1942, just northeast of town. The town boasted a population of 25 in the early 1940s, which increased rapidly after World War II, rising to 800 by 1949. The community was incorporated in 1954 with a mayor-alderman government. By 1960, Bellmead had 5,127 residents and 85 businesses. When the air force base was closed in 1965, Texas A&M University established the James Connally Technical Institute at the facility. The City has since grown to an estimated population of 9,900.
1

The City of Bellmead is a home rule City and operates under the council-manager form of government. Policy-making and legislative authority are vested in the City Council which consists of a mayor and five council members. The City Council is responsible for, among other things, passing ordinances, adopting the budget, appointing committees, and hiring the City Manager. The City Manager is responsible for carrying out the policies and ordinances of the City Council, overseeing the day-to-day operations of the government and appointing department heads. The City provides a full range of services, including police and fire protection, construction and maintenance of streets, roads, and other infrastructure, solid waste collection, parks operation and maintenance, and administrative services necessary to serve the citizens of our community. Water and sewer services are operated under an enterprise fund concept, with user charges set to ensure adequate coverage of operating expenses and payments on outstanding debt. In addition, the City is also financially accountable for a legally separate economic development corporation, which is reported separately with the City’s financial statements. Additional information on this legally separate entity can be found in the Notes to the Financial Statements. The Council is required to adopt an initial budget for the fiscal year no later than September 27 preceding the beginning of the fiscal year on October 1. This annual budget serves as the foundation for the City’s financial planning and control. The budget is prepared by fund, function (e.g., public safety), and department (e.g., police). After adoption of the budget, the City Manager may transfer any unencumbered appropriation or portion thereof between general classifications of expenditures within a division or department. At the request of the City Manager and within the last three months of the fiscal year, the Council may be resolution, transfer any unencumbered appropriation or portion thereof from one division or department to another. After adoption, the City Council may amend the budget at any time. Local Economy The City of Bellmead is situated within the geographic center of Texas and is often referred to as the “Heart of Texas.” At the confluence of the Bosque River and the 890-mile Brazos River, Bellmead lies between the three largest cities in the state: 90 miles south of Dallas, 200 miles northwest of Houston, and 180 miles northeast of San Antonio. It is less than 100 miles from the state capital of Austin. The City sits on the rich southern agricultural Backland Prairie on the east and cattle country of the rolling Grand Prairie on the west. Bellmead sits just to the east of Waco and the major north/south route of Interstate Highway 35 which stretches from Laredo at the Mexican border to Duluth, Minnesota in the north. Bellmead enjoys vigorous sales tax and hotel tax revenues due to its proximity to Waco and Waco attractions. Secondary education is also available in the Bellmead area to include Baylor University, McLennan Community College, and Texas State Technical College. Baylor University, a private Christian university and a nationally ranked research institution, provides a vibrant campus community for more than 15,000 students by blending interdisciplinary research with an international reputation for educational excellence and a faculty commitment to teaching and scholarship. Baylor is located only three miles south of Bellmead on Interstate 35.
Chartered in 1845 by the Republic of Texas through the efforts of Baptist pioneers, Baylor is the oldest continually operating university in Texas. Located in Waco, Baylor welcomes students from all 50 states and more than 80 countries to study a broad range of degrees among its 11 nationally recognized academic divisions. Baylor University enjoys high standing among many national rating services that evaluate quality of education, research activity, affordability, baccalaureate value, sustainability and athletic excellence.
McLennan Community College is located on a scenic 215-acre campus adjacent to Cameron Park and the Bosque River. Nestled among rolling hills and large trees, MCC has been recognized statewide for its natural beauty and outstanding architecture. The college also owns Highlander Ranch, a 200-acre horse farm located
2

about five miles from campus and has an Emergency Services Education Center off campus near the Waco Regional Airport.
For more than 45 years, Texas State Technical College Waco has been providing top-quality technical education. The college is nationally recognized for the number and quality of our technology graduates. With more than 40,000 TSTC graduates employed throughout the state and nation, the tradition of excellence is strong.
TSTC Waco is committed to providing highly specialized and advanced technical education that can lead to great career opportunities. TSTC offers technical associate degrees, certificate programs and workforce mastery skills that give students a competitive edge in the job market. Students gain extensive hands-on experience in laboratories learning by doing, spending nearly 60 percent of their time working with the tools, technology and equipment they will use in their future careers.
TSTC offers career training for the future by providing solid basics and advanced technology applications and processes. Faculty members are experts in their fields, bringing real-world industry experience into the classroom and labs.
Major initiatives On February 24, 2004, the City entered into an interlocal cooperative agreement with the City of Waco and five other cities to acquire from Brazos River Authority the assets that comprise the Waco Metropolitan Area Regional Sewer System (WMARSS). The acquisition was funded by the issuance of bonds by the City of Waco and cash contributions by the member cities. The City's proportionate share is 5.707%. The City funded its share of the acquisition cost with a cash contribution from the Bellmead Development Corporation. In fiscal year 2014, the City issued 8,500,000 in certificates of obligation. $4,500,000 was designated for the sewer interceptor project and ground and elevated storage tank coatings systems project. $4,000,000 was designated for constructing the new Municipal Court building, renovating the Police and Fire Department buildings, purchasing public safety vehicles, upgrading the police parking lot, and making needed street improvements. This important capital improvement project was substantially completed in fiscal year 2018; however, cost savings on all project components will allow the construction of other eligible priority infrastructure projects. In fiscal year 2016, the City issued $2,400,000 in certificates of obligation to fund the Transfer/LaSalle Lift Station and Force Main Project for the Waco Metropolitan Area Regional Sewer System. The funding has been transferred to the City of Waco that manages WMARSS. There are three parts to this project which is currently in the construction phase 1) Gravity Line, Odor Control Facility, Inverted Siphon, 2) Transfer Lift Station, and 3) Force Main to WMARSS Central Plant. In fiscal year 2017, the City was awarded a $1,900,000 Economic Development Administration grant for the reconstruction of 4,850 linear feet of a 40-foot-wide roadway known as Tirey Road to enable increased traffic capacity to support expansion and location of tenants in the industrial park. Tirey Road was completed in FY 2018, and the City utilized funding from the 2014 certificates of obligation as the City’s matching portion. In fiscal year 2018, the City issued $2,000,000 in certificates of obligation to acquire and equip two fire trucks. The trucks are currently being built and will be ready for the City to put into use in FY 2019. Financial Procedures and Budgetary Controls The City’s accounting records for general government are maintained on a modified accrual basis, with revenues being recorded when available and measurable, and expenditures being recorded when the services
3

or goods are received, and the liabilities are incurred. Accounting records for the City’s water and sewer utility and other proprietary activities are maintained on the accrual basis. The budgetary process begins each year with the preparation of both current and proposed year revenue estimates by the City’s financial management staff, and expenditure estimates by each City department. Budgets are reviewed by the City Manager who submits a recommended budget to the City Council. The City Council approves all budget amendments. The City adopts an annual appropriated budget for its general fund. A budgetary comparison statement has been provided for the general fund to demonstrate compliance with this budget. Acknowledgements The preparation of this report would not have been possible without the proficient and dedicated work of the entire staff of the Finance Department. We wish to thank all city departments for their assistance in providing the data necessary to prepare this report. We also wish to express our sincere appreciation to the Mayor and City Council for their unfailing support for maintaining the highest standards of professionalism in the management of the City’s finances. Respectfully submitted,
Yousry Zakhary Karen Evans, CPA Interim City Manager Chief Financial Officer
4

Organization Chart
5

6

William Ridings Mayor - Precint 4
Dr. Alfreda Love Council Member - Precinct 1
Travis Gibson Council Member - Precinct 2
James Cleveland Council Member - Precinct 3
Doss Youngblood Council Member - Precinct 5
Gary Moore Council Member - At Large
Yousry Zakhary Interim City Manager
Charles Buenger City Attorney
Ray Black Municipal Judge
Karen Evans, CPA Chief Financial Officer
Lydia Alvarado Police Chief
William Hlavenka Fire Chief
Patricia Ervin Interim City Secretary
Scott Coleman Public Works Director
Velma Ervin-Haynes Court Administrator
City Council
City of Bellmead, TexasELECTED AND APPOINTED OFFICIALS
Appointed Officials
September 30, 2018
7

8

9
FINANCIAL SECTION

10

11
14950 Heathrow Forest Pkwy | Suite 530 | Houston, TX 77032 | Tel: 281.907.8788 | Fax: 888.875.0587 | www.BrooksWatsonCo.com
INDEPENDENT AUDITOR’S REPORT
To the Honorable Mayor and
Members of the City Council
City of Bellmead, Texas:
Report on the Financial Statements
We have audited the accompanying financial statements of the governmental activities, the
business-type activities, the discretely presented component unit, each major fund, and the
aggregate remaining fund information of the City of Bellmead, Texas (the “City”) as of and for
the year ended September 30, 2018, and the related notes to the financial statements, which
collectively comprise the City’s basic financial statements as listed in the table of contents.
Management’s Responsibility for the Financial Statements
The City’s management is responsible for the preparation and fair presentation of these financial
statements in accordance with accounting principles generally accepted in the United States of
America; this includes the design, implementation, and maintenance of internal control relevant
to the preparation and fair presentation of financial statements that are free from material
misstatement, whether due to fraud or error.
Auditor’s Responsibility
Our responsibility is to express opinions on these financial statements based on our audit. We
conducted our audit in accordance with auditing standards generally accepted in the United
States of America and the standards applicable to financial audits contained in Government
Auditing Standards, issued by the Comptroller General of the United States. Those standards
require that we plan and perform the audit to obtain reasonable assurance about whether the
financial statements are free from material misstatement.
An audit involves performing procedures to obtain audit evidence about the amounts and
disclosures in the financial statements. The procedures selected depend on the auditor’s
judgment, including the assessment of the risks of material misstatement of the financial
statements, whether due to fraud or error. In making those risk assessments, the auditor considers
internal control relevant to the entity’s preparation and fair presentation of the financial
statements in order to design audit procedures that are appropriate in the circumstances, but not
for the purpose of expressing an opinion on the effectiveness of the entity’s internal control.
Accordingly, we express no such opinion. An audit also includes evaluating the appropriateness

12
of accounting policies used and the reasonableness of significant accounting e stimates made by
management, as well as evaluating the overall presentation of the financial statements.
We believe that the audit evidence we have obtained is sufficient and appropriate to provide a
basis for our audit opinions.
Opinion
In our opinion, the financial statements referred to above present fairly, in all material respects,
the respective financial position of the governmental activities, the business -type activities, the
discretely presented component unit, each major fund, and the aggregate remaining fund
information of the City as of September 30, 2018, and the respective changes in financial position
and, where applicable, cash flows thereof for the year then ended in accordance with accounting
principles generally accepted in the United States of America.
Emphasis of Matter
As discussed in Note V.E. to the financial statements, due to the implementation of GASB No. 75,
the City restated its beginning net position within governmental activities and business -type
activities to properly reflect the total OPEB liability and related deferred outflows and inflows of
resources, as prescribed by this accounting standard. In addition, the City restated beginning net
position of governmental activities and business-type activities, and the beginning fund balances
of three governmental funds due to various accounting errors and changes in reporting of a
governmental fund and the City’s component unit. City Our opinion is not modified with respect
to these matters.
Other Matters
Required Supplementary Information
Accounting principles generally accepted in the United States of America require that the
management’s discussion and analysis, the general fund and hotel/motel tax fund budgetary
comparison information, the schedule of changes in net pension liabilities and related ratios, the
schedule of employer contributions to pension plan, and schedule of changes in the other
postemployment benefits liability and related ratios, be presented to supplement the basic
financial statements. Such information, although not a part of the basic financial statements, is
required by the Governmental Accounting Standards Board, who considers it to be an essential
part of financial reporting for placing the basic financial statements in an appropriate operational,
economic, or historical context. We have applied certain limited procedures to the required
supplementary information in accordance with auditing standards generally accepted in the
United States of America, which consisted of inquiries of management about the methods of
preparing the information and comparing the information for consistency with management’s
responses to our inquiries, the basic financial statements, and other knowledge we obtained
during our audit of the basic financial statements. We do not express an opinion or provide any

13
assurance on the information because the limited procedures do not provide us with sufficient
evidence to express an opinion or provide any assurance.
Other Information
Our audit was conducted for the purpose of forming opinions on the financial statements that
collectively comprise the City’s basic financial statements. The introductory section, budgetary
comparison information, combining schedules for nonmajor funds, and statistical sections are
presented for additional analysis and are not a required part of the basic financial statements.
The budgetary comparison information and combining schedules for nonmajor funds noted
above are the responsibility of management and was derived from and relates directly to the
underlying accounting and other records used to prepare the basic financial statements. Such
information has been subjected to the auditing procedures applied in the audit of the basic
financial statements and certain additional procedures, including comparing and reconciling
such information directly to the underlying accounting and other records used to prepare the
basic financial statements or to the basic financial statements themselves, and other additional
procedures in accordance with auditing standards generally accepted in the United States of
America. In our opinion, the supplementary information is fairly stated, in all material respects,
in relation to the basic financial statements as a whole.
The introductory section and the statistical section have not been subjected to the auditing
procedures applied in the audit of the basic financial statements, and accordingly, we do not
express an opinion or provide any assurance on it.
Other Reporting Required by Government Auditing Standards
In accordance with Government Auditing Standards, we have also issued our report dated March
25, 2019 on our consideration of the City’s internal control over financial reporting and on our
tests of its compliance with certain provisions of laws, regulations, contracts and grant
agreements, and other matters. The purpose of that report is solely to describe the scope of our
testing of internal control over financial reporting and compliance and the results of that testing,
and not to provide an opinion on the effectiveness of the City’s internal control over financial
reporting or on compliance. That report is an integral part of an audit performed in accordance
with Government Auditing Standards in considering the City’s internal control over financial
reporting and compliance.
BrooksWatson & Co., PLLC
Certified Public Accountants
Houston, Texas
March 25, 2019

14

MANAGEMENT'S DISCUSSION
AND ANALYSIS
15

16

City of Bellmead, TexasMANAGEMENT’S DISCUSSION AND ANALYSIS (MD&A)
September 30, 2018
17
As management of the City of Bellmead, Texas (the “City”), we offer readers of the City’s financial
statements this narrative overview and analysis of the financial activities of the City for the fiscal year
ended September 30, 2018.
Financial Highlights
The City's total combined net position is $24,560,722 at September 30, 2018. Of this, $8,753,087
(unrestricted net position) may be used to meet the City’s ongoing obligations to its citizens and
creditors.
At the close of the current fiscal year, the City’s governmental funds reported combined fund
balances of $9,769,824, an increase of $1,305,886.
As of the end of the year, the unassigned fund balance of the general fund was $1,252,075 or
16% of total general fund expenditures.
The City had an overall increase in net position of $1,027,746, which is primarily due to strong
water and utility revenues and increased investment in capital assets compared to the prior
year.
Overview of the Financial Statements
The discussion and analysis provided here are intended to serve as an introduction to the City’s basic
financial statements. The City’s basic financial statements consist of three components: 1) government-
wide financial statements, 2) fund financial statements, and 3) the notes to financial statements. This
report also includes supplementary information intended to furnish additional detail to support the
basic financial statements themselves.
Government-Wide Statements
The government-wide financial statements are designed to provide readers with a broad overview of the
City’s finances, in a manner similar to a private-sector business.
The statement of net position presents information on all of the City’s assets, liabilities, and deferred
inflows/outflows with the difference reported as net position. Over time, increases or decreases in net
position may serve as a useful indicator of whether the financial position of the City is improving or
deteriorating. Other non-financial factors, such as the City’s property tax base and the condition of the
City’s infrastructure, need to be considered in order to assess the overall health of the City.
The statement of activities presents information showing how the City’s net position changed during the
most recent fiscal year. All changes in net position are reported as soon as the underlying event giving
rise to the change occurs, regardless of the timing of related cash flows. Thus, revenues and expenses

City of Bellmead, TexasMANAGEMENT’S DISCUSSION AND ANALYSIS, Continued
September 30, 2018
18
are reported for some items that will only result in cash flows in future fiscal periods (e.g., uncollected
taxes and earned but unused vacation leave).
Both of the government-wide financial statements distinguish functions of the City that are principally
supported by taxes and intergovernmental revenues (governmental activities) from other functions that
are intended to recover all or a significant portion of their costs through user fees and charges (business-
type activities). The governmental activities of the City include general government, public safety, public
works, and culture and recreation. The business-type activities of the City include water and sewer
operations.
The government-wide financial statements include not only the City itself (known as the primary
government), but also the legally separate Bellmead Economic Development Corporation (the “EDC”)
for which the City is financially accountable. Financial information for these component units is
reported separately from the financial information presented for the primary government itself.
FUND FINANCIAL STATEMENTS
Funds may be considered as operating companies of the parent corporation, which is the City of
Bellmead. They are usually segregated for specific activities or objectives. The City of Bellmead uses
fund accounting to ensure and demonstrate compliance with finance-related legal reporting
requirements. The two categories of City funds are governmental and proprietary.
Governmental Funds
Governmental funds are used to account for essentially the same functions reported as governmental
activities in the government-wide financial statements. However, unlike the government-wide
financial statements, governmental fund financial statements focus on near-term inflows and outflows of
spendable resources, as well as on balances of spendable resources available at the end of the year. Such
information may be useful in evaluating the City’s near-term financing requirements.
Because the focus of governmental funds is narrower than that of the government-wide financial
statements, it is useful to compare the information presented for governmental funds with similar
information presented for governmental activities in the government-wide financial statements. By
doing so, readers may better understand the long-term impact of the government’s near-term financing
decisions. Both the governmental fund balance sheet and the governmental fund statement of
revenues, expenditures, and changes in fund balances provide a reconciliation to facilitate this
comparison between governmental funds and governmental activities.
The City of Bellmead maintains six individual governmental funds. Information is presented
separately in the governmental fund balance sheet and in the governmental fund statement of
revenues, expenditures, and changes in fund balances for the general, debt service, capital projects,

City of Bellmead, TexasMANAGEMENT’S DISCUSSION AND ANALYSIS, Continued
September 30, 2018
19
hotel/motel tax, court security and technology, and cable PEG funds. The general, capital projects, and
hotel/motel tax funds are considered to be major funds.
The City of Bellmead adopts an annual appropriated budget for all funds, with the exception of the
capital projects fund. Budgetary comparison schedules have been provided to demonstrate compliance
with all governmental fund budgets.
Proprietary Funds
The City maintains one type of proprietary fund. Proprietary funds are used to report the same
functions presented as business-type activities in the government-wide financial statements. The City
uses a proprietary fund to account for its water and sewer utility services. All activities associated with
providing such services are accounted for in this fund, including salaries and benefits, materials and
supplies, and other operating expenses. The City's intent is that costs of providing the services to the
general public on a continuing basis is financed through user charges in a manner similar to a private
enterprise.
Component Unit
The City maintains the accounting and financial statements for one component unit. The Bellmead EDC
is a discretely presented component unit displayed on the government-wide financial statements.
Notes to Financial Statements
The notes to the financial statements provide additional information that is essential to a full
understanding of the data provided in the government-wide and fund financial statements. The notes
are the last section of the basic financial statements.
Other Information
In addition to the basic financial statements, MD&A, and accompanying notes, this report also presents
certain Required Supplementary Information (RSI). The RSI that GASB Statement No. 34 requires is a
budgetary comparison schedule for the general fund, schedules for the City’s Defined Pension Plan,
and schedule for changes in postemployment benefits other than pension. RSI can be found after the
basic financial statements.
GOVERNMENT-WIDE FINANCIAL ANALYSIS
As noted previously, net position may serve over time as a useful indicator of the City’s financial
position. For the City of Bellmead, assets exceeded liabilities by $24,560,722 as of September 30, 2018,
in the primary government.
City of Bellmead, TexasMANAGEMENT’S DISCUSSION AND ANALYSIS, Continued
September 30, 2018
20
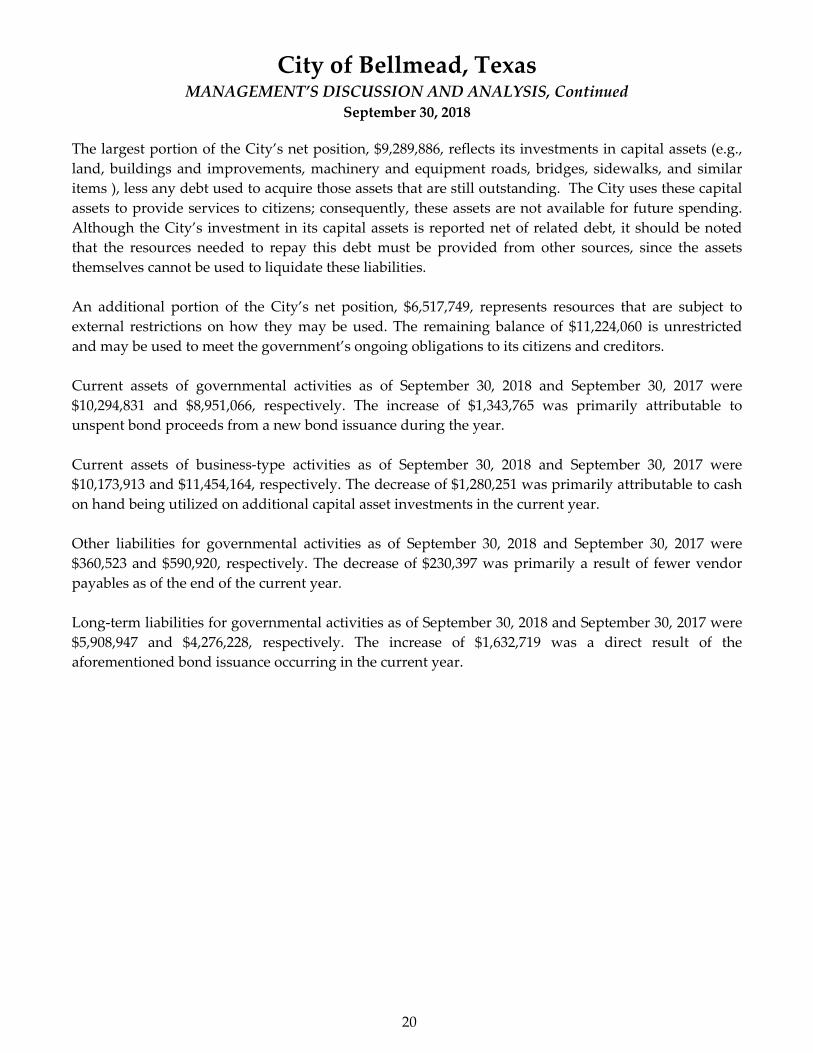
The largest portion of the City’s net position, $9,289,886, reflects its investments in capital assets (e.g.,
land, buildings and improvements, machinery and equipment roads, bridges, sidewalks, and similar
items ), less any debt used to acquire those assets that are still outstanding. The City uses these capital
assets to provide services to citizens; consequently, these assets are not available for future spending.
Although the City’s investment in its capital assets is reported net of related debt, it should be noted
that the resources needed to repay this debt must be provided from other sources, since the assets
themselves cannot be used to liquidate these liabilities.
An additional portion of the City’s net position, $6,517,749, represents resources that are subject to
external restrictions on how they may be used. The remaining balance of $11,224,060 is unrestricted
and may be used to meet the government’s ongoing obligations to its citizens and creditors.
Current assets of governmental activities as of September 30, 2018 and September 30, 2017 were
$10,294,831 and $8,951,066, respectively. The increase of $1,343,765 was primarily attributable to
unspent bond proceeds from a new bond issuance during the year.
Current assets of business-type activities as of September 30, 2018 and September 30, 2017 were
$10,173,913 and $11,454,164, respectively. The decrease of $1,280,251 was primarily attributable to cash
on hand being utilized on additional capital asset investments in the current year.
Other liabilities for governmental activities as of September 30, 2018 and September 30, 2017 were
$360,523 and $590,920, respectively. The decrease of $230,397 was primarily a result of fewer vendor
payables as of the end of the current year.
Long-term liabilities for governmental activities as of September 30, 2018 and September 30, 2017 were
$5,908,947 and $4,276,228, respectively. The increase of $1,632,719 was a direct result of the
aforementioned bond issuance occurring in the current year.

City of Bellmead, TexasMANAGEMENT’S DISCUSSION AND ANALYSIS, Continued
September 30, 2018
21
Statement of Net Position:
The following table reflects the condensed Statement of Net Position:
Current and
other assets $ 10,294,831 $ 10,173,913 $ 20,468,744 $ 8,951,066 $ 11,454,164 $ 20,405,230
Capital assets, net 10,512,543 7,261,191 17,773,734 10,389,815 5,006,653 15,396,468
Net pension asset 490,519 47,691 538,210 - - -
Total Assets 21,297,893 17,482,795 38,780,688 19,340,881 16,460,817 35,801,698
Deferred Outflows
of Resources 274,183 26,657 300,840 743,757 86,773 830,530
Other liabilities 360,523 1,035,164 1,395,687 590,920 995,008 1,585,928
Long-term liabilities 5,908,947 6,350,601 12,259,548 4,276,228 6,757,007 11,033,235
Total Liabilities 6,269,470 7,385,765 13,655,235 4,867,148 7,752,015 12,619,163
Deferred Inflows
of Resources 788,873 76,698 865,571 429,920 50,169 480,089
Net Position:
Net investment
in capital assets 6,861,614 2,428,272 9,289,886 9,008,424 4,200,804 13,209,228
Restricted 6,517,749 - 6,517,749 2,054,926 - 2,054,926
Unrestricted 1,134,370 7,618,717 8,753,087 3,724,220 4,544,602 8,268,822
Total Net Position $ 14,513,733 $ 10,046,989 $ 24,560,722 $ 14,787,570 $ 8,745,406 $ 23,532,976
ActivitiesTotal
Governmental Business-Type
ActivitiesActivities Total
2018 2017
Governmental Business-Type
Activities
City of Bellmead, TexasMANAGEMENT’S DISCUSSION AND ANALYSIS, Continued
September 30, 2018
22
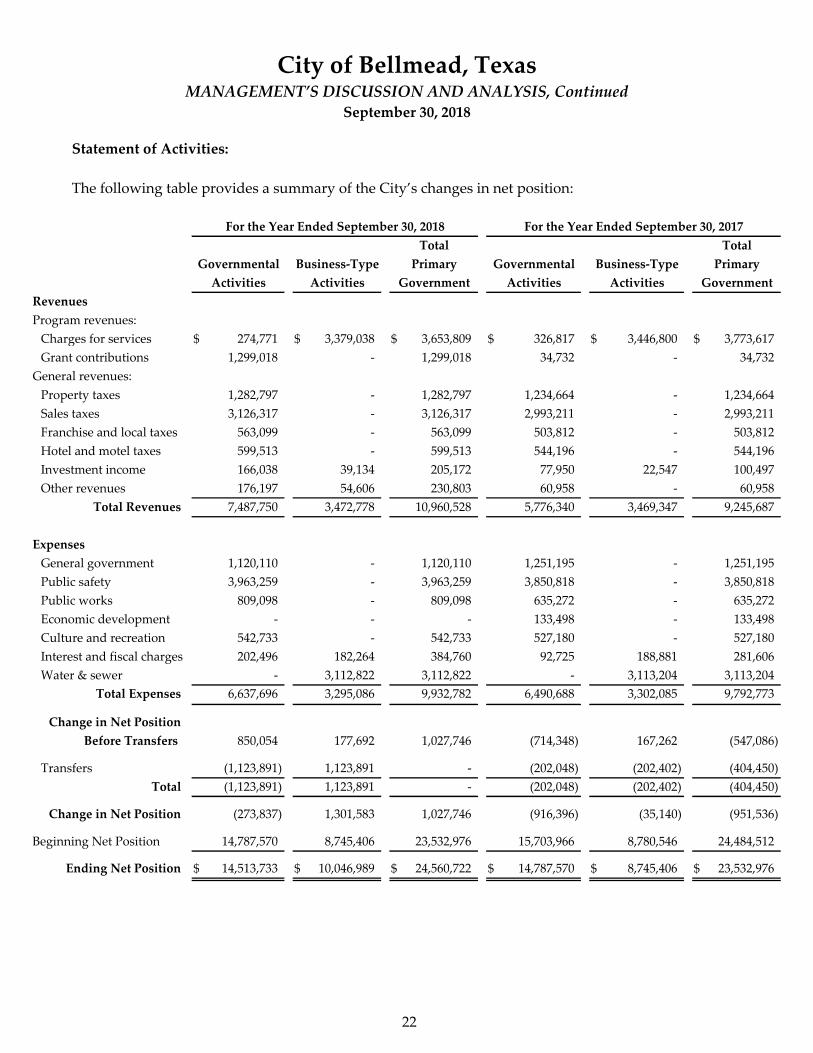
Statement of Activities:
The following table provides a summary of the City’s changes in net position:
Revenues
Program revenues:
Charges for services $ 274,771 $ 3,379,038 $ 3,653,809 $ 326,817 $ 3,446,800 $ 3,773,617
Grant contributions 1,299,018 - 1,299,018 34,732 - 34,732
General revenues:
Property taxes 1,282,797 - 1,282,797 1,234,664 - 1,234,664
Sales taxes 3,126,317 - 3,126,317 2,993,211 - 2,993,211
Franchise and local taxes 563,099 - 563,099 503,812 - 503,812
Hotel and motel taxes 599,513 - 599,513 544,196 - 544,196
Investment income 166,038 39,134 205,172 77,950 22,547 100,497
Other revenues 176,197 54,606 230,803 60,958 - 60,958
Total Revenues 7,487,750 3,472,778 10,960,528 5,776,340 3,469,347 9,245,687
Expenses
General government 1,120,110 - 1,120,110 1,251,195 - 1,251,195
Public safety 3,963,259 - 3,963,259 3,850,818 - 3,850,818
Public works 809,098 - 809,098 635,272 - 635,272
Economic development - - - 133,498 - 133,498
Culture and recreation 542,733 - 542,733 527,180 - 527,180
Interest and fiscal charges 202,496 182,264 384,760 92,725 188,881 281,606
Water & sewer - 3,112,822 3,112,822 - 3,113,204 3,113,204
Total Expenses 6,637,696 3,295,086 9,932,782 6,490,688 3,302,085 9,792,773
Change in Net Position
Before Transfers 850,054 177,692 1,027,746 (714,348) 167,262 (547,086)
Transfers (1,123,891) 1,123,891 - (202,048) (202,402) (404,450)
Total (1,123,891) 1,123,891 - (202,048) (202,402) (404,450)
Change in Net Position (273,837) 1,301,583 1,027,746 (916,396) (35,140) (951,536)
Beginning Net Position 14,787,570 8,745,406 23,532,976 15,703,966 8,780,546 24,484,512
Ending Net Position $ 14,513,733 $ 10,046,989 $ 24,560,722 $ 14,787,570 $ 8,745,406 $ 23,532,976
Governmental
For the Year Ended September 30, 2018
Business-Type
Government
For the Year Ended September 30, 2017
Total
Activities
Business-Type Primary
Total
Primary Governmental
ActivitiesGovernmentActivities Activities

City of Bellmead, TexasMANAGEMENT’S DISCUSSION AND ANALYSIS, Continued
September 30, 2018
23
Graphic presentations of selected data from the summary tables are displayed below to assist in the
analysis of the City’s activities.
For the year ended September 30, 2018, revenues from governmental activities totaled $7,487,750.
Property tax, sales tax and grant contributions are the City’s largest revenue sources. Grant
contributions increased $1,264,286 primarily due to nonrecurring economic development grant revenue
received in the current year. Charges for services decreased by $52,046 or 16% primarily due to more
culture and recreation related service revenues received in the prior year. Franchise and local taxes
increased by $59,287 or 12% primarily due to additional telephone franchise fees received in the current
year. Hotel and motel taxes increased by $55,317 or 10% due to increased tourism to the area over the
course of the fiscal year. Investment income increased by $88,088 primarily due to an increase in
interest-bearing cash accounts. Other revenues increased by $115,239 primarily as a result of
nonrecurring insurance reimbursements received in the current year. All other revenues remained
relatively stable when compared to the previous year.
This graph shows the governmental function expenses of the City:

City of Bellmead, TexasMANAGEMENT’S DISCUSSION AND ANALYSIS, Continued
September 30, 2018
24
For the year ended September 30, 2018, expenses for governmental activities totaled $6,637,696. This
represents an increase of $147,008 or 2% from the prior year. The City’s largest functional expense is
public safety of $3,963,259, which primarily includes operational and administrative costs for the City’s
police and fire suppression activities. General government expenses decreased by $131,085 or 10%
primarily due to the actuarial valuation changes to the City’s net pension obligations. In the prior year,
the City recognized a net pension liability. In the current year, the City has recognized a net pension
asset. Public works increased by $173,826 or 27% primarily due to increased personnel and
maintenance related expenses. Economic development expenses decreased by $133,498 or 100% as a
result of the change in the City’s reporting of the Bellmead EDC. In the prior year, the EDC was a
blended component unit. However, in the current year the City changed its presentation to a discrete
component unit, which is separate from the primary government. Interest and fiscal charges increased
by $109,771 primarily due to the recognition of bond issuance costs in the current year. All other
expenditures remained relatively consistent with the previous year.
Business-type activities are shown comparing operating costs to revenues generated by related
services.
For the year ended September 30, 2018, charges for services by business-type activities totaled
$3,379,038. This represents a slight decrease of $67,762, or 2%, from the previous year. The decrease is
primarily a result of a decline in water and sewer consumption compared to the prior year.
Total expenses increased only $6,999 from the prior year, which is consistent with the prior year.

City of Bellmead, TexasMANAGEMENT’S DISCUSSION AND ANALYSIS, Continued
September 30, 2018
25
FINANCIAL ANALYSIS OF THE CITY’S FUNDS
As noted earlier, fund accounting is used to demonstrate and ensure compliance with finance-related
legal requirements.
Governmental Funds - The focus of the City’s governmental funds is to provide information of near-
term inflows, outflows and balances of spendable resources. Such information is useful in assessing
the City’s financing requirements. In particular, unreserved fund balance may serve as a useful
measure of the City’s net resources available for spending at the end of the year.
As of the end of the year the general fund reflected a total fund balance of $3,723,048, all of which is
unassigned. The general fund decreased by $420,072 due to current year expenditures exceeding
revenues and transfer in.
The capital projects fund reflected an ending balance of $3,852,202, an increase of $1,614,004. This
increase is directly a result of the $1,995,000 in new bond proceeds received in the current year.
The hotel/motel tax fund reflected an ending balance of $1,758,926, an increase of $77,992. This increase
is primarily due to current year tax revenue exceeding expenditures and transfers out.
There was an increase in governmental fund balance of $1,305,886 over the prior year. The increase was
primarily due to the aforementioned bond proceeds received in the current year.
Proprietary Funds - The City’s proprietary funds provide the same type of information found in the
government-wide financial statements, but in more detail.
GENERAL FUND BUDGETARY HIGHLIGHTS
There was a total negative budget variance of $405,026 in the general fund. This is a combination of a
negative revenue variance of $715,845, a positive expenditure variance of $942,112, and a negative
variance of $631,293 in other financing sources and uses. The most significant revenue variances were
for grant and intergovernmental receipts and fines and forfeitures. The most significant expenditure
variances were for general government, public safety and capital outlay. Both the public safety and
public works departments were over budget.
CAPITAL ASSETS
As of the end of the year, the City’s governmental activities funds had invested $10,512,543 in a variety
of capital assets and infrastructure, net of accumulated depreciation. Depreciation is included with the
governmental capital assets as required by GASB Statement No. 34. The City’s business-type activities
funds had invested $7,261,191 in a variety of capital assets and infrastructure, net of accumulated
depreciation.

City of Bellmead, TexasMANAGEMENT’S DISCUSSION AND ANALYSIS, Continued
September 30, 2018
26
Major capital asset events during the current year include the following:
Tiery Road infrastructure investment totaling $1,579,534.
Williams Road remodel investments of $146,966.
Victoria and Michigan street improvements totaling $291,977.
Purchase of public safety equipment for fire and police department totaling $146,893.
Investments in ground and elevated water storage tank rehabilitation of $712,843.
New investments in Parrish pump station of $66,900.
$442,135 in additions to construction in progress for the City’s shared centralized regional
service facilities with the City of Waco, otherwise known as Waco Metropolitan Area Regional
Sewerage System (“WMARSS”).
$1,508,062 in capital assets were transferred from governmental activities to business-type
activities in the current year.
More detailed information about the City’s capital assets is presented in note IV. D to the financial
statements.
LONG-TERM DEBT
At the end of the current year, the City had total bonds outstanding of $11,795,000 and notes payable of
$84,304. During the year, the City had principal payments on bonds and notes payable of $517,416.
During the year, the City had a $1,995,000 bond issuance for the capital projects fund. More detailed
information about the City’s long-term liabilities is presented in note IV. E to the financial statements.
ECONOMIC FACTORS AND NEXT YEAR’S BUDGET
The Mayor and City Council are committed to maintaining and improving the overall wellbeing of the
City of Bellmead and improving services provided to their public citizens. The City is budgeting
conservatively for the upcoming year and planning to maintain similar services.
CONTACTING THE CITY’S FINANCIAL MANAGEMENT
This financial report is designed to provide a general overview of the City of Bellmead’s finances for all
those with an interest in the City’s finances. Questions concerning this report or requests for additional
financial information should be directed to the Office of the City Manager, City of Bellmead, Texas,
3015 Bellmead Drive, Bellmead, Texas 76705.

FINANCIAL STATEMENTS
27

Current assets:Cash and cash equivalents $ 4,049,623 $ 1,182,486 $ 5,232,109
Restricted cash ‐ 2,518,545 2,518,545
Investments 9,254,621 2,192,131 11,446,752
Receivables, net 961,090 305,248 1,266,338
Inventory ‐ 5,000 5,000
Internal balances (3,970,503) 3,970,503 ‐
10,294,831 10,173,913 20,468,744
Capital assets: Non‐depreciable 2,918,159 1,959,635 4,877,794
Net depreciable capital assets 7,594,384 5,301,556 12,895,940
Long‐term receivables ‐ ‐ ‐
Net pension asset 490,519 47,691 538,210
11,003,062 7,308,882 18,311,944
21,297,893 17,482,795 38,780,688
Deferred Outflows of Resources
Pension contributions 232,311 22,586 254,897
OPEB contributions 767 75 842
OPEB (gains) losses 10,411 1,012 11,423
Pension experience vs assumption 30,694 2,984 33,678
Total Deferred Outflows of Resources 274,183 26,657 300,840
See Notes to Financial Statements.
Assets
Governmental
Total Assets
Total Current Assets
TotalActivities
Primary Government
City of Bellmead, TexasSTATEMENT OF NET POSITION (Page 1 of 2)
September 30, 2018
Business‐Type
Activities
28

$ 2,416,788‐
2,698,808
213,181‐
‐
5,328,777
‐
678,883‐
678,883
6,007,660
‐
‐
‐
‐
‐
Component Unit
Bellmead Economic
Development Corportation
29

Liabilities
Current liabilities:Accounts payable andaccrued liabilities $ 346,133 $ 303,467 $ 649,600
Accrued interest payable 14,390 14,755 29,145
Customer deposits ‐ 375,884 375,884
Long‐term debt due within one year 449,449 341,058 790,507
809,972 1,035,164 1,845,136
Noncurrent liabilities:Long‐term debt due in more than one year 5,306,479 6,335,723 11,642,202
OPEB liability 153,019 14,878 167,897
5,459,498 6,350,601 11,810,099
6,269,470 7,385,765 13,655,235
Deferred Inflows of Resources
Pension investment returns 311,866 30,321 342,187
Pension investment experience 477,007 46,377 523,384
788,873 76,698 865,571
Net investment in capital assets 6,861,614 2,428,272 9,289,886
Restricted for:Debt service 275,816 ‐ 275,816
Capital projects 1,950,212 ‐ 1,950,212
Municipal court 61,822 ‐ 61,822
Tourism 1,758,926 ‐ 1,758,926
Streets 2,470,973 ‐ 2,470,973
Economic development ‐ ‐ ‐
Unrestricted 1,134,370 7,618,717 8,753,087
$ 14,513,733 $ 10,046,989 $ 24,560,722
See Notes to Financial Statements.
STATEMENT OF NET POSITION (Page 2 of 2)September 30, 2018
Activities
Business‐Type
City of Bellmead, Texas
Net Position
Total Net Position
Total Liabilities
Total
Deferred Inflows of Resources
Total Current Liabilities
Governmental
Activities
Primary Government
30

39,082‐
‐
‐
39,082
‐
‐
‐
39,082
‐
‐
‐
‐
‐
‐
‐
‐
‐
5,968,578
‐
$ 5,968,578
Development Corportation
Bellmead Economic
Component Unit
31

Capital
Grants and
Contributions
Primary Government
Governmental Activities
General government $ 1,120,110 $ 35,772 $ 288,496 $ ‐
Public safety 3,963,259 238,999 142,889 ‐
Public works 809,098 ‐ 867,633Culture and recreation 542,733 ‐ ‐ ‐
Interest and fiscal charges 202,496 ‐ ‐ ‐
6,637,696 274,771 431,385 867,633
Business‐Type Activities
Water and sewer 3,295,086 3,379,038 ‐ ‐
Total Business‐Type Activities 3,295,086 3,379,038 ‐ ‐
Total Primary Government $ 9,932,782 $ 3,653,809 $ 431,385 867,633
Component Unit
Economic Development Corp. 389,935 ‐ ‐ ‐
$ 389,935 $ ‐ $ ‐ $ ‐
General Revenues:
TaxesProperty taxesSales taxesFranchise and local taxesHotel and motel taxes
Investment incomeOther revenuesInsurance recoveries
Transfers
Change in Net Position
Beginning Net PositionEnding Net Position
See Notes to Financial Statements.
Grants and
Total General Revenues and Transfers
City of Bellmead, TexasSTATEMENT OF ACTIVITIES
Operating
For the Year Ended September 30, 2018
Program Revenues
Charges for
Expenses Contributions
Total Governmental Activities
Functions/Programs Services
32

$ (795,842) $ ‐ $ (795,842) $ ‐
(3,581,371) ‐ (3,581,371) ‐
58,535 ‐ 58,535 ‐
(542,733) ‐ (542,733) ‐
(202,496) ‐ (202,496) ‐
(5,063,907) ‐ (5,063,907) ‐
‐ 83,952 83,952 ‐
‐ 83,952 83,952 ‐
(5,063,907) 83,952 (4,979,955) ‐
(389,935)(389,935)
1,282,797 ‐ 1,282,797 ‐
3,126,317 ‐ 3,126,317 625,253563,099 ‐ 563,099 ‐
599,513 ‐ 599,513 ‐
166,038 39,134 205,172 81,922101,443 54,606 156,049 ‐
74,754 ‐ 74,754 ‐
(1,123,891) 1,123,891 ‐ ‐
4,790,070 1,217,631 6,007,701 707,175
(273,837) 1,301,583 1,027,746 317,240
14,787,570 8,745,406 23,532,976 5,651,338$ 14,513,733 $ 10,046,989 $ 24,560,722 $ 5,968,578
Development CorportationTotal
Business‐Type
Activities
Bellmead Economic
Primary Government
Governmental
Component Unit
Net (Expense) Revenue and Changes in Net Position
Activities
33

Cash and cash equivalents $ 2,223,803 $ 465,399 $ 952,548Investments 1,205,894 7,373,998 674,729
Receivables, net 745,171 24,102 143,112Due from other funds ‐ 1,598 6,948
$ 4,174,868 $ 7,865,097 $ 1,777,337
Liabilities
Accounts payable andaccrued liabilities $ 279,887 $ 40,325 $ 18,411
Due to other funds 38,173 3,972,570 ‐
318,060 4,012,895 18,411
Deferred Inflows of Resources
Unavailable revenueProperty taxes 133,760 ‐ ‐
Total Deferred Inflows of Resources 133,760 ‐ ‐
Restricted for:Court security and technology ‐ ‐ ‐
Tourism ‐ ‐ 1,758,926
Debt service ‐ ‐
Capital projects ‐ 3,852,202 ‐
Streets 2,470,973 ‐ ‐
Unassigned reported in:General fund 1,252,075 ‐ ‐
3,723,048 3,852,202 1,758,926
$ 4,174,868 $ 7,865,097 $ 1,777,337
See Notes to Financial Statements.
City of Bellmead, TexasBALANCE SHEET
GOVERNMENTAL FUNDSSeptember 30, 2018
Capital
Total Liabilities, Deferred Inflows, and Fund Balances
Total Fund Balances
Total Assets
Fund Balances
Projects
Total Liabilities
Assets
General
Hotel/Motel
Tax
34

$ 407,873 $ 4,049,623
‐ 9,254,621
48,705 961,090
35,090 43,636
$ 491,668 $ 14,308,970
$ 7,510 $ 346,133
3,396 4,014,139
10,906 4,360,272
45,114 178,874
45,114 178,874
61,822 61,822
‐ 1,758,926
275,816 275,816
98,010 3,950,212
‐ 2,470,973
‐ 1,252,075
435,648 9,769,824
$ 491,668 $ 14,308,970
Funds
Nonmajor Total
GovernmentalOther
Governmental
35

36

Fund Balances ‐ Total Governmental Funds $ 9,769,824
Adjustments for the Statement of Net Position:
Capital assets used in governmental activities are not current financialresources and, therefore, not reported in the governmental funds.
Capital assets ‐ non‐depreciable 2,918,159Capital assets ‐ net depreciable 7,594,384
Other long‐term assets are not available to pay for current‐periodexpenditures and, therefore, are deferred in the governmental funds.
Property tax receivable 178,874Net pension asset 490,519
Deferred outflows of resources, represent a consumption of net position that applies to a future period(s) and is not recognized as an outflow of resources (expense/ expenditure) until then.
Pension contributions 232,311OPEB contributions 767Pension investment experience (477,007)Pension investment returns (311,866)Pension experience vs assumption 30,694OPEB (gains) losses 10,411
Some liabilities, including bonds payable and deferred charges, are not reported asliabilities in the governmental funds.
Accrued interest (14,390)Compensated absences (249,389)Bond premium (151,539)OPEB liability (153,019)Non‐current liabilities due in one year (225,000)Non‐current liabilities due in more than one year (5,130,000)
Net Position of Governmental Activities $ 14,513,733
See Notes to Financial Statements.
GOVERNMENTAL FUNDSSeptember 30, 2018
City of Bellmead, TexasRECONCILIATION OF THE BALANCE SHEET TO THE STATEMENT OF NET POSITION
37

Revenues
Property tax $ 969,035 $ ‐ $ ‐
Sales tax 3,126,317 ‐ ‐
Franchise and local taxes 547,560 ‐ ‐
Hotel and motel taxes ‐ ‐ 599,513License and permits 35,772 ‐ ‐
Grant and intergovernmental revenue 1,299,018 ‐ ‐
Fines and forfeitures 230,438 ‐ ‐
Investment income 28,838 123,947 11,561Other revenue 44,934 ‐ 56,509
6,281,912 123,947 667,583
Expenditures
Current:General government 1,150,270 ‐ ‐
Public safety 3,830,097 ‐ ‐
Culture and recreation 40,948 ‐ 404,519Public works 981,162 ‐ ‐
Debt service:Principal ‐ ‐ ‐
Interest ‐ ‐ ‐
Bond issuance costs ‐ 90,454 ‐
Capital outlay 1,726,499 126,381 ‐
7,728,976 216,835 404,519
Excess of Revenues Over (Under) Expenditures (1,447,064) (92,888) 263,064
Other Financing Sources (Uses)
Transfers in 952,238 ‐ ‐
Transfers (out) ‐ (383,562) (185,072)
Bond proceeds ‐ 1,995,000 ‐
Premium on bond issuance ‐ 95,454 ‐
Insurance recoveries 74,754 ‐ ‐
1,026,992 1,706,892 (185,072)
(420,072) 1,614,004 77,992
Beginning fund balances 4,143,120 2,238,198 1,680,934$ 3,723,048 $ 3,852,202 $ 1,758,926
See Notes to Financial Statements.
Hotel/Motel
Tax
City of Bellmead, TexasSTATEMENT OF REVENUES, EXPENDITURES, AND CHANGES IN FUND BALANCE
GOVERNMENTAL FUNDS
For the Year Ended September 30, 2018
Capital
ProjectsGeneral
Total Revenues
Ending Fund Balances
Total Other Financing Sources (Uses)
Total Expenditures
Net Change in Fund Balances
38

$ 308,784 $ 1,277,819
‐ 3,126,317
15,539 563,099
‐ 599,513
‐ 35,772
‐ 1,299,018
8,561 238,999
1,692 166,038
‐ 101,443
334,576 7,408,018
25 1,150,295
‐ 3,830,097
‐ 445,467
‐ 981,162
200,000 200,000
101,156 101,156
‐ 90,454
‐ 1,852,880
301,181 8,651,511
33,395 (1,243,493)
567 952,805
‐ (568,634)
‐ 1,995,000
‐ 95,454
‐ 74,754
567 2,549,379
33,962 1,305,886
401,686 8,463,938
$ 435,648 $ 9,769,824
Governmental
Funds
Other
Governmental
TotalNonmajor
39

40

Amounts reported for governmental activities in the statement of activities aredifferent because:
Net changes in fund balances ‐ total governmental funds $ 1,305,886
Governmental funds report capital outlays as expenditures. However, in thestatement of activities the cost of those assets is allocated over their estimateduseful lives and reported as depreciation expense.
Capital outlay 2,271,459Depreciation expense (640,669)Capital assets transferred to proprietary fund (1,508,062)
Revenues in the statement of activities that do not provide current financial resources are not reported as revenues in the funds.
Property tax receivable 4,978
Some expenses reported in the statement of activities do not require the use of current financial resources and, therefore, are not reported as expenditures in governmental funds.
Compensated absences 61,364Accrued interest (14,390)Pension expense 147,542OPEB expense (14,995)
The issuance of long‐term debt (e.g., bonds, leases, certificates of obligation)provides current financial resources to governmental funds, while therepayment of the principal of long‐term debt consumes the current financial resources of governmental funds. Neither transaction, however, has any effect on net position. Also, governmental funds report the effect of issuance
costs, premiums, discounts, and similar items when they are first issued; whereas,these amounts are deferred and amortized in the statement of activities.This amount is the net effect of these differences in the treatment of long‐termdebt and related items.
Bond issuance (1,995,000)Premium on debt (95,454)Amortization of bond premium 3,504Principal payments 200,000
$ (273,837)
See Notes to Financial Statements.
Change in Net Position of Governmental Activities
For the Year Ended September 30, 2018
City of Bellmead, TexasRECONCILIATION OF THE STATEMENT OF REVENUES, EXPENDITURES,
AND CHANGES IN FUND BALANCES OF GOVERNMENTAL FUNDS TO THE
STATEMENT OF ACTIVITIES
41

Current Assets
Cash and cash equivalents $ 1,182,486Restricted cash 2,518,545Investments 2,192,131Receivables, net 305,248Inventory 5,000Due from other funds 3,974,368
10,177,778
Noncurrent Assets
Capital assets:Non‐depreciable 1,959,635Net depreciable capital assets 5,301,556
Net pension asset 47,6917,308,882
17,486,660
Pension contributions 22,586Pension experience vs assumption 2,984OPEB (gains) losses 1,012OPEB contributions 75
Total Deferred Outflows of Resources 26,657
Current Liabilities
Accounts payable and accrued liabilities 303,467Accrued interest 14,755Customer deposits 375,884Due to other funds 3,865Compensated absences ‐ current 13,282Bonds and capital leases payable‐current 327,776
1,039,029
Noncurrent Liabilities
Compensated absences 1,476OPEB liability 14,878Bonds and capital leases payable 6,334,247
7,389,630
Pension earnings 76,698
Net investment in capital assets 2,428,272
Unrestricted 7,618,717
$ 10,046,989
See Notes to Financial Statements.
Total Net Position
Net Position
Total Noncurrent Assets
Total Assets
Liabilities
Total Liabilities
Total Current Liabilities
Assets
Deferred Outflows of Resources
Deferred Inflows of Resources
Total Current Assets
Water
& Sewer
City of Bellmead, TexasSTATEMENT OF NET POSITION
PROPRIETARY FUND
September 30, 2018
42

Operating Revenues
Water sales $ 1,731,569Sewer charges 819,189Sanitation revenue 748,735Water and sewer tap fees 79,545Other 54,606
3,433,644
Operating Expenses
Salaries and benefits 435,278Materials and supplies 949,811Contractual supplies 1,154,018Depreciation 573,715
3,112,822
320,822
Nonoperating Revenues (Expenses)
Interest income 39,134Interest expenses (182,264)
(143,130)
177,692
Transfers in 1,508,062Transfers (out) (384,171)
1,123,891
1,301,583
8,745,406
$ 10,046,989
See Notes to Financial Statements.
City of Bellmead, TexasSTATEMENT OF REVENUES, EXPENSES, AND CHANGES IN FUND NET POSITION
PROPRIETARY FUND
For the Year Ended September 30, 2018
Water
& Sewer
Ending Net Position
Total Operating Revenues
Total Operating Expenses
Change in Net Position
Operating Income (Loss)
Total Nonoperating Revenues (Expenses)
Income (Loss) Before Transfers
Beginning net position
Total Transfers
43

Cash Flows from Operating Activities
Receipts from customers $ 3,467,815
Payments to suppliers (2,095,772)
Payments to employees (452,322)
Payments/receipts for other (56,746)
862,975
Cash Flows from Noncapital Financing Activities
Operating transfers out (384,171)
(384,171)
Cash Flows from Capital and Related Financing Activities
Capital purchases (1,320,191)
Principal paid on debt (317,416)
Interest paid on debt (190,842)
(1,828,449)
Cash Flows from Investing Activities
Purchases of investments, net (38,899)
Interest on investments 39,134
235
(1,349,410)
5,050,441
$ 3,701,031
See Notes to Financial Statements.
Beginning cash and cash equivalents
Net Cash Provided (Used) by Noncapital Financing Activities
Net Cash (Used) by Capital and Related Financing Activities
Ending Cash and Cash Equivalents
Net Increase (Decrease) in Cash and Cash Equivalents
Net Cash Provided by Investing Activities
City of Bellmead, TexasSTATEMENT OF CASH FLOWS
PROPRIETARY FUND (Page 1 of 2)
For the Year Ended September 30, 2018
Net Cash Provided by Operating Activities
& Sewer
Water
44

Reconciliation of Operating Income
to Net Cash Provided by Operating Activities
Operating Income $ 320,822
Adjustments to reconcile operating income to net cash provided:
Depreciation 573,715
Changes in Operating Assets and Liabilities:
(Increase) Decrease in:
Accounts receivable 26,486
Due from/to other funds (56,746)
Deferred outflows of resources ‐ pension 60,096
Deferred outflows of resources ‐ OPEB 20
Deferred inflows of resources ‐ pension 26,529
Increase (Decrease) in:
Accounts payable and accrued liabilities 8,057
Compensated absences (597)
Customer deposits 7,685
OPEB liability 2,450
Net pension asset (105,542)
$ 862,975
Schedule of Non‐Cash Capital and Related Financing Activities
Capital assets transfered from governmental activities $ 1,508,062
See Notes to Financial Statements.
& Sewer
Water
Net Cash Provided by Operating Activities
City of Bellmead, TexasSTATEMENT OF CASH FLOWS
PROPRIETARY FUND (Page 2 of 2)
For the Year Ended September 30, 2018
45

46

City of Bellmead, TexasNOTES TO FINANCIAL STATEMENTS
September 30, 2018
47
I. SUMMARY OF SIGNIFICANT ACCOUNTING POLICIES
A. Description of Government-Wide Financial Statements
The government-wide financial statements (i.e., the statement of net position and the
statement of activities) report information on all of the nonfiduciary activities of the
primary government and its component units. Governmental activities, which normally
are supported by taxes, intergovernmental revenues, and other nonexchange
transactions, are reported separately from business-type activities, which rely to a
significant extent on fees and charges to external customers for support. Likewise, the
primary government is reported separately from certain legally separate component units
for which the primary government is financially accountable.
B. Reporting Entity
The City of Bellmead, Texas (the “City”) is a home-rule municipal corporation
organized and existing under the provisions of the Constitution of the State of Texas.
The City operates under a Council-Manager form of government and provides the
following services: general government, public safety (police and fire), highways and
streets, economic development, and culture and recreation.
The City is an independent political subdivision of the State of Texas governed by an
elected council and a mayor and is considered a primary government. As required by
generally accepted accounting principles, these basic financial statements have been
prepared based on considerations regarding the potential for inclusion of other
entities, organizations, or functions as part of the City's financial reporting entity.
For financial reporting purposes, management has considered all potential component
units. Component units are legally separate organizations for which the elected
officials of the primary government are financially accountable. The decision to include
a potential component unit in the reporting entity was made by applying the criteria
set forth in GAAP. The criteria used are as follows:
Financial Accountability – The primary government is deemed to be financially
accountable if it appoints a voting majority of the organization’s governing body and
(1) it is able to impose its will on that organization or (2) there is a potential for the
organization to provide specific financial benefits or impose specific financial burdens
on the primary government. Additionally, the primary government may be financially
accountable if an organization is fiscally dependent on the primary government and
there is a potential for the organization to provide specific financial benefits or impose
specific financial burdens on the primary government regardless of whether the
organization has a separately elected governing board, a governing board appointed
by a higher level of government or a jointly appointed board.

City of Bellmead, TexasNOTES TO FINANCIAL STATEMENTS, Continued
September 30, 2018
48
Discretely Presented Component Unit
Bellmead Economic Development Corporation (the “EDC”)
The EDC is a legally separate entity responsible for certain economic developments
benefiting all citizens of the government and is financed by a portion of sales tax
revenue. The EDC is governed by a board compromised by City Council members and
citizens of the community. The EDC does not provide services entirely, or almost
entirely to the City, nor does it maintain debt of any type that are repaid using City
resources. Discrete presentation is appropriate because the EDC’s Board is not
substantially the same as the City. Separate financial statements have not been
prepared.
C. Basis of Presentation Government-Wide and Fund Financial Statements
While separate government-wide and fund financial statements are presented, they are
interrelated. The governmental activities column incorporates data from governmental
funds while business-type activities incorporate data from the government’s enterprise
funds. Separate financial statements are provided for governmental funds and the
proprietary funds.
As a general rule, the effect of interfund activity has been eliminated from the
government-wide financial statements. Exceptions to this general rule are payments in
lieu of taxes where the amounts are reasonably equivalent in value to the interfund
services provided and other charges between the government’s water and transit
functions and various other functions of the government. Elimination of these charges
would distort the direct costs and program revenues reported for the various functions
concerned.
The fund financial statements provide information about the government’s funds.
Separate statements for each fund category—governmental and proprietary are
presented. The emphasis of fund financial statements is on major governmental and
enterprise funds, each displayed in a separate column. All remaining governmental
and enterprise funds are aggregated and reported as nonmajor funds. Major individual
governmental and enterprise funds are reported as separate columns in the fund
financial statements.

City of Bellmead, TexasNOTES TO FINANCIAL STATEMENTS, Continued
September 30, 2018
49
The government reports the following major governmental funds:
Governmental Funds
Governmental funds are those funds through which most governmental functions are
typically financed. The City reports the following major governmental funds:
General Fund
The general fund is used to account for all financial transactions not properly
includable in other funds. The principal sources of revenues include local property
taxes, sales and franchise taxes, hotel occupancy taxes, licenses and permits, and
fines and forfeitures. Expenditures include general government, public safety,
public works, economic development, and culture and recreation.
Capital Projects Fund
The capital projects fund is used to account for the acquisition or construction of
capital assets.
Hotel/Motel Tax Fund
The hotel/motel tax fund accounts for the receipts and allocation of the City’s
occupancy tax imposed on the rental of hotel-motel rooms. These funds are used to
promote tourism and related activities within the City.
Proprietary Fund Types
Proprietary funds are used to account for activities that are similar to those often found
in the private sector. All assets, liabilities, equities, revenues, expenses, and transfers
relating to the government’s business activities are accounted for through proprietary
funds. The measurement focus is on determination of net income, financial position,
and cash flows. Proprietary funds distinguish operating revenues and expenses from
non-operating items. Operating revenues include charges for services. Operating
expenses include costs of materials, contracts, personnel, and depreciation. All
revenues and expenses not meeting this definition are reported as non-operating
revenues and expenses. Proprietary fund types follow GAAP prescribed by the
Governmental Accounting Standards Board (GASB) and all financial Accounting
Standards Board’s standards issued prior to November 30, 1989. Subsequent to this
date, the City accounts for its enterprise funds as presented by GASB. The proprietary
fund types used by the City include enterprise funds.

City of Bellmead, TexasNOTES TO FINANCIAL STATEMENTS, Continued
September 30, 2018
50
The government reports the following major enterprise fund:
Water and Sewer Fund
The Water and Sewer Fund accounts for the activities of the water distribution
system, the sewage treatment plant, sewage pumping stations and collection
systems.
During the course of operations the government has activity between funds for various
purposes. Any residual balances outstanding at year end are reported as due from/to
other funds and advances to/from other funds. While these balances are reported in
fund financial statements, certain eliminations are made in the preparation of the
government-wide financial statements. Balances between the funds included in
governmental activities (i.e., the governmental and internal service funds) are
eliminated so that only the net amount is included as internal balances in the
governmental activities column. Similarly, balances between the funds included in
business-type activities (i.e., the enterprise funds) are eliminated so that only the net
amount is included as internal balances in the business-type activities column.
Further, certain activity occurs during the year involving transfers of resources
between funds. In fund financial statements these amounts are reported at gross
amounts as transfers in/out. While reported in fund financial statements, certain
eliminations are made in the preparation of the government-wide financial statements.
Transfers between the funds included in governmental activities are eliminated so that
only the net amount is included as transfers in the governmental activities column.
Similarly, balances between the funds included in business-type activities are
eliminated so that only the net amount is included as transfers in the business-type
activities column.
D. Measurement Focus and Basis of Accounting
The accounting and financial reporting treatment is determined by the applicable
measurement focus and basis of accounting. Measurement focus indicates the type of
resources being measured such as current financial resources or economic resources. The
basis of accounting indicates the timing of transactions or events for recognition in the
financial statements.
The government-wide financial statements are reported using the economic resources
measurement focus and the accrual basis of accounting. Revenues are recorded when
earned and expenses are recorded when a liability is incurred, regardless of the timing
of related cash flows. Property taxes are recognized as revenues in the year for which
they are levied. Grants and similar items are recognized as revenue as soon as all
eligibility requirements imposed by the provider have been met.

City of Bellmead, TexasNOTES TO FINANCIAL STATEMENTS, Continued
September 30, 2018
51
The governmental fund financial statements are reported using the current financial
resources measurement focus and the modified accrual basis of accounting. Revenues are
recognized as soon as they are both measurable and available. Revenues are
considered to be available when they are collectible within the current period or soon
enough thereafter to pay liabilities of the current period. For this purpose, the
government considers revenues to be available if they are collected within 60 days of
the end of the current fiscal period. Expenditures generally are recorded when a
liability is incurred, as under accrual accounting. However, debt service expenditures,
as well as expenditures related to compensated absences, and claims and judgments,
are recorded only when payment is due. General capital asset acquisitions are reported
as expenditures in governmental funds. Issuance of long-term debt and acquisitions
under capital leases are reported as other financing sources.
Property taxes, sales taxes, franchise taxes, licenses, and interest associated with the
current fiscal period are all considered to be susceptible to accrual and so have been
recognized as revenues of the current fiscal period. Entitlements are recorded as
revenues when all eligibility requirements are met, including any time requirements,
and the amount is received during the period or within the availability period for this
revenue source (within 60 days of year end). Expenditure-driven grants are recognized
as revenue when the qualifying expenditures have been incurred and all other
eligibility requirements have been met, and the amount is received during the period
or within the availability period for this revenue source (within 60 days of year end).
All other revenue items are considered to be measurable and available only when cash
is received by the government.
E. Assets, Liabilities, Deferred Outflows/Inflows of Resources and Net Position/Fund
Balance
1. Deposits and Investments
The City’s cash and cash equivalents are considered to be cash on hand, demand
deposits and short term investments with original maturities of three months or less
from the date of acquisition. For the purpose of the statement of cash flows, the
proprietary fund types consider temporary investments with maturity of three months
or less when purchased to be cash equivalents.
In accordance with GASB Statement No. 31, Accounting and Reporting for Certain
Investments and External Investment Pools, the City reports all investments at fair value,
except for “money market investments” and “2a7-like pools.” Money market
investments, which are short-term highly liquid debt instruments that may include
U.S. Treasury and agency obligations, are reported at amortized costs. Investment
positions in external investment pools that are operated in a manner consistent with

City of Bellmead, TexasNOTES TO FINANCIAL STATEMENTS, Continued
September 30, 2018
52
the SEC’s Rule 2a7 of the Investment Company Act of 1940, such as TexPool, are
reported using the pools’ share price.
The City has adopted a written investment policy regarding the investment of its funds
as defined in the Public Funds Investment Act, Chapter 2256, of the Texas
Governmental Code. In summary, the City is authorized to invest in the following:
Direct obligations of the U.S. Government
Fully collateralized certificates of deposit and money market accounts
Statewide investment pools
2. Fair Value
The City has applied Governmental Accounting Standards Board (“GASB”) Statement
No. 72, Fair Value Measurement and Application. GASB Statement No. 72 provides
guidance for determining a fair value measurement for reporting purposes and
applying fair value to certain investments and disclosures related to all fair value
measurements.
3. Receivables and Interfund Transactions
Transactions between funds that are representative of lending/borrowing
arrangements outstanding at the end of the year are referred to as either “interfund
receivables/payables” (i.e., the current portion of interfund loans) or “advances to/from
other funds” (i.e., the non-current portion of interfund loans). All other outstanding
balances between funds are reported as “due to/from other funds” in the fund financial
statements. If the transactions are between the primary government and its
component unit, these receivables and payables are classified as “due to/from
component unit/primary government.” Any residual balances outstanding between
the governmental activities and business-type activities are reported in the
government-wide financial statements as “internal balances.”
Advances between funds are offset by a fund balance reserve account in the applicable
governmental fund to indicate they are not available for appropriation and are not
expendable available financial resources.
All trade receivables are shown net of any allowance for uncollectible amounts.

City of Bellmead, TexasNOTES TO FINANCIAL STATEMENTS, Continued
September 30, 2018
53
4. Property Taxes
Property taxes are levied by October 1 on the assessed value listed as of the prior
January 1 for all real and business personal property in conformity with Subtitle E,
Texas Property Tax Code. Taxes are due on receipt of the tax bill and are delinquent if
not paid before February 1 of the year following the year in which imposed. Penalties
are calculated after February 1 up to the date collected by the government at the rate of
6% for the first month and increased 1% per month up to a total of 12%. Interest is
calculated after February 1 at the rate of 1% per month up to the date collected by the
government. Under state law, property taxes levied on real property constitute a lien
on the real property which cannot be forgiven without specific approval of the State
Legislature. The lien expires at the end of twenty years. Taxes levied on personal
property can be deemed uncollectible by the City.
5. Inventories and Prepaid Items
The costs of governmental fund type inventories are recorded as expenditures when
the related liability is incurred, (i.e., the purchase method). The inventories are valued
at the lower of cost or market using the average cost method. Certain payments to
vendors reflect costs applicable to future accounting periods (prepaid expenditures)
are recognized as expenditures when utilized.
6. Capital Assets
Capital assets, which include property, plant, equipment, and infrastructure assets
(e.g., roads, bridges, sidewalks, and similar items) are reported in the applicable
governmental or business-type activities columns in the government-wide financial
statements. Capital assets are defined by the government, as assets with an initial
individual cost of more than $5,000 and an estimated useful life in excess of one year.
Such assets are recorded at historical cost or estimated historical cost if purchased or
constructed. Donated capital assets are recorded at estimated fair market value at the
date of donation. Major outlays for capital assets and improvements are capitalized as
projects are constructed.
Interest costs incurred in connection with construction of enterprise fund capital assets
are capitalized when the effects of capitalization materially impact the financial
statements. The costs of normal maintenance and repairs that do not add to the value
of the asset or materially extend assets’ lives are not capitalized.

City of Bellmead, TexasNOTES TO FINANCIAL STATEMENTS, Continued
September 30, 2018
54
Property, plant, and equipment of the primary government, as well as the component
units, are depreciated using the straight-line method over the following estimated
useful years.
Asset Description
Estimated
Useful Life
Equipment 3 - 20 years
Infrastructure 40 years
Water and sewer facilities 5 - 30 years
Buildings and improvements 5 - 30 years
7. Deferred Outflows/Inflows of Resources
In addition to assets, the statement of financial position will sometimes report a
separate section for deferred outflows of resources. This separate financial statement
element, deferred outflows of resources, represents a consumption of net position that
applies to a future period(s) and so will not be recognized as an outflow of resources
(expense/ expenditure) until then. An example is a deferred charge on refunding
reported in the government-wide statement of net position. A deferred charge on
refunding results from the difference in the carrying value of refunded debt and its
reacquisition price. This amount is deferred and amortized over the shorter of the life
of the refunded or refunding debt.
In addition to liabilities, the statement of financial position will sometimes report a
separate section for deferred inflows of resources. This separate financial statement
element, deferred inflows of resources, represents an acquisition of net position that
applies to a future period(s) and so will not be recognized as an inflow of resources
(revenue) until that time. The government has only one type of item, which arises only
under a modified accrual basis of accounting, which qualifies for reporting in this
category. Accordingly, the item, unavailable revenue, is reported only in the
governmental funds balance sheet. The governmental funds report unavailable
revenues from property taxes revenue. These amounts are deferred and recognized as
an inflow of resources in the period that the amounts become available.
8. Net Position Flow Assumption
Sometimes the government will fund outlays for a particular purpose from both
restricted (e.g., restricted bond or grant proceeds) and unrestricted resources. In order
to calculate the amounts to report as restricted – net position and unrestricted – net
position in the government-wide and proprietary fund financial statements, a flow
assumption must be made about the order in which the resources are considered to be
applied.

City of Bellmead, TexasNOTES TO FINANCIAL STATEMENTS, Continued
September 30, 2018
55
9. Fund Balance Flow Assumptions
Sometimes the government will fund outlays for a particular purpose from both
restricted and unrestricted resources (the total of committed, assigned, and unassigned
fund balance). In order to calculate the amounts to report as restricted, committed,
assigned, and unassigned fund balance in the governmental fund financial statements
a flow assumption must be made about the order in which the resources are
considered to be applied. It is the government’s policy to consider restricted fund
balance to have been depleted before using any of the components of unrestricted fund
balance. Further, when the components of unrestricted fund balance can be used for
the same purpose, committed fund balance is depleted first, followed by assigned fund
balance. Unassigned fund balance is applied last.
10. Fund Balance Policies
Fund balance of governmental funds is reported in various categories based on the
nature of any limitations requiring the use of resources for specific purposes. The
government itself can establish limitations on the use of resources through either a
commitment (committed fund balance) or an assignment (assigned fund balance).
The committed fund balance classification includes amounts that can be used only for
the specific purposes determined by a formal action of the government’s highest level
of decision-making authority. The governing council is the highest level of decision-
making authority for the government that can, by adoption of an ordinance prior to the
end of the fiscal year, commit fund balance. Once adopted, the limitation imposed by
the ordinance remains in place until a similar action is taken (the adoption of another
ordinance) to remove or revise the limitation.
Amounts in the assigned fund balance classification are intended to be used by the
government for specific purposes but do not meet the criteria to be classified as
committed. The governing body (council) has by resolution authorized the City
Manager to assign fund balance. The Council may also assign fund balance as it does
when appropriating fund balance to cover a gap between estimated revenue and
appropriations in the subsequent year’s appropriated budget. Unlike commitments,
assignments generally only exist temporarily. In other words, an additional action does
not normally have to be taken for the removal of an assignment. Conversely, as
discussed above, an additional action is essential to either remove or revise a
commitment.
11. Compensated Absences
The liability for compensated absences reported in the government-wide and
proprietary fund statements consist of unpaid, accumulated vacation balances. The

City of Bellmead, TexasNOTES TO FINANCIAL STATEMENTS, Continued
September 30, 2018
56
liability has been calculated using the vesting method, in which leave amounts for both
employees who currently are eligible to receive termination payments and other
employees who are expected to become eligible in the future to receive such payments
upon termination are included. Vested or accumulated vacation leave and
compensated leave of government-wide and proprietary funds are recognized as an
expense and liability of those funds as the benefits accrue to employees.
It is the City's policy to liquidate compensated absences with future revenues rather
than with currently available expendable resources. Accordingly, the City's
governmental funds recognize accrued compensated absences when it is paid.
12. Long-Term Obligations
In the government-wide financial statements, long-term debt and other long-term
obligations are reported as liabilities in the applicable governmental activities
statement of net position. The long-term debt consists primarily of bonds payable and
accrued compensated absences.
Long-term debt for governmental funds is not reported as liabilities in the fund
financial statements until due. The debt proceeds are reported as other financing
sources, net of the applicable premium or discount and payments of principal and
interest reported as expenditures. In the governmental fund types, issuance costs, even
if withheld from the actual net proceeds received, are reported as debt service
expenditures. However, claims and judgments paid from governmental funds are
reported as a liability in the fund financial statements only for the portion expected to
be financed from expendable available financial resources.
Long-term debt and other obligations, financed by proprietary funds, are reported as
liabilities in the appropriate funds. For proprietary fund types, bond premiums, and
discounts are deferred and amortized over the life of the bonds using the effective
interest method, if material. Bonds payable are reported net of the applicable bond
premium or discount. Issuance costs are expensed as incurred in accordance with
GASB statement no. 65.
Assets acquired under the terms of capital leases are recorded as liabilities and
capitalized in the government-wide financial statements at the present value of net
minimum lease payments at inception of the lease. In the year of acquisition, capital
lease transactions are recorded as other financing sources and as capital outlay
expenditures in the general fund. Lease payments representing both principal and
interest are recorded as expenditures in the general fund upon payment with an
appropriate reduction of principal recorded in the government-wide financial
statements.

City of Bellmead, TexasNOTES TO FINANCIAL STATEMENTS, Continued
September 30, 2018
57
13. Estimates
The preparation of financial statements, in conformity with generally accepted
accounting principles, requires management to make estimates and assumptions that
affect the reported amounts of assets and liabilities and disclosure of contingent assets
and liabilities at the date of the financial statements and the reported amounts of
revenues and expenditures/expenses during the reporting period. Actual results could
differ from those estimates.
14. Pensions
For purposes of measuring the net pension liability, deferred outflows of resources and
deferred inflows of resources related to pensions, and pension expense, information
about the Fiduciary Net Position of the Texas Municipal Retirement System (TMRS)
and additions to/deductions from TMRS’s Fiduciary Net Position have been
determined on the same basis as they are reported by TMRS. For this purpose, plan
contributions are recognized in the period that compensation is reported for the
employee, which is when contributions are legally due. Benefit payments and refunds
are recognized when due and payable in accordance with the benefit terms.
Investments are reported at fair value.
15. Other Postemployment Benefits (“OPEB”)
The City has implemented GASB Statement No. 75, Accounting and Financial
Reporting for Postemployment Benefits Other Than Pensions. This statement applies
to the individual employers (TMRS cities) in the TMRS Supplemental Death Benefits
plan, with retiree coverage. The TMRS Supplemental Death Benefits Fund (SDBF)
covers both active and retiree benefits with no segregation of assets, and therefore
doesn’t meet the definition of a trust under GASB No. 75 (i.e., no assets are
accumulated for OPEB) and as such the SDBF is considered to be an unfunded OPEB
plan. For purposes of reporting under GASB 75, the retiree portion of the SDBF is not
considered a cost sharing plan and is instead considered a single employer, defined
benefit OPEB plan. The death benefit for active employees provides a lump-sum
payment approximately equal to the employee’s annual salary, calculated based on the
employee’s actual earnings on which TMRS deposits are made, for the 12-month
period preceding the month of death. The death benefit amount for retirees is $7,500.
GASB No. 75 requires the liability of employers and nonemployer contributing entities
to employees for defined benefit OPEB (net OPEB liability) to be measured as the
portion of the present value of projected benefit payments to be provided to current
active and inactive employees that is attributed to those employees’ past periods of
service (total OPEB liability), less the amount of the OPEB plan’s fiduciary net position.

City of Bellmead, TexasNOTES TO FINANCIAL STATEMENTS, Continued
September 30, 2018
58
II. RECONCILIATION OF GOVERNMENT-WIDE AND FUND FINANCIAL STATEMENTS
A. Explanation of certain differences between the governmental fund balance sheet and
the government-wide statement of net position.
The governmental fund balance sheet includes reconciliation between fund balance-total
governmental funds and net position-governmental activities as reported in the
government-wide statement of net position. One element of that reconciliation
explains that long-term liabilities, including bonds, are not due and payable in the
current period and, therefore, are not reported in the funds.
B. Explanation of certain differences between the governmental fund statement of
revenues, expenditures, and changes in fund balances and the government-wide
statement of activities.
The governmental fund statement of revenues, expenditures, and changes in fund
balances includes a reconciliation between net changes in fund balances – total
governmental funds and changes in net position of governmental states that, “the
issuance of long-term debt (e.g., bonds) provides current financial resources to
governmental funds, while the repayment of the principal of long-term debt consumes
the current financial resources of governmental funds. Also, governmental funds
report the effect of premiums, discounts, and similar items when debt is first issued,
whereas these amounts are deferred and amortized in the statement of activities.”
III. STEWARDSHIP, COMPLIANCE, AND ACCOUNTABILITY
Annual budgets are adopted on a basis consistent with generally accepted accounting
principles for all individual governmental and proprietary funds, with the exception of
the capital projects fund.
The appropriated budget is prepared by fund, function, and department. The legal
level of control is the department level. No funds can be transferred or added to a
budgeted item without Council approval. Appropriations lapse at the end of the year.
Budget amendments were only re-classes at the function level and below and there
was no increase in budgeted revenues or expenses by function from amendments.
Expenditures exceeded appropriations in the general fund public safety and public
works departments by $111,720 and $2,487, respectively. Expenditures also exceeded
appropriations in the court security and technology fund for public safety by $25.

City of Bellmead, TexasNOTES TO FINANCIAL STATEMENTS, Continued
September 30, 2018
59
IV. DETAILED NOTES ON ALL FUNDS
A. Deposits and Investments
As of September 30, 2018, the primary government had the following investments:
Investment Type
Certificates of deposit $ 11,446,752 0.09
External investment pools 134,786 0.54
Total value $ 11,581,538
Portfolio weighted average maturity 1.54
Average Maturity
Value (Years)
As of September 30, 2018, the discretely presented component unit had the following
investments:
Investment Type
Certificates of deposit $ 2,698,808 1.19
External investment pools 53,929 0.19
Total value $ 2,752,737
Portfolio weighted average maturity 1.38
Average Maturity
Value (Years)
Interest rate risk – In accordance with its investment policy, the City manages its
exposure to declines in fair values by limiting the weighted average of maturity not to
exceed five years; structuring the investment portfolio so that securities mature to meet
cash requirements for ongoing operations; monitoring credit ratings of portfolio
position to assure compliance with rating requirements imposed by the Public Funds
Investment Act; and invest operating funds primarily in short-term securities or
similar government investment pools.
Credit risk – The City’s investment policy limits investments to obligations of the
United States, State of Texas, or their agencies and instrumentalities with an
investment quality rating of not less than “A” or its equivalent, by a nationally
recognized investment rating firm. Other obligations must be unconditionally
guaranteed (either express or implied) by the full faith and credit of the United States
Government or the issuing U.S. agency and investment pools with an investment
quality not less than AAA or AAA-m, or equivalent, by at least one nationally
recognized rating service.
Custodial credit risk – deposits In the case of deposits, this is the risk that in the event of a
bank failure, the City’s deposits may not be returned to it. State statutes require that

City of Bellmead, TexasNOTES TO FINANCIAL STATEMENTS, Continued
September 30, 2018
60
all deposits in financial institutions be insured or fully collateralized by U.S.
government obligations or its agencies and instrumentalities or direct obligations of
Texas or its agencies and instrumentalities that have a market value of not less than the
principal amount of the deposits. As of September 30, 2018, the market values of
pledged securities and FDIC exceeded bank balances.
Custodial credit risk – investments For an investment, this is the risk that, in the event of
the failure of the counterparty, the City will not be able to recover the value of its
investments or collateral securities that are in the possession of an outside party. The
City’s investment policy requires that it will seek to safekeeping securities at financial
institutions, avoiding physical possession. Further, all trades, where applicable, are
executed by delivery versus payment to ensure that securities are deposited in the
City’s safekeeping account prior to the release of funds.
TexPool
TexPool was established as a trust company with the Treasurer of the State of Texas as
trustee, segregated from all other trustees, investments, and activities of the trust
company. The State Comptroller of Public Accounts exercises oversight responsibility
over TexPool. Oversight includes the ability to significantly influence operations,
designation of management, and accountability for fiscal matters. Additionally, the
State Comptroller has established an advisory board composed of both participants in
TexPool and other persons who do not have a business relationship with TexPool. The
advisory board members review the investment policy and management fee structure.
Finally, Standard & Poor’s rate TexPool AAAm. As a requirement to maintain the
rating, weekly portfolio information must be submitted to Standard & Poor’s, as well
as to the office of the Comptroller of Public Accounts for review. There were no
limitations or restrictions on withdrawals.

City of Bellmead, TexasNOTES TO FINANCIAL STATEMENTS, Continued
September 30, 2018
61
B. Receivables
The following comprise receivable balances of the primary government at year end:
Property taxes $ 178,350 $ - $ - $ 60,151 $ - $ 238,501
Sales tax 520,001 - - - - 520,001
Franchise & local taxes 21,510 - - 3,591 - 25,101
Grants 24,035 - - - - 24,035
Hotel/motel taxes - 140,105 - - - 140,105
Accounts - - - - 383,943 383,943
Other 45,865 3,007 24,102 - 14,967 87,941
Allowance (44,590) - - (15,037) (93,662) (153,289)
$ 745,171 $ 143,112 $ 24,102 $ 48,705 $ 305,248 $ 1,266,338
Water
General Motel Tax
Capital
Projects
Hotel/
Total& Sewer
Nonmajor
Governmental
The following comprise receivable balances of the discretely presented component unit
at year end:
Sales tax $ 104,001 $ 104,001
Lease receivable 781,763 781,763
Other 6,300 6,300
$ 892,064 $ 892,064
TotalEDC
The EDC constructed a building, which is being utilized as a plant and office space by
Texas Machine & Tool International, LLC (“TMI”). The EDC entered into a 10-year
promissory note with TMI to purchase the property in the amount of $1,093,146. The
following summarizes the remaining balance as of September 30, 2018.
Year ending
September 30,
2019 $ 102,880 $ 34,075 $ 136,955
2020 107,602 28,349 135,951
2021 112,545 23,405 135,950
2022 117,715 18,235 135,950
2023 123,123 12,827 135,950
2024 128,779 7,171 135,950
2025 89,119 1,511 90,630
Total $ 781,763 $ 125,573 $ 907,336
Principal TotalInterest
Component Unit
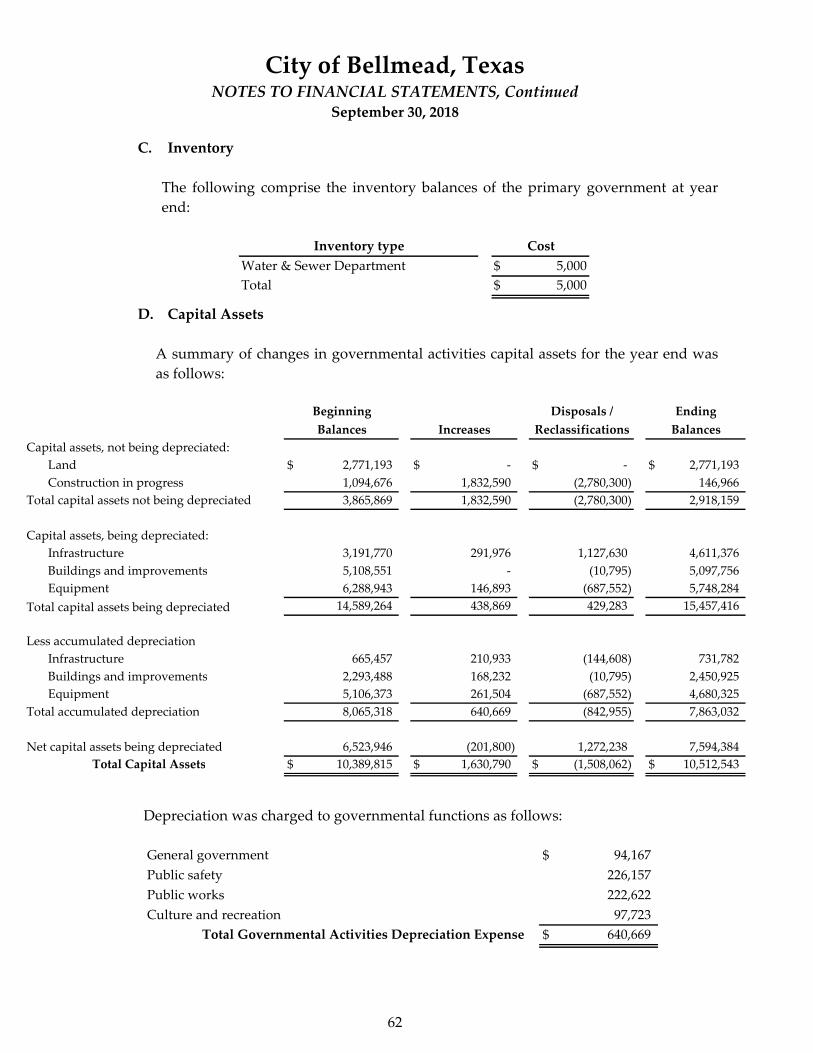
City of Bellmead, TexasNOTES TO FINANCIAL STATEMENTS, Continued
September 30, 2018
62
C. Inventory
The following comprise the inventory balances of the primary government at year
end:
Inventory type
Water & Sewer Department $ 5,000
Total $ 5,000
Cost
D. Capital Assets
A summary of changes in governmental activities capital assets for the year end was
as follows:
Capital assets, not being depreciated:
Land $ 2,771,193 $ - $ - $ 2,771,193
Construction in progress 1,094,676 1,832,590 (2,780,300) 146,966
3,865,869 1,832,590 (2,780,300) 2,918,159
Capital assets, being depreciated:
Infrastructure 3,191,770 291,976 1,127,630 4,611,376
Buildings and improvements 5,108,551 - (10,795) 5,097,756
Equipment 6,288,943 146,893 (687,552) 5,748,284
14,589,264 438,869 429,283 15,457,416
Less accumulated depreciation
Infrastructure 665,457 210,933 (144,608) 731,782
Buildings and improvements 2,293,488 168,232 (10,795) 2,450,925
Equipment 5,106,373 261,504 (687,552) 4,680,325
Total accumulated depreciation 8,065,318 640,669 (842,955) 7,863,032
Net capital assets being depreciated 6,523,946 (201,800) 1,272,238 7,594,384
$ 10,389,815 $ 1,630,790 $ (1,508,062) $ 10,512,543
Beginning Disposals / Ending
Balances Increases
Total Capital Assets
Total capital assets not being depreciated
Total capital assets being depreciated
BalancesReclassifications
Depreciation was charged to governmental functions as follows:
General government $ 94,167
Public safety 226,157
Public works 222,622
Culture and recreation 97,723
$ 640,669 Total Governmental Activities Depreciation Expense

City of Bellmead, TexasNOTES TO FINANCIAL STATEMENTS, Continued
September 30, 2018
63
A summary of changes in business-type activities capital assets for the year end was
as follows:
Capital assets, not being depreciated:
Land $ 38,799 $ - $ - $ 38,799
Construction in progress 687,372 1,233,464 - 1,920,836
Total capital assets not being depreciated 726,171 1,233,464 - 1,959,635
Capital assets, being depreciated:
Buildings and improvements 877,695 - (1,558) 876,137
Water and sewer facilities 9,872,897 26,820 (1,641,414) 8,258,303
WMARSS facilities 2,104,954 15,180 (25,565) 2,094,569
Equipment 1,583,944 44,727 (109,172) 1,519,499
Total capital assets being depreciated 14,439,490 86,727 (1,777,709) 12,748,508
Less accumulated depreciation
Buildings and improvements 207,138 43,262 (1,558) 248,842
Water and sewer facilities 7,793,332 371,934 (3,149,476) 5,015,790
WMARSS facilities 835,904 98,184 (25,565) 908,523
Equipment 1,322,634 60,335 (109,172) 1,273,797
Total accumulated depreciation 10,159,008 573,715 (3,285,771) 7,446,952
Net capital assets being depreciated 4,280,482 (486,988) 1,508,062 5,301,556
$ 5,006,653 $ 746,476 $ 1,508,062 $ 7,261,191 Total Capital Assets
Beginning Disposals / Ending
Balances Increases Reclassifications Balances

City of Bellmead, TexasNOTES TO FINANCIAL STATEMENTS, Continued
September 30, 2018
64
E. Long-term Debt
The following is a summary of changes in the City’s total governmental long-term
liabilities for the year ended. The City uses the debt service fund to liquidate
governmental activities debts.
Governmental Activities:
Bonds, notes and other
payables:
Certificates of Obligation $ 3,560,000 $ 1,995,000 $ (200,000) $ 5,355,000 $ 225,000
Less deferred amounts:
For issuance premiums 59,589 95,454 (3,504) 151,539 -
3,619,589 2,090,454 (203,504) 5,506,539 225,000
Other liabilities:
Compensated absences 310,753 108,195 (169,559) 249,389 224,449
$ 3,930,342 $ 2,198,649 $ (373,063) $ 5,755,928 $ 449,449
Long-term liabilities due in more than one year $ 5,306,479
Business-Type Activities:
Certificates of Obligation $ 6,745,000 $ - $ (305,000) $ 6,440,000 $ 315,000
Less deferred amounts:
For issuance premiums 145,808 - (8,089) 137,719 -
6,890,808 - (313,089) 6,577,719 315,000
Other liabilities:
Notes payable - COW 96,720 - (12,416) 84,304 12,776
Compensated absences 15,355 13,663 (14,260) 14,758 13,282
$ 7,002,883 $ 13,663 $ (339,765) $ 6,676,781 $ 341,058
Long-term liabilities due in more than one year $ 6,335,723
Beginning Amortization/ Ending Due within
Balance Additions Payments Balance
Total Business-Type Activities
One Year
Total Governmental Activities

City of Bellmead, TexasNOTES TO FINANCIAL STATEMENTS, Continued
September 30, 2018
65
Long-term debt at year end was comprised of the following debt issues:
Certificates of Obligation:
$4,000,000 Series 2014 Combination Tax and Limited Pledge Revenue
Certificates of Obligation, due in annual installments of $140,000
to $265,000 with an interest rate of 2.00% to 3.75%, maturing in 2034. $ 3,360,000 $ - $ 3,360,000
$1,995,000 Series 2018 Combination Tax and Limited Pledge Revenue
Certificates of Obligation, due in annual installments of $55,000
to $135,000 with an interest rate of 3.00% to 4.00%, maturing in 2038. 1,995,000 - 1,995,000
$4,500,000 Series 2014 Combination Tax and Limited Pledge Revenue
Certificates of Obligation, due in annual installments of $30,000 to
$33,000 with an interest rate of 2.00% to 3.75%, maturing in 2034. - 4,230,000 4,230,000
$2,400,00 Series 2016 Combination Tax and Limited Pledge Revenue
Certificates of Obligation, due in annual installments of $95,000 to
$150,000 with an interest rate of 2.00% to 3.00%, maturing in 2036. - 2,210,000 2,210,000
$ 5,355,000 $ 6,440,000 $ 11,795,000
Less deferred amounts:
Issuance premium $ 151,539 $ 137,719 $ 289,258
$ 151,539 $ 137,719 $ 289,258
Notes Payable:
Note payable to the City of Waco, Texas, due in annual installments
of $15,621, with an interest rate of 3.65%, maturing in 2024. $ - $ 84,304 $ 84,304
$ - $ 84,304 $ 84,304
Compensated Absences 249,389 14,758 264,147
$ 5,755,928 $ 6,676,781 $ 12,432,709 Total Long-term Liabilities
Total
Business -
Total Certificates of Obligation
Governmental Type
Activities Activities
Total Deferred Amounts
Total Notes Payable
Long-term liabilities applicable to the City’s governmental activities are not due and
payable in the current period and accordingly, are not reported as fund liabilities in
the governmental funds. Interest on long-term debt is not accrued in governmental
funds, but rather is recognized as an expenditure when due.

City of Bellmead, TexasNOTES TO FINANCIAL STATEMENTS, Continued
September 30, 2018
66
The annual requirements to amortize governmental and business-type activities debt
issues outstanding at year ending were as follows:
Certificates of Obligation
Year ending
September 30,
2019 $ 225,000 $ 181,721 $ 406,721
2020 250,000 168,395 418,395
2021 270,000 160,495 430,495
2022 290,000 151,514 441,514
2023 260,000 142,735 402,735
2024 270,000 134,289 404,289
2025 280,000 125,107 405,107
2026 290,000 115,357 405,357
2027 300,000 105,013 405,013
2028 310,000 94,013 404,013
2029 320,000 83,476 403,476
2030 335,000 73,226 408,226
2031 340,000 62,226 402,226
2032 355,000 50,532 405,532
2033 370,000 37,875 407,875
2034 380,000 24,388 404,388
2035 120,000 15,600 135,600
2036 125,000 11,463 136,463
2037 130,000 7,000 137,000
2038 135,000 2,363 137,363
Total $ 5,355,000 $ 1,746,784 $ 7,101,784
Principal TotalInterest
Governmental Activities

City of Bellmead, TexasNOTES TO FINANCIAL STATEMENTS, Continued
September 30, 2018
67
Year ending
September 30,
2019 $ 315,000 $ 181,038 $ 496,038
2020 320,000 174,688 494,688
2021 330,000 167,906 497,906
2022 335,000 160,688 495,688
2023 345,000 153,150 498,150
2024 355,000 145,088 500,088
2025 355,000 135,906 490,906
2026 370,000 125,656 495,656
2027 380,000 114,725 494,725
2028 395,000 103,100 498,100
2029 405,000 90,925 495,925
2030 420,000 78,013 498,013
2031 430,000 64,163 494,163
2032 450,000 49,450 499,450
2033 460,000 33,825 493,825
2034 475,000 17,363 492,363
2035 150,000 6,750 156,750
2036 150,000 2,250 152,250
Total $ 6,440,000 $ 1,804,681 $ 8,244,681
Business-Type Activities
Principal Interest Total
General obligation bonds are direct obligations of the City for which its full faith and
credit are pledged. Repayment of general obligation bonds are from taxes levied on
all taxable property located within the City. The City is not obligated in any manner
for special assessment debt.
Notes Payable- COW
Year ending
September 30,
2019 $ 12,776 $ 2,845 $ 15,621
2020 13,283 2,369 15,653
2021 13,777 1,875 15,653
2022 14,257 1,363 15,621
2023 14,881 831 15,713
2024 15,329 280 15,609
Total $ 84,304 $ 9,564 $ 93,868
Business-Type Activities
Principal Interest Total
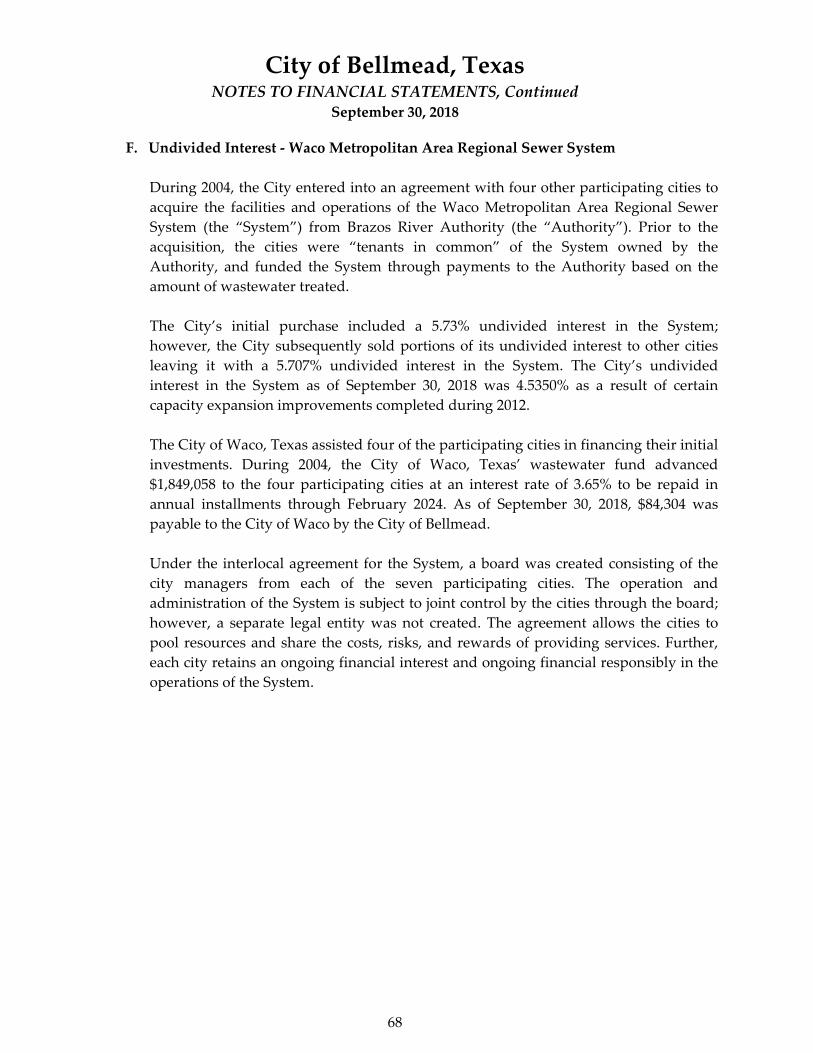
City of Bellmead, TexasNOTES TO FINANCIAL STATEMENTS, Continued
September 30, 2018
68
F. Undivided Interest - Waco Metropolitan Area Regional Sewer System
During 2004, the City entered into an agreement with four other participating cities to
acquire the facilities and operations of the Waco Metropolitan Area Regional Sewer
System (the “System”) from Brazos River Authority (the “Authority”). Prior to the
acquisition, the cities were “tenants in common” of the System owned by the
Authority, and funded the System through payments to the Authority based on the
amount of wastewater treated.
The City’s initial purchase included a 5.73% undivided interest in the System;
however, the City subsequently sold portions of its undivided interest to other cities
leaving it with a 5.707% undivided interest in the System. The City’s undivided
interest in the System as of September 30, 2018 was 4.5350% as a result of certain
capacity expansion improvements completed during 2012.
The City of Waco, Texas assisted four of the participating cities in financing their initial
investments. During 2004, the City of Waco, Texas’ wastewater fund advanced
$1,849,058 to the four participating cities at an interest rate of 3.65% to be repaid in
annual installments through February 2024. As of September 30, 2018, $84,304 was
payable to the City of Waco by the City of Bellmead.
Under the interlocal agreement for the System, a board was created consisting of the
city managers from each of the seven participating cities. The operation and
administration of the System is subject to joint control by the cities through the board;
however, a separate legal entity was not created. The agreement allows the cities to
pool resources and share the costs, risks, and rewards of providing services. Further,
each city retains an ongoing financial interest and ongoing financial responsibly in the
operations of the System.

City of Bellmead, TexasNOTES TO FINANCIAL STATEMENTS, Continued
September 30, 2018
69
The City was reported its share of assets, liabilities, net position, revenues, and
expenses that are associated with this joint activity in its water and sewer fund as
follows:
Current assets $ 2,422,772
Capital assets 1,863,452
Long-term liabilities (84,304)
Net position $ 4,201,920
Operating expenses (406,469)
Operating revenues 52,365
Income before contributions and transfers (354,104)
Capital contributions and transfers 2,634,461
Change in net position $ 2,280,357
G. Interfund Transactions
Amounts transferred between funds relate to amounts collected, various capital
expenditures, annual funding, and debt payments.
Transfer out:
Capital projects $ 383,562 $ - $ - $ 383,562
Hotel/motel tax 185,072 - - 185,072
Water and sewer 383,604 567 - 384,171
Governmental activities - - 1,508,062 * 1,508,062
$ 952,238 $ 567 $ 1,508,062 $ 2,460,867
General Total
Transfer In
Water
and Sewer
Nonmajor
Governmental
* Represents transfer of capital assets.

City of Bellmead, TexasNOTES TO FINANCIAL STATEMENTS, Continued
September 30, 2018
70
The compositions of interfund due to/from balances as of the year ended September 30, 2018
were as follows:
Due To (Receivable Fund) Due From (Payable Fund)
Capital Projects Nonmajor $ 1,598
Hotel/Motel Tax General 6,948
Nonmajor General 31,225
Nonmajor Water Sewer 3,865
Water Sewer Nonmajor 1,798
Water Sewer Capital Projects 3,972,570
$ 4,018,004
Amount
Interfund balances resulted from the timing difference between the dates that (1) interfund
goods and services are provided or reimbursable expenditures occur, (2) transactions are
recorded in the accounting system, and (3) payments between funds are made. All balances
are expected to be paid in the subsequent year.
H. Fund Equity
The City records fund balance restrictions on the fund level to indicate that a portion of the
fund balance is legally restricted for a specific future use or to indicate that a portion of the
fund balance is not available for expenditures.
The following is a list of fund balances restricted/committed by the City:
Municipal court $ 61,822 *
Tourism 1,758,926 *
Debt service 275,816
Capital projects 3,950,212
Streets 2,470,973 *
$ 8,517,749
Restricted
* Represents restriction by enabling legislation.

City of Bellmead, TexasNOTES TO FINANCIAL STATEMENTS, Continued
September 30, 2018
71
V. OTHER INFORMATION
A. Risk Management
The City is exposed to various risks of loss related to torts; theft of, damage to and
destruction of assets, errors and omissions; and natural disasters for which the City
participates along with 2,800 other entities in the Texas Municipal League’s
Intergovernmental Risk Pools. The Pool purchases commercial insurance at group
rates for participants in the Pool. The City has no additional risk or responsibility to
the Pool outside of the payment of insurance premiums. The City has not significantly
reduced insurance coverage or had settlements which exceeded coverage amounts for
the past three years.
B. Contingent Liabilities
Amounts received or receivable from granting agencies are subject to audit and
adjustment by grantor agencies, principally the federal government. Any disallowed
claims, including amounts already collected, may constitute a liability of the applicable
funds. The amounts of expenditures which may be disallowed by the grantor cannot
be determined at this time although the City expects such amounts, if any, to be
immaterial.
Liabilities are reported when it is probable that a loss has occurred and the amount of
the loss can be reasonably estimated. Liabilities include an amount for claims that have
been incurred but not reported. Claim liabilities are calculated considering the effects
of inflation, recent claim settlement trends, including frequency and amount of
payouts, and other economic and social factors.
C. Arbitrage
The Tax Reform Act of 1986 instituted certain arbitrage consisting of complex
regulations with respect to issuance of tax-exempt bonds after August 31, 1986.
Arbitrage regulations deal with the investment of tax-exempt bond proceeds at an
interest yield greater than the interest yield paid to bondholders. Generally, all
interest paid to bondholders can be retroactively rendered taxable if applicable rebates
are not reported and paid to the Internal Revenue Service at least every five years for
applicable bond issues. Accordingly, there is the risk that if such calculations are not
performed correctly, a substantial liability to the City could result. The City does
anticipate that it will have an arbitrage liability and performs annual calculations to
estimate this potential liability. The City will also engage an arbitrage consultant to
perform the calculations in accordance with Internal Revenue Service’s rules and
regulations if indicated.

City of Bellmead, TexasNOTES TO FINANCIAL STATEMENTS, Continued
September 30, 2018
72
D. Defined Benefit Pension Plans
1. Plan Description
The City of Bellmead, Texas participates as one of 883 plans in the nontraditional, joint
contributory, hybrid defined benefit pension plan administered by the Texas
Municipal Retirement System (TMRS). TMRS is an agency created by the State of Texas
and administered in accordance with the TMRS Act, Subtitle G, Title 8, Texas
Government Code (the TMRS Act) as an agent multiple-employer retirement system
for municipal employees in the State of Texas. The TMRS Act places the general
administration and management of the System with a six-member Board of Trustees.
Although the Governor, with the advice and consent of the Senate, appoints the Board,
TMRS is not fiscally dependent on the State of Texas. TMRS’s defined benefit pension
plan is a tax-qualified plan under Section 401 (a) of the Internal Revenue Code. TMRS
issues a publicly available comprehensive annual financial report (CAFR) that can be
obtained at www.tmrs.com.
All eligible employees of the city are required to participate in TMRS.
2. Benefits Provided
TMRS provides retirement, disability, and death benefits. Benefit provisions are
adopted by the governing body of the city, within the options available in the state
statutes governing TMRS.
At retirement, the benefit is calculated as if the sum of the employee’s contributions,
with interest, and the city-financed monetary credits with interest were used to
purchase an annuity. Members may choose to receive their retirement benefit in one of
seven payments options. Members may also choose to receive a portion of their benefit
as a Partial Lump Sum Distribution in an amount equal to 12, 24, or 36 monthly
payments, which cannot exceed 75% of the member’s deposits and interest.

City of Bellmead, TexasNOTES TO FINANCIAL STATEMENTS, Continued
September 30, 2018
73
The plan provisions are adopted by the governing body of the City, within the options
available in the state statutes governing TMRS. Plan provisions for the City were as
follows:
Plan Year 2017 Plan Year 2016
Employee deposit rate 6.0% 6.0%
Matching ratio (city to
employee)
2 to 1 2 to 1
Years required for vesting 5 5
Service retirement eligibility
(expressed as age / years of
service)
60/5, 0/25 60/5, 0/25
Updated service credit 100% Repeating Transfers 100% Repeating Transfers
Annuity increase (to retirees) 70% of CPI, Repeating 70% of CPI, Repeating
Employees covered by benefit terms
At the December 31, 2017 valuation and measurement date, the following employees
were covered by the benefit terms:
Inactive employees or beneficiaries currently receiving benefits 29
Inactive employees entitled to but not yet receiving benefits 59
Active employees 77
Total 165
3. Contributions
The contribution rates for employees in TMRS are either 5%, 6%, or 7% of employee
gross earnings, and the city matching percentages are either 100%, 150%, or 200%, both
as adopted by the governing body of the City. Under the state law governing TMRS,
the contribution rate for each city is determined annually by the actuary, using the
Entry Age Normal (EAN) actuarial cost method. The actuarially determined rate is the
estimated amount necessary to finance the cost of benefits earned by employees during
the year, with an additional amount to finance any unfunded accrued liability.
Employees for the City of Bellmead were required to contribute 6% of their annual
gross earnings during the fiscal year. The contribution rates for the City of Bellmead
were 8.99% and 9.09% in calendar years 2017 and 2018, respectively. The City’s
contributions to TMRS for the year ended September 30, 2018, were $335,268, and were
equal to the required contributions.

City of Bellmead, TexasNOTES TO FINANCIAL STATEMENTS, Continued
September 30, 2018
74
4. Net Pension Liability (Asset)
The City’s Net Pension Liability (Asset) was measured as of December 31, 2017, and
the Total Pension Liability (TPL) used to calculate the Net Pension Liability (Asset)
was determined by an actuarial valuation as of that date.
Actuarial assumptions:
The Total Pension Liability in the December 31, 2017 actuarial valuation was
determined using the following actuarial assumptions:
Inflation 2.5% per year
Overall payroll growth 3.0% per year
Investment Rate of Return 6.75%, net of pension plan investment expense,
including inflation
Salary increases were based on a service-related table. Mortality rates for active
members, retirees, and beneficiaries were based on the gender-distinct RP2000
Combined Healthy Mortality Tables with Blue Collar Adjustment, with male rates
multiplied by 109% and female rates multiplied by 103%.The rates are projected on a
fully generational basis by scale BB to account for future mortality improvements. For
disabled annuitants, the gender-distinct RP2000 Combined Healthy Mortality Tables
with Blue Collar Adjustment are used with males rates multiplied by 109% and female
rates multiplied by 103% with a 3-year set-forward for both males and females. In
addition, a 3% minimum mortality rate is applied to reflect the impairment for
younger members who become disabled. The rates are projected on a fully
generational basis by scale BB to account for future mortality improvements subject to
the 3% floor.
The actuarial assumptions were developed primarily from the actuarial investigation
of the experience of TMRS over the four year period from December 31, 2010 to
December 31, 2014. They were adopted in 2015 and first used in the December 31, 2015
actuarial valuation. The post-retirement mortality assumption for healthy annuitants
and Annuity Purchase Rate (APRs) are based on the Mortality Experience
Investigation Study covering 2009 through 2011 dated December 31, 2013. In
conjunction with these changes first used in the December 31, 2013 valuation, the
System adopted the Entry Age Normal actuarial cost method and a one-time change to
the amortization policy. Plan assets are managed on a total return basis with an
emphasis on both capital appreciation as well as the production of income, in order to
satisfy the short-term and long-term funding needs of TMRS.
The long-term expected rate of return on pension plan investments was determined
using a building-block method in which best estimate ranges of expected future real

City of Bellmead, TexasNOTES TO FINANCIAL STATEMENTS, Continued
September 30, 2018
75
rates of return (expected returns, net of pension plan investment expense and inflation)
are developed for each major asset class. These ranges are combined to produce the
long-term expected rate of return by weighting the expected future real rates of return
by the target asset allocation percentage and by adding expected inflation. In
determining their best estimate of a recommended investment return assumption
under the various alternative asset allocation portfolios, GRS focused on the area
between (1) arithmetic mean (aggressive) without an adjustment for time
(conservative) and (2) the geometric mean (conservative) with an adjustment for time
(aggressive). The target allocation and best estimates of real rates of return for each
major asset class in fiscal year 2018 are summarized in the following table:
Asset Class Target Allocation Long-Term Expected Real
Rate of Return
(Arithmetic)
Domestic Equity 17.5% 4.55%
International Equity 17.5% 6.35%
Core Fixed Income 10.0% 1.00%
Non-Core Fixed Income 20.0% 3.90%
Real Return 10.0% 3.80%
Real Estate 10.0% 4.50%
Absolute Return 10.0% 3.75%
Private Equity 5.0% 7.50%
Total 100.0%
Discount Rate:
The discount rate used to measure the Total Pension Liability was 6.75%. The
projection of cash flows used to determine the discount rate assumed that employee
and employer contributions will be made at the rates specified in statute. Based on that
assumption, the pension plan’s Fiduciary Net Position was projected to be available to
make all projected future benefit payments of current active and inactive employees.
Therefore, the long-term expected rate of return on pension plan investments was
applied to all periods of projected benefit payments to determine the Total Pension
Liability.

City of Bellmead, TexasNOTES TO FINANCIAL STATEMENTS, Continued
September 30, 2018
76
Changes in the Net Pension Liability (Asset):
Total Pension
Liability (a)
Plan Fiduciary Net
Position (b)
Net Pension Liability
(Asset) (a) – (b)
Balance at 12/31/16 $ 12,485,446 $ 11,931,846 $ 553,600
Changes for the year:
Service Cost 521,330 - 521,330
Interest (on the Total Pension Liab.) 842,174 - 842,174
Difference between expected and
actual experience (273,905) - (273,905)
Contributions – employer - 321,892 (321,892)
Contributions – employee - 214,834 (214,834)
Net investment income - 1,653,688 (1,653,688)
Benefit payments, including
refunds of emp. contributions (538,906) (538,906) -
Administrative expense - (8,570) 8,570
Other changes - (435) 435
Net changes 550,693 1,642,503 (1,091,810)
Balance at 12/31/17 $ 13,036,139 $ 13,574,349 $ (538,210)
Sensitivity of the net pension liability (asset) to changes in the discount rate
The following presents the net pension liability of the City, calculated using the
discount rate of 6.75%, as well as what the City’s net pension liability would be if it
were calculated using a discount rate that is 1-percentage-point lower (5.75%) or 1-
percentage-point higher (7.75%) than the current rate:
1% Decrease Current Single Rate 1% Increase
5.75% Assumption 6.75% 7.75%
$ 1,415,988 $ (538,210) $ (2,119,457)

City of Bellmead, TexasNOTES TO FINANCIAL STATEMENTS, Continued
September 30, 2018
77
Pension Plan Fiduciary Net Position:
Detailed information about the pension plan’s Fiduciary Net Position is available in a
separately-issued TMRS financial report. That report may be obtained on the internet
at www.tmrs.com.
5. Pension Expense and Deferred Outflows of Resources Related to Pensions
For the year ended September 30, 2018, the City recognized pension expense of
$170,107.
At September 30, 2018, the City reported deferred outflows of resources related to
pensions from the following sources:
Difference between projected and
investment earnings $ - $ 523,384
Changes in actuarial assumptions 33,678 -
Differences between expected and actual
economic experience - 342,187
Contributions subsequent to the
measurement date 254,897 -
Total $ 288,575 $ 865,571
Deferred Outflows
of Resources
Deferred
(Inflows) of Resources
The City reported $254,897 as deferred outflows of resources related to pensions
resulting from contributions subsequent to the measurement date that will be
recognized as a reduction of the net pension liability for the year ending September 30,
2019. Other amounts reported as deferred outflows of resources related to pensions
will be recognized in pension expense as follows:
Year ended December 31:
2018 $ (189,593)
2019 (192,190)
2020 (261,937)
2021 (188,173)
2022 -
Thereafter -
$ (831,893)

City of Bellmead, TexasNOTES TO FINANCIAL STATEMENTS, Continued
September 30, 2018
78
Other Postemployment Benefits
The City also participates in the cost sharing multiple-employer defined benefit group-
term life insurance plan operated by the Texas Municipal Retirement System (TMRS)
known as the Supplemental Death Benefits Fund (SDBF). The City elected, by
ordinance, to provide group-term life insurance coverage to both current and retired
employees. The City may terminate coverage under and discontinue participation in
the SDBF by adopting an ordinance before November 1 of any year to be effective the
following January 1.
The death benefit for active employees provides a lump-sum payment approximately
equal to the employee’s annual salary (calculated based on the employee’s actual
earnings, for the 12-month period preceding the month of death); retired employees
are insured for $7,500; this coverage is an “other postemployment benefit,” or OPEB.
The City contributes to the SDBF at a contractually required rate as determined by an
annual actuarial valuation. The rate is equal to the cost of providing one-year term life
insurance. The funding policy for the SDBF program is to assure that adequate
resources are available to meet all death benefit payments for the upcoming year; the
intent is not to pre-fund retiree term life insurance during employees’ entire careers.
Employees covered by benefit terms
At the December 31, 2017 valuation and measurement date, the following employees
were covered by the benefit terms:
Inactive employees or beneficiaries currently receiving benefits 25
Inactive employees entitled to but not yet receiving benefits 11
Active employees 77
Total 113
The City’s retiree contribution rates to the TMRS SDBF for the years ended 2018, 2017
and 2016 are as follows:
Plan/
Calendar Year
Annual
Required
Contribution
(Rate)
Actual
Contribution
Made
(Rate)
Percentage of
ARC
Contributed
2018 0.03% 0.03% 100.0%
2017 0.04% 0.04% 100.0%
2016 0.04% 0.04% 100.0%

City of Bellmead, TexasNOTES TO FINANCIAL STATEMENTS, Continued
September 30, 2018
79
The City’s contributions to the TMRS SDBF for the years ended 2018, 2017, and 2016
were $1,199, $1,056, and $1,026, respectively, which equaled the required contributions
each year.
Total OPEB Liability
The City’s Postemployment Benefits Other Than Pensions Liability (OPEB) was
measured as of December 31, 2017, and the Total OPEB Liability was determined by an
actuarial valuation as of that date.
Actuarial assumptions:
The Total OPEB Liability in the December 31, 2017 actuarial valuation was determined
using the following actuarial assumptions:
Inflation 2.5% per year
Overall payroll growth 3.5% to 10.5%, including inflation per year
Discount rate 3.31%
Retirees’ share of benefit-related costs $0
Administrative expenses All administrative expenses are paid through
the Pension Trust and accounted for under
reporting requirements under GASB
Statement No. 68
Salary increases were based on a service-related table. Mortality rates for active
members, retirees, and beneficiaries were based on the gender-distinct RP2000
Combined Healthy Mortality Tables with Blue Collar Adjustment, with male rates
multiplied by 109% and female rates multiplied by 103%. The rates are projected on a
fully generational basis by scale BB to account for future mortality improvements. For
disabled annuitants, the gender-distinct RP2000 Combined Healthy Mortality Tables
with Blue Collar Adjustment are used with males rates multiplied by 109% and female
rates multiplied by 103% with a 3-year set-forward for both males and females. In
addition, a 3% minimum mortality rate is applied to reflect the impairment for
younger members who become disabled. The rates are projected on a fully
generational basis by scale BB to account for future mortality improvements subject to
the 3% floor.
Discount Rate:
The discount rate used to measure the Total OPEB Liability was 3.31%. The discount
rate was based on the Fidelity Index’s “20-Year Municipal GO AA Index” rate as of
December 31, 2017.

City of Bellmead, TexasNOTES TO FINANCIAL STATEMENTS, Continued
September 30, 2018
80
Sensitivity of the Total OPEB Liability to Changes in the Discount Rate
The following presents the total OPEB liability of the City, calculated using the
discount rate of 3.31%, as well as what the City’s total OPEB liability (asset) would be if
it were calculated using a discount rate that is 1-percentage-point lower (2.31%) or 1-
percentage-point higher (4.31%) than the current rate:
$ 203,271 $ 167,897 $ 140,575
1% Decrease
(2.31%)
Current Single Rate
Assumption 3.31%
1% Increase
(4.31%)
Changes in the Total OPEB Liability:
Total OPEB
Liability
Balance at 12/31/16 $ 140,253
Changes for the year:
Service Cost 10,026
Interest 5,464
Changes of assumptions 13,586
Benefit payments (1,432)
Net changes 27,644
Balance at 12/31/17 $ 167,897
Pension Expense and Deferred Outflows of Resources and Deferred Inflows of
Resources Related to Pensions
For the year ended September 30, 2018, the City recognized OPEB expense of $17,653.
At September 30, 2018, the City reported deferred outflows of resources and deferred
inflows of resources related to the OPEB liability from the following sources:
Differences between expected and
actual economic experience$ 11,423
Contributions subsequent to
measurement date 842
Total $ 12,265
Deferred Outflows
of Resources

City of Bellmead, TexasNOTES TO FINANCIAL STATEMENTS, Continued
September 30, 2018
81
The City reported $842 as deferred outflows of resources related to pensions resulting
from contributions subsequent to the measurement date that will be recognized as a
reduction of the net pension liability for the year ending September 30, 2019.
Other amounts reported as deferred outflows of resources related to OPEB will be
recognized in pension expense as follows:
Year ended December 31:
2018 $ 2,163
2019 2,163
2020 2,163
2021 2,163
2022 2,163
Thereafter 608
$ 11,423
E. Restatement
The City restated the beginning net position of governmental activities and business-
type activities, and the beginning fund balances of three governmental funds due to
the implementation of GASB 75, accounting errors related to accrued receivables, and
change in reporting of the cable PEG fund. In addition, the City changed in the
presentation of the City’s component unit to be discretely presented rather than
blended with governmental activities. In addition, the component unit was previously
presented as two component units (EDC A and EDC B); however, EDC A was
dissolved in prior years and should have only been presented as one component unit.
The City has restated net position and fund balance as follows:
Prior year ending net position/
fund balance as reported $ 4,200,548 $ - $ 1,545,094 $ 1,342,086 $ 3,429,132
Impact of implementation of GASB 75 - - - - -
Correction to accrued receivables 20,883 4,160 135,840 - -
Change in reporting of Cable PEG fund (78,311) 78,311 - - -
Discrete presentation of component units - - - (1,342,086) (3,429,132)
$ 4,143,120 $ 82,471 $ 1,680,934 $ - $ -
Bellmead
EDC A
Bellmead
EDC B
Governmental Funds
Hotel/
Motel Tax
Restated beginning net position/fund balance
General
Fund
Cable
PEG

City of Bellmead, TexasNOTES TO FINANCIAL STATEMENTS, Continued
September 30, 2018
82
Prior year ending net position $ 22,185,227 $ -
Impact of implementation of GASB 75 (126,846) -
Correction to accrued receivables 160,883 -
Correction of capital assets (1,730,336) -
Change in reporting of receivables (880,120) 880,120
Correction to deferred receivables (50,020) -
Discrete presentation of component units (4,771,218) 4,771,218
$ 14,787,570 $ 5,651,338 Restated beginning net position
Governmental
Activities Bellmead EDC
Discrete Component Unit
Prior year ending net position $ 8,757,739 $ 3,429,132
Impact of implementation of GASB 75 (12,333) (12,333)
$ 8,745,406 $ 3,416,799 Restated beginning net position
Activities Water & Sewer
Business-Type Proprietary Fund
F. Subsequent Events
There were no material subsequent events through March 25, 2019, the date the
financial statements were available to be issued.

REQUIRED SUPPLEMENTARY INFORMATION
83

Revenues
Property tax $ 958,000 $ 969,035 $ 11,035
Sales tax 2,950,000 3,126,317 176,317
Franchise and local taxes 563,000 547,560 (15,440)
License and permits 39,200 35,772 (3,428)
Grant and intergovernmental revenue 2,054,226 1,299,018 (755,208)
Fines and forfeitures 322,000 230,438 (91,562)
Investment income 18,300 28,838 10,538
Other revenue 93,031 44,934 (48,097)
6,997,757 6,281,912 (715,845)
Expenditures
Current:General government 1,182,923 1,150,270 32,653
Public safety 3,718,377 3,830,097 (111,720) *Culture and recreation 76,828 40,948 35,880
Public works 978,675 981,162 (2,487) *Capital outlay 2,714,285 1,726,499 987,786
8,671,088 7,728,976 942,112
Revenues Over (Under) Expenditures $ (1,673,331) $ (1,447,064) $ 226,267
Transfers in $ 1,658,285 $ 952,238 $ (706,047)
Insurance recoveries ‐ 74,754 74,7541,658,285 1,026,992 (631,293)
Net Change in Fund Balance $ (15,046) (420,072) $ (405,026)
Beginning fund balance 4,143,120$ 3,723,048
Notes to Required Supplementary Information 1. Annual budgets are adopted on a basis consistent with generally accepted accounting principles (GAAP).
* Expenditures exceeded appropriations at the legal level on control.
Ending Fund Balance
Original &
Final Budget
Total Expenditures
Total Other Financing Sources (Uses)
Other Financing Sources (Uses)
Actual Final Budget
Total Revenues
Variance with
City of Bellmead, TexasSCHEDULE OF REVENUES, EXPENDITURES, AND CHANGES
IN FUND BALANCE ‐ BUDGET AND ACTUAL‐ GENERAL FUND
For the Year Ended September 30, 2018
84
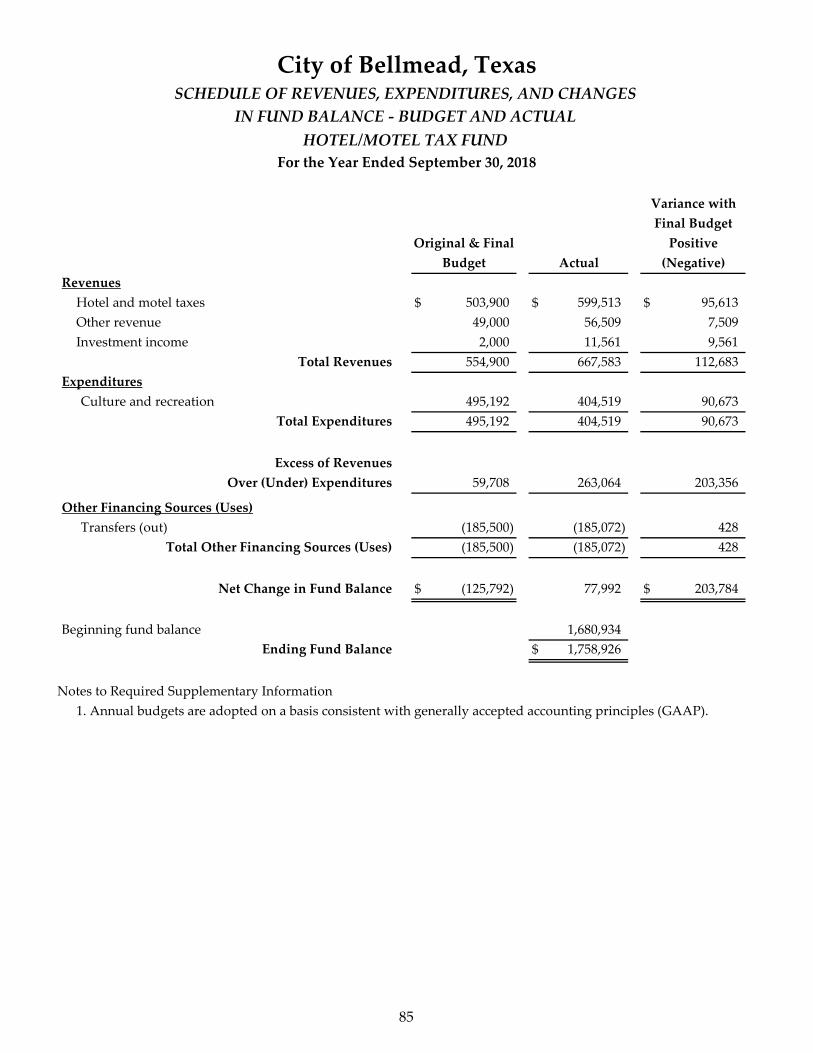
Revenues
Hotel and motel taxes $ 503,900 $ 599,513 $ 95,613
Other revenue 49,000 56,509 7,509
Investment income 2,000 11,561 9,561
554,900 667,583 112,683
Expenditures
Culture and recreation 495,192 404,519 90,673
495,192 404,519 90,673
59,708 263,064 203,356
Other Financing Sources (Uses)
Transfers (out) (185,500) (185,072) 428
(185,500) (185,072) 428
$ (125,792) 77,992 $ 203,784
Beginning fund balance 1,680,934
$ 1,758,926
Notes to Required Supplementary Information 1. Annual budgets are adopted on a basis consistent with generally accepted accounting principles (GAAP).
Ending Fund Balance
Total Revenues
Total Expenditures
Excess of Revenues
Over (Under) Expenditures
Total Other Financing Sources (Uses)
Net Change in Fund Balance
Final Budget
Original & Final
Budget
Positive
Actual (Negative)
City of Bellmead, TexasSCHEDULE OF REVENUES, EXPENDITURES, AND CHANGES
IN FUND BALANCE ‐ BUDGET AND ACTUAL
HOTEL/MOTEL TAX FUND
For the Year Ended September 30, 2018
Variance with
85

1
Total pension liabilityService cost $ 521,330 $ 487,147 $ 458,188 $ 389,742
Interest (on the Total Pension Liability) 842,174 809,001 818,762 767,022
Differences between expected and actual experience (273,905) (233,707) (519,945) 51,209
Changes of assumptions ‐ ‐ 93,818 ‐
Benefit payments, including refunds of participant contributions (538,906) (637,232) (516,186) (489,931)
Net change in total pension liability 550,693 425,209 334,637 718,042
Total pension liability ‐ beginning 12,485,446 12,060,237 11,725,600 11,007,558Total pension liability ‐ ending (a) $ 13,036,139 $ 12,485,446 $ 12,060,237 $ 11,725,600
Plan fiduciary net position
Contributions ‐ employer $ 321,892 $ 310,177 $ 309,670 $ 262,945
Contributions ‐ members 214,834 206,710 204,853 195,254
Net investment income 1,653,688 763,497 16,664 613,170
Benefit payments, including refunds of participant contributions (538,906) (637,232) (516,186) (489,931)
Administrative expenses (8,570) (8,623) (10,150) (6,402)
Other (435) (465) (502) (526)
Net change in plan fiduciary net position 1,642,503 634,064 4,349 574,510
Plan fiduciary net position ‐ beginning 11,931,846 11,297,782 11,293,433 10,718,923Plan fiduciary net position ‐ ending (b) $ 13,574,349 $ 11,931,846 $ 11,297,782 $ 11,293,433
$ (538,210) $ 553,600 $ 762,455 $ 432,167
104.13% 95.57% 93.68% 96.31%Covered payroll $ 3,580,562 $ 3,445,170 $ 3,414,216 $ 3,254,228
(15.03%) 16.07% 22.33% 13.28%
Notes to schedule:
1) This schedule is presented to illustrate the requirement to show information for ten years. However, until a full ten‐year trend is compiled, only available information is shown.
2017
Fundʹs net pension (asset) liability ‐
ending (a) ‐ (b)
City of Bellmead, TexasSCHEDULE OF CHANGES IN NET PENSION (ASSET) LIABILITY AND RELATED RATIOS
Years ended December 31,
2015
Plan fiduciary net position as a
percentage of the total pension liability
Fundʹs net pension liability as a
percentage of covered payroll
20142016
86

9/30/2018 9/30/2017 9/30/2016 9/30/2015 9/30/2014 1
$ 335,268 $ 316,551 $ 320,484 $ 297,841 $ 260,868
$ 335,268 $ 316,551 $ 320,484 $ 297,841 $ 260,868
Contribution deficiency (excess) $ ‐ $ ‐ $ ‐ $ ‐ $ ‐
Annual covered payroll $ 3,698,157 $ 3,520,210 $ 3,552,338 $ 3,383,497 $ 3,192,6879.07% 8.99% 9.02% 8.80% 8.17%
Valuation Date:
Notes Actuarially determined contribution rates are calculated as of December 31 and become effective in January 13 months later.
Methods and Assumptions Used to Determine Contribution Rates:
Actuarial Cost Method Entry Age NormalAmortization Method Level Percentage of Payroll, ClosedRemaining Amortization Period 29 yearsAsset Valuation Method 10 Year smoothed market; 15% soft corridorInflation 2.5%Salary Increases 3.0% to 10.5% including inflationInvestment Rate of Return 6.75%Retirement Age Experience‐based table of rates that are specific to
the Cityʹs plan of benefits. Last updated for the2015 valuation pursuant to an experience studyof the period 2010 ‐ 2014
Mortality RP2000 Combined Mortality Table with Blue Collar Adjustment with male rates multiplied by 109% and female rates multiplied by 103% and projected on a fully generational basis with scale BB
Other Information:
Notes There were no benefit changes during the year.
1) This schedule is presented to illustrate the requirement to show information for ten years. However, until a full ten‐year trend is compiled, only available information is shown.
NOTES TO SCHEDULE OF EMPLOYER CONTRIBUTIONS TO PENSION PLAN
City of Bellmead, TexasSCHEDULE OF EMPLOYER CONTRIBUTIONS TO PENSION PLAN
Fiscal Years Ended:
Contributions in relation to the actuarially determined contribution
Employer contributions as a percentage of covered payroll
Actuarially determined employer contributions
87

1
Total OPEB liabilityService cost $ 10,026
Interest 5,464
Differences between expected and actual experience ‐
Changes of assumptions 13,586
Benefit payments, including refunds of participant contributions (1,432)
Net changes 27,644
Total OPEB liability ‐ beginning 140,253
Total OPEB liability ‐ ending $ 167,897 2
Covered payroll $ 3,580,562
4.69%
Notes to schedule:1
2
This schedule is presented to illustrate the requirement to show information for ten years. However, until a full ten‐year trend is compiled, only available information is shown.
No assets are accumulated in a trust that meets the criteria in paragraph 4 of GASB statement No. 75 to pay related benefits.
Total OPEB Liability as a percentage of covered employee payroll
City of Bellmead, TexasSCHEDULE OF CHANGES IN POSTEMPLOYMENT BENEFITS OTHER THAN
TEXAS MUNICIPAL RETIREMENT SYSTEM
2017
Year ended December 31,
PENSION (OPEB) LIABILITY AND RELATED RATIOS
88

OTHER SUPPLEMENTARY INFORMATION
COMBINING AND INDIVIDUAL FUND FINANCIAL
STATEMENTS AND SCHEDULES
89

Cash and cash equivalents $ 30,597 $ 282,857 $ 94,419 $ 407,873
Receivables, net ‐ 45,114 3,591 48,705
Due from other funds 31,225 3,865 ‐ 35,090
$ 61,822 $ 331,836 $ 98,010 $ 491,668
Liabilities
Accounts payable and accrued expenses $ ‐ $ 7,510 $ ‐ $ 7,510
Due to other funds ‐ 3,396 ‐ 3,396
Total Liabilities ‐ 10,906 ‐ 10,906
Deferred Inflows of Resources
Unavailable revenueProperty taxes ‐ 45,114 ‐ 45,114
Fund Balances
Restricted for:Court security and technology 61,822 ‐ ‐ 61,822
Debt service ‐ 275,816 ‐ 275,816
Capital projects ‐ ‐ 98,010 98,010
61,822 275,816 98,010 435,648
$ 61,822 $ 331,836 $ 98,010 $ 491,668
City of Bellmead, TexasCOMBINING BALANCE SHEET
NONMAJOR GOVERNMENTAL FUNDS
September 30, 2018
Total
Total Fund Balances
Debt
Total Liabilities, Deferred Inflows,
and Fund Balances
Cable PEG
Service Fees& Technology
Assets
Total Assets
Court Security
90

Revenues
Taxes $ ‐ $ 308,784 $ 15,539 $ 324,323
Fines and forfeitures 8,561 ‐ ‐ 8,561
Investment income ‐ 1,692 ‐ 1,692
8,561 310,476 15,539 334,576
Expenditures
Public safety 25 ‐ ‐ 25
Debt servicePrincipal ‐ 200,000 ‐ 200,000
Interest ‐ 101,156 ‐ 101,156
25 301,156 ‐ 301,181
8,536 9,320 15,539 33,395
Other Financing Sources (Uses)
Transfers in ‐ 567 ‐ 567
‐ 567 ‐ 567
8,536 9,887 15,539 33,962
Beginning fund balances 53,286 265,929 82,471 401,686
$ 61,822 $ 275,816 $ 98,010 $ 435,648
City of Bellmead, TexasCOMBINING STATEMENT OF REVENUES, EXPENDITURES,
Ending Fund Balances
Total
Total Other Financing Sources (Uses)
Total Revenues
Total Expenditures
Revenues Over Expenditures
Net Change in Fund Balances
& Technology Service Fees
AND CHANGES IN FUND BALANCES
Cable PEG
NONMAJOR GOVERNMENTAL FUNDS
For the Year Ended September 30, 2018
Court Security Debt
91

Revenues
Franchise taxes $ 15,750 $ 15,539 $ (211)
15,750 15,539 (211)
15,750 15,539 (211)
$ 15,750 15,539 $ (211)
Beginning fund balance 82,471
$ 98,010
Notes to Supplementary Information 1. Annual budgets are adopted on a basis consistent with generally accepted accounting principles (GAAP).
Ending Fund Balance
Total Revenues
Excess of Revenues
Over (Under) Expenditures
Net Change in Fund Balance
Final Budget
Original & Final
Budget
Positive
Actual (Negative)
City of Bellmead, TexasSCHEDULE OF REVENUES, EXPENDITURES, AND CHANGES
IN FUND BALANCE ‐ BUDGET AND ACTUAL
CABLE PEG FEES FUND
For the Year Ended September 30, 2018
Variance with
92

Revenues
Fines and forfeitures $ 9,900 $ 8,561 $ (1,339)
9,900 8,561 (1,339)
Expenditures
Public safety ‐ 25 (25) *‐ 25 (25)
$ 9,900 8,536 $ (1,364)
Beginning fund balance 53,286
$ 61,822
Notes to Supplementary Information 1. Annual budgets are adopted on a basis consistent with generally accepted accounting principles (GAAP).
* Expenditures exceeded appropriations at the legal level of control.
Total Revenues
Total Expenditures
Net Change in Fund Balance
Ending Fund Balance
Variance with
Final Budget
Final Budget
Positive
Actual (Negative)
City of Bellmead, TexasSCHEDULE OF REVENUES, EXPENDITURES, AND CHANGES
IN FUND BALANCE ‐ BUDGET AND ACTUAL
COURT SECURITY AND TECHNOLOGY
For the Year Ended September 30, 2018
93

Revenues
Property taxes $ 306,450 $ 308,784 $ 2,334
Investment income 1,500 1,692 192
307,950 310,476 2,526
Expenditures
Debt service:Principal 505,000 200,000 305,000
Interest 288,894 101,156 187,738
793,894 301,156 492,738
(485,944) 9,320 495,264
Other Financing Sources (Uses)
Transfers in 490,000 567 (489,433)
490,000 567 (489,433)
$ 4,056 9,887 $ 5,831
Beginning fund balance 265,929
$ 275,816
Notes to Supplementary Information 1. Annual budgets are adopted on a basis consistent with generally accepted accounting principles (GAAP).
Net Change in Fund Balance
Ending Fund Balance
(Negative)
Total Revenues
Total Expenditures
Excess of Revenues
Over (Under) Expenditures
Total Other Financing Sources (Uses)
IN FUND BALANCE ‐ BUDGET AND ACTUAL
DEBT SERVICE FUND
For the Year Ended September 30, 2018
Variance with
Final Budget
Final Budget
Positive
Actual
City of Bellmead, TexasSCHEDULE OF REVENUES, EXPENDITURES, AND CHANGES
94

Cash and cash equivalents $ 2,416,788
Investments 2,698,808
Receivables, net 110,301Note receivable 781,763
$ 6,007,660
Liabilities
Accounts payable andaccrued liabilities $ 39,082
39,082
Deferred Inflows of Resources
Unavailable revenue ‐ lease receivable 781,763
781,763
Restricted for:Economic development 5,186,815
5,186,815$ 6,007,660
See Notes to Financial Statements.
Total Deferred Inflows of Resources
Bellmead
Economic
Development
Corporation
Assets
Total Assets
Total Liabilities
Fund Balances
City of Bellmead, TexasBALANCE SHEET
NONMAJOR GOVERNMENTAL FUNDS
September 30, 2018
Total Fund Balance
Total Liabilities and Fund Balance
95

Fund Balance $ 5,186,815
Adjustments for the Statement of Net Position:
Other long‐term assets are not available to pay for current‐periodexpenditures and, therefore, are deferred in the governmental funds.
Note receivable 781,763
$ 5,968,578
See Notes to Financial Statements.
Net Position of the Discretely Presented Component Unit
STATEMENT OF REVENUES, EXPENDITURES, AND CHANGES IN FUND BALANCE
DISCRETELY PRESENTED COMPONENT UNIT
For the Year Ended September 30, 2018
City of Bellmead, Texas
96

Revenues
Sales tax $ 625,253
Investment income 81,922
707,175
Expenditures
Current:Economic development 389,935
389,935
317,240
Other Financing Sources (Uses)
Payments received for notes receivable 98,357
98,357
415,597
4,771,218
$ 5,186,815
See Notes to Financial Statements.
Net Change in Fund Balance
Beginning fund balanceEnding Fund Balance
Corporation
Total Revenues
Total Expenditures
Over (Under) Expenditures
Total Other Financing Sources (Uses)
Economic
Development
City of Bellmead, TexasSTATEMENT OF REVENUES, EXPENDITURES, AND CHANGES IN FUND BALANCE
DISCRETELY PRESENTED COMPONENT UNIT
For the Year Ended September 30, 2018
Bellmead
97

98

Amounts reported for governmental activities in the statement of activities aredifferent because:
Net changes in fund balance $ 415,597
Governmental funds report payments received for note receivables as other
(98,357)
$ 317,240
See Notes to Financial Statements.
Change in Net Position of the Discretely Presented Component Unit
financing sources. These are not recorded in the statement of activities, as they reduce the long term receivable balance in the statement of net position.
City of Bellmead, TexasRECONCILIATION OF THE STATEMENT OF REVENUES, EXPENDITURES,
AND CHANGES IN FUND BALANCES OF THE DISCRETELY PRESENTED
COMPONENT UNIT TO THE STATEMENT OF ACTIVITIES
For the Year Ended September 30, 2018
99

100

Contents Page
Financial Trends 102
Revenue Capacity 112
Debt Capacity 120
Demographic and Economic Information 128
Operating Information 132
Continuing Financial Disclosures 136
Sources: Unless otherwise noted, the information in these schedules is derived from thecomprehensive annual financial reports for the relevant year.
These tables present various financial data originally distributed in a debt official
statement. The City is required to update financial tables originally distributed in a
debt official statement within six months after the end of each fiscal year. This financial
information is provided to the Municipal Securities Rulemaking Board (MSRB)
annually via the Electronic Municipal Market Access (EMMA) system.
City of Bellmead, TexasSTATISTICAL SECTION
These schedules contain trend information to help the reader understand how the Cityʹs
financial performance and well‐being have changed over time.
These schedules contain information to help the reader assess the Cityʹs most significant
local revenue source, the property tax.
This part of the City of Bellmeadʹs comprehensive annual financial report presents detailedinformation as a context for understanding what the information in the financial statements, notedisclosures, and required supplementary information says about the Cityʹs overall financial health.
These schedules present information to help the reader assess the affordability of the
Cityʹs current levels of outstanding debt and the Cityʹs ability to issue additional debt
in the future.
(UNAUDITED)
These schedules offer demographic and economic indicators to help the reader
understand the environment within which the Cityʹs financial activities take place.
These schedules contain service and infrastructure data to help the reader understand
how the information in the Cityʹs financial report relates to the services the government
provides and the activities it performs.
101
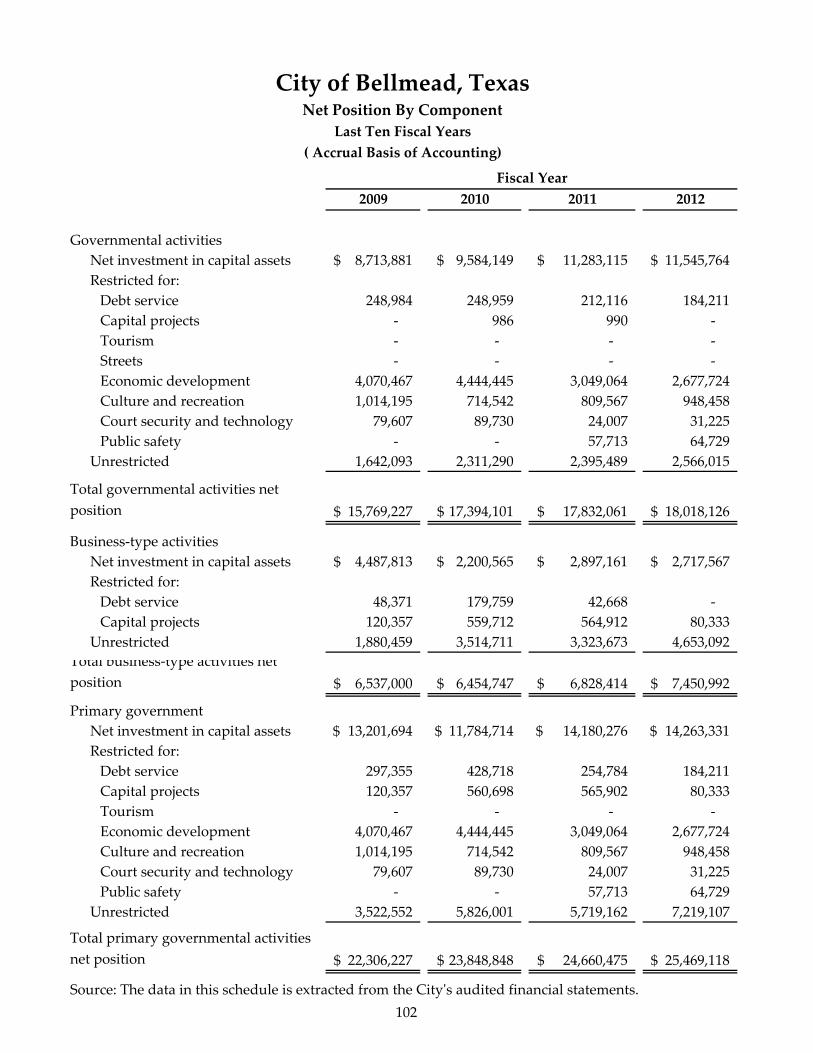
2009 2010 2011 2012
Governmental activitiesNet investment in capital assets 8,713,881$ 9,584,149$ 11,283,115$ 11,545,764$ Restricted for:Debt service 248,984 248,959 212,116 184,211
Capital projects ‐ 986 990 ‐
Tourism ‐ ‐ ‐ ‐
Streets ‐ ‐ ‐ ‐
Economic development 4,070,467 4,444,445 3,049,064 2,677,724
Culture and recreation 1,014,195 714,542 809,567 948,458
Court security and technology 79,607 89,730 24,007 31,225
Public safety ‐ ‐ 57,713 64,729
Unrestricted 1,642,093 2,311,290 2,395,489 2,566,015
Total governmental activities net position 15,769,227$ 17,394,101$ 17,832,061$ 18,018,126$
Business‐type activitiesNet investment in capital assets 4,487,813$ 2,200,565$ 2,897,161$ 2,717,567$ Restricted for:Debt service 48,371 179,759 42,668 ‐
Capital projects 120,357 559,712 564,912 80,333
Unrestricted 1,880,459 3,514,711 3,323,673 4,653,092
Total business‐type activities net position 6,537,000$ 6,454,747$ 6,828,414$ 7,450,992$
Primary governmentNet investment in capital assets 13,201,694$ 11,784,714$ 14,180,276$ 14,263,331$ Restricted for:Debt service 297,355 428,718 254,784 184,211
Capital projects 120,357 560,698 565,902 80,333
Tourism ‐ ‐ ‐ ‐
Economic development 4,070,467 4,444,445 3,049,064 2,677,724
Culture and recreation 1,014,195 714,542 809,567 948,458
Court security and technology 79,607 89,730 24,007 31,225
Public safety ‐ ‐ 57,713 64,729
Unrestricted 3,522,552 5,826,001 5,719,162 7,219,107
Total primary governmental activities net position 22,306,227$ 23,848,848$ 24,660,475$ 25,469,118$
Source: The data in this schedule is extracted from the Cityʹs audited financial statements.
City of Bellmead, TexasNet Position By Component
Last Ten Fiscal Years
( Accrual Basis of Accounting)
Fiscal Year
102

Table 1
2013 2014 2015 2016 2017 2018
11,452,985$ 11,315,424$ 10,824,531$ 10,463,797$ 9,008,424$ 6,861,614$
189,364 189,852 261,422 321,762 310,153 275,816
‐ ‐ ‐ ‐ ‐ 1,950,212
‐ ‐ ‐ ‐ 1,680,934 1,758,926
‐ ‐ ‐ 2,597,208 2,345,942 2,470,973
3,166,471 4,695,853 5,206,660 5,509,434 ‐ ‐
995,230 1,106,713 1,285,977 1,421,289 ‐ ‐
31,225 31,225 33,632 45,730 53,286 61,822
81,259 76,554 74,643 74,643 10,553 ‐
3,114,026 3,588,381 3,855,628 1,582,003 1,378,278 1,134,370
19,030,560$ 21,004,002$ 21,542,493$ 22,015,866$ 14,787,570$ 14,513,733$
2,658,303$ 3,106,686$ 3,145,571$ 3,104,361$ 4,200,804$ 2,428,272$
‐ ‐ ‐ ‐ ‐ ‐
20,419 20,426 20,437 20,495 ‐ ‐
5,213,955 5,208,403 5,472,338 5,655,690 4,544,602 7,618,717
7,892,677$ 8,335,515$ 8,638,346$ 8,780,546$ 8,745,406$ 10,046,989$
14,111,288$ 14,422,110$ 13,970,102$ 13,568,158$ 13,209,228$ 9,289,886$
189,364 189,852 261,422 321,762 310,153 275,816
20,419 20,426 20,437 20,495 ‐ 1,950,212
‐ ‐ ‐ ‐ 1,680,934 1,758,926
3,166,471 4,695,853 5,206,660 5,509,434 ‐ ‐
995,230 1,106,713 1,285,977 1,421,289 ‐ ‐
31,225 31,225 33,632 45,730 53,286 61,822
81,259 76,554 74,643 74,643 10,553 ‐
8,327,981 8,796,784 9,327,966 7,237,693 5,922,880 8,753,087
26,923,237$ 29,339,517$ 30,180,839$ 28,199,204$ 21,187,034$ 22,089,749$
Fiscal Year
103

2009 2010 2011 2012
ExpensesGovernmental activities:
General government 1,291,072$ 1,182,758$ 1,355,564$ 1,453,451$ Public safety 1,977,434 2,348,823 2,379,436 2,463,513
Public works 806,540 1,298,345 605,576 618,766
Economic development 607,469 260,980 688,838 959,452
Culture and recreation ‐ 355,568 409,589 381,033
Interest on long‐term debt 66,000 56,490 44,519 32,159
Total governmental activities expenses 4,748,515 5,502,964 5,483,522 5,908,374
Business‐type activitiesWater and sewer 2,899,367 2,343,317 2,229,026 2,000,505
Total business‐type activities expenses 2,899,367 2,343,317 2,229,026 2,000,505
Total primary government expenses 7,647,882$ 7,846,281$ 7,712,548$ 7,908,879$ Program revenues
Governmental activities:Charges for services:General government 38,122$ 96,056$ 112,098$ 34,668$ Public safety 339,502 364,337 324,274 277,689
Economic development ‐ 36,769 38,198 45,163
Culture and recreation 39,855 46,500 46,140 46,210
Operating grants and contributions 413,775 77,870 ‐ 93,191
Capital grants and contributions ‐ 196,045 ‐ ‐
Total governmental activities program revenues 831,254$ 817,577$ 520,710$ 496,921$
Business‐type activities:Charges for services:
Water and sewer 2,611,295 2,417,557 2,591,099 2,678,041
Operating grants and contributions ‐ ‐ ‐ ‐
Total business‐type activities program revenues 2,611,295 2,417,557 2,591,099 2,678,041
Total primary government program revenues 3,442,549$ 3,235,134$ 3,111,809$ 3,174,962$
Net (expense)/revenue:Governmental activities (3,917,261)$ (4,685,387)$ (4,962,812)$ (5,411,453)$ Business‐type activities (288,072) 74,240 362,073 677,536
Total primary government net expense (4,205,333)$ (4,611,147)$ (4,600,739)$ (4,733,917)$
Source: The data in this schedule is extracted from the Cityʹs audited financial statements.
Fiscal Year
City of Bellmead, TexasChanges in Net Position
Last Ten Fiscal Years
(Accrual Basis of Accounting)
104

Table 2
2013 2014 2015 2016 2017 2018
988,499$ 1,092,276$ 1,108,455$ 1,244,747$ 1,251,195$ 1,118,633$ 2,905,298 3,298,118 3,378,464 3,635,664 3,850,818 3,964,526
728,820 631,073 884,412 696,991 635,272 809,220
359,382 675,330 487,357 483,256 133,498 ‐
516,036 511,342 498,863 619,491 527,180 542,821
20,432 84,027 106,443 100,519 92,725 202,496
5,518,467 6,292,166 6,463,994 6,780,668 6,490,688 6,637,696
2,239,420 2,313,591 2,481,577 2,628,931 2,627,061 3,295,086
2,239,420 2,313,591 2,481,577 2,628,931 2,627,061 3,295,086
7,757,887$ 8,605,757$ 8,945,571$ 9,409,599$ 9,117,749$ 9,932,782$
55,093$ 46,832$ 42,170$ 33,761$ 35,182$ 35,772$ 371,414 357,416 332,056 320,431 291,635 238,999
25,276 65,049 11,014 ‐ ‐ ‐
36,865 38,898 46,140 52,835 ‐ ‐
89,713 92,029 79,192 76,929 34,732 1,299,018
‐ ‐ ‐ ‐ ‐ ‐
578,361$ 600,224$ 510,572$ 483,956$ 361,549$ 1,573,789$
2,672,771 2,747,642 2,643,494 2,758,010 2,771,776 3,379,038
‐ 11,904 193,684 34,244 ‐ ‐
2,672,771 2,759,546 2,837,178 2,792,254 2,771,776 3,379,038
3,251,132$ 3,359,770$ 3,347,750$ 3,276,210$ 3,133,325$ 4,952,827$
(4,940,106)$ (5,691,942)$ (5,953,422)$ (6,296,712)$ (6,129,139)$ (5,063,907)$ 433,351 445,955 355,601 163,323 144,715 83,952
(4,506,755)$ (5,245,987)$ (5,597,821)$ (6,133,389)$ (5,984,424)$ (4,979,955)$
Fiscal Year
105

2009 2010 2011 2012
General revenues and other changes innet positionGovernmental activities:Ad valorem taxes 799,989$ 816,489$ 879,328$ 910,859$ Sales taxes 3,043,446 3,074,535 3,132,994 3,161,021
Hotel occupancy taxes 334,917 359,638 364,090 350,580
Franchise taxes 589,469 550,229 569,355 522,844
Investment earnings 84,062 160,816 131,284 108,908
Miscellaneous 210,604 206,031 144,797 252,912
Gain on sale of capital assets ‐ 771,107 178,924 153,953
Transfers 170,000 110,000 ‐ 60,000
Total governmental activities 5,232,487 6,048,845 5,400,772 5,521,077
Business‐type activities:Investment earnings 49,643 19,140 11,594 5,042
Miscellaneous 60,154 ‐ ‐ ‐
Transfers (170,000) (110,000) ‐ (60,000)
Total business‐type activities (60,203) (90,860) 11,594 (54,958)
Total primary government 5,172,284$ 5,957,985$ 5,412,366$ 5,466,119$ Changes in net position:Governmental activities 1,315,226$ 1,363,458$ 437,960$ 109,624$ Business‐type activities (348,275) (16,620) 373,667 622,578
Total primary government 966,951$ 1,346,838$ 811,627$ 732,202$
Source: The data in this schedule is extracted from the Cityʹs audited financial statements.
Fiscal Year
City of Bellmead, TexasChanges in Net Position (Continued)
Last Ten Fiscal Years
(Accrual Basis of Accounting)
106

2013 2014 2015 2016 2017 2018
1,020,937$ 1,072,159$ 1,131,364$ 1,183,252$ 1,234,664$ 1,282,797$ 3,278,348 3,282,299 3,433,253 3,529,550 2,993,211 3,126,317
381,192 430,662 488,517 539,344 544,196 599,513
492,154 523,085 531,867 518,565 664,696 563,099
98,338 95,090 114,130 97,768 77,950 166,038
531,407 860,424 735,105 869,629 60,958 176,197
150,164 175,000 93,289 110 ‐ ‐
‐ ‐ 53,064 31,867 (202,048) 384,171
5,952,540 6,438,719 6,580,589 6,770,085 5,373,627 6,298,132
8,334 12,818 10,382 10,744 22,547 39,134
‐ ‐ ‐ ‐ ‐ 54,606
‐ ‐ (53,064) (31,867) (202,402) (384,171)
8,334 12,818 (42,682) (21,123) (179,855) (290,431)
5,960,874$ 6,451,537$ 6,537,907$ 6,748,962$ 5,193,772$ 6,007,701$
1,012,434$ 746,777$ 627,167$ 473,373$ (755,512)$ 1,234,225$ 441,685 458,773 312,919 142,200 (35,140) (206,479)
1,454,119$ 1,205,550$ 940,086$ 615,573$ (790,652)$ 1,027,746$
Fiscal Year
107

2009 2010 2011 2012
General fundReservedInventories 9,700$ 725$ ‐$ ‐$ Drug enforcement 821 ‐ ‐ ‐
Cultural activities 1,014,195 ‐ ‐ ‐
Public safety 58,422 58,422 ‐ ‐
Court technology 20,364 31,308 ‐ ‐
UnreservedDesignated 405,984 ‐ ‐ ‐
Undesignated 1,012,140 1,991,949 ‐ ‐
Nonspendable:Inventories ‐ ‐ 728 728
Prepaid assets ‐ ‐ ‐ 440
Restricted for:Public safety ‐ ‐ 57,713 64,729
Streets ‐ ‐ ‐ ‐
Committed to:Street improvements ‐ ‐ 508,337 918,685
Unassigned ‐ ‐ 1,927,206 1,705,700
Total general fund 2,521,626$ 2,082,404$ 2,493,984$ 2,690,282$
All other governmental funds:Reserved for:Debt service 224,573$ 222,690$ ‐$ ‐$ Economic development 4,070,467 4,444,445 ‐ ‐
Capital projects 140 986 ‐ ‐
Unreserved:Designated ‐ 194,491 ‐ ‐
Undesignated ‐ special revenue 343,921 906 ‐ ‐
Restricted for:Debt service ‐ ‐ 181,654 158,423
Capital projects ‐ ‐ 990 ‐
Tourism ‐ ‐ ‐ ‐
Economic development ‐ ‐ 3,049,064 2,677,724
Culture and recreation ‐ ‐ 809,567 948,458
Court security and technology ‐ ‐ 24,007 31,225
Total all other governmental funds 4,639,101$ 4,863,518$ 4,065,282$ 3,815,830$
Source: The data in this schedule is extracted from the Cityʹs audited financial statements.The City implemented GASB Statement No. 54 ʺFund Balance Reporting and Governmental Fund Type Definitionsʺ in fiscal year 2011, and opted not to restate the previous yearsʹ activity.
Fiscal Year
City of Bellmead, TexasFund Balances of Governmental Funds
Last Ten Fiscal Years
(Modified Accrual Basis of Accounting)
108

Table 3
2013 2014 2015 2016 2017 2018
‐$ ‐$ ‐$ ‐$ ‐$ ‐$ ‐ ‐ ‐ ‐ ‐ ‐
‐ ‐ ‐ ‐ ‐ ‐
‐ ‐ ‐ ‐ ‐ ‐
‐ ‐ ‐ ‐ ‐ ‐
‐ ‐ ‐ ‐ ‐ ‐
‐ ‐ ‐ ‐ ‐ ‐
728 728 728 728 728 ‐
440 440 440 440 440 ‐
81,259 76,554 74,643 74,643 10,553 ‐
‐ ‐ ‐ ‐ ‐ 2,470,973
1,331,796 1,830,145 2,097,654 2,597,209 2,454,179 ‐
1,869,707 1,909,873 1,912,301 1,854,773 1,734,648 1,252,075
3,283,930$ 3,817,740$ 4,085,766$ 4,527,793$ 4,200,548$ 3,723,048$
‐$ ‐$ ‐$ ‐$ ‐$ ‐$ ‐ ‐ ‐ ‐ ‐ ‐
‐ ‐ ‐ ‐ ‐ ‐
‐ ‐ ‐ ‐ ‐ ‐
‐ ‐ ‐ ‐ ‐ ‐
155,626 156,183 221,763 259,622 265,929 275,816
‐ 4,001,777 3,444,948 2,669,529 2,238,198 3,950,212
‐ ‐ ‐ ‐ 1,545,094 1,758,926
3,166,471 3,588,046 4,142,596 4,535,277 4,771,218 ‐
995,230 1,106,713 1,285,977 1,421,289 ‐ ‐
31,225 31,225 33,632 45,730 53,286 61,822
4,348,552$ 8,883,944$ 9,128,916$ 8,931,447$ 8,873,725$ 6,046,776$
Fiscal Year
109

2009 2010 2011 2012
Revenues:Taxes 4,766,181$ 4,794,513$ 4,971,986$ 4,994,402$ Licenses and permits 38,122 96,056 112,098 34,668
Grants and intergovernmental 413,775 273,915 ‐ 93,191
Charges for services 39,855 ‐ ‐
Fines 339,502 364,337 307,005 269,182
Rents ‐ 83,269 84,338 91,373
Investment earnings 84,062 160,816 131,284 108,908
Miscellaneous 210,604 164,004 117,869 218,183
Total revenues 5,892,101 5,936,910 5,724,580 5,809,907
Expenditures:General government 1,168,113 1,140,559 1,284,233 1,379,384
Public safety 1,901,131 2,732,621 2,166,967 2,537,717
Public works 932,367 1,229,575 634,401 510,897
Economic development 1,735,522 483,294 1,688,797 1,238,262
Culture and recreation 268,583 301,848 295,140 310,174
Capital outlay 337,641 602,333 669,357 100,601
Debt service:Principal 200,000 215,000 225,000 235,000
Interest and fiscal charges 66,000 56,490 40,810 53,977
Costs of issuance ‐ ‐ ‐ ‐
Total expenditures 6,609,357 6,761,720 7,004,705 6,366,012
Excess (Deficiency) of revenuesover (under) expenditures (717,256) (824,810) (1,280,125) (556,105)
Other financing sources (uses):Capital‐related bonds issued ‐ ‐ ‐ 725,000
Premium/discount on issuance of debt ‐ ‐ ‐ ‐
Payment to escrow agent ‐ ‐ ‐ (512,443)
Insurance proceeds ‐ ‐ ‐ ‐
Sale of capital assets ‐ 911,107 178,924 153,953
Transfers in 721,600 125,000 1,350,898 191,495
Transfers out (551,600) (15,000) (1,350,898) (131,495)
Total other financing sources 170,000 1,021,107 178,924 426,510
Net change in fund balances (547,256)$ 196,297$ (1,101,201)$ (129,595)$ Debt service as a percentage of noncapital expenditures 4.2% 4.4% 4.2% 4.6%
Source: The data in this schedule is extracted from the Cityʹs audited financial statements.
City of Bellmead, TexasChanges in Fund Balances of Governmental Funds
Last Ten Fiscal Years
(Modified Accrual Basis of Accounting)
Fiscal Year
110

Table 4
2013 2014 2015 2016 2017 2018
5,222,061$ 5,363,878$ 5,608,134$ 5,805,952$ 6,092,249$ 5,566,748$ 55,093 46,792 42,170 33,761 35,182 35,772
89,713 92,029 79,912 76,929 61,630 1,299,018
‐ ‐ ‐ ‐ ‐
371,414 357,416 332,056 320,431 241,873 238,999
62,141 103,987 57,154 52,835 46,840 ‐
98,338 95,090 114,130 97,768 138,233 166,038
479,102 624,726 677,112 811,907 76,307 176,197
6,377,862 6,683,918 6,910,668 7,199,583 6,692,314 7,482,772
909,033 982,935 1,013,370 1,121,916 1,111,229 1,216,335
2,818,756 3,040,225 3,196,488 3,329,224 3,454,302 3,743,545
616,325 584,008 817,744 605,892 1,335,898 583,095
265,272 567,988 425,867 370,416 248,266 ‐
344,922 434,807 422,559 536,394 445,698 445,467
147,000 187,029 592,441 813,662 312,334 2,271,459
290,000 295,000 185,000 195,000 200,000 200,000
10,048 4,982 111,875 109,001 105,110 101,156
‐ 68,508 ‐ ‐ ‐ 90,454
5,401,356 6,165,482 6,765,344 7,081,505 7,212,837 8,651,511
976,506 518,436 145,324 118,078 (520,523) (1,168,739)
‐ 4,000,000 ‐ ‐ ‐ 1,995,000
‐ 70,106 ‐ 4,596 ‐ 95,454
‐ ‐ ‐ ‐ ‐ ‐
‐ 175,985 ‐ ‐ ‐ ‐
150,164 304,675 314,610 90,017 94,038 ‐
43,375 166,416 115,470 168,044 864,336 952,805
(43,375) (166,416) (62,406) (136,177) (661,934) (568,634)
150,164 4,550,766 367,674 126,480 296,440 2,474,625
1,126,670$ 5,069,202$ 512,998$ 244,558$ (224,083)$ 1,305,886$
5.7% 5.0% 4.8% 4.9% 4.4% 6.1%
Fiscal Year
111

Fiscal Less: TotalYear Real Personal Tax Exempt Taxable Assessed Total DirectEnded Property Property Property Value Tax Rate
2009 271,543,351$ 64,448,896$ 27,067,461$ 308,924,786$ 0.253304$ 2010 299,339,474$ 61,715,381$ 35,500,943$ 325,553,912$ 0.246965$ 2011 320,432,402$ 60,926,697$ 57,922,224$ 323,436,875$ 0.265560$ 2012 325,029,526$ 59,820,151$ 56,565,655$ 328,284,022$ 0.274498$ 2013 335,877,049$ 59,606,119$ 58,063,452$ 337,419,716$ 0.298608$ 2014 372,456,086$ 59,525,430$ 75,842,635$ 356,138,881$ 0.298608$ 2015 380,073,630$ 60,256,320$ 74,973,888$ 365,356,062$ 0.298608$ 2016 393,801,171$ 64,177,230$ 76,365,286$ 381,613,115$ 0.318608$ 2017 424,861,912$ 63,346,990$ 80,525,900$ 407,683,002$ 0.303761$ 2018 408,622,136$ 64,176,790$ 86,104,425$ 386,694,501$ 0.299990$
Source: McLennan County Tax Appraisal District
Taxable Assessed Value
City of Bellmead, TexasAssessed Value and Estimated Actual Value of Property
Last Ten Years
112

Table 5
Estimated AssessedActual Value as aTaxable Percentage ofValue Actual Value
335,992,247$ 91.94%361,054,855$ 90.17%381,359,099$ 84.81%384,849,677$ 85.30%395,483,168$ 85.32%431,981,516$ 82.44%440,329,950$ 82.97%457,978,401$ 83.33%488,208,902$ 83.51%472,798,926$ 81.79%
113

TotalFiscal Tax Operating Debt Service DirectYear Year Rate Rate Rate
2009 2008 0.188716$ 0.064588$ 0.253304$ 2010 2009 0.182078$ 0.064887$ 0.246965$ 2011 2010 0.196933$ 0.068627$ 0.265560$ 2012 2011 0.211140$ 0.063358$ 0.274498$ 2013 2012 0.211100$ 0.087508$ 0.298608$ 2014 2013 0.214186$ 0.084422$ 0.298608$ 2015 2014 0.214408$ 0.084200$ 0.298608$ 2016 2015 0.238997$ 0.079611$ 0.318608$ 2017 2016 0.227990$ 0.075771$ 0.303761$ 2018 2017 0.227641$ 0.072349$ 0.299990$
Source: McLennan County Tax Appraisal District
City of Bellmead
City of Bellmead, TexasProperty Tax Rates
Direct and Overlapping Governments
114

Table 6
TotalMcLennan Direct and
McLennan LaVega Community OverlappingCounty ISD College Rates
0.450500$ 1.182827$ 0.151134$ 2.03777$ 0.443100$ 1.238915$ 0.156332$ 2.08531$ 0.442710$ 1.365000$ 0.156306$ 2.22958$ 0.442710$ 1.365000$ 0.152823$ 2.23503$ 0.460573$ 1.420000$ 0.151530$ 2.33071$ 0.536293$ 1.420000$ 0.151530$ 2.40643$ 0.535293$ 1.465000$ 0.149530$ 2.44843$ 0.535293$ 1.459000$ 0.149724$ 2.46263$ 0.525293$ 1.422100$ 0.148898$ 2.40005$ 0.505293$ 1.413532$ 0.150346$ 2.36916$
Overlapping Rates
115

116

Table 7
% of Total % of TotalTaxable Taxable Taxable TaxableAssessed Assessed Assessed Assessed
Name of Taxpayer Value Rank Valuation Value Rank Value
Butt H E Grocery Co 15,149,378$ 1 3.92% 11,814,584$ 1 3.82%Wal‐Mart Real Estate Business Trust 11,778,810 2 3.05% 11,688,459 2 3.78%Prem SAI Inc. 10,607,140 3 2.74% ‐ n/a n/aSams Club East Inc. 8,282,950 4 2.14% 7,827,844 4 2.53%Wal‐Mart Stores East LP 7,803,400 5 2.02% 8,135,820 3 2.63%Bellmead McLennan NJ LTD 6,958,970 6 1.80% ‐ n/a n/aHome Depot USA Inc. 6,638,203 7 1.72% 7,563,737 6 2.45%Realty Income Properties 25 LLC 5,852,980 8 1.51% ‐ n/a n/aTBA Associates LP 5,411,071 9 1.40% ‐ n/a n/aAmercian Bank NA 5,330,060 10 1.38% 3,798,130 8 1.23%Mogavero James E Trustee Etal ‐ n/a n/a 7,572,767 5 2.45%Home Depot ‐ n/a n/a 5,769,069 7 1.87%Southwestern Bell Telephone Co. ‐ n/a n/a 3,760,288 9 1.22%Oncor Electric Delivery Co. ‐ n/a n/a 3,298,140 10 1.07%Subtotal 83,812,962 21.68% 71,228,838 23.05%
All other taxpayers 302,881,539 78.32% 237,695,948 76.95%
386,694,501$ 100.00% 308,924,786$ 100.00%
Source: McLennan County Tax Appraisal District
2018 2009
City of Bellmead, TexasPrincipal Property Taxpayers
Current Year and Nine Years Ago
117

Fiscal Total Tax Interest
Year Levy for Tax General & Sinking PercentageSeptember 30 Year Rate Fund Fund Tax Levy Amount of Levy
2009 2008 0.25330$ 0.18872$ 0.06459$ 778,490$ 751,554$ 96.54%2010 2009 0.24697$ 0.18208$ 0.06489$ 809,763$ 758,667$ 93.69%2011 2010 0.26556$ 0.19693$ 0.06863$ 806,616$ 774,513$ 96.02%2012 2011 0.27450$ 0.21114$ 0.06336$ 867,934$ 832,002$ 95.86%2013 2012 0.29861$ 0.21110$ 0.08751$ 903,305$ 873,044$ 96.65%2014 2013 0.29861$ 0.21419$ 0.08442$ 1,006,643$ 979,363$ 97.29%2015 2014 0.29861$ 0.21441$ 0.08420$ 1,060,718$ 1,004,076$ 94.66%2016 2015 0.31861$ 0.23900$ 0.07961$ 1,086,718$ 1,053,030$ 96.90%2017 2016 0.30376$ 0.22799$ 0.07577$ 1,159,210$ 1,119,449$ 96.57%2018 2017 0.29999$ 0.22764$ 0.07235$ 1,262,193$ 1,227,111$ 97.22%
Source: McLennan County Tax Assessor & Collector
City of Bellmead, TexasProperty Tax Levies and Collections
Last Ten Fiscal Years
Ad Valorem Rate Fiscal Year of the LevyCollected within the
118

Table 8
Collection inSubsequent Percentage
Years Amount of Levy
22,200$ 773,754$ 99.39%45,383$ 804,050$ 99.29%26,155$ 800,667$ 99.26%29,513$ 861,515$ 99.26%23,998$ 897,042$ 99.31%17,862$ 997,225$ 99.06%45,299$ 1,049,374$ 98.93%21,380$ 1,074,410$ 98.87%21,039$ 1,140,488$ 98.38%
‐$ 1,227,111$ 97.22%
to DateTotal Collections
119

General Certificates Tax Unamortized Total General CertificatesFiscal Obligation of Anticipation bond premiums/ Governmental Obligation ofYear Bonds Obligation Notes discounts Activities (1) Bonds Obligation
2009 ‐$ 1,185,000$ ‐$ ‐$ 1,185,000$ ‐$ 1,252,871$ 2010 ‐$ 970,000$ ‐$ ‐$ 970,000$ ‐$ 1,119,303$ 2011 ‐$ 745,000$ ‐$ ‐$ 745,000$ ‐$ 979,724$ 2012 495,000$ ‐$ 230,000$ ‐$ 725,000$ 870,000$ ‐$ 2013 250,000$ ‐$ 185,000$ ‐$ 435,000$ 690,000$ ‐$ 2014 ‐$ 4,000,000$ 140,000$ 70,106$ 4,210,106$ 510,000$ 4,500,000$ 2015 ‐$ 3,860,000$ 95,000$ 66,601$ 4,021,601$ 345,000$ 4,500,000$ 2016 ‐$ 3,710,000$ 50,000$ 63,095$ 3,823,095$ 175,000$ 6,870,000$ 2017 ‐$ 3,560,000$ ‐$ 59,589$ 3,619,589$ ‐$ 6,745,000$ 2018 ‐$ 5,355,000$ ‐$ 151,539$ 5,506,539$ ‐$ 6,440,000$
N/A Not available(1) Presented net of original issuance discounts and premiums(2) Personal income is disclosed on Table 14(3) Source: U. S. Census Bureau, Greater Bellmead Chamber of Commerce
Business‐Type Activities
City of Bellmead, TexasRatios of Outstanding Debt by Type
Last Ten Fiscal Years
Governmental Activities
120

Table 9
Unamortized Total Total PercentageNotes bond premiums/ Business‐Type Primary of Personal PerPayable discounts Activities (1) Government (1) Income (2) Population (3) Capita
208,958$ ‐$ 1,461,829$ 2,646,829$ 0.04% 9,901 267$ 171,736$ ‐$ 1,291,039$ 2,261,039$ 0.03% 9,901 228$ 171,736$ ‐$ 1,151,460$ 1,896,460$ 0.02% 9,982 190$ 152,134$ ‐$ 1,022,134$ 1,747,134$ 0.02% 10,052 174$ 141,758$ ‐$ 831,758$ 1,266,758$ 0.01% 10,127 125$ 131,054$ 78,869$ 5,219,923$ 9,430,029$ 0.10% 10,235 921$ 120,107$ 74,926$ 5,040,033$ 9,061,634$ 0.09% 10,303 880$ 108,765$ 153,899$ 7,307,664$ 11,130,759$ 0.11% 10,387 1,072$ 96,720$ 145,808$ 6,987,528$ 10,607,117$ 0.10% 10,503 1,010$ 84,304$ 137,719$ 6,662,023$ 12,168,562$ N/A 10,620 1,146$
Business‐Type Activities
121

Table 10
Percentage ofEstimated
Fiscal General Less: Amounts Actual TaxableYear Ended Obligation Available in Debt Value of PerSeptember 30 Bonds (1) Service Fund (2) Total Property (3) Capita (4)
2009 ‐$ 248,984$ (248,984)$ ‐0.07% (2)$ 2010 ‐$ 253,583$ (253,583)$ ‐0.07% (2)$ 2011 ‐$ 212,116$ (212,116)$ ‐0.06% (2)$ 2012 1,365,000$ 158,423$ 1,206,577$ 0.31% 9$ 2013 940,000$ 155,626$ 784,374$ 0.20% 6$ 2014 510,000$ 156,183$ 353,817$ 0.08% 3$ 2015 345,000$ 221,763$ 123,237$ 0.03% 12$ 2016 175,000$ 259,622$ (84,622)$ ‐0.02% (8)$ 2017 ‐$ 265,929$ (265,929)$ ‐0.05% (25)$ 2018 ‐$ 276,916$ (276,916)$ ‐0.06% (26)$
Note: Details regarding the Cityʹs outstanding debt can be found in the notes to the financial statements
(1)
(2)(3)(4)
This is the amount restricted for debt service principal payments.See the Schedule of Assessed and Estimated Actual Value of Property for property value data.Population data can be found in the Schedule of Demographic and Economic Statistics.
City of Bellmead, TexasRatios of General Bonded Debt Outstanding
Last Ten Fiscal Years
This is the general bonded debt of both governmental and business‐type activities, net of original issuance discounts and premiums.
122
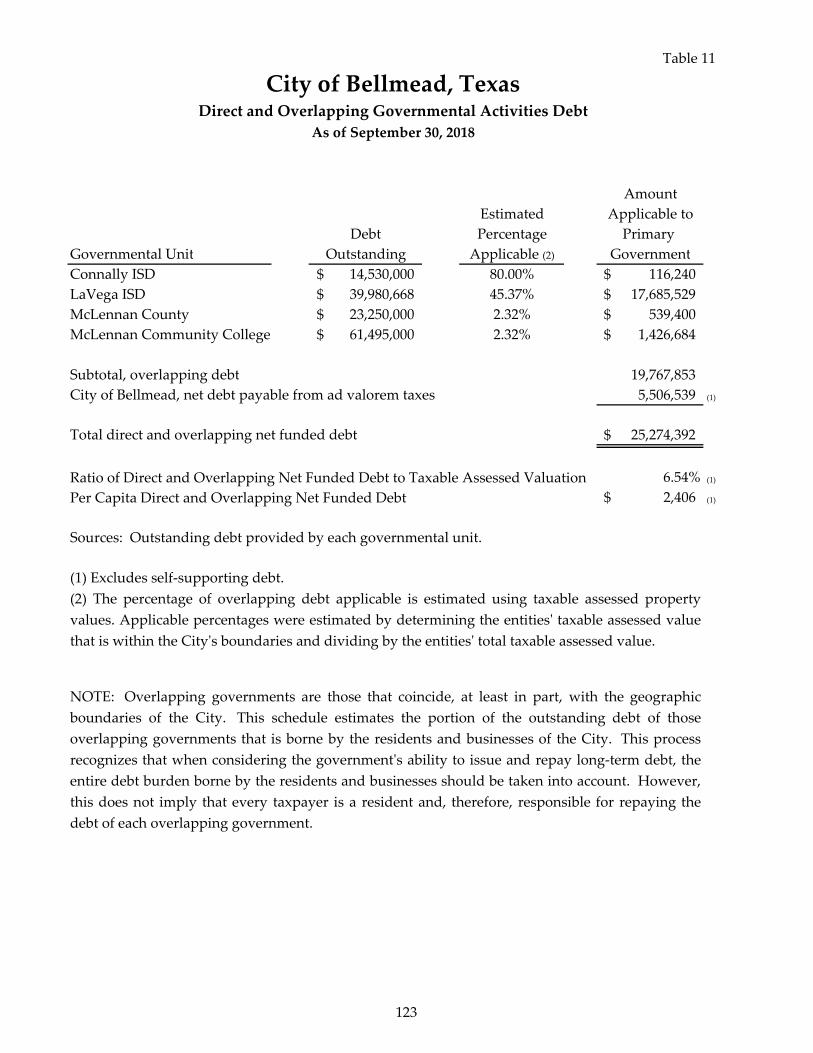
Table 11
Amount Estimated Applicable to Debt Percentage Primary Governmental Unit Outstanding Applicable (2) GovernmentConnally ISD 14,530,000$ 80.00% 116,240$ LaVega ISD 39,980,668$ 45.37% 17,685,529$ McLennan County 23,250,000$ 2.32% 539,400$ McLennan Community College 61,495,000$ 2.32% 1,426,684$
Subtotal, overlapping debt 19,767,853
City of Bellmead, net debt payable from ad valorem taxes 5,506,539 (1)
Total direct and overlapping net funded debt 25,274,392$
Ratio of Direct and Overlapping Net Funded Debt to Taxable Assessed Valuation 6.54% (1)
Per Capita Direct and Overlapping Net Funded Debt 2,406$ (1)
Sources: Outstanding debt provided by each governmental unit.
(1) Excludes self‐supporting debt.(2) The percentage of overlapping debt applicable is estimated using taxable assessed propertyvalues. Applicable percentages were estimated by determining the entitiesʹ taxable assessed valuethat is within the Cityʹs boundaries and dividing by the entitiesʹ total taxable assessed value.
NOTE: Overlapping governments are those that coincide, at least in part, with the geographicboundaries of the City. This schedule estimates the portion of the outstanding debt of thoseoverlapping governments that is borne by the residents and businesses of the City. This processrecognizes that when considering the governmentʹs ability to issue and repay long‐term debt, theentire debt burden borne by the residents and businesses should be taken into account. However,this does not imply that every taxpayer is a resident and, therefore, responsible for repaying thedebt of each overlapping government.
City of Bellmead, TexasDirect and Overlapping Governmental Activities Debt
As of September 30, 2018
123

124

Table 12
Fiscal YearAssessed Value,
Tax Roll
Legal Debt Limit
PercentageLegal Debt
Limit
Actual Amount Expended for
General Obligation Debt Service During
the Year
2009 308,924,786$ 1.50% 4,633,872$ 200,000$ 2010 325,553,912$ 1.50% 4,883,309$ 271,490$ 2011 323,436,875$ 1.50% 4,851,553$ 265,810$ 2012 328,284,022$ 1.50% 4,924,260$ 278,977$ 2013 337,419,716$ 1.50% 5,061,296$ 300,048$ 2014 356,138,881$ 1.50% 5,342,083$ 299,982$ 2015 365,356,062$ 1.50% 5,480,341$ 296,875$ 2016 381,613,115$ 1.50% 5,724,197$ 304,001$ 2017 407,683,002$ 1.50% 6,115,245$ 305,110$ 2018 386,694,501$ 1.50% 5,800,418$ 300,656$
Source: McLennan County Appraisal District and Finance Department, City of Bellmead
City of Bellmead, TexasLegal Debt Margin Information
September 30, 2018
All taxable property within the City is subject to the assessment, levy, and collection by the City of acontinuing, direct annual ad valorem tax sufficient to provide for the payment of principal of andinterest on all ad valorem tax debt within the limits prescribed by law. Article XI, Section 5, of the TexasConstitution limits the maximum ad valorem tax rate for home‐rule cities such as the City to $2.50 per$100 taxable assessed valuation for all purposes. Administratively, the Attorney General of the State ofTexas will permit allocation of $1.50 of the $2.50 maximum rate for all general obligation debt servicecalculated at the time of issuance based on 90% tax collections.
125

NetRevenueAvailable
Fiscal Gross Operating for DebtYear Revenue Expenses * Service Principal Interest
2009 2,611,295$ 2,411,298$ 199,997$ 163,989$ 68,064$ 2010 2,417,557$ 1,566,533$ 851,024$ 133,568$ 56,379$ 2011 2,591,099$ 1,479,491$ 1,111,608$ 139,579$ 47,295$ 2012 2,678,041$ 1,339,988$ 1,338,053$ 979,724$ 1,298$ 2013 2,672,771$ 1,528,841$ 1,143,930$ 180,000$ 13,693$ 2014 2,747,642$ 1,523,105$ 1,224,537$ 180,000$ 10,593$ 2015 2,643,494$ 1,667,878$ 975,616$ 165,000$ 137,401$ 2016 2,758,010$ 1,615,584$ 1,142,426$ 208,089$ 242,514$ 2017 3,446,800$ 3,113,204$ 333,596$ 300,000$ 188,881$ 2018 3,379,038$ 3,112,992$ 266,046$ 317,416$ 188,881$
Source: Finance Department, City of Bellmead
* Total operating expenses less depreciation
Debt Service Requirements
City of Bellmead, TexasRevenue Bond Coverage ‐ Water and Sewer Fund
Last Ten Fiscal Years
126

Table 13
Total Coverage
232,053$ 0.86189,947$ 4.48186,874$ 5.95981,022$ 1.36193,693$ 5.91190,593$ 6.42302,401$ 3.23450,603$ 2.54488,881$ 0.68506,297$ 0.53
Debt Service Requirements
127

Table 14
Waco Waco MSAMetropolitan PersonalStatistical Waco MSA Income
Fiscal Area (MSA) Per Capita (thousands UnemploymentYear Population Population Income of dollars) Rate
2009 9,901 249,441 30,144$ 7,519,261$ 6.7%2010 9,901 253,819 31,077$ 7,887,821$ 7.2%2011 9,982 255,615 32,239$ 8,240,751$ 7.4%2012 10,052 256,939 33,483$ 8,603,174$ 6.5%2013 10,127 258,633 33,940$ 8,778,110$ 6.1%2014 10,235 260,155 35,472$ 9,228,315$ 5.1%2015 10,303 262,361 37,023$ 9,713,471$ 4.1%2016 10,387 265,207 37,755$ 10,012,971$ 4.0%2017 10,503 268,696 39,263$ 10,549,900$ 3.3%2018 10,620 N/A N/A N/A 3.2%
N/A Not available
Sources:
City of Bellmead, TexasDemographic and Economic Statistics
Last Ten Fiscal Years
Estimated population and personal income information provided by the Bureau ofEconomic Analysisʹ Interactive Data application. Personal income information notavailable at the City level. Unemployment rates provided by the Bureau of LaborStatistics. 2018 rate is as of October.
128

Table 15
Name of Employer Business Category Employees Rank % of Total Employees Rank % of Total
La Vega ISD Education 533 1 27.12% NC ‐ ‐
HEB Grocery Grocery Store 350 2 17.81% NC ‐ ‐
Wal‐Mart Supercenter Retail Store 350 3 17.81% NC ‐ ‐
Samʹs Club Retail Store 250 4 12.72% NC ‐ ‐
Home Depot Retail Store 140 5 7.12% NC ‐ ‐
The Atrium Nursing Care 101 6 5.14% NC ‐ ‐
City of Bellmead Government 80 7 4.07% NC ‐ ‐
Scott & White Clinic Health Care 68 8 3.46% NC ‐ ‐
Holiday Inn Hotel/Motel 47 9 2.39% NC ‐ ‐
American Bank Financial/Banking 46 10 2.34% NC ‐ ‐
Total 1,965 100.00% ‐ ‐
Source: Bellmead Finance DepartmentNC: Not Collected
2009
City of Bellmead, TexasPrincipal Employers
Current Year and Nine Years Ago
2018
129

2009 2010 2011 2012 2013 2014General Fund
Administration 1.0 2.0 2.0 2.0 2.0 3.0
Finance 4.5 4.5 6.0 6.0 6.0 6.0
Police 25.5 27.5 28.0 28.0 28.0 28.0
Municipal Court 2.0 2.0 3.0 3.0 3.0 3.0
Fire 12.0 10.0 11.0 11.0 13.0 14.0
Streets 9.0 8.0 6.0 6.0 6.0 5.0
City Garage 1.0 1.0 1.0 1.0 1.0 1.0
Parks and Recreation 3.0 3.0 2.0 2.0 1.0 1.0
Planning and Inspections 1.0 1.0 1.0 1.0 ‐ ‐ Total General Fund 59.0 59.0 60.0 60.0 60.0 61.0
Water/Sewer Fund
Public Works 7.0 10.0 7.0 7.0 7.0 7.0
Total Water/Sewer Fund 7.0 10.0 7.0 7.0 7.0 7.0
Special Revenue Funds
Grants Fund ‐ ‐ ‐ ‐ ‐ 2.0 Civic Center ‐ ‐ 3.0 3.0 3.0 4.0
Street Maintenance Fund ‐ ‐ 1.0 1.0 1.0 1.0
Total Special Revenue Fund ‐ ‐ 4.0 4.0 4.0 7.0 Total Personnel 66.0 69.0 71.0 71.0 71.0 75.0
City of Bellmead, TexasFull‐time Equivalent Employees by Function
Last Ten Fiscal Years
Fiscal Year
130
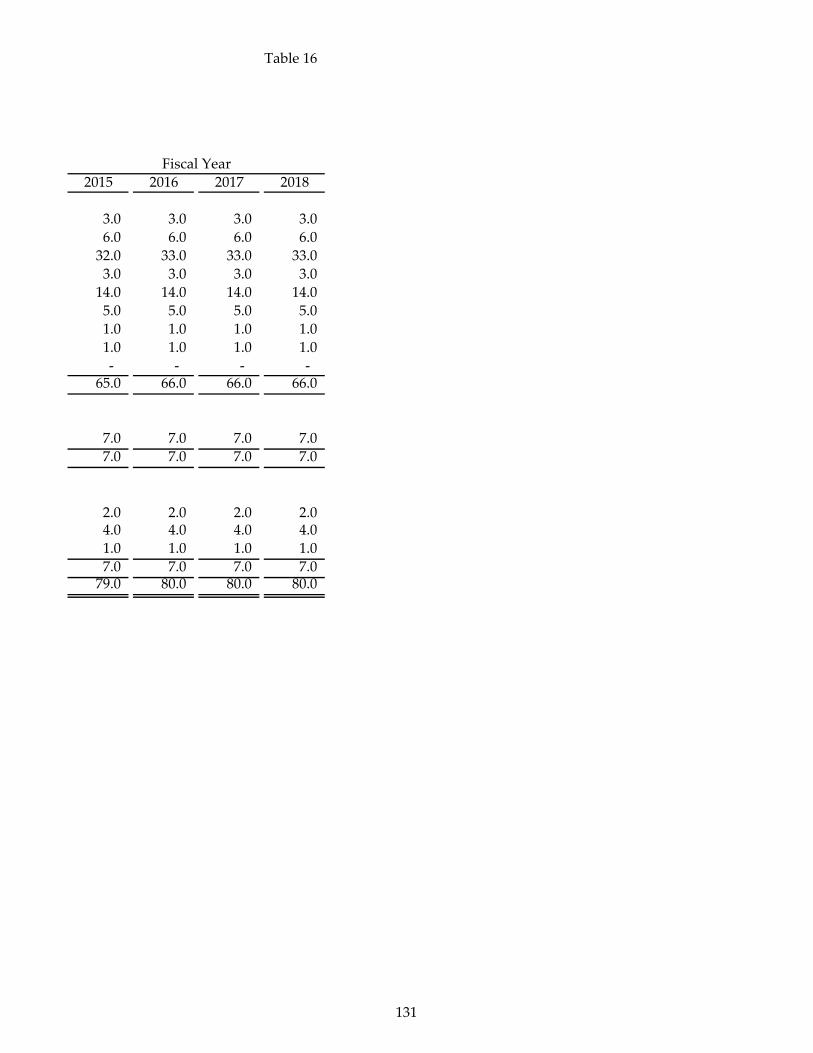
Table 16
2015 2016 2017 2018
3.0 3.0 3.0 3.0
6.0 6.0 6.0 6.0
32.0 33.0 33.0 33.0
3.0 3.0 3.0 3.0
14.0 14.0 14.0 14.0
5.0 5.0 5.0 5.0
1.0 1.0 1.0 1.0
1.0 1.0 1.0 1.0
‐ ‐ ‐ ‐ 65.0 66.0 66.0 66.0
7.0 7.0 7.0 7.0
7.0 7.0 7.0 7.0
2.0 2.0 2.0 2.0 4.0 4.0 4.0 4.0
1.0 1.0 1.0 1.0
7.0 7.0 7.0 7.0 79.0 80.0 80.0 80.0
Fiscal Year
131

2009 2010 2011 2012Governmental
Refuse Accounts 2,930 2,993 2,991 2,988 Municipal Court
Oustanding Warrants NC NC NC NCWarrants Issued 3,933 440 19 306
Public Safety
Police
Calls for Service 11,414 13,520 13,010 17,615
911 Calls 7,359 8,799 8,391 9,276
Citations 3,584 3,902 3,408 3,362
Traffic Accidents 543 369 510 533
Arrests 1,910 2,595 1,728 1,570
Reports NC NC 3,641 4,167
Police‐Code Enforcement
Calls for Service NC NC NC NCReports NC NC NC NC
Police‐Animal Control
Calls for Service NC NC NC NCCitations NC NC NC NCTaken to Shelter NC NC NC NCTNR NC NC NC NCReports NC NC NC NC
Fire
Fire Emergency Responses 1,132 1,193 1,319 1,554
Fire Inspections 67 107 97 58
Fire Investigations 21 14 9 15
Plans Reviewed NC NC NC NCFire‐Building Inspections
Buliding Permits Issued 814 779 823 890
Building Inspections 725 478 143 620
Civic Center
Room Rentals NC NC NC NCPublic Works
Service Orders Completed 1,217 1,934 344 42
Streets
Service Orders Completed 1,184 1,758 65 111
Water
Metered Accounts 3,353 3,397 3,419 3,421
Avg. Daily Demand (MGD) 1.279 1.153 1.204 1.328
Avg. Monthly Demand/Cust (gal) 38,912,000 35,070,000 35,924,000 33,835,000
Peak Demand (MGD) 1.609 1.350 1.479 1.390
Service Orders Completed 2,784 2,584 2,929 3,438 Sewer
Service Connections 3,214 3,259 3,274 3,277
Service Orders Completed 28 31 10 30
NC: Not Collected
City of Bellmead, TexasOperating Indicators by Function
Last Ten Fiscal Years
Fiscal Year
132

Table 17
2013 2014 2015 2016 2017 2018
3,007 3,046 3,082 3,256 3,341 3,405
10,981 12,999 14,772 14,742 15,788 15,680
183 821 382 560 333 181
16,236 17,749 17,963 16,172 15,558 16,121
9,869 10,831 10,617 9,525 8,270 10,515
2,233 2,368 2,786 1,066 1,184 1,351
589 483 326 360 296 298
2,180 1,809 1,673 756 1,063 917
3,930 4,473 4,158 3,490 4,985 5,913
NC NC 467 530 441 507
NC NC 347 300 213 116
NC 1,507 1,389 1,188 1,090 1,201
NC 34 51 174 59 51
NC 370 301 202 209 260
NC 225 240 174 ‐ ‐
NC NC 484 300 241 264
1,902 1,821 1,612 1,317 1,567 1,637
54 36 55 98 174 217
16 9 16 9 17 14
NC 1 3 9 23 34
837 855 791 805 779 759
230 926 762 765 799 901
114 136 211 226 216 209
52 42 51 105 126 202
138 163 262 213 182 206
3,416 3,501 3,490 3,566 3,573 3,577
1.164 1.003 1.174 1.215 1.163 1.186
33,332,000 30,836,000 35,205,000 37,073,000 35,073,000 36,115,000
1.426 1.291 1.583 1.699 1.400 1.515
3,372 3,105 3,398 3,380 2,843 2,957
3,275 3,343 3,340 3,407 3,402 3,419
124 125 153 130 150 155
Fiscal Year
133

2009 2010 2011 2012 2013General Government
Area of City (square miles) NC NC 6.21 6.21 6.21Public Safety
PolicePolice Stations 1 1 1 1 1 Firing Ranges 1 1 1 1 1 Patrol Vehicles NC NC 12 12 12 Other Police Vehicles NC NC NC 6 6 Animal Control Vehicles NC NC 1 1 1
FireFire Stations 1 1 1 1 1 Fire Apparatus 7 7 7 7 7 Other Vehicles 2 2 2 2 2
Public WorksBuildings 2 2 2 2 2 Paved Streets (miles) 62.63 62.63 62.63 62.63 62.63 Unpaved Streets (miles) 1 1 1 1 1 Curb and Gutter (miles) 30 30 30 30 30 Vehicles 20 20 20 20 20
Parks and RecreationCivic Center 1 1 1 1 1 Parks 4 4 4 4 4 Pavilions 6 6 6 6 6 Playgrounds 3 3 3 3 3 Jogging/Walking Trails 1 1 1 1 1 Senior Centers 1 1 1 1 1 Splash Pad 1 1 1 1 1
WaterRated Daily Capacity (gpd) 3,067,200 3,067,200 3,067,200 3,067,200 3,067,200 Storage Capacity (gallons) 4,856,000 4,856,000 4,856,000 4,856,000 4,856,000 Water Mains (miles) 60 60 60 60 60 Water Wells 5 5 5 5 5 Fire Hydrants 321 321 322 322 322
SewerSanitary Sewers (miles) 43.80 43.80 43.80 43.80 43.80 Manholes 568 568 568 568 568
NC: Not Collected
City of Bellmead, TexasCapital Asset Statistics by Function
Last Ten Fiscal Years
Fiscal Year
134

Table 18
2014 2015 2016 2017 2018
6.21 0.21 6.21 6.21 6.21
1 1 1 1 1 1 1 1 1 1
12 15 15 15 15 6 6 8 9 9 1 1 1 1 1
1 1 1 1 1 7 7 7 7 7 2 2 2 2 2
2 2 2 2 2 62.63 63.10 63.10 63.10 63.10
1 1 1 1 1 30 30 30 30 30 20 20 20 20 20
1 1 1 1 1 4 4 4 4 4 6 6 6 6 6 3 3 3 3 3 1 1 1 1 1 1 1 1 1 1 1 1 1 1 1
3,067,200 3,067,200 3,067,200 3,067,200 3,067,200 4,856,000 4,856,000 4,856,000 4,856,000 4,856,000
60 60 60 60 60 5 5 5 5 5
322 326 326 326 326
43.80 43.80 43.80 43.80 43.80 568 573 573 573 573
Fiscal Year
135

136

Table 19
Water Rates
Water Consumption (gals) Residential Sprinkler CommercialOutside City
Limits0 ‐ 2,000 17.00$ 17.00$ 17.00$ 17.00$ >2,000 $ 3.50/1,000 $ 4.50/1,000 $ 3.71/1,000 $ 5.20/1,000
Wastewater Rates
Water Consumption (gals) Residential Commercial0‐1,000 9.50$ 9.50$ 1,001‐5,750 $ 2.00/1,000 $ 2.50/1,000>5,751 ‐ $ 2.50/1,000
City of Bellmead, TexasWaterworks and Sewer System Revenue Bond Tables
Monthly Water and Wastewater Rates (Effective 10/1/2016)
All multiple units will be charged a minimum bill for Water and Wastewater for each unit, as well as a redientialrate on water and wastewater, regardless of the number of water and wastewater taps they have.
137

2013 2014 2015 2016Revenues: (1) 2,681,105$ 2,760,460$ 2,653,876$ 2,758,010$ Expenditures: (2) 1,528,841$ 1,523,105$ 1,667,878$ 2,079,183$ Net Available for Debt Service 1,152,264$ 1,237,355$ 985,998$ 678,827$
Customer Count:Water 3,389 3,454 3,455 3,506Sewer 3,276 3,356 3,357 3,408
(1) Revenues do not include developer contributions for donated water and sewer lines.(2) Expenditures do not include depreciation.
Fiscal Year
City of Bellmead, TexasWaterworks and Sewer System Revenue Bond Tables
Waterworks and Sewer System Condensed Statement of Operations
(3) During Fiscal Year 2015, two of the Cityʹs water wells failed and were replaced at a one‐time cost of $350,000.
(3)
138

Table 20
2017 20182,771,776$ 3,472,778$ 2,425,847$ 2,539,107$ 345,929$ 933,671$
3,517 3,5773,419 3,419
139

140

OVERALL COMPLIANCE AND INTERNAL CONTROL
SECTION
141

142

143
14950 Heathrow Forest Pkwy | Suite 530 | Houston, TX 77032 | Tel: 281.907.8788 | Fax: 888.875.0587 | www.BrooksWatsonCo.com
REPORT ON INTERNAL CONTROL OVER FINANCIAL REPORTING AND ON COMPLIANCE
AND OTHER MATTERS BASED ON AN AUDIT OF FINANCIAL STATEMENTS PERFORMED
IN ACCORDANCE WITH GOVERNMENT AUDITING STANDARDS
To the Honorable Mayor and
Members of the City Council
City of Bellmead, Texas:
We have audited, in accordance with auditing standards generally accepted in the United States of
America and the standards applicable to financial audits contained in Government Auditing Standards
issued by the Comptroller General of the United States, the financial statements of the governmental
activities, the business-type activities, the discretely presented component unit, each major fund,
and the aggregate remaining fund information of the City of Bellmead, Texas (the “City”) as of and
for the year ended September 30, 2018, and the related notes to the financial statements, which
collectively comprise the City’s basic financial statements, and have issued our report thereon dated
March 25, 2019.
Internal Control over Financial Reporting
In planning and performing our audit of the financial statements, we considered the City’s internal
control over financial reporting (internal control) to determine the audit procedures that are
appropriate in the circumstances for the purpose of expressing our opinions on the financial
statements, but not for the purpose of expressing an opinion on the effectiveness of the City’s
internal control. Accordingly, we do not express an opinion on the effectiveness of the City’s internal
control.
A deficiency in internal control exists when the design or operation of a control does not allow
management or employees in the normal course of performing their assigned functions, to
prevent, or detect and correct misstatements on a timely basis. A material weakness is a deficiency,
or a combination of deficiencies, in internal control, such that there is a reasonable possibility that
a material misstatement of the entity’s financial statements will not be prevented, or detected and
corrected on a timely basis. A significant deficiency is a deficiency, or a combination of deficiencies,
in internal control that is less severe than a material weakness, yet important enough to merit
attention by those charged with governance.
Our consideration of internal control over financial reporting was for the limited purpose described
in the first paragraph of this section and was not designed to identify all deficiencies in internal
control over financial reporting that might be material weaknesses or significant deficiencies. Given

144
these limitations, during our audit we did not identify any deficiencies in internal control over
financial reporting that we consider to be material weaknesses. However, material weaknesses may
exist that have not been identified.
Compliance and Other Matters
As part of obtaining reasonable assurance about whether the City’s financial statements are free
from material misstatement, we performed tests of its compliance with certain provisions of laws,
regulations, contracts, and grant agreements, noncompliance with which could have a direct and
material effect on the determination of financial statement amounts. However, providing an opinion
on compliance with those provisions was not an objective of our audit and, accordingly, we do not
express such an opinion. The results of our tests disclosed no instances of noncompliance or other
matters that are required to be reported under Government Auditing Standards.
We noted certain matters that we have reported to management of the City in a separate letter dated
March 25, 2019.
Purpose of this Report
The purpose of this report is solely to describe the scope of our testing of internal control and
compliance and the results of that testing, and not to provide an opinion on the effectiveness of the
entity’s internal control or on compliance. This report is an integral part of an audit performed in
accordance with Government Auditing Standards in considering the entity’s internal control and
compliance. Accordingly, this communication is not suitable for any other purpose.
BrooksWatson & Co., PLLC
Certified Public Accountants
Houston, Texas
March 25, 2019

City of Bellmead, TexasSCHEDULE OF FINDINGS AND RESPONSES
For the Year Ended September 30, 2018
145
I. SUMMARY OF AUDITOR’S RESULTS:
Financial Statements
Type of auditor’s report issued:
The auditor’s report on the basic financial statements of the City expresses an unmodified opinion.
Internal control over financial reporting:
Are any material weaknesses identified? ___ Yes _X_ No
Are any significant deficiencies identified not
considered to be material weaknesses? ___ Yes _X_ None Reported
Is any noncompliance material to financial
statements noted? ___ Yes _X_ No
II. FINANCIAL STATEMENT FINDINGS:
None.

City of Bellmead, TexasSUMMARY SCHEDULE OF PRIOR AUDIT FINDINGS
For the Year Ended September 30, 2018
146
I. SUMMARY OF PRIOR YEAR AUDIT FINDINGS:
None.

City of Bellmead, TexasCORRECTIVE ACTION PLAN
For the Year Ended September 30, 2018
147
I. CORRECTIVE ACTION PLAN:
Not applicable.