Embed Size (px)
Citation preview

The Finance Department P.O. Box 619428
DFW Airport, Texas 75261-942
FISCAL YEAR 2011 DFW AIRPORT
COMPREHENSIVE ANNUAL FINANCIAL REPORT
Dallas/Fort Worth International Airport, Texas
COMPREHENSIVE
ANNUAL FINANCIAL REPORT
FOR THE FISCAL YEAR ENDED
SEPTEMBER 30, 2011
(With Independent Auditors’ Report Thereon)
Prepared by Department of Finance
Christopher A. Poinsatte
Executive Vice President and Chief Financial Officer
Dallas/Fort Worth International Airport Comprehensive Annual Financial Report
For the Fiscal Year Ended September 30, 2011
Table of Contents
Introductory Section (Unaudited) Page
Transmittal Letter i Airport Board of Directors/Airport Officials vi Airport Organizational Chart vii Government Finance Officers Association Certificate of Achievement for Excellence In Financial Reporting viii
Financial Section
Independent Auditors’ Report 1 Management’s Discussion and Analysis (Unaudited) 3
Basic Financial Statements
Statement of Net Assets 19 Statement of Revenues, Expenses, and Changes in Net Assets 20 Statement of Cash Flows 21 Statement of Fiduciary Net Assets 22 Statement of Changes in Fiduciary Net Assets 23 Notes to the Basic Financial Statements 24
Required Supplementary Information (Unaudited)
Schedule of Funding Progress – Pension 52 Schedule of Funding Progress – Other Post Employment Benefits 53 Other Supplementary Information
Combining Statements of Fiduciary Net Assets 54 Combining Statements of Changes in Fiduciary Net Assets 55
Statistical Section (Unaudited) Financial Trends Information (Unaudited) Net Assets by Component – Last Seven Fiscal Years 56
Changes in Net Assets – Last Seven Fiscal Years 57 Operating Expenses by Source – Last Ten Fiscal Years 58 Revenue Capacity Information (Unaudited) Operating Revenues by Source – Last Ten Fiscal Years 59 Settlement History – Last Ten Fiscal Years 60 Key Parking Financial and Operational Information – Last Eight Fiscal Years 61 Key Terminal Concessions Financial and Operational Information – Last Eight Fiscal Years 62 Debt Capacity Information (Unaudited) Debt and Debt Service Ratios – Last Ten Fiscal Years 63 Joint Revenue Bond Coverage – Last Ten Fiscal Years 64
Dallas/Fort Worth International Airport
Comprehensive Annual Financial Report For the Fiscal Year Ended September 30, 2011
Table of Contents
Economic Information – (Unaudited) Top Ten Customers - Revenues – Last Ten Fiscal Years 65 Dallas-Fort Worth-Arlington Metropolitan Statistical Area (MSA) Demographic and Economic Information – Ten Calendar Years 66 Operating Information - (Unaudited) Activity Statistics – Last Ten Fiscal Years 67 Aircraft Operations – Last Eight Fiscal Years 68 Enplaned Passengers by Airline – Last Seven Fiscal Years 69 Enplanement Statistics – Last Eight Fiscal Years 70 Landed weights and Cargo Tonnage - Last Eight Fiscal Years 71 Key Rental Cars and Operational Information - Last Eight Fiscal Years 72 Key Commercial Development Financial and Operational Information –Last Eight Fiscal Years 73 Key Natural Gas Financial and Operational Information – Last Eight Fiscal Years 74 Grant Awards History – Last Ten Fiscal Years 75 Enplaned Passengers by Month – Last Ten Fiscal Years 76 Landed Weights by Airline – Last Ten Fiscal Years 77 Landed Weights by Month – Last Ten Fiscal Years 78 Employee Force – End of Year – Last Ten Fiscal Years 79 Capital Assets as of Function of Operations 80 Schedule of Insurance in Force – September 30, 2011 81

INTRODUCTORY SECTION
i
February 7, 2012 To the Public: Enclosed herein is the Comprehensive Annual Financial Report (CAFR) of the Dallas/Fort Worth International Airport Board (DFW or the Airport), for the fiscal year ended September 30, 2011. Responsibility for both the accuracy of the data and the completeness and fairness of the presentation, including all disclosures, rests with DFW management. To the best of management’s knowledge and belief, the enclosed information is accurate in all material respects and reported in a manner that presents fairly the financial position and results of operations of DFW. All disclosures necessary to enable the reader to gain an understanding of DFW’s financial activities have been included. The Comprehensive Annual Financial Report is presented in three sections: Introductory, Financial, and Statistical. The Introductory Section, which is unaudited, includes this Transmittal Letter, a list of Board Members and Airport Officials, DFW’s Organizational Chart, and Award. The Financial Section includes the Independent Auditors’ Report, Management’s Discussion and Analysis (MD&A), Basic Financial Statements, Required Supplementary Information, and Other Supplementary Information. The Statistical Section, which is unaudited, includes selected financial trends, revenue capacity, debt capacity, economic and operating activity presented on a multi-year basis. Generally Accepted Accounting Principles (GAAP) require that management provide a narrative overview and analysis to accompany the financial statements in the form of MD&A. This Transmittal Letter should be read in conjunction with the MD&A, which can be found immediately following the Independent Auditors’ Report in the Financial Section. DFW Overview DFW was created by a Contract and Agreement between the Cities of Dallas and Fort Worth (the Cities), dated April 15, 1968, for the purpose of developing and operating an airport as a joint venture between the Cities. DFW’s Board of Directors (the Board) consists of seven members appointed by the City of Dallas and four members appointed by the City of Fort Worth. The Board also includes one nonvoting member who rotates on an annual basis between the cities of Coppell, Euless, Grapevine, and Irving. In addition to this Contract and Agreement, DFW is governed by several other key documents including the 30th Supplemental Bond Ordinance which amended the original 1968 Concurrent Bond Ordinance (collectively called the “Bond Ordinances”); and the Lease and Use Agreements (Use Agreement) which defines DFW’s rate setting methodology and business relationships with the airlines. DFW and the signatory airlines agreed to a new ten-year Use Agreement in FY 2011 with an effective date of October 1, 2010. Collectively, these documents are called the “Controlling Documents.” Local Economy
DFW Airport is located between the Cities of Dallas and Fort Worth and is the principal air carrier facility serving the North Central Texas region and the Dallas/Fort Worth metropolitan area (the “Metroplex”). The Metroplex contains 25 percent of the state’s population and 26 percent of the labor force. Population growth, corporate relocations, and business diversity are significant drivers of the Airport’s business. DFW’s central North American location makes it the preeminent U.S. hub and connecting point for the entire continent. DFW’s strategic central location, superior air service, and diverse economy are the major reasons that businesses relocate to the area and propel the Metroplex to be the fastest-growing metropolitan market in the United States with one of the most stable economies. There are 20 Fortune 500 companies headquartered in the Metroplex with nearly 86,000 local employees. The region’s diverse economy has enabled it to weather economic downturns in key sectors.
ii
DFW is known as the economic engine for the North Texas region with an estimated annual impact of $16.6 billion, 305,000 jobs, and $7.6 billion in payroll based on the most recent TXDOT study using data from 2005. These jobs consist of airport and airline employees, as well as construction, maintenance, hospitality and tourism employees. FY 2011 in Review DFW implemented the new Use Agreement and began the first stages of the $1.9 billion Terminal Renewal and Improvement Program (TRIP). DFW continued to focus on its primary business goal of growing the core business by adding new international and domestic destinations and on its four key strategic results: to keep DFW cost competitive and financially strong, to ensure customer satisfaction, to deliver operational excellence, and to foster employee engagement. Each of these elements is discussed further below. New Use Agreement The new Use Agreement created three primary cost centers: the “Airfield”, “Terminal”, and “DFW.” The airfield and terminal cost centers are “residual” in nature. The new agreement requires the airlines pay the net cost of the airfield and terminals primarily through landing fees and terminal rentals (Airfield and Terminal Cost Centers) and DFW retains the net revenues from the concessions, parking, rental car, and commercial development business units (i.e., non-airline revenues) less the cost of the Skylink people-mover system in the DFW Cost Center. DFW can only charge the airlines for the net cost to operate these cost centers (including debt service) primarily through landing fees and terminal rentals. The Use Agreement also requires certain cash transfers from capital accounts to the 102 Fund each year. DFW charges market rates for DFW cost center services. Revenues earned in excess of expenses for the DFW cost center (up to a predefined limit) are transferred to the DFW capital account to be used primarily for capital renewals and replacements on the Airport. See a further discussion of the Use Agreement in the MD&A section. Terminal Renewal and Improvement Program (“TRIP”) TRIP is the largest component of DFW’s capital improvement program. The TRIP is budgeted at $1.9 billion between FY 2010 and FY 2017. TRIP will provide renovation and renewal of the Airport’s four oldest terminals (A, B, C, and E) that were constructed between 35 and 40 years ago. These terminals have been expanded and renovated over their life, but primarily consist of their original structural and building systems. Approximately two-thirds of the TRIP budget will be used for the replacement of aging systems such as electrical, plumbing, heating and cooling, security, fire safety, conveyances, telecommunications, lighting, information technology systems, as well as replacement of jetbridges in Terminals A and C. The majority of the remaining budget will be used to upgrade ticket halls, TSA security areas, certain baggage systems, and concessions villages. The TRIP also includes modest improvements to the terminal exteriors, entrances, and parking structures. Grow the Core Business Enplanements were 28.9 million in FY 2011, a 2.4% improvement over the prior year primarily driven by new air service and higher load factors spurred by American Airlines, low cost carriers, and international carriers. Despite poor global economic conditions, DFW added or announced the addition of 22 new air carrier/destination combinations during FY 2011. DFW expanded international service to 47 destinations, nine more than in FY 2010. New international service was initiated to Barbados and Rio de Janeiro by American Airlines; to Queretaro, Veracruz, Mazatlan, and Morelia, Mexico by American Eagle; to Brisbane and Sydney, Australia by Qantas; to Punta Cana, Dominican Republic by Sun Country; and announced to Dubai, United Arab Emirates, by Emirates Airlines (beginning in February 2012). New domestic service to new destinations by different carriers included Joplin, Springfield, Grand Island, Durango, and Aspen by American Eagle; Los Angeles and San Francisco by Virgin America; and Chicago, Fort Lauderdale, and Las Vegas by Spirit Airlines. New cargo destinations included Shanghai, China by Air China and Brussels, Belgium by Korean Air. Recently, Jet Blue announced it would begin service to Boston in FY 2012.
iii
Keep DFW Cost Competitive and Financially Strong
DFW is in a financially strong position with total cash and investments of $1.2 billion and total unrestricted cash and investments of $573.0 million as of September 30, 2011. Unrestricted cash and investments are sufficient to cover more than 600 days of operating expenses. Although DFW’s defined benefit pension plans and Other Post Employment Benefits plan (OPEB) have unfunded liability balances, DFW has been prefunding the plan in the past and has a net pension and OPEB asset of $56.7 million as of September 30, 2011. DFW is rated A+ by Fitch, A1 by Moody’s, and A+ by Standard and Poor’s.
Total 102 Operating Fund expenditures were $565.9 million, a $20.0 million (5.1%) decrease from FY 2010 primarily due to the restructuring of DFW’s debt portfolio. DFW has been aggressively managing costs over the past five years. Operating expenses have grown only $1 million over the past six years due to innovative cost management techniques. The airline industry uses passenger airline cost per enplanement (CPE) as a key productivity measure. CPE is calculated by dividing airline cost (total passenger airline payments for landing fees and terminal rents, less airline rebates for new air service) by the number of enplanements. DFW’s CPE in FY 2011 was $6.30, a decrease of $0.44 (6.50%) from $6.74 in FY 2010, primarily due to lower airline cost and higher enplanements. Total airline cost was $190.5 million, a decrease of $10.4 million (5.2%) from $200.9 million in FY 2010 primarily due to lower debt service and higher non-airline revenues.
An important new metric for DFW in FY 2011 is net revenues from the DFW Cost Center. DFW’s goal is to maximize net revenues from the non-airline business units (parking, concessions, rental car and commercial development). In FY 2011, these four business units generated a record $225 million in revenues, a $22 million (11%) improvement over budget. Total non-airline revenues in the DFW Cost Center were $314.7 million in FY 2011. After expenses (which includes Skylink costs) and debt service, the net revenues of this cost center were $71.9 million, $21.6 million (42.9%) better than budget. Since net revenues exceeded the “upper threshold” of $60 million, DFW generated an $8.9 million “true-up credit” that will be used in FY 2012 to reduce landing fees. This credit is recorded as a liability.
Ensure Customer Satisfaction
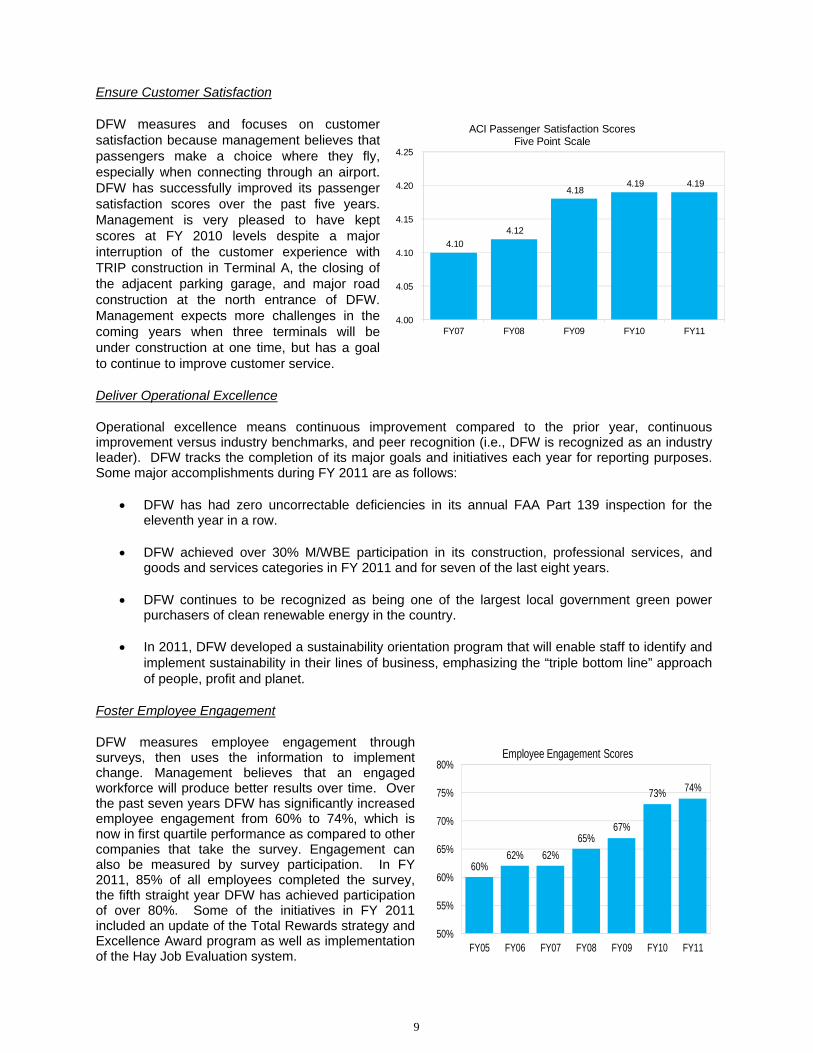
DFW measures and focuses on customer satisfaction because management believes that passengers make a choice where they fly, especially when connecting through an airport. DFW has successfully improved its passenger satisfaction scores over the past five years. Management is very pleased to have kept scores at FY 2010 levels despite a major interruption of the customer experience with TRIP construction in Terminal A, the closing of the adjacent parking garage, and major road construction at the north entrance of DFW.
Deliver Operational Excellence
Operational excellence means continuous improvement compared to the prior year, continuous improvement versus industry benchmarks, and peer recognition (i.e., DFW is recognized as an industry leader). DFW tracks the completion of its major goals and initiatives each year for reporting purposes. Some major accomplishments during FY 2011 are as follows:
DFW has had zero uncorrectable deficiencies in its annual FAA Part 139 inspection for the eleventh year in a row.
DFW achieved over 30% M/WBE participation in its construction, professional services, and goods and services categories in FY 2011 and for seven of the last eight years.
DFW continues to be recognized as being one of the largest local government green power purchasers of clean renewable energy in the country.
iv
In 2011, DFW developed a sustainability orientation program that will enable staff to identify and implement sustainability in their lines of business emphasizing the “triple bottom line” approach of people, profit and planet.
Foster Employee Engagement
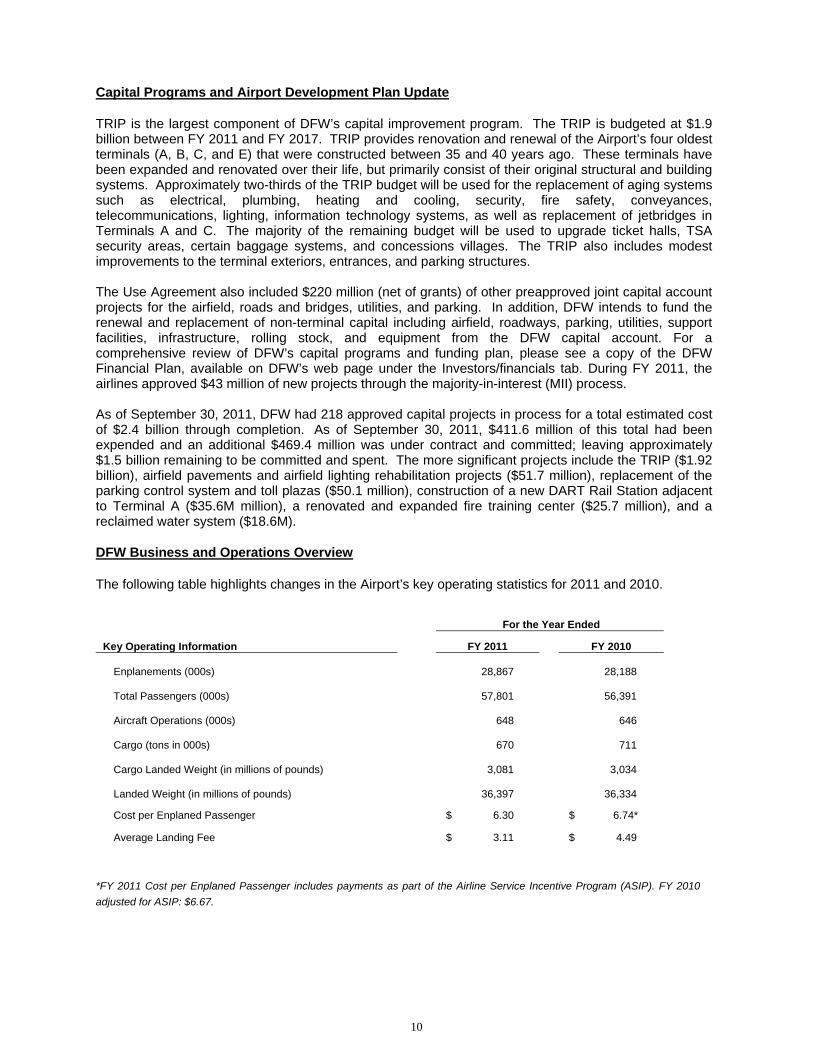
DFW measures employee engagement through surveys, then uses the information to implement change. Management believes that an engaged workforce will produce better results over time. Over the past seven years DFW has significantly increased employee engagement from 60% to 74%, which is now in first quartile performance as compared to other companies that take the survey. Engagement can also be measured by survey participation. In FY 2011, 85% of all employees completed the survey, the fifth straight year DFW has achieved participation of over 80%. Some of the initiatives in FY 2011 included an update of the Total Rewards strategy and Excellence Award program as well as implementation of the Hay Job Evaluation system.
AMR Bankruptcy On November 29, 2011, AMR Corporation, the parent company of American Airlines, Inc. (“AA”), AA, American Eagle, Inc., and other affiliates of AMR, filed voluntary petitions for Chapter 11 reorganization in the U.S. Bankruptcy Court for the Southern District of New York. AMR is DFW’s largest tenant representing approximately 85% and 78% of DFW’s passenger traffic and landed weights, respectively. AMR leases 100% of the terminal space in Terminals A, B, and C and approximately 60% of the space in Terminal D. DFW is AMR’s largest hub representing approximately 40% of AMR’s total traffic. AMR paid DFW approximately $173 million, 30% of the 102 Fund operating and debt service costs incurred in FY 2011. The prepetition accounts receivable balance due from AMR was approximately $11.9 million as of the date of filing. In addition to the Use Agreement, AMR has 13 other lease agreements with DFW for hangars, operating and maintenance facilities, and a fueling facility as part of a fueling consortium representing approximately $12.1 million of lease income per year to DFW. AMR was current on predominantly all post petition liabilities as of December 31, 2011. DFW has initiated design and construction of a seven-year $1.9 billion Terminal Renovation and Improvement Program (TRIP) to renovate Terminals A, B, C, and E. AMR and the other signatory airlines approved the TRIP and associated debt financing as part of the Use Agreement that became effective October 1, 2010. AMR informed DFW subsequent to the bankruptcy filing that it desires to continue with the TRIP as scheduled. AMR also approved nine new capital projects totaling $231.4 million subsequent to the filing, including a Terminal B gate expansion (operated by American Eagle) and a new replacement Terminal A parking garage. DFW’s bond ratings of A+ (Standard & Poor’s), A1 (Moody’s), and A+ (Fitch) have not changed since the bankruptcy filing. However, Moody’s and Fitch did revise their outlooks for DFW bonds from stable to negative. Standard & Poor’s has not made a revision to their outlook at this time. DFW has received no indication that the negative outlooks will have any impact on DFW’s ability to issue future bonds or that there will be a significant impact on interest rates. Financial Information The DFW Board and management are responsible for establishing and maintaining internal controls designed to ensure that the assets of DFW are protected from loss, theft, or misuse, and to ensure that adequate accounting data is compiled to allow for preparation of financial statements in conformity with generally accepted accounting principles. Internal controls are designed to provide reasonable, but not absolute, assurance that these objectives are met. The concept of reasonable assurance recognizes that the cost of a control should not exceed the benefits likely to be derived, and the valuation of costs and benefits requires estimates and judgments by management.
v
As a recipient of federal, state, and local financial assistance, the Board and management are also responsible for ensuring that adequate internal controls are in place to ensure and document compliance with applicable laws and regulations related to these programs. This internal control is subject to periodic evaluation by management and the internal audit staff of DFW.
DFW maintains extensive budgetary controls to ensure that expenditures are made in compliance with the Controlling Documents. There were no significant changes to DFW’s financial policies that had an impact on the financial statements during the last year. Independent Audit Deloitte & Touche LLP performed the audit for the year ended September 30, 2011. Their report is included in this CAFR. In conjunction with the annual audit, Deloitte & Touche performs an audit consistent with the Single Audit Act Amendments of 1996 and the Office of Management and Budget Circular A-133, Audits of States, Local Governments and Non-Profit Organizations, and applicable grant award guidelines relating to FAA grants in progress during the year. These reports have not been included in this report, but are available from DFW. Awards The Government Finance Officers Association of the United States and Canada (GFOA) awarded a Certificate of Achievement for Excellence in Financial Reporting to DFW for its comprehensive annual financial report for the fiscal year ended September 30, 2010. This was the twentieth consecutive year that DFW has achieved this award. In order to be awarded a Certificate of Achievement, a government must publish an easily readable and efficiently organized comprehensive annual financial report. This report must satisfy both accounting principles generally accepted in the United States of America and applicable legal requirements. A Certificate of Achievement is valid for a period of one year only. We believe that our current comprehensive annual financial report continues to meet the Certificate of Achievement Program’s requirements and we are submitting it to the GFOA to determine its eligibility for another certificate. Acknowledgements The completion of this report could not have been accomplished without the efficient and dedicated service of the entire Finance and Treasury Management Departments. We would like to express our appreciation to all team members who assisted in and contributed to its preparation. Respectfully submitted, Jeffrey P. Fegan Christopher A. Poinsatte
Chief Executive Officer Executive Vice President Chief Financial Officer

vi
BOARD OF DIRECTORS
As of SEPTEMBER 30, 2011
Francisco Hernandez, Chair Robert Hsueh, Vice Chair
Jeffrey K. Wentworth, Secretary Mayor Mike Rawlings
Mayor Betsy Price Lillie M. Biggins Betty J. Culbreath Benjamin Muro Brenda E. Reyes Forrest Smith
Bernice J. Washington Glenn Porterfield (nonvoting member)
AIRPORT OFFICIALS
As of SEPTEMBER 30, 2011
Jeffrey P. Fegan, Chief Executive Officer
Christopher A. Poinsatte, Executive Vice President & Chief Financial Officer
Kenneth Buchanan, Executive Vice President, Revenue Management
James M. Crites, Executive Vice President, Operations
Philip Ritter, Executive Vice President, Government and Stakeholders Affairs
Linda Valdez Thompson, Executive Vice President, Administration and Diversity

Dallas/Fort Worth International Airport Organizational Chart
Jeffrey P. FeganChief Executive Officer
Board of Directors
Robert R. DarbyAudit Services
Elaine RodriguezGeneral Counsel
Christopher A. PoinsatteExecutive V.P.Finance & ITS
(CFO)
Linda Valdez ThompsonExecutive V.P.
Admin. & Diversity
Greg SpoonV.P.
Procurement & Materials Mgmt.
Tamela LeeV.P.
Business Diversity& Development
Thomas DallamV.P.
Human Resources
Irene Clark Interim A.V.P.
Internal Communications & Diversity
Norma Essary V.P.
Risk Management
Carol DavisV.P.
Asset Management
Paul MartinezV.P.
Operations
Dan C. BergmanV.P.
Environmental Affairs
John TerrellV.P.
CommercialDevelopment
Zenola CampbellV.P.
Concessions
Armin J. CruzV.P.
Parking
Alan BlackV.P.
Public Safety
Rusty T. HodappV.P.
Energy & Transportation Mgmt.
Andy BellV.P.
Planning
Luis PerezV.P.
Air ServiceDevelopment
Jeffrey D. BenvegnuV.P.
Aviation Real Estate
Byford E. TreanorV.P.
Customer Service
Sharon McCloskeyV.P.
Marketing
Mary Jo PolidoreV.P.
Public Affairs
Perfecto M. SolisV.P.
Airport Development & Engineering
James M. CritesExecutive V.P.
Operations
Kenneth BuchananExecutive V.P.
Revenue Management
Phil RitterExecutive V.P.
Governmental &Stakeholder Affairs
William L. FlowersV.P.
InformationTechnology Services
Mike PhemisterV.P.
Treasury Management
Max UnderwoodV.P.
Finance
Brandon SteinmannA.V.P.
Government Relations
vii
vii

“This Page Intentionally left Blank”

FINANCIAL SECTION
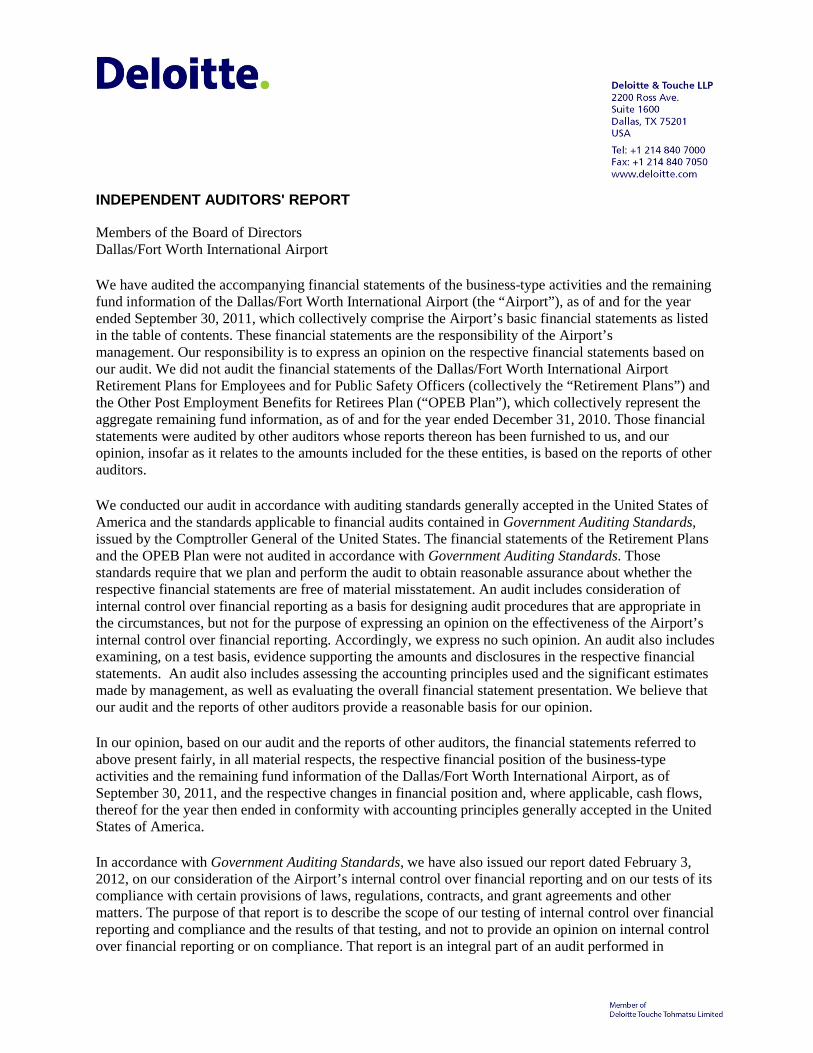
INDEPENDENT AUDITORS' REPORT
Members of the Board of Directors Dallas/Fort Worth International Airport
We have audited the accompanying financial statements of the business-type activities and the remaining fund information of the Dallas/Fort Worth International Airport (the “Airport”), as of and for the year ended September 30, 2011, which collectively comprise the Airport’s basic financial statements as listed in the table of contents. These financial statements are the responsibility of the Airport’s management. Our responsibility is to express an opinion on the respective financial statements based on our audit. We did not audit the financial statements of the Dallas/Fort Worth International Airport Retirement Plans for Employees and for Public Safety Officers (collectively the “Retirement Plans”) and the Other Post Employment Benefits for Retirees Plan (“OPEB Plan”), which collectively represent the aggregate remaining fund information, as of and for the year ended December 31, 2010. Those financial statements were audited by other auditors whose reports thereon has been furnished to us, and our opinion, insofar as it relates to the amounts included for the these entities, is based on the reports of other auditors.
We conducted our audit in accordance with auditing standards generally accepted in the United States of America and the standards applicable to financial audits contained in Government Auditing Standards, issued by the Comptroller General of the United States. The financial statements of the Retirement Plans and the OPEB Plan were not audited in accordance with Government Auditing Standards. Those standards require that we plan and perform the audit to obtain reasonable assurance about whether the respective financial statements are free of material misstatement. An audit includes consideration of internal control over financial reporting as a basis for designing audit procedures that are appropriate in the circumstances, but not for the purpose of expressing an opinion on the effectiveness of the Airport’s internal control over financial reporting. Accordingly, we express no such opinion. An audit also includes examining, on a test basis, evidence supporting the amounts and disclosures in the respective financial statements. An audit also includes assessing the accounting principles used and the significant estimates made by management, as well as evaluating the overall financial statement presentation. We believe that our audit and the reports of other auditors provide a reasonable basis for our opinion.
In our opinion, based on our audit and the reports of other auditors, the financial statements referred to above present fairly, in all material respects, the respective financial position of the business-type activities and the remaining fund information of the Dallas/Fort Worth International Airport, as of September 30, 2011, and the respective changes in financial position and, where applicable, cash flows, thereof for the year then ended in conformity with accounting principles generally accepted in the United States of America.
In accordance with Government Auditing Standards, we have also issued our report dated February 3, 2012, on our consideration of the Airport’s internal control over financial reporting and on our tests of its compliance with certain provisions of laws, regulations, contracts, and grant agreements and other matters. The purpose of that report is to describe the scope of our testing of internal control over financial reporting and compliance and the results of that testing, and not to provide an opinion on internal control over financial reporting or on compliance. That report is an integral part of an audit performed in
accordance with Government Auditing Standards and should be considered in assessing the results of our audit.
Management's discussion and analysis and the schedules of funding progress for pensions and other post employment benefits are not required parts of the basic financial statements, but are supplementary information required by the accounting principles generally accepted in the United States of America. This required supplementary information is the responsibility of the Airport’s management. We and other auditors have applied certain limited procedures, which consisted principally of inquiries of management regarding the methods of measurement and presentation of the supplementary information. However, we did not audit such information and express no opinion on it.
Our audit was conducted for the purpose of forming an opinion on the Airport’s financial statements that collectively comprise the Airport’s basic financial statements. The other supplementary information listed in the foregoing table of contents is presented for the purpose of additional analysis and is not a required part of the basic financial statements. This information is the responsibility of the Airport’s management. Such additional information has been subjected to the auditing procedures applied by other auditors and in our opinion, based on the reports of other auditors, is fairly stated in all material respects in relation to the basic financial statements taken as a whole.
The introductory section and statistical section as listed in the table of contents are presented for the purposes of additional analysis and are not required parts of the basic financial statements for the Airport. This information is the responsibility of the Airport’s management. Such additional information has not been subjected to the auditing procedures applied in the audit of the basic financial statements and, accordingly, we express no opinion on it.
February 3, 2012
3
MANAGEMENT’S DISCUSSION AND ANALYSIS (Unaudited) The following discussion and analysis of the financial performance and activity of the Dallas/Fort Worth International Airport (“DFW” or “the Airport”) provides an introduction and understanding of DFW’s Basic Financial Statements for the fiscal year ended September 30, 2011. The Airport is a business-type activity and as such, DFW’s Basic Financial Statements and Required Supplementary Information consist of Management’s Discussion and Analysis (MD&A); Statement of Net Assets; Statement of Revenues, Expenses, and Changes in Net Assets; Statement of Cash Flows; and Notes to the Basic Financial Statements. Also included are the Statement of Fiduciary Net Assets; Statement of Changes in Fiduciary Net Assets; and Schedules of Funding Progress for the Airport Fiduciary Funds which have a December 31st year end. The MD&A has been prepared by management and should be read in conjunction with the Basic Financial Statements and the attached notes.
DFW’s Controlling Documents DFW was created by a Contract and Agreement between the Cities of Dallas and Fort Worth (the Cities), dated April 15, 1968, for the purpose of developing and operating an airport as a joint venture between the Cities. In addition to this Contract and Agreement, DFW is governed by several other key documents including the 30th Supplemental Bond Ordinance, which amended the original 1968 Concurrent Bond Ordinance (collectively called the “Bond Ordinances”); and the Lease and Use Agreements (Use Agreement) which defines DFW’s rate setting methodology and business relationships with the airlines. Collectively, these documents are called the “Controlling Documents.”
Each year, management prepares an Annual Budget (approved by the DFW Board and the Cities) of projected expenses for the Operating Revenue and Expense Fund (commonly referred to as the “102 Fund”). Management also prepares an annual Schedule of Charges which is the basis for charging the airlines, tenants, and other airport users for DFW services during the fiscal year. DFW and the signatory airlines agreed to a new ten-year Use Agreement in FY 2011 with an effective date of October 1, 2010.
The new Use Agreement created three primary cost centers: the “Airfield”, “Terminal”, and “DFW.” The airfield and terminal cost centers are “residual” in nature. DFW can only charge the airlines for the net cost to operate these cost centers (including debt service) primarily through landing fees and terminal rentals. The Use Agreement also requires certain cash transfers from capital accounts to the 102 Fund each year.
DFW can generate net revenues or profits in the DFW cost center which includes non-airline business units such as concessions, parking, rental car, commercial development, and transportation (busing and the Skylink people mover). If DFW generates net revenues in excess of the “upper threshold” ($60 million in FY 2011), 75% of the excess is to be used to reduce landing fees (called a “true-up credit”) in the following fiscal year.
From an accounting standpoint however, the true-up is recorded as a reduction in revenue in the current fiscal year with the corresponding deferred revenue being carried into the following fiscal year. If net revenues from the DFW Cost Center are budgeted below $40 million, the airlines are assessed incremental landing fees to achieve the lower “threshold” amount of $40 million in the current fiscal year. The “upper threshold” and “lower threshold” amounts are adjusted annually for inflation.
4
At the end of each fiscal year, any excess funds in the 102 Operating Fund are transferred to the Capital Improvement Fund. Funds transferred to the Capital Improvement Fund are allocated among three accounts: the joint capital account, DFW capital account and rolling coverage capital account. The joint capital account generally requires approval from both DFW and the airlines prior to any expenditure of funds, while the DFW capital account may be used at the DFW’s sole discretion for any legal purpose. The joint capital account receives funds primarily from natural gas royalties and the sale of land. The DFW capital account is funded primarily from excess revenues of DFW Cost Center, subject to upper threshold limits discussed previously.
The rolling coverage account was initially funded from the Capital Improvement Account when the lease agreement was signed. The rolling coverage balance is transferred or “rolled” into the 102 Fund each year to fund debt service coverage requirements. It is then transferred back into the rolling coverage account at the end of the fiscal year. If additional coverage is required in any year, it is added to rates and charges and is collected during the fiscal year.
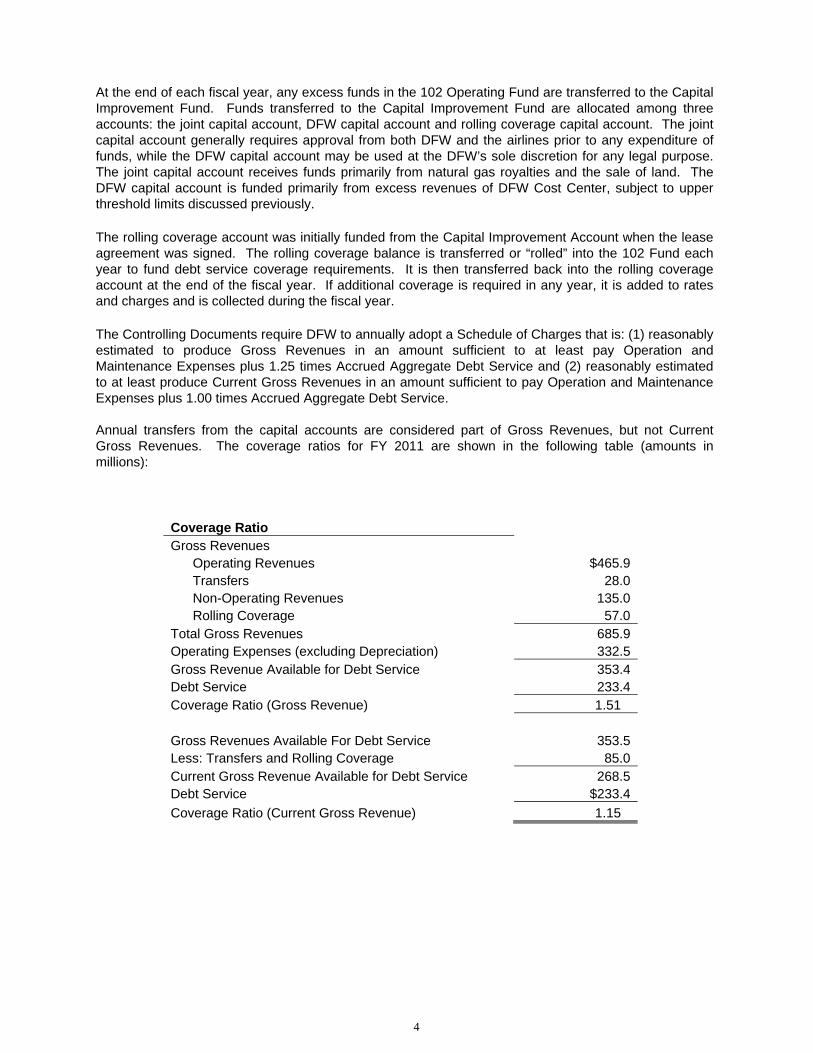
The Controlling Documents require DFW to annually adopt a Schedule of Charges that is: (1) reasonably estimated to produce Gross Revenues in an amount sufficient to at least pay Operation and Maintenance Expenses plus 1.25 times Accrued Aggregate Debt Service and (2) reasonably estimated to at least produce Current Gross Revenues in an amount sufficient to pay Operation and Maintenance Expenses plus 1.00 times Accrued Aggregate Debt Service. Annual transfers from the capital accounts are considered part of Gross Revenues, but not Current Gross Revenues. The coverage ratios for FY 2011 are shown in the following table (amounts in millions):
Coverage Ratio Gross Revenues Operating Revenues $465.9 Transfers 28.0 Non-Operating Revenues 135.0 Rolling Coverage 57.0 Total Gross Revenues 685.9 Operating Expenses (excluding Depreciation) 332.5 Gross Revenue Available for Debt Service 353.4 Debt Service 233.4 Coverage Ratio (Gross Revenue) 1.51
Gross Revenues Available For Debt Service 353.5 Less: Transfers and Rolling Coverage 85.0 Current Gross Revenue Available for Debt Service 268.5 Debt Service $233.4
Coverage Ratio (Current Gross Revenue) 1.15

5
Although DFW uses the word “fund” to designate the source and prospective use of proceeds, DFW is an enterprise fund and does not utilize traditional “fund accounting” commonly used by government organizations. The following table summarizes the primary funds used by DFW and whether the related cash is restricted or not restricted:
Fund Number Fund Description Primary Use
Restricted ( R), Not Restricted
(NR)
101 Capital Assets and Long Term Debt Capital Assets / Debt R
102 Operating Revenues and Expenses Operations NR
252 Passenger Facility Charges (PFC) Capital/Debt Service R
320 Joint Capital Account (non-JRB) Capital NR
321 Joint Revenue Bonds Bond Proceeds R
330s Joint Capital (JRB) Capital R
340 DFW Capital Account (non-JRB) Capital NR
350 Rolling Coverage Rate Covenant NR
500s Debt Service Principal and Interest R
600s Debt Service Reserve Reserve R
907 Facility Improvement Corporation (FIC) RAC Facility NR RAC Transportation R
910 Public Facility Improvement
Corporation (PFIC) Grand Hyatt Hotel R
JRB - Joint Revenue Bond
RAC - Rent-A-Car Center
The basic financial statements include all of DFW’s funds. DFW manages its day-to-day airport operations primarily through the 102 Operating Fund in accordance with the Controlling Documents. The Airport’s financial statements include all of the transactions of the Public Facility Improvement Corporation (PFIC), which operates the Grand Hyatt Hotel, and the Facility Improvement Corporation (FIC), which collects customer transaction charges from the Rental Car companies. Although the FIC and PFIC are legally separate entities, the financial transactions of both have been combined into the Airport’s Enterprise Fund due to their nature and significance to the Airport. The FIC and PFIC are considered blended component units because the component units’ governing bodies are substantively the same as DFW’s, the primary government.
6
Operational and Financial Highlights
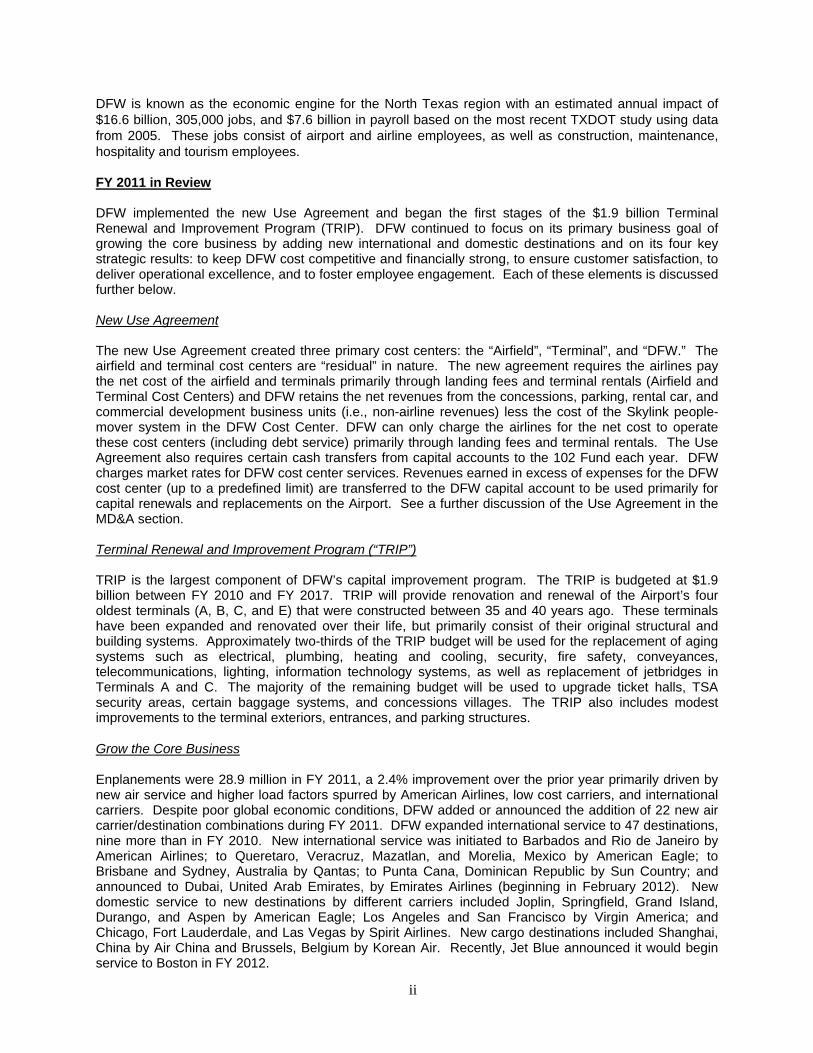
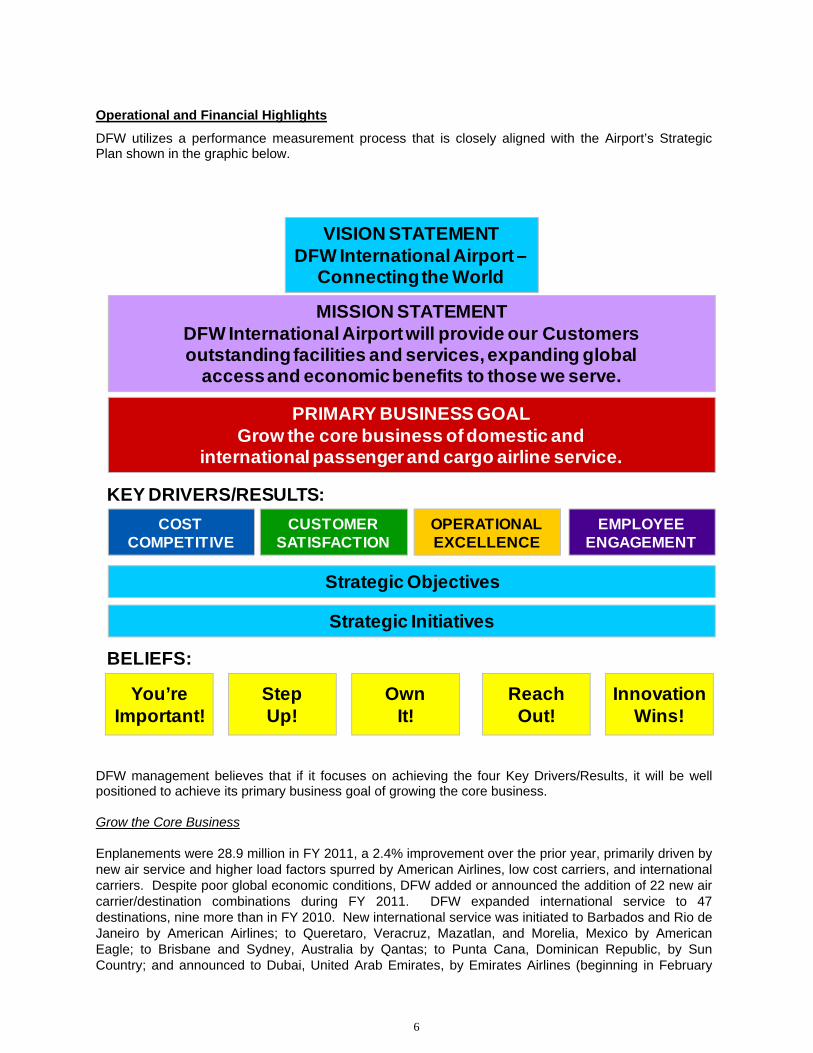
DFW utilizes a performance measurement process that is closely aligned with the Airport’s Strategic Plan shown in the graphic below.
DFW management believes that if it focuses on achieving the four Key Drivers/Results, it will be well positioned to achieve its primary business goal of growing the core business. Grow the Core Business Enplanements were 28.9 million in FY 2011, a 2.4% improvement over the prior year, primarily driven by new air service and higher load factors spurred by American Airlines, low cost carriers, and international carriers. Despite poor global economic conditions, DFW added or announced the addition of 22 new air carrier/destination combinations during FY 2011. DFW expanded international service to 47 destinations, nine more than in FY 2010. New international service was initiated to Barbados and Rio de Janeiro by American Airlines; to Queretaro, Veracruz, Mazatlan, and Morelia, Mexico by American Eagle; to Brisbane and Sydney, Australia by Qantas; to Punta Cana, Dominican Republic, by Sun Country; and announced to Dubai, United Arab Emirates, by Emirates Airlines (beginning in February
VISION STATEMENT DFW International Airport –
Connecting the World
MISSION STATEMENTDFW International Airport will provide our Customersoutstanding facilities and services, expanding global
access and economic benefits to those we serve.
PRIMARY BUSINESS GOALGrow the core business of domestic and
international passenger and cargo airline service.
KEY DRIVERS/RESULTS:
COSTCOMPETITIVE
CUSTOMERSATISFACTION
OPERATIONALEXCELLENCE
EMPLOYEEENGAGEMENT
Strategic Objectives
Strategic Initiatives
You’reImportant!
StepUp!
OwnIt!
ReachOut!
InnovationWins!
BELIEFS:

7
2012). New domestic service to new destinations by different carriers included Joplin, Springfield, Grand Island, Durango, and Aspen by American Eagle; Los Angeles and San Francisco by Virgin America; and Chicago, Fort Lauderdale, and Las Vegas by Spirit Airlines. New cargo destinations included Shanghai, China by Air China and Brussels, Belgium by Korean Air. Recently, Jet Blue announced it would begin service to Boston in FY 2012. Keep DFW Cost Competitive and Financially Strong
DFW is in a financially strong position with total cash and investments of $1.2 billion and total unrestricted cash and investments of $573.0 million as of September 30, 2011. Unrestricted cash and investments are sufficient to cover more than 600 days of operating expenses. Although DFW’s defined benefit pension plans and Other Post Employment Benefits plan (OPEB) have unfunded liability balances, DFW has been prefunding the plans in the past and has a net pension and OPEB asset of $56.7 million as of September 30, 2011. DFW also started a new defined contribution plan to replace its defined benefit plans for new general employees hired on or after January 1, 2010 (excluding Department of Public Safety employees). DFW is rated A+ by Fitch, A1 by Moody’s, and A+ by Standard and Poor’s.
Total 102 Operating Fund expenditures were $565.9 million, a $20.0 million (5.1%) decrease from FY 2010 primarily due to the restructuring of DFW’s debt portfolio. DFW has been aggressively managing costs over the past five years. As can be seen in the accompanying chart, operating expenses have grown only $1 million over the past six years due to innovative cost management techniques; and debt service has been reduced through a debt restructuring program and the implementation of “rolling coverage” as part of the new Use Agreement.
The airline industry uses passenger airline cost per enplanement (CPE) as a key productivity measure. CPE is calculated by dividing airline cost (total passenger airline payments for landing fees and terminal rents, less airline rebates for new air service) by the number of enplanements. DFW’s CPE in FY 2011 was $6.30, a decrease of $0.44 (6.50%) from $6.74 in FY 2010, primarily due to lower airline cost and higher enplanements. Total airline cost was $190.5 million, a decrease of $10.4 million (5.2%) from $200.9 million in FY 2010 primarily due to lower debt service and higher non-airline revenues.
DFW’s long range goal is to remain in or near the first quartile for this measure versus its competitive set of 13 large hub US airports. Based on an internal benchmarking study based on FY 2010 data, DFW had the 2nd lowest CPE versus its competitive set on a “fully loaded” basis which considers other costs paid by the airlines at airports such as delay costs, airline terminal maintenance and debt services costs not on the airports’ books. DFW was American Airlines’ lowest-cost hub airport in this study. Competitive information for FY 2011 is not yet available.
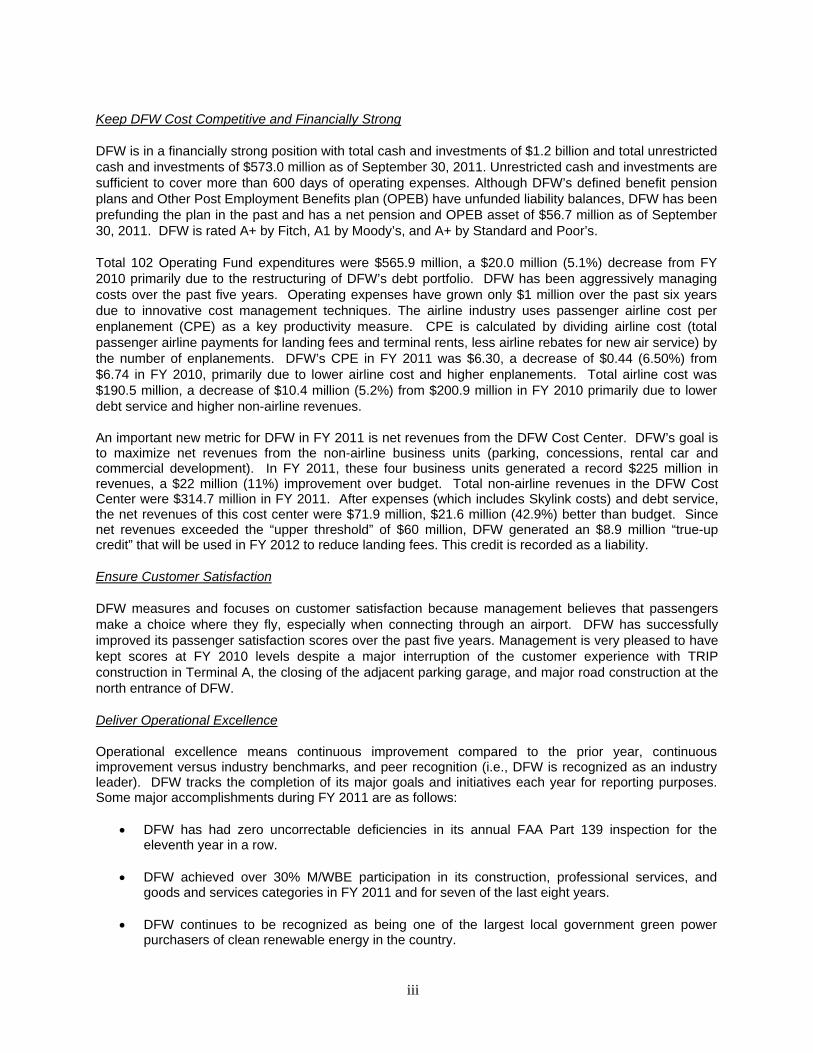
An important new metric for DFW in FY 2011 is net revenues from the DFW cost center. DFW’s goal is to maximize net revenues from the non-airline business units (parking, concessions, rental car and commercial development). In FY 2011, these four
$50.3
$60.0
$71.9
$30
$40
$50
$60
$70
$80
$90
FY11 Budget Upper Threshold FY11 Actual
Net Revenues - DFW Cost Center (Ms) 75% ($8.9M) of difference
shared with Airlinesas True-up in FY12
332 322 334 321 325 333
274 294 299 296 261 233
$0
$100
$200
$300
$400
$500
$600
$700
2006 2007 2008 2009 2010 2011
Total Operating Fund Expenditures (MS)
Operating Expense Debt Service
$616 $633 $617$586
$566$606
8
business units generated a record $225 million in revenues, a $22 million (11%) improvement over budget. Total non-airline revenues in the DFW cost center were $314.7 million in FY 2011. After expenses (which includes Skylink costs) and debt service, the net revenues of this cost center were $71.9 million, $21.6 million (42.9%) better than budget. Since net revenues exceeded the “upper threshold” of $60 million, DFW generated an $8.9 million “true-up credit” that will be used in FY 2012 to reduce landing fees. This credit is recorded as deferred revenue.
AMR Bankruptcy On November 29, 2011, AMR Corporation, the parent company of American Airlines, Inc. (“AA”), AA, American Eagle, Inc., and other affiliates of AMR, filed voluntary petitions for Chapter 11 reorganization in the U.S. Bankruptcy Court for the Southern District of New York. The AMR website states that they took this action “in order to achieve a cost and debt structure that is industry competitive and thereby assures AMR’s long-term viability and ability to continue delivering a world-class travel experience for customers.”
AMR is DFW’s largest tenant representing approximately 85% and 78% of DFW’s passenger traffic and landed weights, respectively. AMR leases 100% of the terminal space in Terminals A, B, and C and approximately 60% of the space in Terminal D. DFW is AMR’s largest hub representing approximately 40% of AMR’s total traffic. AMR paid DFW approximately $173 million, 30% of the 102 Fund operating and debt service costs incurred in FY 2011. The prepetition accounts receivable balance due from AMR was approximately $11.9 million as of the date of filing. In addition to the Use Agreement, AMR has 13 other lease agreements with DFW for hangars, operating and maintenance facilities, and a fueling facility as part of a fueling consortium representing approximately $12.1 million of lease income per year to DFW. AMR was current on predominantly all post petition liabilities as of December 31, 2011. DFW shall continue to monitor AMR’s bankruptcy proceedings for developments which could have a significant impact on operations at DFW. In such event, management believes that DFW would have adequate unrestricted cash and investments to allow it to continue operations until such time as it can (i) determine the degree to which airport operations may be affected and take appropriate steps to reduce costs, and (ii) make rate adjustments to those carriers continuing to operate at the Airport to offset any reduction in revenues. DFW has initiated design and construction of a seven-year $1.9 billion Terminal Renovation and Improvement Program (TRIP) to renovate Terminals A, B, C, and E. AMR and the other signatory airlines approved the TRIP and associated debt financing as part of the Use Agreement that became effective October 1, 2010. AMR informed DFW subsequent to the bankruptcy filing that it desires to continue with the TRIP as scheduled. AMR also approved nine new capital projects totaling $231.4 million subsequent to the filing, including a Terminal B gate expansion (operated by American Eagle) and a new replacement Terminal A parking garage.
DFW has sufficient cash in the joint capital account, the DFW capital account, and available bond proceeds to fund projected capital expenditures through the end of FY 2012, if necessary. DFW intends to fund the TRIP and other major capital projects through the issuance of additional Joint Revenue Bonds in FY 2012 and the future. Although DFW is not planning to do so, DFW could delay or stop some or all of its capital projects, if necessary, because the TRIP and DFW’s capital programs are phased over time.
DFW’s bond ratings of A+ (Standard & Poor’s), A1 (Moody’s), and A+ (Fitch) have not changed since the bankruptcy filing. However, Moody’s and Fitch did revise their outlooks for DFW bonds from stable to negative. Standard & Poor’s has not made a revision to their outlook at this time. DFW has received no indication that the negative outlooks will have any impact on DFW’s ability to issue future bonds or any material impact on interest rates.
9
Ensure Customer Satisfaction
DFW measures and focuses on customer satisfaction because management believes that passengers make a choice where they fly, especially when connecting through an airport. DFW has successfully improved its passenger satisfaction scores over the past five years. Management is very pleased to have kept scores at FY 2010 levels despite a major interruption of the customer experience with TRIP construction in Terminal A, the closing of the adjacent parking garage, and major road construction at the north entrance of DFW. Management expects more challenges in the coming years when three terminals will be under construction at one time, but has a goal to continue to improve customer service.
Deliver Operational Excellence
Operational excellence means continuous improvement compared to the prior year, continuous improvement versus industry benchmarks, and peer recognition (i.e., DFW is recognized as an industry leader). DFW tracks the completion of its major goals and initiatives each year for reporting purposes. Some major accomplishments during FY 2011 are as follows:
DFW has had zero uncorrectable deficiencies in its annual FAA Part 139 inspection for the eleventh year in a row.
DFW achieved over 30% M/WBE participation in its construction, professional services, and goods and services categories in FY 2011 and for seven of the last eight years.
DFW continues to be recognized as being one of the largest local government green power purchasers of clean renewable energy in the country.
In 2011, DFW developed a sustainability orientation program that will enable staff to identify and implement sustainability in their lines of business, emphasizing the “triple bottom line” approach of people, profit and planet.
Foster Employee Engagement
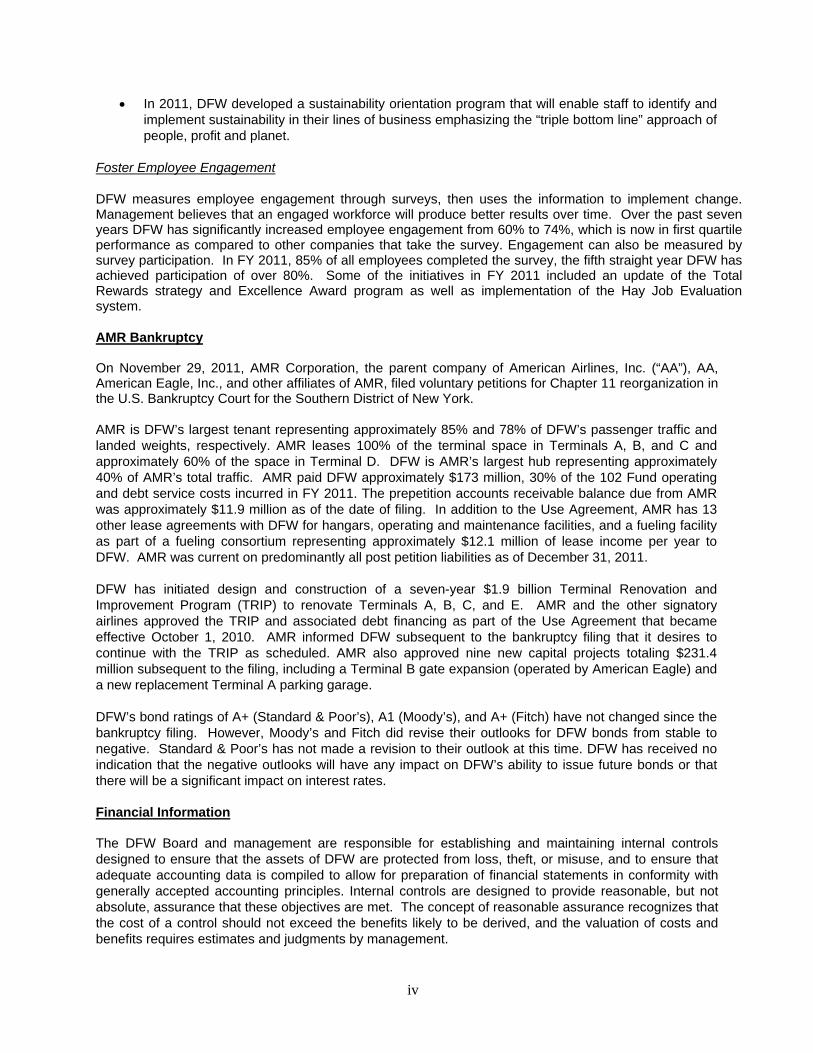
DFW measures employee engagement through surveys, then uses the information to implement change. Management believes that an engaged workforce will produce better results over time. Over the past seven years DFW has significantly increased employee engagement from 60% to 74%, which is now in first quartile performance as compared to other companies that take the survey. Engagement can also be measured by survey participation. In FY 2011, 85% of all employees completed the survey, the fifth straight year DFW has achieved participation of over 80%. Some of the initiatives in FY 2011 included an update of the Total Rewards strategy and Excellence Award program as well as implementation of the Hay Job Evaluation system.
60%62% 62%
65%67%
73% 74%
50%
55%
60%
65%
70%
75%
80%
FY05 FY06 FY07 FY08 FY09 FY10 FY11
Employee Engagement Scores
4.10
4.12
4.18 4.19 4.19
4.00
4.05
4.10
4.15
4.20
4.25
FY07 FY08 FY09 FY10 FY11
ACI Passenger Satisfaction ScoresFive Point Scale
10
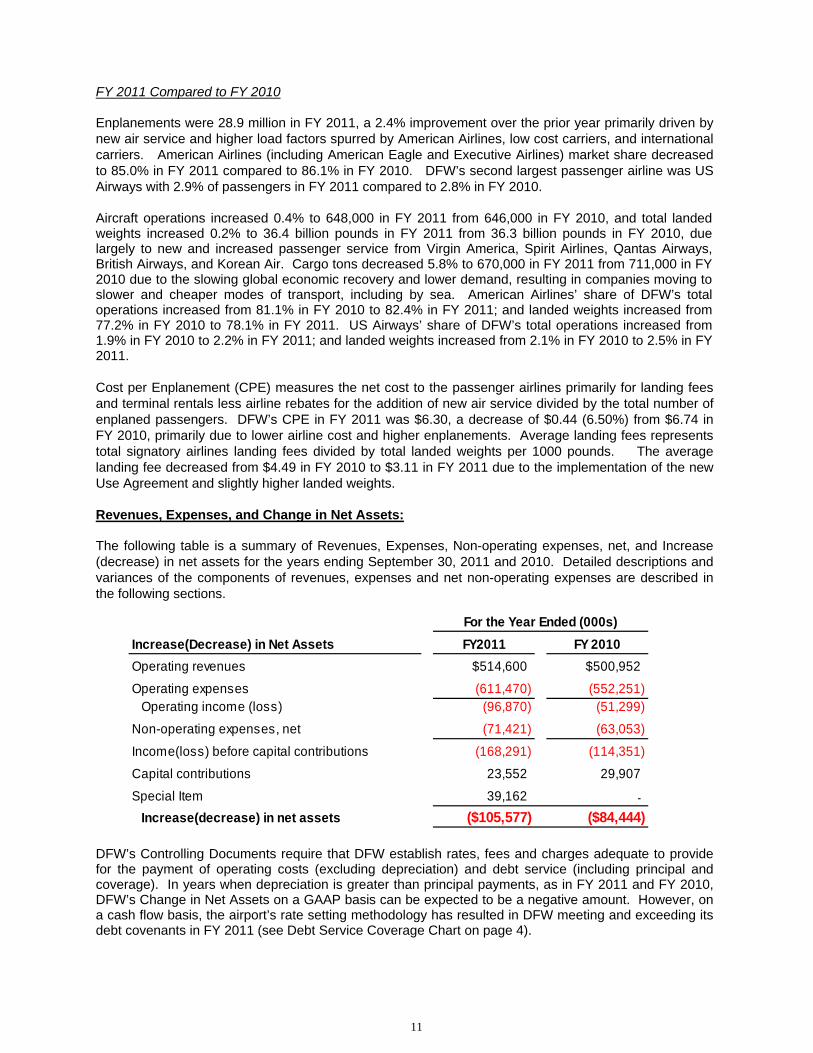
Capital Programs and Airport Development Plan Update TRIP is the largest component of DFW’s capital improvement program. The TRIP is budgeted at $1.9 billion between FY 2011 and FY 2017. TRIP provides renovation and renewal of the Airport’s four oldest terminals (A, B, C, and E) that were constructed between 35 and 40 years ago. These terminals have been expanded and renovated over their life, but primarily consist of their original structural and building systems. Approximately two-thirds of the TRIP budget will be used for the replacement of aging systems such as electrical, plumbing, heating and cooling, security, fire safety, conveyances, telecommunications, lighting, information technology systems, as well as replacement of jetbridges in Terminals A and C. The majority of the remaining budget will be used to upgrade ticket halls, TSA security areas, certain baggage systems, and concessions villages. The TRIP also includes modest improvements to the terminal exteriors, entrances, and parking structures. The Use Agreement also included $220 million (net of grants) of other preapproved joint capital account projects for the airfield, roads and bridges, utilities, and parking. In addition, DFW intends to fund the renewal and replacement of non-terminal capital including airfield, roadways, parking, utilities, support facilities, infrastructure, rolling stock, and equipment from the DFW capital account. For a comprehensive review of DFW’s capital programs and funding plan, please see a copy of the DFW Financial Plan, available on DFW’s web page under the Investors/financials tab. During FY 2011, the airlines approved $43 million of new projects through the majority-in-interest (MII) process. As of September 30, 2011, DFW had 218 approved capital projects in process for a total estimated cost of $2.4 billion through completion. As of September 30, 2011, $411.6 million of this total had been expended and an additional $469.4 million was under contract and committed; leaving approximately $1.5 billion remaining to be committed and spent. The more significant projects include the TRIP ($1.92 billion), airfield pavements and airfield lighting rehabilitation projects ($51.7 million), replacement of the parking control system and toll plazas ($50.1 million), construction of a new DART Rail Station adjacent to Terminal A ($35.6M million), a renovated and expanded fire training center ($25.7 million), and a reclaimed water system ($18.6M). DFW Business and Operations Overview The following table highlights changes in the Airport’s key operating statistics for 2011 and 2010.
For the Year Ended
Key Operating Information FY 2011 FY 2010
Enplanements (000s) 28,867 28,188
Total Passengers (000s) 57,801 56,391
Aircraft Operations (000s) 648 646
Cargo (tons in 000s) 670 711
Cargo Landed Weight (in millions of pounds) 3,081 3,034
Landed Weight (in millions of pounds) 36,397 36,334
Cost per Enplaned Passenger $ 6.30 $ 6.74*
Average Landing Fee $ 3.11 $ 4.49
*FY 2011 Cost per Enplaned Passenger includes payments as part of the Airline Service Incentive Program (ASIP). FY 2010
adjusted for ASIP: $6.67.
11
FY 2011 Compared to FY 2010 Enplanements were 28.9 million in FY 2011, a 2.4% improvement over the prior year primarily driven by new air service and higher load factors spurred by American Airlines, low cost carriers, and international carriers. American Airlines (including American Eagle and Executive Airlines) market share decreased to 85.0% in FY 2011 compared to 86.1% in FY 2010. DFW’s second largest passenger airline was US Airways with 2.9% of passengers in FY 2011 compared to 2.8% in FY 2010. Aircraft operations increased 0.4% to 648,000 in FY 2011 from 646,000 in FY 2010, and total landed weights increased 0.2% to 36.4 billion pounds in FY 2011 from 36.3 billion pounds in FY 2010, due largely to new and increased passenger service from Virgin America, Spirit Airlines, Qantas Airways, British Airways, and Korean Air. Cargo tons decreased 5.8% to 670,000 in FY 2011 from 711,000 in FY 2010 due to the slowing global economic recovery and lower demand, resulting in companies moving to slower and cheaper modes of transport, including by sea. American Airlines’ share of DFW’s total operations increased from 81.1% in FY 2010 to 82.4% in FY 2011; and landed weights increased from 77.2% in FY 2010 to 78.1% in FY 2011. US Airways’ share of DFW’s total operations increased from 1.9% in FY 2010 to 2.2% in FY 2011; and landed weights increased from 2.1% in FY 2010 to 2.5% in FY 2011. Cost per Enplanement (CPE) measures the net cost to the passenger airlines primarily for landing fees and terminal rentals less airline rebates for the addition of new air service divided by the total number of enplaned passengers. DFW’s CPE in FY 2011 was $6.30, a decrease of $0.44 (6.50%) from $6.74 in FY 2010, primarily due to lower airline cost and higher enplanements. Average landing fees represents total signatory airlines landing fees divided by total landed weights per 1000 pounds. The average landing fee decreased from $4.49 in FY 2010 to $3.11 in FY 2011 due to the implementation of the new Use Agreement and slightly higher landed weights. Revenues, Expenses, and Change in Net Assets: The following table is a summary of Revenues, Expenses, Non-operating expenses, net, and Increase (decrease) in net assets for the years ending September 30, 2011 and 2010. Detailed descriptions and variances of the components of revenues, expenses and net non-operating expenses are described in the following sections.
DFW’s Controlling Documents require that DFW establish rates, fees and charges adequate to provide for the payment of operating costs (excluding depreciation) and debt service (including principal and coverage). In years when depreciation is greater than principal payments, as in FY 2011 and FY 2010, DFW’s Change in Net Assets on a GAAP basis can be expected to be a negative amount. However, on a cash flow basis, the airport’s rate setting methodology has resulted in DFW meeting and exceeding its debt covenants in FY 2011 (see Debt Service Coverage Chart on page 4).
Increase(Decrease) in Net Assets FY2011 FY 2010
Operating revenues $514,600 $500,952
Operating expenses (611,470) (552,251) Operating income (loss) (96,870) (51,299)
Non-operating expenses, net (71,421) (63,053)
Income(loss) before capital contributions (168,291) (114,351)
Capital contributions 23,552 29,907
Special Item 39,162 -
Increase(decrease) in net assets ($105,577) ($84,444)
For the Year Ended (000s)
12
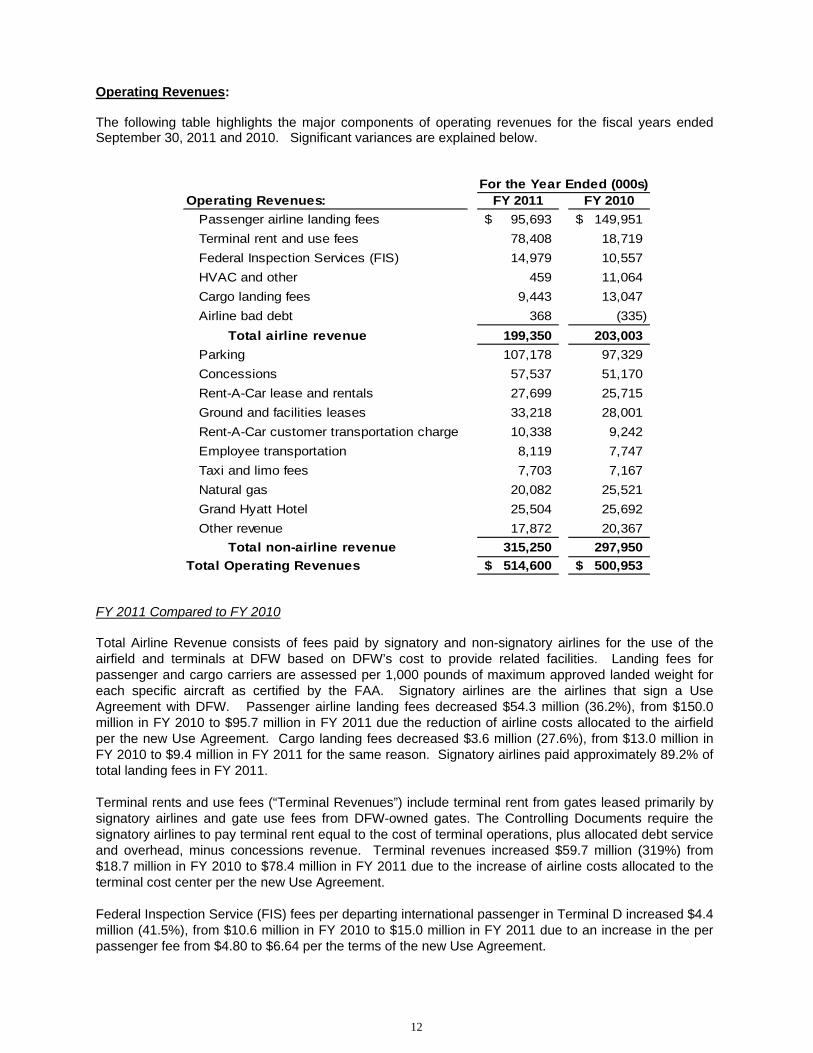
Operating Revenues: The following table highlights the major components of operating revenues for the fiscal years ended September 30, 2011 and 2010. Significant variances are explained below. FY 2011 Compared to FY 2010 Total Airline Revenue consists of fees paid by signatory and non-signatory airlines for the use of the airfield and terminals at DFW based on DFW’s cost to provide related facilities. Landing fees for passenger and cargo carriers are assessed per 1,000 pounds of maximum approved landed weight for each specific aircraft as certified by the FAA. Signatory airlines are the airlines that sign a Use Agreement with DFW. Passenger airline landing fees decreased $54.3 million (36.2%), from $150.0 million in FY 2010 to $95.7 million in FY 2011 due the reduction of airline costs allocated to the airfield per the new Use Agreement. Cargo landing fees decreased $3.6 million (27.6%), from $13.0 million in FY 2010 to $9.4 million in FY 2011 for the same reason. Signatory airlines paid approximately 89.2% of total landing fees in FY 2011. Terminal rents and use fees (“Terminal Revenues”) include terminal rent from gates leased primarily by signatory airlines and gate use fees from DFW-owned gates. The Controlling Documents require the signatory airlines to pay terminal rent equal to the cost of terminal operations, plus allocated debt service and overhead, minus concessions revenue. Terminal revenues increased $59.7 million (319%) from $18.7 million in FY 2010 to $78.4 million in FY 2011 due to the increase of airline costs allocated to the terminal cost center per the new Use Agreement. Federal Inspection Service (FIS) fees per departing international passenger in Terminal D increased $4.4 million (41.5%), from $10.6 million in FY 2010 to $15.0 million in FY 2011 due to an increase in the per passenger fee from $4.80 to $6.64 per the terms of the new Use Agreement.
Operating Revenues: FY 2011 FY 2010
Passenger airline landing fees 95,693$ 149,951$
Terminal rent and use fees 78,408 18,719
Federal Inspection Services (FIS) 14,979 10,557
HVAC and other 459 11,064
Cargo landing fees 9,443 13,047
Airline bad debt 368 (335)
Total airline revenue 199,350 203,003
Parking 107,178 97,329
Concessions 57,537 51,170
Rent-A-Car lease and rentals 27,699 25,715
Ground and facilities leases 33,218 28,001
Rent-A-Car customer transportation charge 10,338 9,242
Employee transportation 8,119 7,747
Taxi and limo fees 7,703 7,167
Natural gas 20,082 25,521
Grand Hyatt Hotel 25,504 25,692
Other revenue 17,872 20,367
Total non-airline revenue 315,250 297,950
Total Operating Revenues 514,600$ 500,953$
For the Year Ended (000s)

13
For FY 2011, Airline HVAC for the heating, ventilation and air conditioning for the terminals has been included in the terminal rent costs per the new Use Agreement. The HVAC and Other category now includes only HVAC for non-terminal customers. Parking fees are charged based on the length of time and parking product. DFW’s primary parking products include terminal ($18-19 per day), express ($10-12 per day) and remote ($8 per day). Parking revenues increased $9.9 million (10.1%) from $97.3 million in FY 2010 to $107.2 million in FY 2011 due to an increase in originating passengers and an increase in parking rates. Terminal parking revenues accounted for 66.4% and 66.5% of total parking revenues in FY 2011 and FY 2010, respectively. Concession revenues (e.g., food and beverage, retail, passenger services, and advertising) increased $6.3 million (12.3%), from $51.2 million in FY 2010 to $57.5 million in FY 2011, primarily due to an increase in enplaned passengers, a higher average spend per enplanement, new concepts, and contract compliance adjustments for prior year concessionaire sales of $1.0 million. Rent-A-Car (RAC) lease and rentals revenue consists of ground leases plus a percentage rent based on gross revenues. RAC revenues increased in FY 2011 to $27.7 million from $25.7 million in FY2010, a $2.0 million increase (7.7%) resulting from more destination passengers. Percentage rent accounted for 84.9% of the total RAC rental revenues in FY 2011 and 84.2% in FY 2010. Ground and facility lease revenues consist primarily of ground leases of Airport property, various facility leases, Hyatt Regency Hotel, and other. Ground and facility lease revenue increased $5.2 million (18.6%) from $28.0 million in FY 2010 to $33.2 million in FY 2011 primarily due to an increase in the average rental rate per acre according to the new Use Agreement, and one-time payments for hangar rentals. RAC customer transportation revenue is charged directly to the Rent-A-Car companies as a pass through cost to renters and is derived from a $2.20 per rental day transaction fee to fund operation and maintenance of the bus fleet used to transport passengers from the airport terminals to the RAC. RAC transportation revenue increased $1.1 million (11.9%), from $9.2 million in FY 2010 to $10.3 million in FY 2011 due to an increase in destination passengers. Employee transportation revenues consist primarily of the $44 monthly fee paid by airlines and other tenants for transportation services for their employees from remote parking lots to the terminals. Employee transportation revenues increased $0.4 million (5.2%) from $7.7 million in FY 2010 to $8.1 million in FY 2011 primarily due to a fee increase of $4 per month, from $40 per month. Taxi and limo fees represent the access, decal, and application fees charged to taxicab, limousine, shared ride, and courtesy van companies and providers. Taxi and limo fees were $0.5 million (6.9%) higher in FY 2011 as compared to FY 2010 due to customer preference shifting from drop-offs. Natural gas revenues include royalties and property and surface use fees resulting from natural gas drilling. Natural gas decreased $5.4 million (21.2%) from $25.5 million in FY 2010 to $20.1 million in FY 2011 due to reduced production and a decline in natural gas prices. Royalty revenue accounted for 93.4% of the total natural gas revenue in FY 2010 and 80.6% in FY 2011. The Grand Hyatt Hotel operations include room rental, food and beverage and other revenues. Revenues decreased $0.2 million (0.7%), from $25.7 million in FY 2011 to $25.5 million in FY 2011 primarily due to lower food and beverage revenues. Other revenue is comprised of General Aviation fees related to fueling and aircraft service fees; the fuel farm fees paid by the airlines to retire the debt incurred to construct the fueling system and overhead of the fuel farm; non-airline utilities; pass-through revenues from airline and tenants; building code/standard fees; and other miscellaneous revenues offset by non-airline bad debt. Other revenue decreased $2.5 million (12.3%) from $20.4 million in FY 2010 to $17.9 million in FY 2011 primarily due to a decrease in non-airline utilities and the reclassification of miscellaneous airline revenue per the new use agreement.

14
Operating Expenses: The following table highlights the major components of operating expenses for the fiscal years ended September 30, 2011 and 2010. Significant variance explanations follow. FY 2011 Compared to FY 2010 Salaries, wages and benefits increased $9.5 million (6.0%) from $157.8 million in FY 2011 to $167.3 million in FY 2011 primarily due to more employees, a merit salary increase, and higher health care costs. DFW employed 1,843 and 1,825 full time employees as of September 30, 2011 and 2010, respectively. Contract services include grounds and facility maintenance, busing services, financial and legal services, software and hardware maintenance, advertising, planning and other professional services. Contract services increased $7.0 million (5.7%), from $122.0 million in FY 2010 to $129.0 million in FY 2011, due to a higher information and telecommunications systems, terminal maintenance and legal costs. Utilities represent the cost of electricity, natural gas, potable water, trash removal, and telecommunications services. Utilities decreased $2.0 million (6.6%), from $30.3 million in FY 2010 to $28.3 million in FY 2011, primarily due to lower usage and lower electricity rates. Electricity represented 72.8% of this expense category in FY 2011 and 70.2% in FY 2010. Equipment and supplies primarily consists of non-capitalized equipment, materials, fuel for vehicles, and supplies used to maintain and operate the Airport. Equipment and supplies increased $5.2 million (25.0%), from $20.8 million in FY 2010 to $26.0 million in FY 2011, primarily due to an increase in fuels and de-icing fluid. Grand Hyatt Hotel operations include room, food and beverage and other expenses. Operating costs decreased $0.4 million (2.1%) from $18.7 million in FY 2010 to $18.3 million in FY 2011, due to decreased room expenses. General, administrative and other charges increased $1.1 million (21.6%), from $5.1 million in FY 2010 to $6.2 million in FY 2011, primarily due to higher travel, sponsorship, meeting, and staff training costs. Depreciation increased $39.3 million (20.4%) in FY 2011 due to the change in accounting estimate (remaining useful life) of assets being replaced through the TRIP. Within the cost categories mentioned above, DFW spent approximately $2.7 million in preparing for the significant spike in air travel resulting from Super Bowl XLV hosted at Cowboy Stadium in Arlington. These costs went towards making various improvements throughout the central terminal area, as well as
For the Year Ended (000s)Operating Expenses: FY 2011 FY 2010
Salaries, wages, and benefits 167,334$ 157,810$
Contract services 128,982 121,950
Utilities 28,274 30,328
Equipment and supplies 25,993 20,842
Grand Hyatt Hotel 18,320 18,716
Insurance 4,118 4,590
General, administrative and other charges 6,172 5,058
Depreciation and amortization 232,277 192,958
Total Operating Expenses 611,470$ 552,252$
15
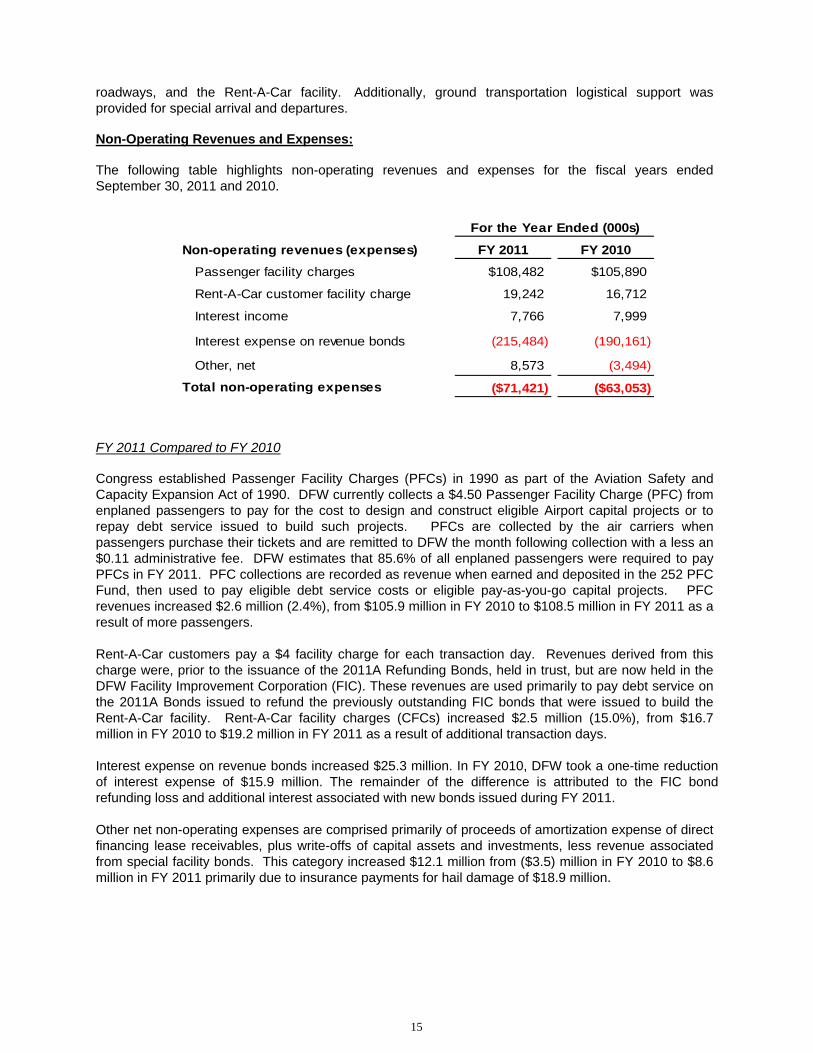
roadways, and the Rent-A-Car facility. Additionally, ground transportation logistical support was provided for special arrival and departures. Non-Operating Revenues and Expenses: The following table highlights non-operating revenues and expenses for the fiscal years ended September 30, 2011 and 2010. FY 2011 Compared to FY 2010 Congress established Passenger Facility Charges (PFCs) in 1990 as part of the Aviation Safety and Capacity Expansion Act of 1990. DFW currently collects a $4.50 Passenger Facility Charge (PFC) from enplaned passengers to pay for the cost to design and construct eligible Airport capital projects or to repay debt service issued to build such projects. PFCs are collected by the air carriers when passengers purchase their tickets and are remitted to DFW the month following collection with a less an $0.11 administrative fee. DFW estimates that 85.6% of all enplaned passengers were required to pay PFCs in FY 2011. PFC collections are recorded as revenue when earned and deposited in the 252 PFC Fund, then used to pay eligible debt service costs or eligible pay-as-you-go capital projects. PFC revenues increased $2.6 million (2.4%), from $105.9 million in FY 2010 to $108.5 million in FY 2011 as a result of more passengers. Rent-A-Car customers pay a $4 facility charge for each transaction day. Revenues derived from this charge were, prior to the issuance of the 2011A Refunding Bonds, held in trust, but are now held in the DFW Facility Improvement Corporation (FIC). These revenues are used primarily to pay debt service on the 2011A Bonds issued to refund the previously outstanding FIC bonds that were issued to build the Rent-A-Car facility. Rent-A-Car facility charges (CFCs) increased $2.5 million (15.0%), from $16.7 million in FY 2010 to $19.2 million in FY 2011 as a result of additional transaction days. Interest expense on revenue bonds increased $25.3 million. In FY 2010, DFW took a one-time reduction of interest expense of $15.9 million. The remainder of the difference is attributed to the FIC bond refunding loss and additional interest associated with new bonds issued during FY 2011. Other net non-operating expenses are comprised primarily of proceeds of amortization expense of direct financing lease receivables, plus write-offs of capital assets and investments, less revenue associated from special facility bonds. This category increased $12.1 million from ($3.5) million in FY 2010 to $8.6 million in FY 2011 primarily due to insurance payments for hail damage of $18.9 million.
Non-operating revenues (expenses) FY 2011 FY 2010
Passenger facility charges $108,482 $105,890
Rent-A-Car customer facility charge 19,242 16,712
Interest income 7,766 7,999
Interest expense on revenue bonds (215,484) (190,161)
Other, net 8,573 (3,494)
Total non-operating expenses ($71,421) ($63,053)
For the Year Ended (000s)
16
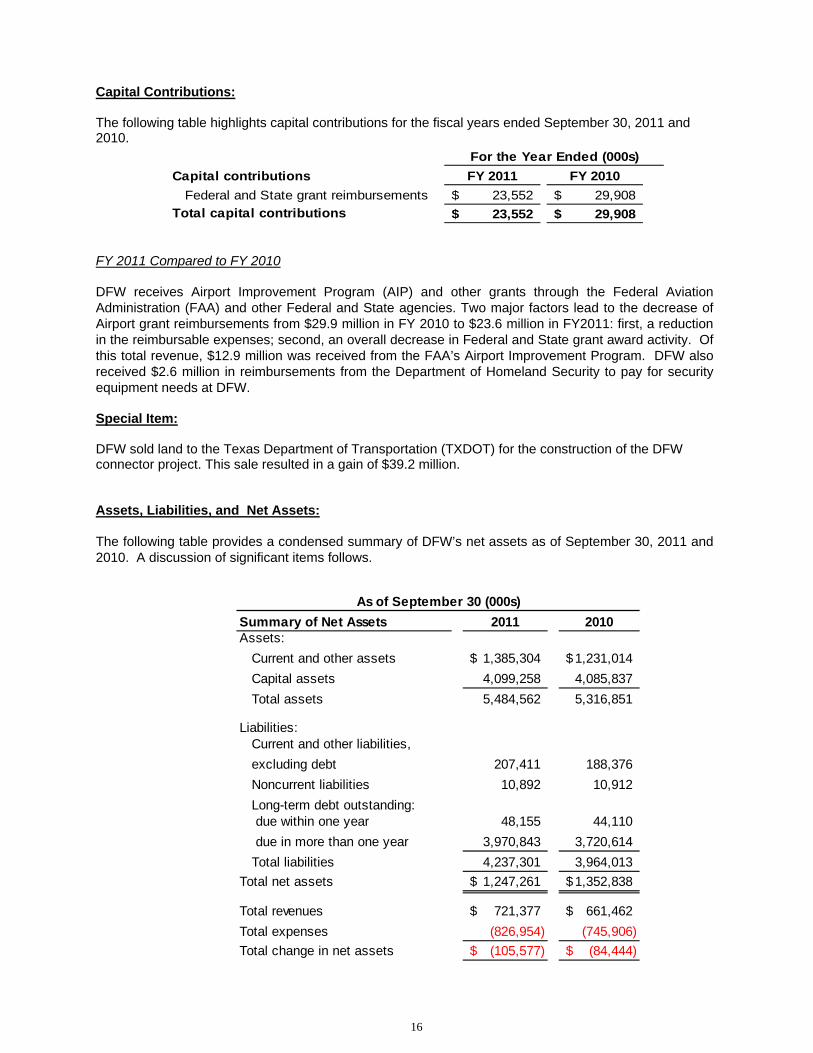
Capital Contributions: The following table highlights capital contributions for the fiscal years ended September 30, 2011 and 2010. FY 2011 Compared to FY 2010 DFW receives Airport Improvement Program (AIP) and other grants through the Federal Aviation Administration (FAA) and other Federal and State agencies. Two major factors lead to the decrease of Airport grant reimbursements from $29.9 million in FY 2010 to $23.6 million in FY2011: first, a reduction in the reimbursable expenses; second, an overall decrease in Federal and State grant award activity. Of this total revenue, $12.9 million was received from the FAA’s Airport Improvement Program. DFW also received $2.6 million in reimbursements from the Department of Homeland Security to pay for security equipment needs at DFW. Special Item: DFW sold land to the Texas Department of Transportation (TXDOT) for the construction of the DFW connector project. This sale resulted in a gain of $39.2 million. Assets, Liabilities, and Net Assets: The following table provides a condensed summary of DFW’s net assets as of September 30, 2011 and 2010. A discussion of significant items follows.
Summary of Net Assets 2011 2010Assets:
Current and other assets 1,385,304$ 1,231,014$
Capital assets 4,099,258 4,085,837
Total assets 5,484,562 5,316,851
Liabilities: Current and other liabilities,
excluding debt 207,411 188,376
Noncurrent liabilities 10,892 10,912
Long-term debt outstanding: due within one year 48,155 44,110
due in more than one year 3,970,843 3,720,614
Total liabilities 4,237,301 3,964,013
Total net assets 1,247,261$ 1,352,838$
Total revenues 721,377$ 661,462$
Total expenses (826,954) (745,906)
Total change in net assets (105,577)$ (84,444)$
As of September 30 (000s)
Capital contributions FY 2011 FY 2010
Federal and State grant reimbursements 23,552$ 29,908$
Total capital contributions 23,552$ 29,908$
For the Year Ended (000s)

17
Total current and other assets increased $154.3 million from $1.23 billion in FY 2010 to $1.39 billion in FY 2011 primarily due to the bond proceeds received, but not yet applied to capital expenditures. Total liabilities increased $273.3 million from $3.97 billion in FY 2010 to $4.24 billion in FY 2011 primarily due to the issuance of new debt and current liabilities associated with TRIP construction-in-process. The following table summarizes net assets as of September 30, 2011 and 2010. Net Assets, Invested in capital assets, net of related debt decreased $73.3 million primarily due to depreciation (the reduction in the remaining life of assets being replaced by TRIP) exceeding new capital assets not funded by debt and the payment of bond principal. Restricted net assets, FIC/PFIC increased $26.2 million in FY 2011 primarily due to capital activity. Restricted net assets, PFC’s represent the cash and investments held from the collection of PFCs that will be used in the future to pay eligible debt service. PFCs paid approximately 56% of the total debt service in FY 2011 and FY 2010. The PFC balance decreased $22.5 million in FY 2011 as funds have been used to pay eligible debt service in excess of PFC revenues. Restricted net assets, public safety represents cash obtained during seizures and arrests. These funds may only be used for public safety and security purposes as defined by Federal law. Unrestricted Net Assets at September 30, 2011 were $591.1 million, a decrease of $36.5 million from FY 2010 due to use of the DFW capital account and joint capital account cash balances for capital projects. Unrestricted net assets may be used by DFW for any lawful purpose. Liquidity and Financing As of September, 30, 2011, DFW had total cash and investments of $1.2 billion of which $573 million was unrestricted. Unrestricted cash and investments may be used for any lawful airport purpose, including capital expenditures, the payment of Operation and Maintenance expenses, and the payment of debt service should the reserves restricted for debt service be inadequate. As of September 30, 2011, DFW has $3.9 billion of fixed rate bonds outstanding. Currently, DFW has no SWAPs or variable rate debt. Under the current Use Agreement DFW and the airlines agreed to the amount of debt service to be paid annually by rates, fees and charges through 2020. As a result of this agreement and favorable bond market conditions, DFW issued four refunding series during FY 2011 and achieved $62.3 million in net present value savings and $73.5 million in actual savings. One of the above refundings is related to the consolidated Rent-A-Car (RAC) revenue bonds issued by the DFW Facility Improvement Corporation (FIC) to construct the RAC facility. DFW issued its taxable 2011A refunding bonds to refinance the 1998 and 1999 FIC bonds. Of the total net present value savings and actual savings previously mentioned, the FIC refunding accounted for $24.1 million in net
Net assets 2011 2010
Invested in capital assets, net of debt 542,984$ 616,286$
Restricted net assets:FIC/PFIC 31,068 4,860
Passenger facility charges 79,244 101,689
Public safety 2,852 2,398
Total restricted 113,164 108,948
Unrestricted net assets 591,113 627,603
Total net assets 1,247,261$ 1,352,838$
As of September 30 (000s)
18
present value savings and $36.2 million in actual savings. The purpose of this refunding was to obtain lower interest costs by issuing bonds secured by the revenues of the Airport instead of solely by customer facility charges. In conjunction with this refunding, the FIC and the Airport entered into a facility agreement, whereby the FIC agreed to transfer monthly to the 102 Fund an amount sufficient to pay debt service and incremental coverage on the refunding bonds. DFW’s expects that it will continue to issue future refunding bonds to lower interest rates, achieve net present value savings, and restructure future debt service payments to achieve a steady increase (approximately $5 million per year) in rates, fees and charges for debt service paid by the airlines between FY 2012 and FY 2020. DFW funds major renewal projects like the TRIP or runway improvements and expansion projects through the issuance of debt, net of available FAA discretionary funding. Minor renewals and replacements are generally funded out of the DFW capital account. The issuance of debt requires airline approval, with some exceptions for commercial development. As of September 30, 2011, the airlines had approved the issuance of debt to finance the TRIP plus approximately $400 million of other projects. DFW issued the 2011A Bonds totaling $304.4 million for the TRIP during FY 2011. Depending upon contract terms, DFW may be required to identify and have available funds (joint/DFW capital, grants, debt, and PFCs) before it can enter into a contract for capital programs. DFW is currently monitoring the cash flow and contracting requirements for the TRIP and other approved projects, and expects to issue additional bonds in the future to meet capital funding needs. Generally, DFW capitalizes interest on major capital programs like the TRIP between the time of borrowing and date of beneficial occupancy. DFW uses PFCs to pay a portion of eligible debt service on outstanding debt. The remaining debt service is paid by the three cost centers. Additional information on long-term capital asset activity and debt activity are disclosed in notes 4 and 6 to the financial statements. Request for Information This financial report is designed to provide a general overview of the Airport’s finances for all those with an interest. Questions concerning any of the information presented in this report or requests for additional information should be addressed to the Office of the Executive Vice President and Chief Financial Officer, 3200 East Airfield Drive, P.O. Box 619428, DFW Airport, Texas 75261-9428.

Dallas/Fort Worth International Airport
Statement of Net Assets As of September 30, 2011 (Amounts in Thousands)
See accompanying notes to the basic financial statements. 19
2011
Assets
Current assets
Cash and cash equivalents (notes 1d, 2) 203,612$
Restricted cash and cash equivalents (notes 1d, 1n, 2, 8) 122,313
Investments (notes 1d,2) 71,830
Restricted investments (notes 1d, 1n, 2, 8) 84,868
Accounts receivable, net of allow ance for doubtful account of $12.2 (note 1e) 58,914
Materials and supplies inventories (notes 1f) 2,049
Other current assets 4,540
Other restricted assets ( notes 1n, 8) 18,144
Total current assets 566,270
Non-current assets
Restricted Cash and cash equivalents (notes 1n, 1d, 8) 99,346
Investments (notes 1d, 2) 297,175
Restricted investments (notes 1d, 1n, 2, 8) 281,843
Capital assets, net (notes 1g, 4)
Non-depreciable 543,005
Depreciable, net 3,556,253
Total capital assets, net 4,099,258
Deferred f inancing charges 77,865
Net pension and other post employment benefit assets (note 9, 10) 56,713
Other restricted assets 6,092
Total non-current assets 4,918,292
Total assets 5,484,562
Liabilities
Current liabilities
Accounts payable and other current liabilities (note 5) 91,486
Current payable from restricted assets (notes 1n, 8) 115,925
Current portion of joint revenue and PFIC bonds payable (note 1n, 6) 48,155
Total current liabilities 255,566
Long-term liabilities
Other long-term liabilities (notes 1n) 10,892
Joint revenue bonds payable (note 6) 3,901,032
Public facility improvement corporation bonds payable (note 6) 69,811
Total long-term liabilities 3,981,735
Total liabilities 4,237,301
Net Assets (notes 7, 8)
Invested in capital assets, net of related debt 542,984
Restricted for:
FIC/PFIC 31,068
Passenger facility charges 79,244
Public safety 2,852
Total restricted 113,164
Unrestricted 591,113
Total Net Assets 1,247,261$
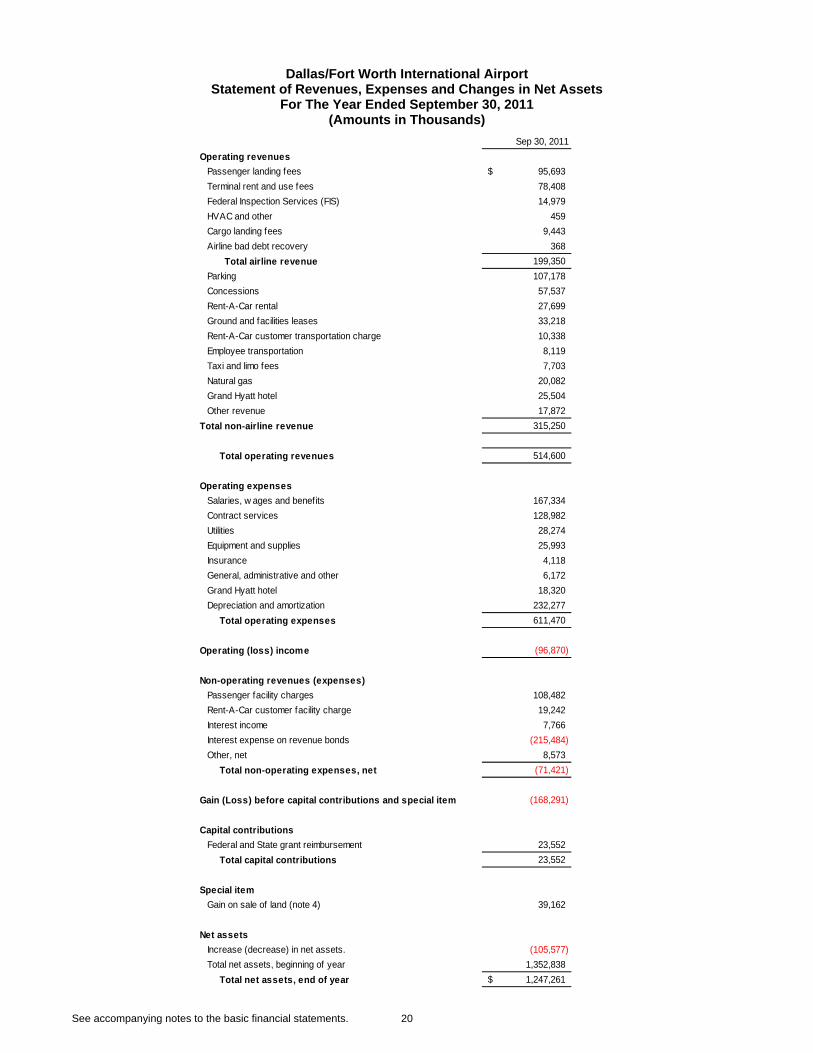
Dallas/Fort Worth International Airport
Statement of Revenues, Expenses and Changes in Net Assets For The Year Ended September 30, 2011
(Amounts in Thousands)
See accompanying notes to the basic financial statements. 20
Sep 30, 2011
Operating revenues
Passenger landing fees 95,693$
Terminal rent and use fees 78,408
Federal Inspection Services (FIS) 14,979
HVAC and other 459
Cargo landing fees 9,443
Airline bad debt recovery 368
Total airline revenue 199,350
Parking 107,178
Concessions 57,537
Rent-A-Car rental 27,699
Ground and facilities leases 33,218
Rent-A-Car customer transportation charge 10,338
Employee transportation 8,119
Taxi and limo fees 7,703
Natural gas 20,082
Grand Hyatt hotel 25,504
Other revenue 17,872
Total non-airline revenue 315,250
Total operating revenues 514,600
Operating expenses
Salaries, w ages and benefits 167,334
Contract services 128,982
Utilities 28,274
Equipment and supplies 25,993
Insurance 4,118
General, administrative and other 6,172
Grand Hyatt hotel 18,320
Depreciation and amortization 232,277
Total operating expenses 611,470
Operating (loss) income (96,870)
Non-operating revenues (expenses)
Passenger facility charges 108,482
Rent-A-Car customer facility charge 19,242
Interest income 7,766
Interest expense on revenue bonds (215,484)
Other, net 8,573
Total non-operating expenses, net (71,421)
Gain (Loss) before capital contributions and special item (168,291)
Capital contributions
Federal and State grant reimbursement 23,552
Total capital contributions 23,552
Special item
Gain on sale of land (note 4) 39,162
Net assets
Increase (decrease) in net assets. (105,577)
Total net assets, beginning of year 1,352,838
Total net assets, end of year 1,247,261$

Dallas/Fort Worth International Airport
Statement of Cash Flows For The Year Ended September 30, 2011
(Amounts in Thousands)
See accompanying notes to the basic financial statements. 21
2011Cash flows from operating activities:
Cash received from operations 519,010$ Cash paid to outside vendors (210,415)Cash paid to employees (158,206) Net cash provided by operating activities 150,389
Cash flows from capital and related financing activities:Acquisition and construction of capital assets (240,471) Proceeds from retirement of assets 39,649Deferred financing charges (8,046)Proceeds from sale of revenue bonds 789,340Premiums from sale of bonds 22,962Payments to escrow agent (510,567)Principal paid on revenue bonds (48,817)Interest paid on revenue bonds (211,847)Federal and state grants receipts 23,552Passenger facility charges 107,938Rental car financing fees 19,242
Net cash used in capital and related financing activities (17,065)
Cash flows from investing activities:Interest received on investments 6,569 Purchase of investments (1,720,758)Sale and maturity of investments 1,469,080 Net cash used by investing activities (245,109)
Net decrease in cash and cash equivalents (111,785)
Cash and cash equivalents, beginning of year 537,056
Cash and cash equivalents, end of year 425,271$
Unrestricted cash and cash equivalents $203,612Restricted cash and cash equivalents 221,659
Cash and cash equivalents, end of year 425,271$
Reconciliation of operating income (loss) to net cashprovided by operating activities:Operating income (loss) (96,870) Adjustments to reconcile operating income (loss) to net cash provided by operating activities:
Depreciation 232,277Changes in assets and liabilities:
Accounts receivable 6,110Materials and supplies inventories (275)Other current assets (1,699)Net pension and OPEB assets 348Accounts payable, other liabilities, and deferred revenue 1,370Accrued payroll & related expenses 9,128 Net cash provided by operating activities 150,389$
Supplemental disclosure of non-cash activitiesAssets acquired under capital lease 32Amortization of bond premium/discount (3,196)Amortization of bond issuance cost 5,783Unrealized gain (loss) on investments 114Capitalized Interest 1,084
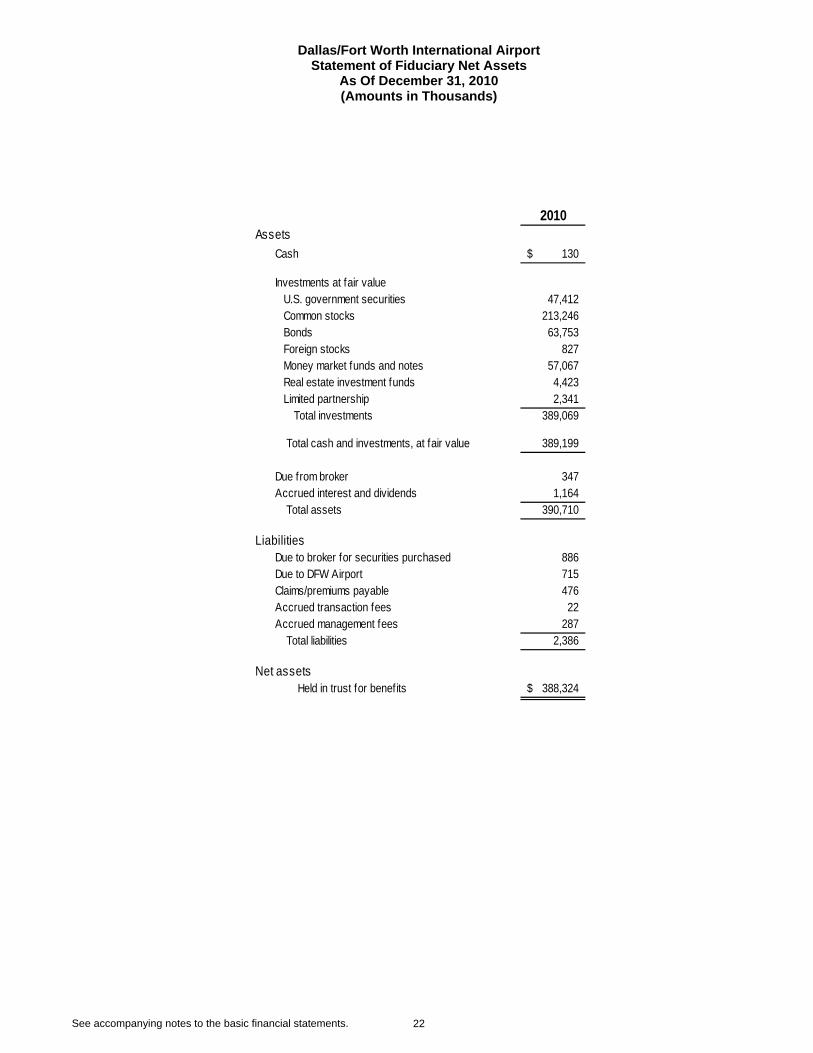
Dallas/Fort Worth International Airport
Statement of Fiduciary Net Assets As Of December 31, 2010 (Amounts in Thousands)
See accompanying notes to the basic financial statements. 22
2010Assets
Cash 130$
Investments at fair value U.S. government securities 47,412 Common stocks 213,246 Bonds 63,753 Foreign stocks 827 Money market funds and notes 57,067 Real estate investment funds 4,423 Limited partnership 2,341
Total investments 389,069
Total cash and investments, at fair value 389,199
Due from broker 347 Accrued interest and dividends 1,164
Total assets 390,710
LiabilitiesDue to broker for securities purchased 886 Due to DFW Airport 715 Claims/premiums payable 476 Accrued transaction fees 22 Accrued management fees 287
Total liabilities 2,386
Net assetsHeld in trust for benefits 388,324$
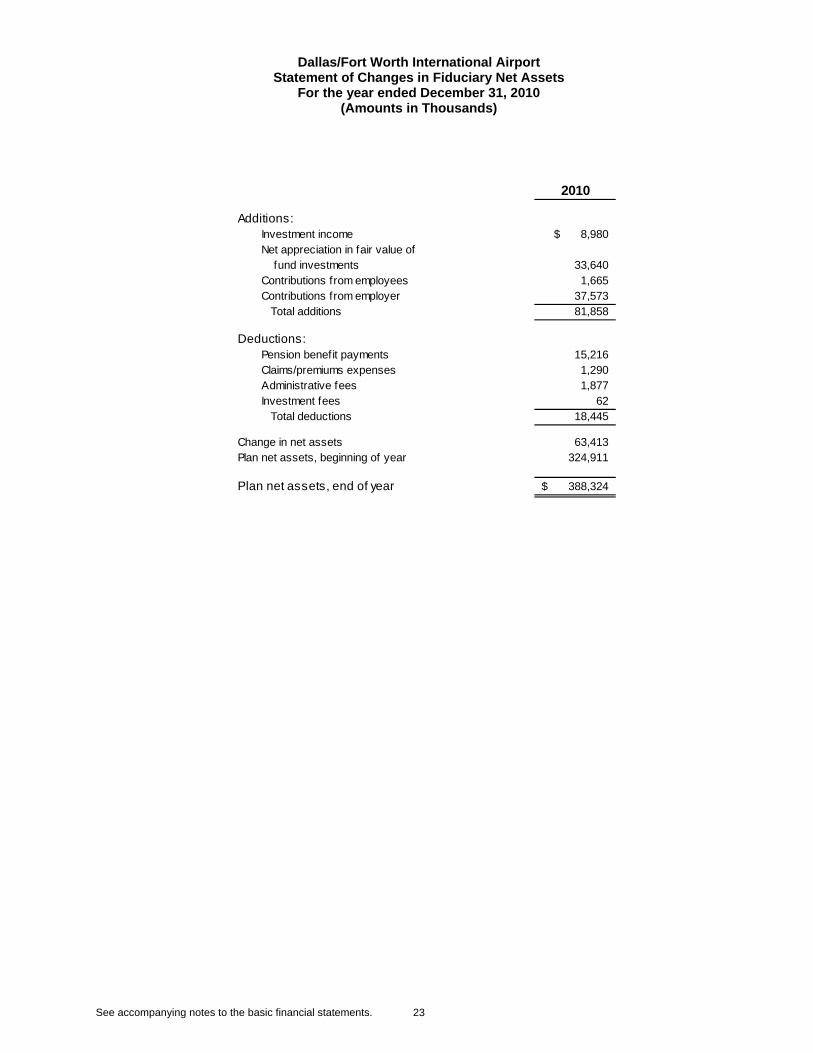
Dallas/Fort Worth International Airport
Statement of Changes in Fiduciary Net Assets For the year ended December 31, 2010
(Amounts in Thousands)
See accompanying notes to the basic financial statements. 23
2010
Additions:Investment income 8,980$ Net appreciation in fair value of fund investments 33,640 Contributions from employees 1,665 Contributions from employer 37,573 Total additions 81,858
Deductions:Pension benefit payments 15,216 Claims/premiums expenses 1,290 Administrative fees 1,877 Investment fees 62 Total deductions 18,445
Change in net assets 63,413 Plan net assets, beginning of year 324,911
Plan net assets, end of year 388,324$

“This Page Intentionally left Blank”

Dallas /Fort Worth International Airport Notes To The Basic Financial Statements
September 30, 2011
24
Footnote Reference
Note Page
1. Summary of Significant Accounting and Reporting Policies 25
2. Deposits and Investments 31
3. Related-Party Transactions 35
4. Capital Assets 36
5. Accounts Payable and Other Current Liabilities 36
6. Long-Term Debt 37
7. Net Assets 40
8. Restricted Assets and Liabilities 41
9. Retirement Plans 42
10. Other Post-Employment Benefits (OPEB) 44
11. PFIC Background and Financial Information 48
12. Commitments and Contingencies 49
13. Self-Insurance/Risk Management 49
14. Concentration of Credit Risk 50
15. Pollution Remediation 50
16. Subsequent Events 50

Dallas /Fort Worth International Airport Notes To The Basic Financial Statements
September 30, 2011
25
(1) SUMMARY OF SIGNIFICANT ACCOUNTING AND REPORTING POLICIES
(a) Reporting Entity
The Dallas/Fort Worth International Airport (DFW or the Airport) was created by the Contract and Agreement between the City of Dallas, Texas, and the City of Fort Worth, Texas, effective April 15, 1968 (Contract and Agreement), for the purpose of developing and operating an airport as a joint venture of the Cities of Dallas and Fort Worth (the Cities) in accordance with the Contract and Agreement. The initial capital was contributed by the Cities. The Cities approve the Airport’s annual budget and all bond sales, but have no responsibility for the Airport’s debt service requirements. The DFW Airport Board of Directors (the Board) is composed of 12 members, 11 of whom are voting members (seven of which are appointed by Dallas and four by Fort Worth) in accordance with each city’s ownership interest in the Airport. The 12th position rotates between the Airport’s host cities of Irving, Grapevine, Euless or Coppell and is non-voting. The Board is a semi-autonomous body charged with governing the Airport and may enter into contracts without approval of the City Councils. The Board appoints the Chief Executive Officer, who is charged with the day-to-day operations of the Airport. The Chief Executive Officer, in turn, hires a management team to assist him in that responsibility. The Airport’s financial statements include all of the transactions of the Dallas/Fort Worth Airport Public Facility Improvement Corporation (PFIC), which operates the Grand Hyatt Hotel, and the Facility Improvement Corporation (FIC) which collects customer facility and transportation charges from rental car customers. Although, the FIC and PFIC are legally separate entities, the financial transactions of PFIC and the FIC have been included into the Airport’s Enterprise Fund due to their nature and significance to the Airport and to comply with Governmental Accounting Standards Board (GASB) Statement 14, The Financial Reporting Entity as amended by GASB 39 Determining whether Certain Organizations are Component Units. The FIC and PFIC are considered blended component units because the component units’ governing bodies are substantively the same as the DFW Airport Board, the primary government. See footnote 6(b) for a discussion of the remaining FIC transactions. In addition, the component units provide direct benefits exclusively or almost exclusively to DFW, the primary government. The Airport has two fiduciary pension plans covering substantially all DFW employees with the plan year ended December 31, 2010: the Employees of Dallas/Fort Worth International Airport Retirement Plan and the Department of Public Safety (DPS) Retirement Plan (Retirement Plans, collectively). DFW has a single-employer defined Other Post Employment Benefit Plan (OPEB) providing retiree health care for qualified retired employees ages 65 or younger with the plan year ended December 31, 2010. Additionally, DFW offers a deferred compensation plan 401(a) for employees hired on or after January 1, 2010 (excludes Department of Public Safety employees.) \

Dallas /Fort Worth International Airport Notes To The Basic Financial Statements
September 30, 2011
26
(b) Basis of Accounting
The accounts of the Airport are organized into an Enterprise Fund which represents the business-type activities, and two Pension Trust Funds and one OPEB Trust Fund which represent the fiduciary activities. The Airport uses a separate set of self-balancing accounts for each fund, including assets, liabilities, net assets, revenues, and expenses. The Airport includes its fiduciary pension plans in its financial statements. The Basic Financial Statements and Required Supplementary Information (RSI) of the Airport consist of Management’s Discussion and Analysis; Statement of Net Assets; Statement of Revenues, Expenses, and Changes in Net Assets; Statement of Cash Flows; Statement of Fiduciary Net Assets; Statement of Changes in Fiduciary Net Assets; Notes to the Basic Financial Statements; and Schedules of Funding Progress. The funds are categorized into two generic fund types and three broad categories as follows: Enterprise Fund – The financial statements of the Enterprise Fund use the economic resource measurement focus and are presented on the accrual basis of accounting. Revenues are recorded when earned. DFW’s operating revenues are derived from fees paid by airlines, tenants, concessionaires, patrons who park at DFW, natural gas royalties, hotel transactions, and others. The fees are based on usage rates established by DFW and/or methodologies established in the Use Agreement. Expenses are recognized when incurred. The Airport constructs facilities to provide services to others, which are financed in part by the issuance of its revenue bonds. Airline users generally contract to pay amounts equal to the Airport’s operating and maintenance expenses (excluding depreciation), debt service and coverage requirements, and any other obligations payable from the revenues of the Airport. Fiduciary Funds – The financial statements of the Fiduciary Funds include the Pension trust funds and OPEB trust fund, and use the economic resource measurement focus and are presented on the accrual basis of accounting. The Fiduciary Funds are maintained to account for assets held by the Airport in a trustee capacity for active and retired employees. Contributions are recognized in the period in which the contributions are due. Benefits, refunds, claims and premiums are recognized when due and payable in accordance with the terms of each plan. The Fiduciary Funds’ fiscal year end is December 31 of each year. The amounts presented in these financial statements are as of and for the year ended December 31, 2010.
(c) Basis of Presentation
The Airport applies GASB pronouncements as well as the Financial Accounting Standards Board pronouncements issued on or before November 30, 1989, unless those pronouncements conflict with or contradict GASB pronouncements. The Airport distinguishes between operating revenues and non-operating revenues based on the nature of revenues and expenses. In general, revenues and related expenses resulting from providing services such as landing, parking, hotel transactions, terminal rental, ground rental and natural gas leases are considered operating. These revenues result from exchange transactions in which each party receives and gives up essentially equal values. Non-operating revenues, such as interest income, passenger facilities charges and customer facility charges, result from non-exchange transactions or ancillary activities. Non-operating

Dallas /Fort Worth International Airport Notes To The Basic Financial Statements
September 30, 2011
27
expenses primarily consist of the interest expense on joint revenue bonds. Grants are recorded as capital contributions.
(d) Cash, Cash Equivalents, and Investments
Cash and cash equivalents For purposes of the statements of cash flows, the Airport considers cash on hand, money market funds, and investments with an original maturity of three months or less, when originally purchased, to be cash equivalents, whether unrestricted or restricted. All bank balances are moved to collateralized overnight sweep accounts. Investments All investments held at September 30, 2011 with maturities of more than one year from the date of purchase are stated at fair value. The amounts necessary to adjust fair value increased $0.1 million in FY 2011. Investments with a maturity of one year or less from the date of purchase are reported at amortized cost. The Airport may invest in obligations of the United States or its agencies, obligations of the State of Texas or its agencies, municipal obligations having a rating not less than AA, bankers’ acceptances, certain repurchase and reverse repurchase agreements, commercial paper, certificates of deposit, certain SEC regulated money market mutual funds, certain local government investment pools, and guaranteed investment contracts. Under the current investment policy, the fiduciary funds invest in money market funds, domestic equities, international equities and fixed income instruments. PFIC investments are governed by a trust indenture between the Airport which define “qualified investments” as obligations of the U.S. Treasury and U.S. agencies, municipal securities, commercial paper, repurchase agreements, nationally recognized institutional mutual funds, and certain other securities. All of the PFIC investments at September 30, 2011 were “qualified investments.”
(e) Accounts Receivable
Receivables are reported at their gross value when earned. The Airport’s collection terms are 20 days. The allowance for uncollectible accounts is based on a weighted aging calculation. As a customer’s balance is deemed uncollectible, the receivable is cleared and the amount is written off. If the balance is subsequently collected, such payments are applied to the allowance account. Accounts receivable are shown net of the allowance for doubtful accounts in the amount of $12.2 million for fiscal year 2011.
(f) Materials and Supplies Inventories
Inventories are valued at the lower of average cost or market and consist primarily of expendable parts and supplies held for consumption within the next year.

Dallas /Fort Worth International Airport Notes To The Basic Financial Statements
September 30, 2011
28
(g) Capital Assets
All capital assets are stated at historical cost or, if donated, at the fair value on the date donated. The capitalization threshold for real property is $50,000 and $15,000 for personal property with a useful life greater than one year. Depreciation is provided on the straight-line method over the following estimated useful lives:
Repairs and maintenance are charged to operations as incurred unless they have the effect of improving or extending the life of the asset, in which case they are capitalized as part of the cost of the asset. Construction-in-progress is composed of costs attributable to construction of taxiways, roads, terminal improvements, systems installation and conversion, and various other projects.
(h) Capitalized Interest
The Airport capitalizes interest costs on bonds outstanding, until the asset is placed in service, net of interest earned on the unexpended bond proceeds. The Airport capitalized interest of $1,084 in FY 2011.
(i) Grants and Federal Reimbursements
Grants and Federal reimbursements are recorded as revenue in the accounting period in which eligibility requirements have been met on projects.
(j) Passenger Facilities Charges (PFC)
The PFC Program is authorized by Federal legislation and allows an airport to impose a fee of up to $4.50 on revenue enplaning passengers for FAA approved projects. DFW collects at the imposed limit. The PFC fee is collected by air carriers and remitted to the Airport on a monthly basis. As of September 30, 2011, the FAA has approved ten PFC applications for the Airport for a total collection authority of $5.7 billion through October 2038 with remaining collection authority of $4.1 billion. DFW is currently collecting PFC’s under PFC Application 10; applications 1 to 4 are closed. Applications 5 to 9 are pending FAA approval for closure.
(k) Deferred Compensation Plans
The Airport offers a deferred compensation plan, created in accordance with Internal Revenue Code Section 457, to all Airport employees to allow them to defer a portion of their salaries up to IRS limits until future years. The deferred compensation is not available to employees until termination, retirement, death, or an unforeseeable emergency. Amounts are held in trust for the benefit of the Airport’s employees and are not subject to claims of the Airport’s general creditors. The Airport is not the trustee of the Deferred Compensation Plan.
Buildings 10 - 50 yearsImprovements other than buildings 10 - 50 yearsMachinery and equipment 3 - 30 yearsVehicles 2 - 20 years
Dallas /Fort Worth International Airport Notes To The Basic Financial Statements
September 30, 2011
29
The 457 Deferred Compensation Plan balances totaling $43.5 million for 2011 are not reported in the assets or liabilities of the Airport in accordance with GASB Statement 32, Accounting and Financial Reporting for Internal Revenue Code Section 457 Deferred Compensation Plans. Beginning January 2010, DFW requires employees, excluding Public Safety Officers, hired after January 1, 2010 to participate in a deferred compensation plan, created in accordance with Internal Revenue Code Section 401(a), in which employees are required to defer 1% to 3% of their salaries, based on tenure. All new employees are also eligible to participate in the 457 Plan for employees hired after January 1, 2010. DFW will match up to 7% of employee contributions to both the 401(a) and 457 plans. The deferred compensation is not available to employees until termination, retirement, death, or an unforeseeable emergency. Amounts are held in trust for the benefit of the Airport’s employee and are not subject to claims of the Airport’s general creditors. The Airport is not the trustee of the Plan. The 401(a) Deferred Compensation Plan balances totaling $0.2 million for 2011 are not reported in the assets or liabilities of the Airport in accordance with GASB Statement 32, Accounting and Financial Reporting for Internal Revenue Code Section 457 Deferred Compensation Plans.
(l) Retirement Plans
It is the policy of the Airport to fund the pension costs of its two retirement funds annually. Pension costs are comprised of normal cost and amortization of unfunded actuarial accrued liability and of unfunded prior service cost. The Airport currently carries a Net Pension Asset of $54.1 million as of September 30, 2011, which is the cumulative difference between the annual pension costs and contribution made to the two retirement pension plans. DFW made a contribution of $34.4 million in calendar year 2010. In prior years, DFW funded its pension plans in excess of the actuarial requirements because it currently has an unfunded pension obligation of approximately $157.0 million as of December 31, 2010. The Pension Plan accounting is in accordance with GASB Statement 25, Financial Reporting for Defined Benefit Pension Plans and Note Disclosures for Defined Contribution Plans, GASB Statement 27, Accounting for Pensions by State and Local Governmental Employers and as amended by GASB Statement 50, Pension Disclosures. Benefits and refunds are recognized when due and payable. Investments are stated at fair value. If available, quoted market prices are used to value investments. Securities that have no quoted market price are valued at estimated fair value using Bloomberg Financial Services. Purchases and sales of investments are recorded on a trade-date basis.
(m) Other Post-Employment Benefits Plan
It is the policy of the Airport to fund the OPEB cost annually. OPEB costs are comprised of normal cost and amortization of the unfunded actuarial accrued liability. The Airport currently carries a Net OPEB Asset of $2.6 million as of September 30, 2011, which is the cumulative difference between the annual OPEB costs and contribution made to the OPEB Plan. DFW made a contribution of $3.2 million in FY 2011.
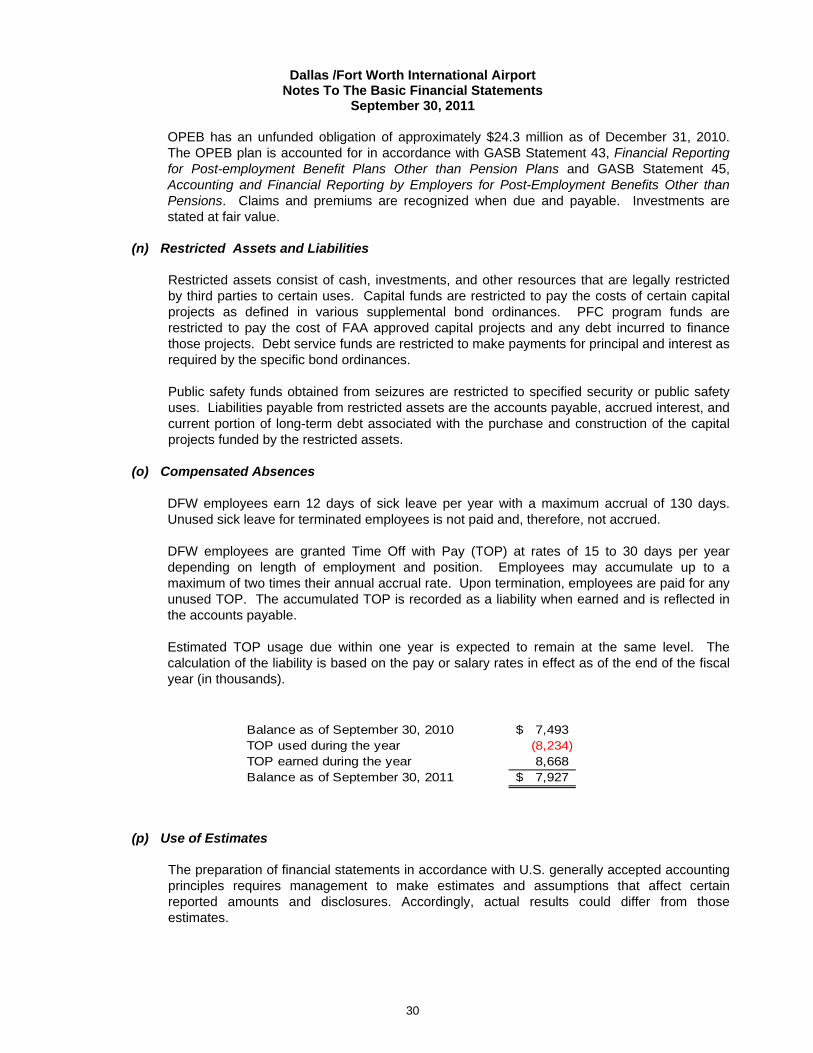
Dallas /Fort Worth International Airport Notes To The Basic Financial Statements
September 30, 2011
30
OPEB has an unfunded obligation of approximately $24.3 million as of December 31, 2010. The OPEB plan is accounted for in accordance with GASB Statement 43, Financial Reporting for Post-employment Benefit Plans Other than Pension Plans and GASB Statement 45, Accounting and Financial Reporting by Employers for Post-Employment Benefits Other than Pensions. Claims and premiums are recognized when due and payable. Investments are stated at fair value.
(n) Restricted Assets and Liabilities
Restricted assets consist of cash, investments, and other resources that are legally restricted by third parties to certain uses. Capital funds are restricted to pay the costs of certain capital projects as defined in various supplemental bond ordinances. PFC program funds are restricted to pay the cost of FAA approved capital projects and any debt incurred to finance those projects. Debt service funds are restricted to make payments for principal and interest as required by the specific bond ordinances. Public safety funds obtained from seizures are restricted to specified security or public safety uses. Liabilities payable from restricted assets are the accounts payable, accrued interest, and current portion of long-term debt associated with the purchase and construction of the capital projects funded by the restricted assets.
(o) Compensated Absences
DFW employees earn 12 days of sick leave per year with a maximum accrual of 130 days. Unused sick leave for terminated employees is not paid and, therefore, not accrued. DFW employees are granted Time Off with Pay (TOP) at rates of 15 to 30 days per year depending on length of employment and position. Employees may accumulate up to a maximum of two times their annual accrual rate. Upon termination, employees are paid for any unused TOP. The accumulated TOP is recorded as a liability when earned and is reflected in the accounts payable. Estimated TOP usage due within one year is expected to remain at the same level. The calculation of the liability is based on the pay or salary rates in effect as of the end of the fiscal year (in thousands).
(p) Use of Estimates
The preparation of financial statements in accordance with U.S. generally accepted accounting principles requires management to make estimates and assumptions that affect certain reported amounts and disclosures. Accordingly, actual results could differ from those estimates.
Balance as of September 30, 2010 7,493$ TOP used during the year (8,234) TOP earned during the year 8,668 Balance as of September 30, 2011 7,927$
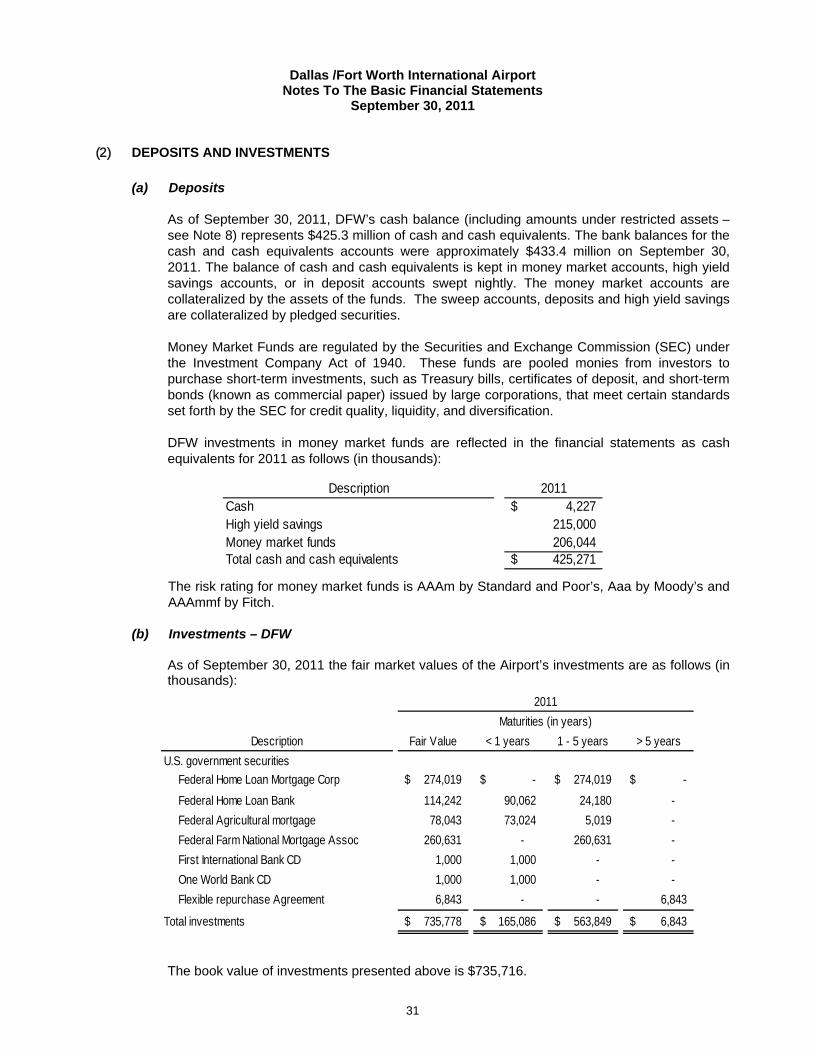
Dallas /Fort Worth International Airport Notes To The Basic Financial Statements
September 30, 2011
31
(2) DEPOSITS AND INVESTMENTS
(a) Deposits
As of September 30, 2011, DFW’s cash balance (including amounts under restricted assets – see Note 8) represents $425.3 million of cash and cash equivalents. The bank balances for the cash and cash equivalents accounts were approximately $433.4 million on September 30, 2011. The balance of cash and cash equivalents is kept in money market accounts, high yield savings accounts, or in deposit accounts swept nightly. The money market accounts are collateralized by the assets of the funds. The sweep accounts, deposits and high yield savings are collateralized by pledged securities. Money Market Funds are regulated by the Securities and Exchange Commission (SEC) under the Investment Company Act of 1940. These funds are pooled monies from investors to purchase short-term investments, such as Treasury bills, certificates of deposit, and short-term bonds (known as commercial paper) issued by large corporations, that meet certain standards set forth by the SEC for credit quality, liquidity, and diversification. DFW investments in money market funds are reflected in the financial statements as cash equivalents for 2011 as follows (in thousands): The risk rating for money market funds is AAAm by Standard and Poor’s, Aaa by Moody’s and AAAmmf by Fitch.
(b) Investments – DFW
As of September 30, 2011 the fair market values of the Airport’s investments are as follows (in thousands):
The book value of investments presented above is $735,716.
Description 2011Cash 4,227$ High yield savings 215,000 Money market funds 206,044 Total cash and cash equivalents 425,271$
Description Fair Value < 1 years 1 - 5 years > 5 years
U.S. government securities
Federal Home Loan Mortgage Corp 274,019$ -$ 274,019$ -$
Federal Home Loan Bank 114,242 90,062 24,180 -
Federal Agricultural mortgage 78,043 73,024 5,019 -
Federal Farm National Mortgage Assoc 260,631 - 260,631 -
First International Bank CD 1,000 1,000 - -
One World Bank CD 1,000 1,000 - -
Flexible repurchase Agreement 6,843 - - 6,843
Total investments 735,778$ 165,086$ 563,849$ 6,843$
2011
Maturities (in years)
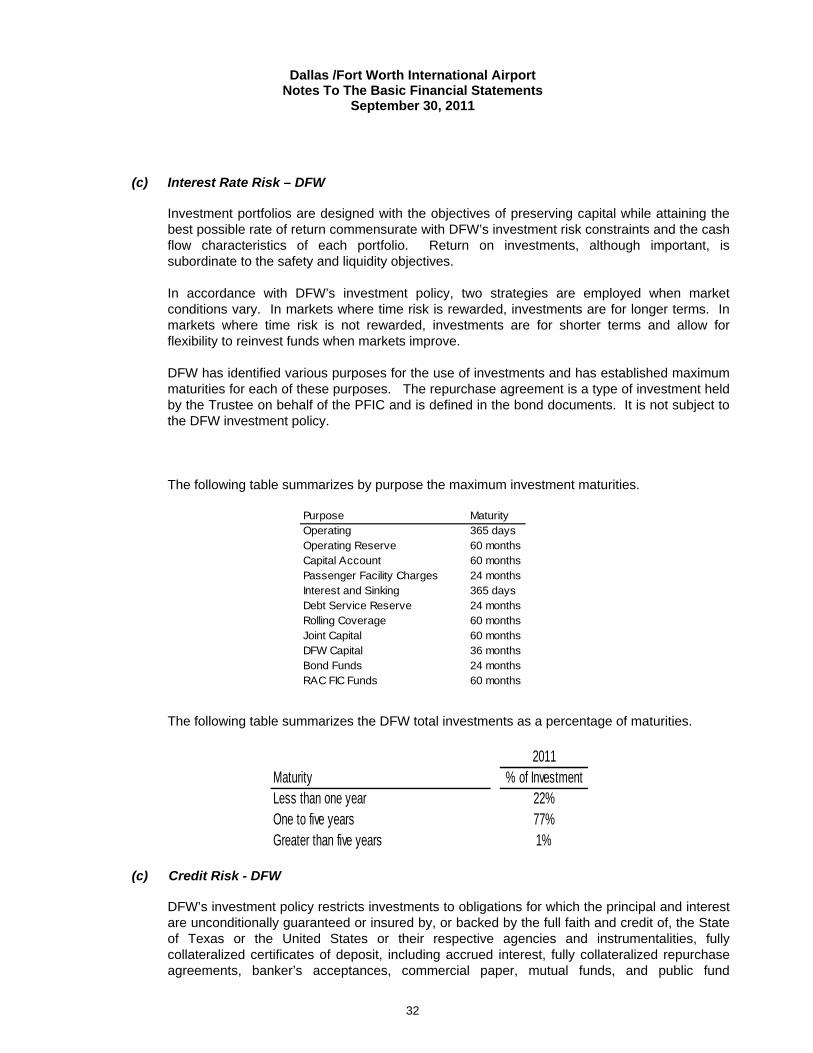
Dallas /Fort Worth International Airport Notes To The Basic Financial Statements
September 30, 2011
32
(c) Interest Rate Risk – DFW
Investment portfolios are designed with the objectives of preserving capital while attaining the best possible rate of return commensurate with DFW’s investment risk constraints and the cash flow characteristics of each portfolio. Return on investments, although important, is subordinate to the safety and liquidity objectives. In accordance with DFW’s investment policy, two strategies are employed when market conditions vary. In markets where time risk is rewarded, investments are for longer terms. In markets where time risk is not rewarded, investments are for shorter terms and allow for flexibility to reinvest funds when markets improve. DFW has identified various purposes for the use of investments and has established maximum maturities for each of these purposes. The repurchase agreement is a type of investment held by the Trustee on behalf of the PFIC and is defined in the bond documents. It is not subject to the DFW investment policy. The following table summarizes by purpose the maximum investment maturities.
The following table summarizes the DFW total investments as a percentage of maturities.
(c) Credit Risk - DFW
DFW’s investment policy restricts investments to obligations for which the principal and interest are unconditionally guaranteed or insured by, or backed by the full faith and credit of, the State of Texas or the United States or their respective agencies and instrumentalities, fully collateralized certificates of deposit, including accrued interest, fully collateralized repurchase agreements, banker’s acceptances, commercial paper, mutual funds, and public fund
2011Maturity % of InvestmentLess than one year 22%One to five years 77%Greater than five years 1%
Purpose MaturityOperating 365 daysOperating Reserve 60 monthsCapital Account 60 monthsPassenger Facility Charges 24 monthsInterest and Sinking 365 daysDebt Service Reserve 24 monthsRolling Coverage 60 monthsJoint Capital 60 monthsDFW Capital 36 monthsBond Funds 24 monthsRAC FIC Funds 60 months
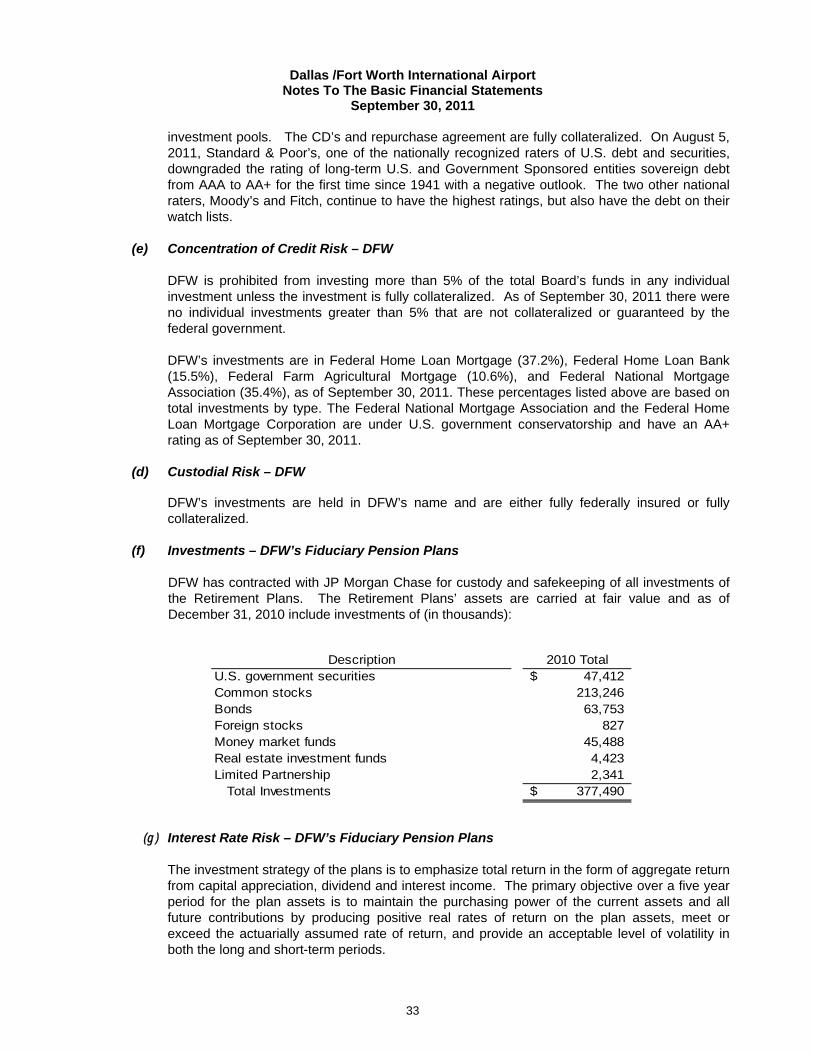
Dallas /Fort Worth International Airport Notes To The Basic Financial Statements
September 30, 2011
33
investment pools. The CD’s and repurchase agreement are fully collateralized. On August 5, 2011, Standard & Poor’s, one of the nationally recognized raters of U.S. debt and securities, downgraded the rating of long-term U.S. and Government Sponsored entities sovereign debt from AAA to AA+ for the first time since 1941 with a negative outlook. The two other national raters, Moody’s and Fitch, continue to have the highest ratings, but also have the debt on their watch lists.
(e) Concentration of Credit Risk – DFW
DFW is prohibited from investing more than 5% of the total Board’s funds in any individual investment unless the investment is fully collateralized. As of September 30, 2011 there were no individual investments greater than 5% that are not collateralized or guaranteed by the federal government. DFW’s investments are in Federal Home Loan Mortgage (37.2%), Federal Home Loan Bank (15.5%), Federal Farm Agricultural Mortgage (10.6%), and Federal National Mortgage Association (35.4%), as of September 30, 2011. These percentages listed above are based on total investments by type. The Federal National Mortgage Association and the Federal Home Loan Mortgage Corporation are under U.S. government conservatorship and have an AA+ rating as of September 30, 2011.
(d) Custodial Risk – DFW DFW’s investments are held in DFW’s name and are either fully federally insured or fully collateralized.
(f) Investments – DFW’s Fiduciary Pension Plans
DFW has contracted with JP Morgan Chase for custody and safekeeping of all investments of the Retirement Plans. The Retirement Plans’ assets are carried at fair value and as of December 31, 2010 include investments of (in thousands):
(g) Interest Rate Risk – DFW’s Fiduciary Pension Plans
The investment strategy of the plans is to emphasize total return in the form of aggregate return from capital appreciation, dividend and interest income. The primary objective over a five year period for the plan assets is to maintain the purchasing power of the current assets and all future contributions by producing positive real rates of return on the plan assets, meet or exceed the actuarially assumed rate of return, and provide an acceptable level of volatility in both the long and short-term periods.
Description 2010 TotalU.S. government securities 47,412$ Common stocks 213,246 Bonds 63,753 Foreign stocks 827 Money market funds 45,488 Real estate investment funds 4,423 Limited Partnership 2,341 Total Investments 377,490$
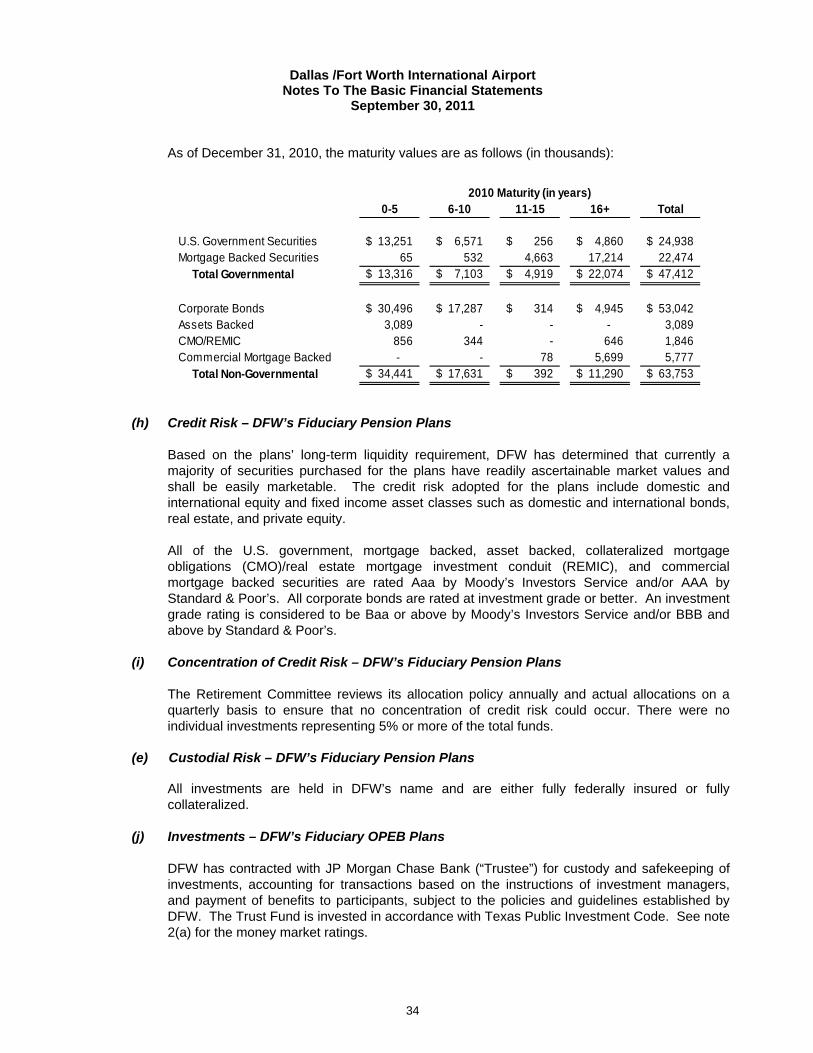
Dallas /Fort Worth International Airport Notes To The Basic Financial Statements
September 30, 2011
34
As of December 31, 2010, the maturity values are as follows (in thousands):
(h) Credit Risk – DFW’s Fiduciary Pension Plans
Based on the plans’ long-term liquidity requirement, DFW has determined that currently a majority of securities purchased for the plans have readily ascertainable market values and shall be easily marketable. The credit risk adopted for the plans include domestic and international equity and fixed income asset classes such as domestic and international bonds, real estate, and private equity. All of the U.S. government, mortgage backed, asset backed, collateralized mortgage obligations (CMO)/real estate mortgage investment conduit (REMIC), and commercial mortgage backed securities are rated Aaa by Moody’s Investors Service and/or AAA by Standard & Poor’s. All corporate bonds are rated at investment grade or better. An investment grade rating is considered to be Baa or above by Moody’s Investors Service and/or BBB and above by Standard & Poor’s.
(i) Concentration of Credit Risk – DFW’s Fiduciary Pension Plans The Retirement Committee reviews its allocation policy annually and actual allocations on a quarterly basis to ensure that no concentration of credit risk could occur. There were no individual investments representing 5% or more of the total funds.
(e) Custodial Risk – DFW’s Fiduciary Pension Plans All investments are held in DFW’s name and are either fully federally insured or fully collateralized.
(j) Investments – DFW’s Fiduciary OPEB Plans
DFW has contracted with JP Morgan Chase Bank (“Trustee”) for custody and safekeeping of investments, accounting for transactions based on the instructions of investment managers, and payment of benefits to participants, subject to the policies and guidelines established by DFW. The Trust Fund is invested in accordance with Texas Public Investment Code. See note 2(a) for the money market ratings.
0-5 6-10 11-15 16+ Total
U.S. Government Securities 13,251$ 6,571$ 256$ 4,860$ 24,938$ Mortgage Backed Securities 65 532 4,663 17,214 22,474 Total Governmental 13,316$ 7,103$ 4,919$ 22,074$ 47,412$
Corporate Bonds 30,496$ 17,287$ 314$ 4,945$ 53,042$ Assets Backed 3,089 - - - 3,089 CMO/REMIC 856 344 - 646 1,846 Commercial Mortgage Backed - - 78 5,699 5,777 Total Non-Governmental 34,441$ 17,631$ 392$ 11,290$ 63,753$
2010 Maturity (in years)

Dallas /Fort Worth International Airport Notes To The Basic Financial Statements
September 30, 2011
35
The OPEB Plan assets are carried at fair value as of December 31, 2010 and include the following investments (in thousands):
(k) Interest Rate Risk – DFW’s Fiduciary OPEB Plans
The long term investment strategy of the plan is to emphasize total return in the form of aggregate return from capital appreciation, dividend and interest income. The primary objective over a five year period for the plan assets is to maintain the purchasing power of the current assets and all future contributions by producing positive real rates of return on the plan assets, meet or exceed the actuarially assumed rate of return, and provide an acceptable level of volatility in both the long and short-term periods.
(l) Credit Risk – DFW’s Fiduciary OPEB Plans
Based on the plan’s long-term liquidity requirement, DFW has determined that currently all securities purchased for the plan have readily ascertainable market values and shall be easily marketable.
(m) Concentration of Credit Risk – DFW’s Fiduciary OPEB Plans The contributed amounts are invested in a money market fund and mutual funds through the Trustee in 2011.
(f) Custodial Risk – DFW’s Fiduciary OPEB Plans All investments are held in DFW’s name and are either fully federally insured or fully collateralized.
(3) RELATED-PARTY TRANSACTIONS
DFW makes certain payments routinely to the Cities. Payments to Fort Worth, primarily for legal services, bond fees, water purchases, and facilities rentals for the year ended September 30, 2011 were approximately $1.52 million. Payments to Dallas, primarily for legal services, water purchases, and bond fees for the year ended September 30, 2011 were approximately $1.32 million.
2010Description Total
Money market funds 11,579$ Total Investments 11,579$
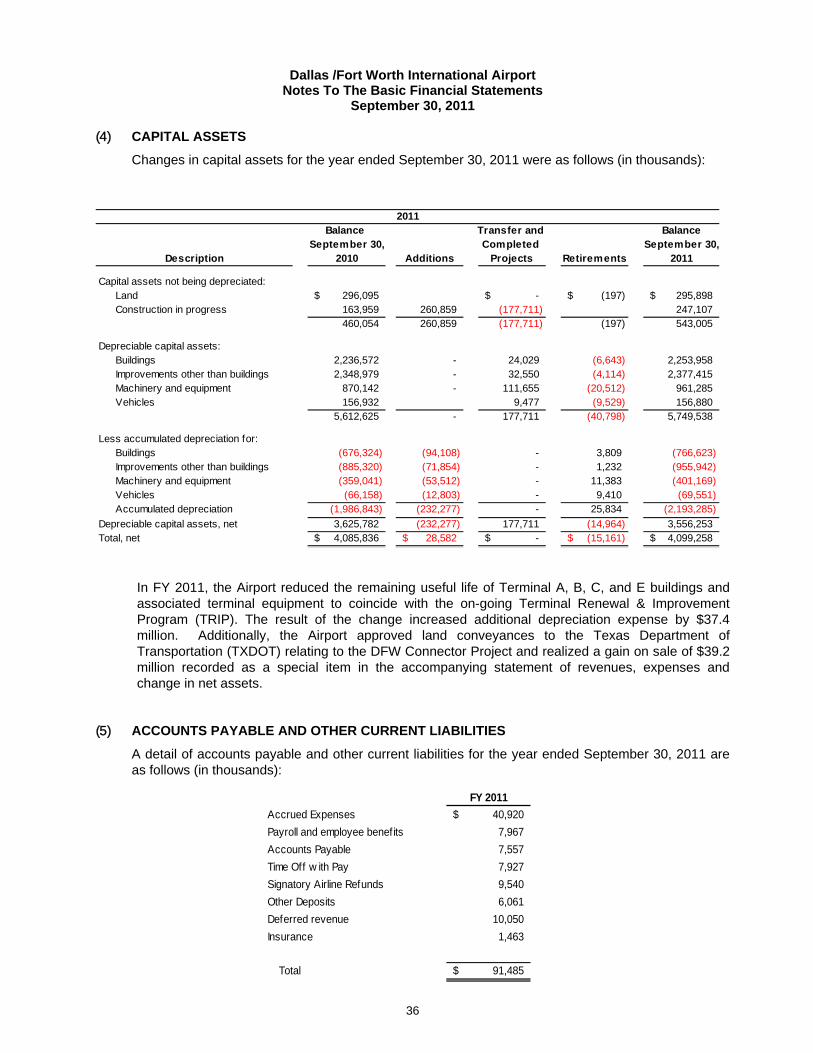
Dallas /Fort Worth International Airport Notes To The Basic Financial Statements
September 30, 2011
36
(4) CAPITAL ASSETS
Changes in capital assets for the year ended September 30, 2011 were as follows (in thousands):
In FY 2011, the Airport reduced the remaining useful life of Terminal A, B, C, and E buildings and associated terminal equipment to coincide with the on-going Terminal Renewal & Improvement Program (TRIP). The result of the change increased additional depreciation expense by $37.4 million. Additionally, the Airport approved land conveyances to the Texas Department of Transportation (TXDOT) relating to the DFW Connector Project and realized a gain on sale of $39.2 million recorded as a special item in the accompanying statement of revenues, expenses and change in net assets.
(5) ACCOUNTS PAYABLE AND OTHER CURRENT LIABILITIES
A detail of accounts payable and other current liabilities for the year ended September 30, 2011 are as follows (in thousands):
FY 2011
Accrued Expenses 40,920$
Payroll and employee benefits 7,967
Accounts Payable 7,557
Time Off w ith Pay 7,927
Signatory Airline Refunds 9,540
Other Deposits 6,061
Deferred revenue 10,050
Insurance 1,463
Total 91,485$
Balance Transfer and BalanceSeptember 30, Completed September 30,
Description 2010 Additions Projects Retirements 2011
Capital assets not being depreciated: Land 296,095$ -$ (197)$ 295,898$ Construction in progress 163,959 260,859 (177,711) 247,107
460,054 260,859 (177,711) (197) 543,005
Depreciable capital assets: Buildings 2,236,572 - 24,029 (6,643) 2,253,958 Improvements other than buildings 2,348,979 - 32,550 (4,114) 2,377,415 Machinery and equipment 870,142 - 111,655 (20,512) 961,285 Vehicles 156,932 9,477 (9,529) 156,880
5,612,625 - 177,711 (40,798) 5,749,538
Less accumulated depreciation for: Buildings (676,324) (94,108) - 3,809 (766,623) Improvements other than buildings (885,320) (71,854) - 1,232 (955,942) Machinery and equipment (359,041) (53,512) - 11,383 (401,169) Vehicles (66,158) (12,803) - 9,410 (69,551) Accumulated depreciation (1,986,843) (232,277) - 25,834 (2,193,285)
Depreciable capital assets, net 3,625,782 (232,277) 177,711 (14,964) 3,556,253 Total, net 4,085,836$ 28,582$ -$ (15,161)$ 4,099,258$
2011
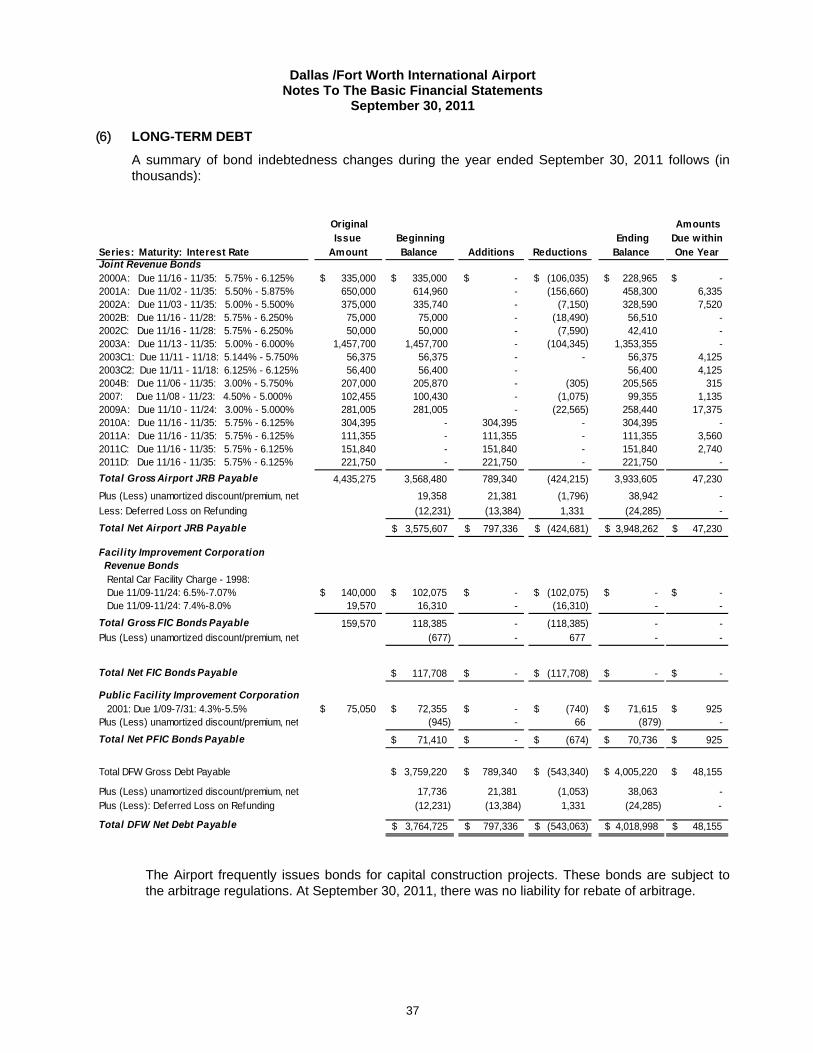
Dallas /Fort Worth International Airport Notes To The Basic Financial Statements
September 30, 2011
37
(6) LONG-TERM DEBT
A summary of bond indebtedness changes during the year ended September 30, 2011 follows (in thousands):
The Airport frequently issues bonds for capital construction projects. These bonds are subject to the arbitrage regulations. At September 30, 2011, there was no liability for rebate of arbitrage.
Series: Maturity: Interest Rate
Original Issue
Amount Beginning
Balance Additions Reductions Ending Balance
Amounts Due within One Year
Joint Revenue Bonds2000A: Due 11/16 - 11/35: 5.75% - 6.125% $ 335,000 $ 335,000 $ - $ (106,035) $ 228,965 $ - 2001A: Due 11/02 - 11/35: 5.50% - 5.875% 650,000 614,960 - (156,660) 458,300 6,335 2002A: Due 11/03 - 11/35: 5.00% - 5.500% 375,000 335,740 - (7,150) 328,590 7,520 2002B: Due 11/16 - 11/28: 5.75% - 6.250% 75,000 75,000 - (18,490) 56,510 - 2002C: Due 11/16 - 11/28: 5.75% - 6.250% 50,000 50,000 - (7,590) 42,410 - 2003A: Due 11/13 - 11/35: 5.00% - 6.000% 1,457,700 1,457,700 - (104,345) 1,353,355 - 2003C1: Due 11/11 - 11/18: 5.144% - 5.750% 56,375 56,375 - - 56,375 4,125 2003C2: Due 11/11 - 11/18: 6.125% - 6.125% 56,400 56,400 - 56,400 4,125 2004B: Due 11/06 - 11/35: 3.00% - 5.750% 207,000 205,870 - (305) 205,565 315 2007: Due 11/08 - 11/23: 4.50% - 5.000% 102,455 100,430 - (1,075) 99,355 1,135 2009A: Due 11/10 - 11/24: 3.00% - 5.000% 281,005 281,005 - (22,565) 258,440 17,375 2010A: Due 11/16 - 11/35: 5.75% - 6.125% 304,395 - 304,395 - 304,395 - 2011A: Due 11/16 - 11/35: 5.75% - 6.125% 111,355 - 111,355 - 111,355 3,560 2011C: Due 11/16 - 11/35: 5.75% - 6.125% 151,840 - 151,840 - 151,840 2,740 2011D: Due 11/16 - 11/35: 5.75% - 6.125% 221,750 - 221,750 - 221,750 -
Total Gross Airport JRB Payable 4,435,275 3,568,480 789,340 (424,215) 3,933,605 47,230
Plus (Less) unamortized discount/premium, net 19,358 21,381 (1,796) 38,942 -
Less: Deferred Loss on Refunding (12,231) (13,384) 1,331 (24,285) -
Total Net Airport JRB Payable 3,575,607$ 797,336$ (424,681)$ 3,948,262$ 47,230$
Facility Improvement Corporation Revenue Bonds Rental Car Facility Charge - 1998: Due 11/09-11/24: 6.5%-7.07% $ 140,000 $ 102,075 $ - $ (102,075) $ - $ - Due 11/09-11/24: 7.4%-8.0% 19,570 16,310 - (16,310) - -
Total Gross FIC Bonds Payable 159,570 118,385 - (118,385) - - Plus (Less) unamortized discount/premium, net (677) - 677 - -
Total Net FIC Bonds Payable $ 117,708 $ - $ (117,708) $ - $ -
Public Facility Improvement Corporation 2001: Due 1/09-7/31: 4.3%-5.5% $ 75,050 $ 72,355 $ - $ (740) $ 71,615 $ 925 Plus (Less) unamortized discount/premium, net (945) - 66 (879) -
Total Net PFIC Bonds Payable $ 71,410 $ - $ (674) $ 70,736 $ 925
Total DFW Gross Debt Payable $ 3,759,220 $ 789,340 $ (543,340) $ 4,005,220 $ 48,155
Plus (Less) unamortized discount/premium, net 17,736 21,381 (1,053) 38,063 - Plus (Less): Deferred Loss on Refunding (12,231) (13,384) 1,331 (24,285) -
Total DFW Net Debt Payable 3,764,725$ 797,336$ (543,063)$ 4,018,998$ 48,155$
Dallas /Fort Worth International Airport Notes To The Basic Financial Statements
September 30, 2011
38
(a) Joint Revenue Bonds
To provide funds for the construction of DFW in November 1968, the Cities adopted the 1968 Regional Airport Concurrent Bond Ordinance (Bond Ordinance). This ordinance authorized the issuance of the Series 1968 Dallas/Fort Worth Regional Airport Joint Revenue Bonds and reserved for the Cities the right to issue additional bonds on parity with the Series 1968 Bonds. Additional parity bonds have been issued for the purpose of improving, constructing, replacing, or otherwise extending DFW. The 1968 Ordinance was amended by the 30th Supplement, which was adopted by the Cities in February 2000. Bonds are issued under provisions of Applicable Law, including Chapter 22 of the Texas Transportation Code, Chapter 1371 of the Texas Government Code, as amended, and the provision of the Controlling Ordinances. Management believes DFW is in compliance with all bond covenants. Revenues derived from the ownership and operations of the Airport are pledged to meet debt service requirements of the bonds issued pursuant to the Controlling Ordinances. The Controlling Documents require DFW to annually adopt a Schedule of Charges that is: (1) reasonably estimated to produce Gross Revenues in an amount at least sufficient to pay Operation and Maintenance Expenses plus 1.25 times Accrued Aggregate Debt Service and (2) reasonably estimated to at least produce Current Gross Revenues in an amount at least sufficient to pay Operation and Maintenance Expenses plus 1.00 times Accrued Aggregate Debt Service. Annual transfers from the Capital Improvement Funds are considered part of Gross Revenues, but not Current Gross Revenues. At the end of each fiscal year, any excess funds are transferred to the Capital Improvement Fund. Funds transferred to the Capital Improvement Fund are allocated among three accounts, as provided in the 2010 Use Agreement. The Joint Capital Account generally requires approval from both DFW and the airlines prior to any expenditure of funds. The DFW Capital Account may be used at the discretion of the Airport. Rolling Coverage is funded by excess revenues from the Rolling Coverage sub-cost center, which unless used during the fiscal year is equal to the amount transferred at the beginning of the fiscal year, plus any incremental coverage collected during the fiscal year to ensure that rolling coverage is equal to 1.25 times Accrued Aggregate Debt Service. Effective July 1, 2011, PFC Application 11-10-C-00-DFW authorized the Imposition and Use of $4.2 billion for the purpose of paying debt service on 14 approved PFC projects. PFC collections are approved at the $4.50 level. PFC’s remitted to the Airport by the airlines are deposited into a separate fund, and to the extent funds are available, they are transferred monthly to the Operating Revenue and Expense Fund in an amount sufficient to pay eligible debt service on the 14 approved projects. These transferred funds are considered Gross Revenues of the Airport for the purpose of meeting its rate covenants, but maybe used only for the purpose of paying eligible debt service on approved PFC projects. In the past, $3.00 of the $4.50 has been pledged to the repayment of certain bonds; however, all outstanding DFW bonds are senior lien parity bonds. As such they are supported by a pledge of Gross Revenues, which includes PFC revenues, although those PFCs may be used only for eligible debt service on PFC approved projects. Failure to collect PFC revenues in an amount sufficient to pay eligible debt service on the PFC approved projects may lead to increases in other costs at the Airport which are repaid to the Airport in the form of higher landing fees and terminal rents.

Dallas /Fort Worth International Airport Notes To The Basic Financial Statements
September 30, 2011
39
In addition, PFC revenue is pledged to pay debt service to the extent that debt service is eligible and funds are available. Total principal and interest remaining to be paid on the bonds is $7.2 billion, with annual requirements ranging from $15.3 million to $311.9 million. Revenue bond principal is due annually on November 1, while interest is due semiannually on November 1 and May 1.
(b) Facility Improvement Corporation Revenue Bonds
1. Conduit Financings
The Facility Improvement Corporation (FIC) was established in 1990 for the purpose of providing tax exempt conduit financing for airlines and other qualified tenants of the Airport. Bonds are issued by the FIC on behalf of the beneficial party, and pursuant to a facility agreement are payable solely by the beneficial party. Neither DFW nor the FIC has any obligation for the repayment of these bonds.
2. RAC Operations
In 1998 and 1999, the FIC issued on behalf of the Rent-A-Car (RAC) companies approximately $160 million of bonds for construction of a consolidated rental car facility. These bonds were secured by a facility agreement between the FIC and the RAC companies, which provided that the RAC companies would collect and remit to a trustee a Customer Facility Charge (CFC) on each rent-a-car transaction day. In FY 2011, DFW issued 2011A Joint Revenue Bonds for the purpose of refunding all of the outstanding bonds issued by the FIC on behalf of the RAC companies. This refunding of the 1998 and 1999 bonds resulted in the termination of the trust indenture, a net present value economic gain of $24.1 million and one time refunding loss of $4.3 million. DFW achieved $36.2 million in actual savings. The RAC companies, under the terms of the 2008 Bus Funding Agreement, agreed to continue collecting the CFC after the FIC bonds were refunded and now remit the money collected directly to the FIC. In conjunction with the issuance of 2011A Bonds, the FIC entered into an agreement with DFW to transfer the monthly amount of accrued aggregate debt service plus any incremental coverage on the 2011A Bonds from the CFC revenues. The CFC is currently $4.00 per transaction day. Additionally the RAC companies collect a Customer Transportation Charge (CTC), which is remitted directly to the FIC to pay for the costs of operating and maintaining the bus fleet, which transports customers to and from the terminals and the RAC facility. The CTC is currently $2.20 per transaction day.
(c) Fiscal Year 2011 Debt Issuance
In November 2010, DFW issued $304.4 million of fixed rate joint revenue improvement bonds (Series 2010A) for the purpose of (1) financing improvements to the airport including the TRIP and Airport Improvement Program (2) providing capitalized interest and (3) paying the cost associated with the issuance of the bonds. In July 2011, DFW issued $151.8 million of fixed rate joint revenue refunding bonds (Series 2011C) for the purpose of refunding $154.6 million of outstanding Series 2000A, 2001A, 2002B, 2002C and a partial outstanding amount of Series 2003A bonds. The purpose of refunding bonds is to obtain a net present value economic gain of $21.5 million and to restructure certain maturities to reduce airline costs. The refunding resulted in a difference between the reacquisition price and the net carrying value of the old debt of $6.0 million related to issuance costs and unamortized loss from previous refunding. This deferred loss in reported
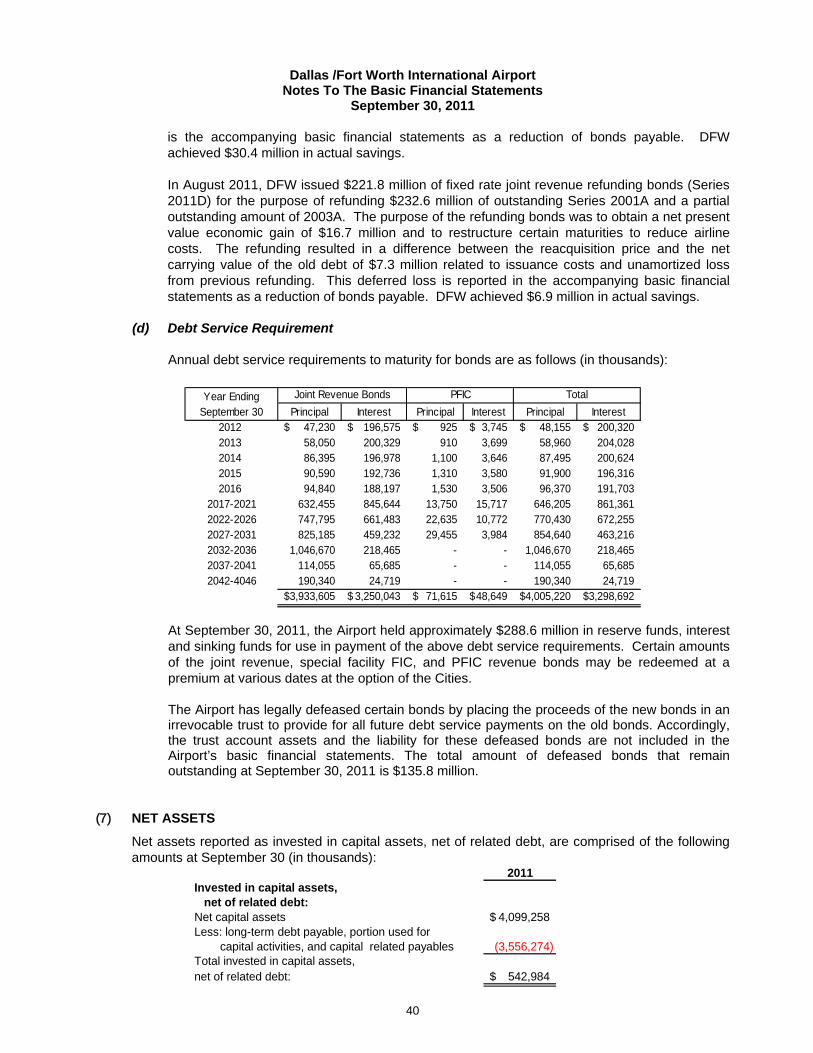
Dallas /Fort Worth International Airport Notes To The Basic Financial Statements
September 30, 2011
40
is the accompanying basic financial statements as a reduction of bonds payable. DFW achieved $30.4 million in actual savings. In August 2011, DFW issued $221.8 million of fixed rate joint revenue refunding bonds (Series 2011D) for the purpose of refunding $232.6 million of outstanding Series 2001A and a partial outstanding amount of 2003A. The purpose of the refunding bonds was to obtain a net present value economic gain of $16.7 million and to restructure certain maturities to reduce airline costs. The refunding resulted in a difference between the reacquisition price and the net carrying value of the old debt of $7.3 million related to issuance costs and unamortized loss from previous refunding. This deferred loss is reported in the accompanying basic financial statements as a reduction of bonds payable. DFW achieved $6.9 million in actual savings.
(d) Debt Service Requirement
Annual debt service requirements to maturity for bonds are as follows (in thousands):
At September 30, 2011, the Airport held approximately $288.6 million in reserve funds, interest and sinking funds for use in payment of the above debt service requirements. Certain amounts of the joint revenue, special facility FIC, and PFIC revenue bonds may be redeemed at a premium at various dates at the option of the Cities. The Airport has legally defeased certain bonds by placing the proceeds of the new bonds in an irrevocable trust to provide for all future debt service payments on the old bonds. Accordingly, the trust account assets and the liability for these defeased bonds are not included in the Airport’s basic financial statements. The total amount of defeased bonds that remain outstanding at September 30, 2011 is $135.8 million.
(7) NET ASSETS
Net assets reported as invested in capital assets, net of related debt, are comprised of the following amounts at September 30 (in thousands):
2011Invested in capital assets,
net of related debt:Net capital assets 4,099,258$ Less: long-term debt payable, portion used for
capital activities, and capital related payablesTotal invested in capital assets,net of related debt: 542,984$
(3,556,274)
Principal Interest Principal Interest Principal Interest47,230$ 196,575$ 925$ 3,745$ 48,155$ 200,320$ 58,050 200,329 910 3,699 58,960 204,028 86,395 196,978 1,100 3,646 87,495 200,624 90,590 192,736 1,310 3,580 91,900 196,316 94,840 188,197 1,530 3,506 96,370 191,703
632,455 845,644 13,750 15,717 646,205 861,361 747,795 661,483 22,635 10,772 770,430 672,255 825,185 459,232 29,455 3,984 854,640 463,216
1,046,670 218,465 - - 1,046,670 218,465 114,055 65,685 - - 114,055 65,685 190,340 24,719 - - 190,340 24,719
3,933,605$ 3,250,043$ 71,615$ 48,649$ 4,005,220$ 3,298,692$
Year Ending September 30
Joint Revenue Bonds PFIC Total
2027-20312022-2026
20122013201420152016
2017-2021
2032-20362037-20412042-4046
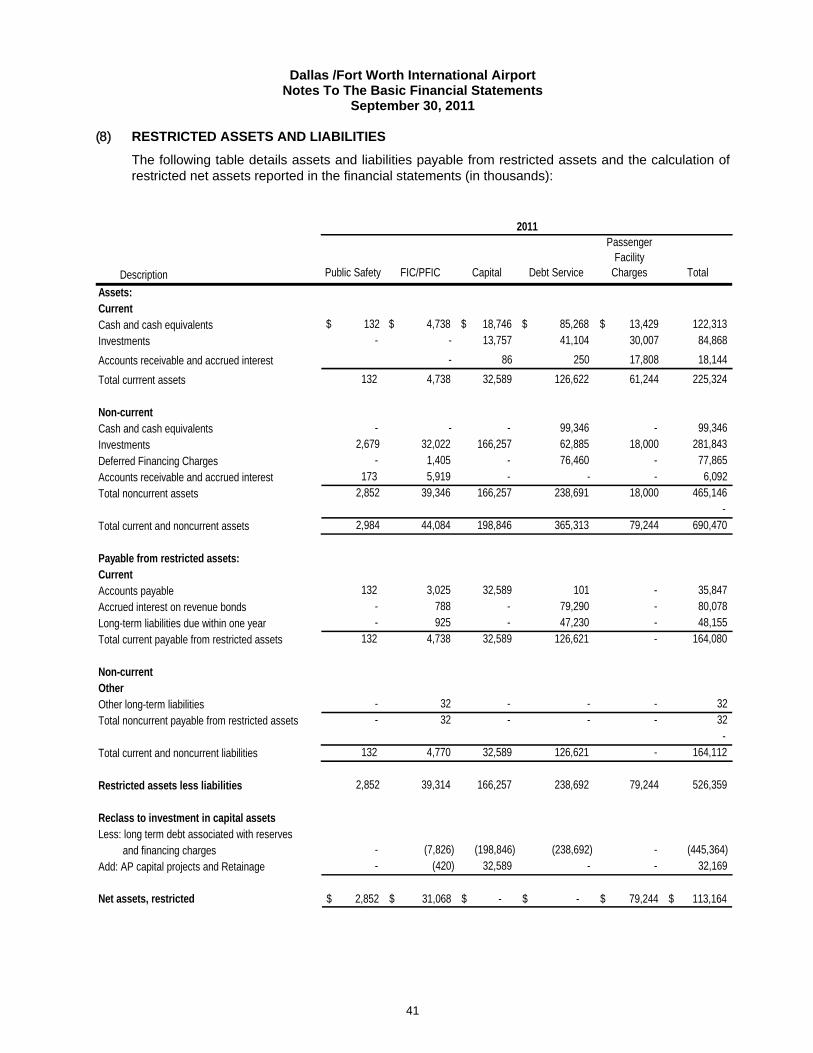
Dallas /Fort Worth International Airport Notes To The Basic Financial Statements
September 30, 2011
41
(8) RESTRICTED ASSETS AND LIABILITIES
The following table details assets and liabilities payable from restricted assets and the calculation of restricted net assets reported in the financial statements (in thousands):
Description Public Safety FIC/PFIC Capital Debt Service
Passenger Facility
Charges Total
Assets:Current Cash and cash equivalents $ 132 $ 4,738 $ 18,746 $ 85,268 $ 13,429 122,313
Investments - - 13,757 41,104 30,007 84,868
Accounts receivable and accrued interest - 86 250 17,808 18,144
Total currrent assets 132 4,738 32,589 126,622 61,244 225,324
Non-current Cash and cash equivalents - - - 99,346 - 99,346
Investments 2,679 32,022 166,257 62,885 18,000 281,843
Deferred Financing Charges - 1,405 - 76,460 - 77,865
Accounts receivable and accrued interest 173 5,919 - - - 6,092
Total noncurrent assets 2,852 39,346 166,257 238,691 18,000 465,146 -
Total current and noncurrent assets 2,984 44,084 198,846 365,313 79,244 690,470
Payable from restricted assets:Current Accounts payable 132 3,025 32,589 101 - 35,847
Accrued interest on revenue bonds - 788 - 79,290 - 80,078
Long-term liabilities due within one year - 925 - 47,230 - 48,155
Total current payable from restricted assets 132 4,738 32,589 126,621 - 164,080
Non-current OtherOther long-term liabilities - 32 - - - 32
Total noncurrent payable from restricted assets - 32 - - - 32 -
Total current and noncurrent liabilities 132 4,770 32,589 126,621 - 164,112
Restricted assets less liabilities 2,852 39,314 166,257 238,692 79,244 526,359
Reclass to investment in capital assets Less: long term debt associated with reserves and financing charges - (7,826) (198,846) (238,692) - (445,364)
Add: AP capital projects and Retainage - (420) 32,589 - - 32,169
Net assets, restricted 2,852$ 31,068$ -$ -$ 79,244$ 113,164$
2011
Dallas /Fort Worth International Airport Notes To The Basic Financial Statements
September 30, 2011
42
(9) RETIREMENT PLANS
(a) Plan Descriptions
DFW has two fiduciary defined-benefit pension plans covering substantially all DFW employees: the employees of Dallas/Fort Worth International Airport Retirement Plans and the Department of Public Safety (DPS) Retirement Plans (Retirement Plans, collectively) that were established by Board resolution. Both plans are single-employer public employee retirement system plans in which the assets are held in an investment trust. Employees vest after five years of service and are eligible for early retirement at ages 55-61 and full retirement benefits at age 62 and after. Pension benefits increase by a cost of living adjustment each January 1. The fiscal year-end for the Retirement Plans is December 31. Copies of the Retirement Plans’ annual report may be obtained by writing to the Finance Department, DFW Airport, Post Office Drawer 619428, DFW Airport, Texas 75261-9428. Employee Plan - All regular employees, other than DPS officers are covered by the Employee Plan. Benefits vest after five years of service. DFW employees who retire are entitled to an annual retirement benefit, payable monthly for life in an amount equal to a percentage of final average monthly compensation times credited service plus an annual cost of living adjustment (as defined by the Employee Plan). Employees can also elect a limited lump-sum distribution. The Employee Plan also provides early retirement, death, and disability benefits. As of January 1, 2010 the Employee Plan was closed to new employees. DPS Plan - The DPS Plan was established effective October 1, 1999 when the assets and liabilities accrued by public safety officers eligible for the DPS Plan prior to October 1, 1999 were transferred from the Employee Plan to the DPS Plan in compliance with the requirements of IRS Code Section 414(1). The public safety officers who retired or terminated employment prior to October 1, 1999, were not eligible for the DPS Plan and will continue to receive their benefits, if any, from the Employee Plan. The DPS Plan permits early retirement at ages 55 to 61, or upon satisfaction of the “Rule of 80.” The “Rule of 80” is the attainment of age 50 and the completion of the number of years of benefit service that when added to the participant’s age equals the sum of 80. DPS officers receive pension benefits in the form of a qualified joint and survivor annuity; however, an employee may request optional forms of pension benefit payments upon written request to the Plan Administrator. Other forms of payment of accumulated plan benefits include lump-sum distribution upon retirement or termination or equal monthly payments for life.
(b) Funding Policies
DFW determines each Retirement Plans’ funding policy. In general, DFW contributes an amount approximately equal to the actuarially determined pension cost for the year. In some years, however, DFW funds additional contributions to help retire the unfunded liability sooner. The significant actuarial assumptions used to compute the actuarially determined contribution requirement are the same as those used to compute the actuarial accrued liability. Both pension plans provide that employees with five or more years of service are entitled to annual pension benefits, beginning at normal retirement age of 62, equal to a certain percentage of their final average monthly compensation for each year of credited service, less a certain percentage of anticipated primary insurance benefits. The final average monthly compensation is determined by utilizing the highest 60 consecutive months of earnings out of the 120 months immediately preceding the date of service termination.
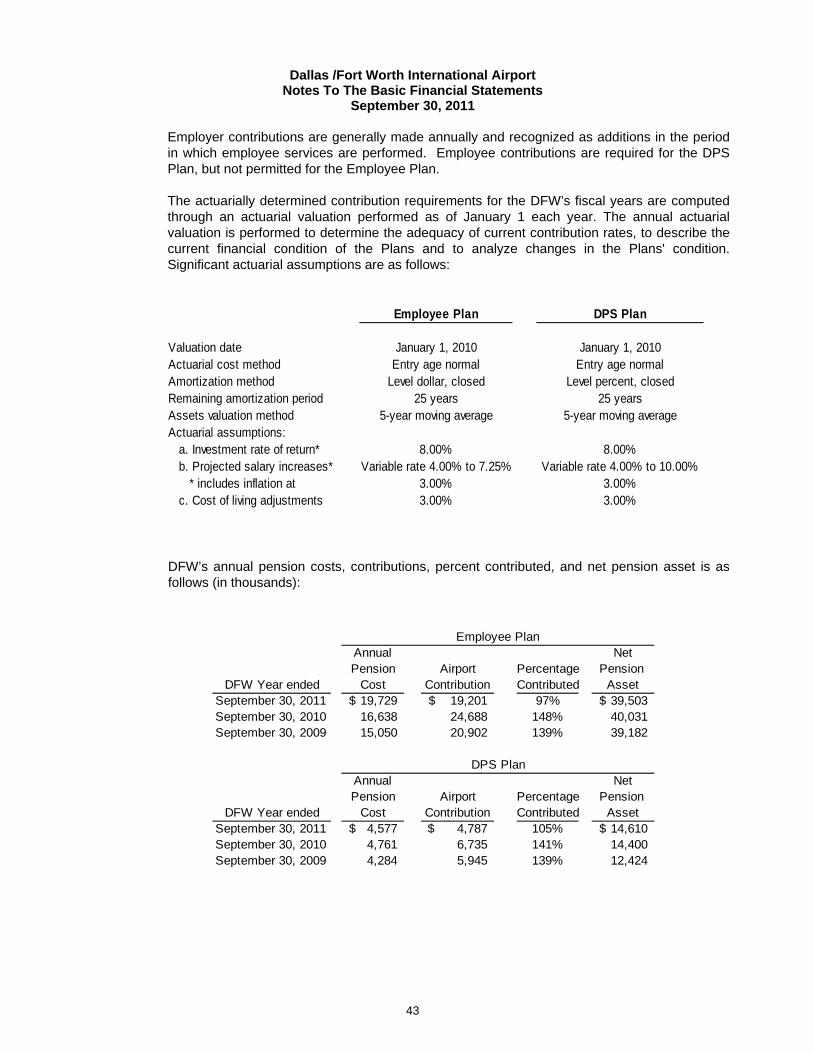
Dallas /Fort Worth International Airport Notes To The Basic Financial Statements
September 30, 2011
43
Employer contributions are generally made annually and recognized as additions in the period in which employee services are performed. Employee contributions are required for the DPS Plan, but not permitted for the Employee Plan. The actuarially determined contribution requirements for the DFW’s fiscal years are computed through an actuarial valuation performed as of January 1 each year. The annual actuarial valuation is performed to determine the adequacy of current contribution rates, to describe the current financial condition of the Plans and to analyze changes in the Plans' condition. Significant actuarial assumptions are as follows:
DFW’s annual pension costs, contributions, percent contributed, and net pension asset is as follows (in thousands):
Employee PlanAnnual NetPension Airport Percentage Pension
DFW Year ended Cost Contribution Contributed AssetSeptember 30, 2011 19,729$ 19,201$ 97% 39,503$ September 30, 2010 16,638 24,688 148% 40,031 September 30, 2009 15,050 20,902 139% 39,182
Annual NetPension Airport Percentage Pension
DFW Year ended Cost Contribution Contributed AssetSeptember 30, 2011 4,577$ 4,787$ 105% 14,610$ September 30, 2010 4,761 6,735 141% 14,400 September 30, 2009 4,284 5,945 139% 12,424
DPS Plan
Employee Plan DPS Plan
Valuation date January 1, 2010 January 1, 2010Actuarial cost method Entry age normal Entry age normalAmortization method Level dollar, closed Level percent, closedRemaining amortization period 25 years 25 yearsAssets valuation method 5-year moving average 5-year moving averageActuarial assumptions:
a. Investment rate of return* 8.00% 8.00%b. Projected salary increases* Variable rate 4.00% to 7.25% Variable rate 4.00% to 10.00% * includes inflation at 3.00% 3.00%c. Cost of living adjustments 3.00% 3.00%
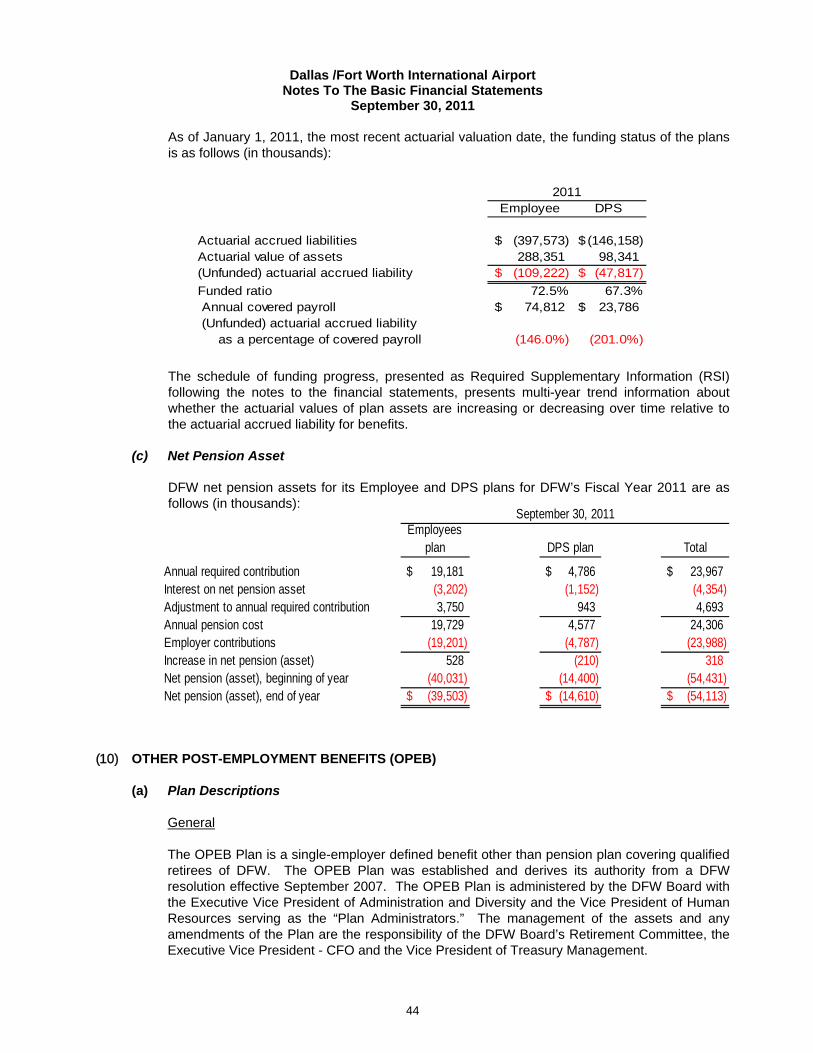
Dallas /Fort Worth International Airport Notes To The Basic Financial Statements
September 30, 2011
44
As of January 1, 2011, the most recent actuarial valuation date, the funding status of the plans is as follows (in thousands): The schedule of funding progress, presented as Required Supplementary Information (RSI) following the notes to the financial statements, presents multi-year trend information about whether the actuarial values of plan assets are increasing or decreasing over time relative to the actuarial accrued liability for benefits.
(c) Net Pension Asset
DFW net pension assets for its Employee and DPS plans for DFW’s Fiscal Year 2011 are as follows (in thousands):
(10) OTHER POST-EMPLOYMENT BENEFITS (OPEB)
(a) Plan Descriptions
General The OPEB Plan is a single-employer defined benefit other than pension plan covering qualified retirees of DFW. The OPEB Plan was established and derives its authority from a DFW resolution effective September 2007. The OPEB Plan is administered by the DFW Board with the Executive Vice President of Administration and Diversity and the Vice President of Human Resources serving as the “Plan Administrators.” The management of the assets and any amendments of the Plan are the responsibility of the DFW Board’s Retirement Committee, the Executive Vice President - CFO and the Vice President of Treasury Management.
Employee DPS
Actuarial accrued liabilities (397,573)$ (146,158)$ Actuarial value of assets 288,351 98,341 (Unfunded) actuarial accrued liability (109,222)$ (47,817)$
Funded ratio 72.5% 67.3%Annual covered payroll 74,812$ 23,786$ (Unfunded) actuarial accrued liability as a percentage of covered payroll (146.0%) (201.0%)
2011
Employees plan DPS plan Total
Annual required contribution 19,181$ 4,786$ 23,967$ Interest on net pension asset (3,202) (1,152) (4,354)Adjustment to annual required contribution 3,750 943 4,693Annual pension cost 19,729 4,577 24,306Employer contributions (19,201) (4,787) (23,988)Increase in net pension (asset) 528 (210) 318Net pension (asset), beginning of year (40,031) (14,400) (54,431)Net pension (asset), end of year (39,503)$ (14,610)$ (54,113)$
September 30, 2011
Dallas /Fort Worth International Airport Notes To The Basic Financial Statements
September 30, 2011
45
Beginning in FY 2008, DFW implemented GASB Statement No. 45 “Accounting and Financial Reporting by Employers for Post-Employment Benefits Other than Pensions.” In connection with such implementation, DFW commissioned an actuarial study from an outside consultant to quantify the amount of the Airport’s OPEB obligations. This study indicates an unfunded actuarial accrued liability of approximately $24.3 million as of January 1, 2011. DFW has deposited its OPEB obligations and has made a contribution of $3.2 million in FY 2011. The fiscal year-end for the OPEB Plan is December 31. Copies of the OPEB annual report may be obtained by writing to the Finance Department, DFW Airport, Post Office Drawer 619428, DFW Airport, Texas 75261-9428. OPEB Plan Eligibility The OPEB Plan provides retiree health care for qualified retired employees ages 65 or younger and their eligible dependents when required criteria are met. To be eligible as a retiree, an employee must be enrolled in one of DFW’s medical plans, be eligible for retirement under one of DFW’s pension plans, and begin drawing pension benefits immediately upon retirement. Failure to immediately, draw pension benefits will result in loss of eligibility for medical coverage.
To be eligible as a retiree’s dependent, dependent(s) must be either a legal spouse; unmarried children and under age 25 who are dependent on the retiree for at least 50% of their support and claimed on the retiree’s income tax return; unmarried grandchildren under age 25 who are dependent on the retiree for at least 50% of their support, reside in the retiree’s household, and claimed on the retiree’s income tax return; or unmarried children at any age if mentally or physically incapable of self-support. Normal retirement benefits for general employees and DPS employees begin when they complete five years of service and age 62. Health Care Benefit
The health care coverage offered to active employees is available to retirees under age 65 and their eligible dependents. The benefit includes medical, prescription drug, and vision coverage. Medical plans offered include Aetna Select and Aetna Choice POS II.
Retiree Medical Subsidy As of January 1, 2003, DFW provides a subsidy to eligible employees who retire to purchase medical coverage prior to Medicare eligibility. The subsidy is for pre-65 OPEB medical benefits only, and offers a credit of $20 per month of completed year of service up to a maximum benefit of $400 per month. These credits have no cash value and can only be used toward purchasing medical coverage from DFW. Retirees pay the total amount charged to DFW, less the retiree’s subsidy, if applicable. To be eligible for the subsidy, retirees must have retired after January 1, 2003, have 10 or more years of service, have been enrolled continuously in a DFW medical plan, and immediately draw retirement benefits. Medicare Supplement Plan DFW offers a PPO Medicare Supplement Plan for retirees and/or their spouses age 65 or older. The retiree and/or spouse must transfer to the Medicare Supplement Plan by the first of the month following their 65th birthday if they choose to remain on the DFW Plan. Effective January 1, 2010 Medicare eligible retirees are no longer eligible for prescription drug coverage under the DFW Retiree Medical Plan.

Dallas /Fort Worth International Airport Notes To The Basic Financial Statements
September 30, 2011
46
To be eligible for the Medicare Supplement Plan, a retiree or spouse must be 65 years of age and currently enrolled in a DFW medical plan, have applied for the Medicare Supplement Plan 2 months prior to turning age 65, and transition to a Medicare Supplement Plan the 1st of the month following their 65th birthday.
(b) Funding Policies
DFW determines the OPEB funding policy. In general, DFW contributes an amount approximately equal to the actuarially determined OPEB ARC for the year. In some years, however, DFW funds additional contributions to help retire the unfunded liability sooner. The significant actuarial assumptions used to compute the actuarially determined contribution requirement are the same as those used to compute the actuarial accrued liability. Employer contributions are generally made quarterly and recognized as additions in the period in which employee services are performed. Employee contributions are not permitted. The actuarially determined contribution requirements for the DFW’s fiscal years are computed through an actuarial valuation performed as of January 1 each year. The annual actuarial valuation is performed to determine the adequacy of current contribution rates, to describe the current financial condition of OPEB, and to analyze changes in condition. The (unfunded) actuarial accrued liability rate is (24.7%) of annual covered payroll for the 12 months ended December 31, 2010. Actuarial valuations involve estimates of the value of reported amounts and assumptions about the probability of events in the future. Amounts determined regarding the funded status of the plan and the annual required contributions of the employer are subject to continual revision as actual results are compared to past expectations and new estimates are made about the future. The required schedule of funding progress presented as required supplementary information provides multiyear trend information that shows whether the actuarial value of plan assets is increasing or decreasing over time relative to the actuarial accrued liability for benefits. Projections of benefits are based on the plan and include the types of benefits in force at the valuation date and the pattern of sharing benefit costs between DFW and the plan members to that point. Actuarial calculations reflect a long-term perspective and employ methods and assumptions that are designed to reduce short-term volatility in actuarial accrued liabilities and the actuarial value of assets. Significant methods and assumptions are as follows:
Significant actuarial assumptions
Valuation Date January 1, 2010Actuarially assumed investment return 8.00% per annum compunded annuallyMortality rates for males and females Retirement Plans 2000 Healthy Mortality Table
Retirement, disablement and seperation rates Graduated rates based on age and gender
Actuarial cost method Individual entry-Age Actuarial Cost MethodGeneral inflation 3.0% per annumPayroll growth rate 4.00% per annumHealth care cost trends 9.5% in 2011, decreasing 0.5% per year to an ultimate 4.5% in 2021 and afterMethod used for determining actuarial value of assets Market value of assetsAmortization method Level percent, closedRemaining amortization 26 years

Dallas /Fort Worth International Airport Notes To The Basic Financial Statements
September 30, 2011
47
DFW’s annual OPEB costs, contributions, percent contributed, and net OPEB asset is as follows (in thousands): The funding status of the OPEB plan as of January 1, 2011, representing the most recent valuation date, is as follows (in thousands):
(c) Net OPEB Assets
DFW’s net OPEB assets for DFW’s fiscal year 2011 are as follows (in thousands):
OPEB Plan
Annual NetOPEB Airport Percentage OPEB
DFW's Year ended Cost Contribution Contributed Asset
September 30, 2011 3,222$ 3,192$ 99% 2,598$
September 30, 2010 2,766 2,742 99% 2,628 September 30, 2009 2,700 2,676 99% 2,652
2011
Annual required contribution 3,192$
Interest on net OPEB asset (210)
Adjustment to annual required contribution 240Annual OPEB cost 3,222Employer contributions (3,192)Increase in net OPEB (asset) 30Net OPEB (asset), beginning of year (2,628)Net OPEB (asset), end of year (2,598)$
2011
Actuarial accrued liabilities (35,447)$ Actuarial value of assets 11,112 (Unfunded) actuarial accrued liability (24,335)$
Funded ratio 31.3%Annual covered payroll 98,597$ (Unfunded) actuarial accrued liability as a percentage of covered payroll (24.7%)

Dallas /Fort Worth International Airport Notes To The Basic Financial Statements
September 30, 2011
48
(11) PFIC BACKGROUND AND FINANCIAL INFORMATION
The PFIC is a duly incorporated public instrumentality in the State of Texas, created on December 14, 2000 by the Airport’s owner cities. The PFIC was created pursuant to Chapter 22 of the Texas Transportation Code for the purpose of financing, equipping and operating one or more public facilities within the boundaries of the Airport. To date, only one such facility has been approved and completed, the DFW Grand Hyatt (Hotel) which opened July 1, 2005. The hotel was constructed, equipped, and furnished with proceeds from the 2001 Airport Hotel Revenue Bonds. The Hotel was constructed by the Airport based on a Development Agreement entered into between the Airport and the PFIC. Upon completion of the Hotel, the Airport leased the Hotel to the PFIC pursuant to the Hotel Lease Agreement. The PFIC accounts for the transaction as a capital lease. The Hotel has 298 rooms and is situated in DFW’s International Terminal D. The Hotel is managed by the Hyatt International Corporation. In FY 2011, a $13.0 million renovation of the hotel was 95% completed. The following summarizes the PFIC financial information (in thousands) for the fiscal year ended September 30, 2011.
Cash flows from operating activities 7,327$
Cash flows from capital financing activities (14,394)
Cash flows from investing activities 428
Net increase in cash and cash equivalents (6,639)
Cash and cash equivalents at beginning of the year 34,636
Cash and cash equivalents at end of the year 27,997$
2011Operating revenues 25,504$ Operating expenses (20,868) Non-operating expenses (4,451) Change in net assets 185
Net assets at the beginning of the year 27,389 Net assets at the end of the year 27,574$
Capital assets, net 65,042$ Other assets 37,811 Total assets 102,853
Long term liabilities (69,843) Other liabilities (5,436) Total liabilities (75,279)
Net Assets 27,574$
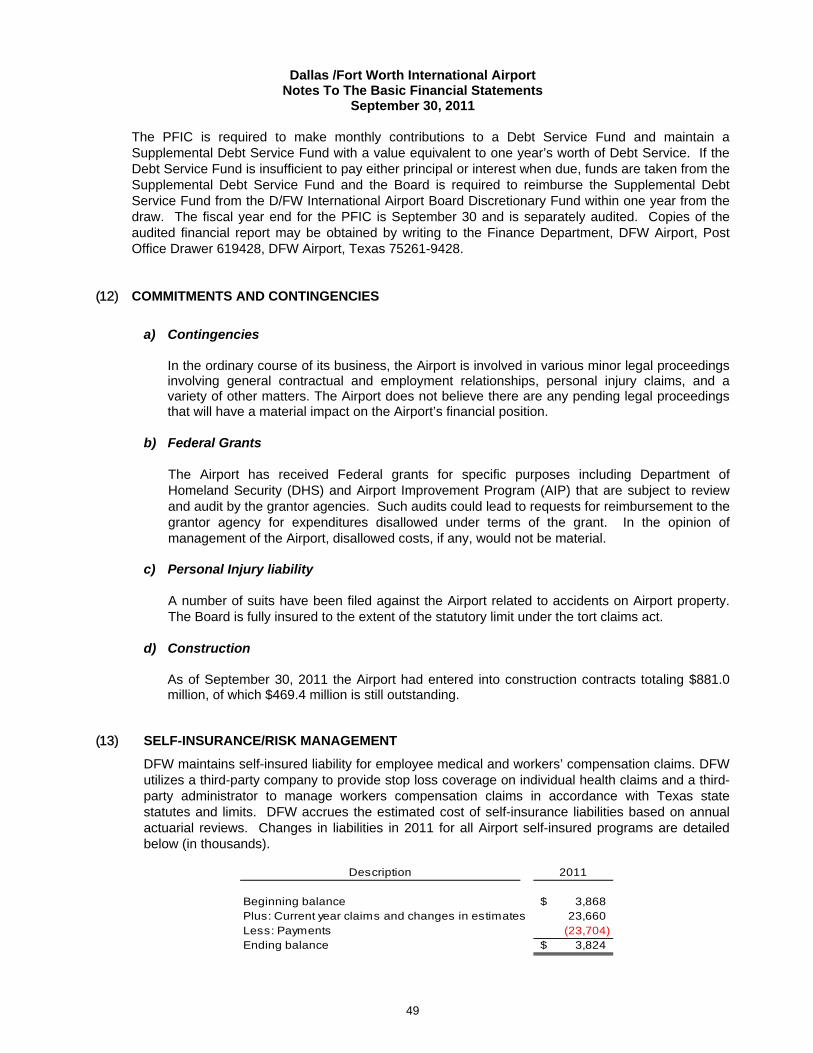
Dallas /Fort Worth International Airport Notes To The Basic Financial Statements
September 30, 2011
49
The PFIC is required to make monthly contributions to a Debt Service Fund and maintain a Supplemental Debt Service Fund with a value equivalent to one year’s worth of Debt Service. If the Debt Service Fund is insufficient to pay either principal or interest when due, funds are taken from the Supplemental Debt Service Fund and the Board is required to reimburse the Supplemental Debt Service Fund from the D/FW International Airport Board Discretionary Fund within one year from the draw. The fiscal year end for the PFIC is September 30 and is separately audited. Copies of the audited financial report may be obtained by writing to the Finance Department, DFW Airport, Post Office Drawer 619428, DFW Airport, Texas 75261-9428.
(12) COMMITMENTS AND CONTINGENCIES
a) Contingencies
In the ordinary course of its business, the Airport is involved in various minor legal proceedings involving general contractual and employment relationships, personal injury claims, and a variety of other matters. The Airport does not believe there are any pending legal proceedings that will have a material impact on the Airport’s financial position.
b) Federal Grants
The Airport has received Federal grants for specific purposes including Department of Homeland Security (DHS) and Airport Improvement Program (AIP) that are subject to review and audit by the grantor agencies. Such audits could lead to requests for reimbursement to the grantor agency for expenditures disallowed under terms of the grant. In the opinion of management of the Airport, disallowed costs, if any, would not be material.
c) Personal Injury liability
A number of suits have been filed against the Airport related to accidents on Airport property. The Board is fully insured to the extent of the statutory limit under the tort claims act.
d) Construction
As of September 30, 2011 the Airport had entered into construction contracts totaling $881.0 million, of which $469.4 million is still outstanding.
(13) SELF-INSURANCE/RISK MANAGEMENT
DFW maintains self-insured liability for employee medical and workers’ compensation claims. DFW utilizes a third-party company to provide stop loss coverage on individual health claims and a third-party administrator to manage workers compensation claims in accordance with Texas state statutes and limits. DFW accrues the estimated cost of self-insurance liabilities based on annual actuarial reviews. Changes in liabilities in 2011 for all Airport self-insured programs are detailed below (in thousands).
Description 2011
Beginning balance 3,868$ Plus: Current year claims and changes in estimates 23,660 Less: Payments (23,704)Ending balance 3,824$
Dallas /Fort Worth International Airport Notes To The Basic Financial Statements
September 30, 2011
50
DFW is exposed to various risks of loss related to theft, damage to and destruction of assets, and natural disasters for which DFW carries commercial insurance. Specific details regarding deductibles and coverage can be found in the statistical section. Any settlement payments covered by commercial insurance did not exceed coverage for the last three years.
(14) CONCENTRATION OF CREDIT RISK
DFW’s customers are principally concentrated within the airline industry. DFW periodically evaluates the financial condition of its customers and typically does not require collateral. DFW received approximately $173.0 million (33.1%) of its revenues during fiscal year 2011 from American Airlines (including American Eagle). American Airlines (including American Eagle and Executive Airlines) had 85.0% of passengers in FY 2011 and 78% of landed weights in FY 2011.
(15) POLLUTION REMEDIATION
In FY 2009, DFW Airport implemented GASB Statement No. 49, Accounting and Financial Reporting for Pollution Remediation Obligations. The Airport has one area of subsurface land (Central Terminal Area) that is under an agreed-upon order by the Texas Commission for Environmental Quality for the remediation of a jet fuel leak in the underground pipeline in which two terminal areas are affected, Terminals B and C. As of September 30, 2011, the Airport accrued a liability, measured at the current value amount, using the expected cash flows technique, of $1.65 million for the operating and maintenance (O&M) costs related to this underground pipeline. Terminal C area has approximately four to five years of O&M costs to achieve site remedial goals while Terminal B area has approximately 15 to 20 years to achieve site remedial goals. Once Terminal C is complete, a site re-evaluation will be necessary to determine the O&M cost associated with the remaining years of remediation in Terminal B. The Airport’s Northwest Cargo Area VCP (Voluntary Clean-up Program), an area of approximately 150 acres, has completed the voluntary investigation activities that include site assessment, site investigation and corrective measures feasibility study and design of a remedial action plan for a chlorinated solvent plume and includes small areas of additional jet fuel contamination. It has been determined that the contaminated area covers 22 acres of land located in the Northwest Cargo Area generated from previous tenants. As of September 30, 2011, the Airport accrued a liability, measured at the current value amount, using the expected cash flows technique, of an estimated $10 million for the capital outlay covering the next four to five years for the mobile extraction system, mobile remediation system, and underground infrastructure including plumbing, monitor wells, recovery wells, soil mixing and slurry walls. DFW continues to monitor and sample additional areas of concern. The annual O&M cost for these activities is $330. The pollution remediation obligation is an estimate and subject to change resulting from price increases and equipment requirements. During FY 2011, there have been no changes to the pollution remediation liability requirements.
(16) SUBSEQUENT EVENTS
(a) AMR Bankruptcy Filing
On November 29, 2011, AMR Corporation, the parent company of American Airlines, Inc. (“AA”), AA, American Eagle, Inc., and other affiliates of AMR, filed voluntary petitions for
Dallas /Fort Worth International Airport Notes To The Basic Financial Statements
September 30, 2011
51
Chapter 11 reorganization in the U.S. Bankruptcy Court for the Southern District of New York. The AMR website states that AMR took this action “in order to achieve a cost and debt structure that is industry competitive and thereby assures their long-term viability and ability to continue delivering a world-class travel experience for customers.”
AMR is DFW’s largest tenant representing approximately 85% and 78% of DFW’s passenger traffic and landed weights, respectively. AMR leases 100% of the terminal space in Terminal A, B, and C and approximately 60% of the space in Terminal D. DFW is AMR’s largest hub representing approximately 40% of AMR’s total traffic. AMR paid DFW approximately $173 million, 30% of the 102 Fund operating and debt service costs incurred in FY 2011. The prepetition accounts receivable balance due from AMR was approximately $11.9 million as of the date of filing. In addition to the Use Agreement, AMR has 13 other lease agreements with DFW for hangars, operating and maintenance facilities, and a fueling facility as part of a fueling consortium representing approximately $12.1 million of lease income per year to DFW. AMR is current on predominantly all post petition liabilities as of December 31, 2011. DFW shall continue to monitor AMR’s bankruptcy proceedings for developments which could have a significant impact on operations at DFW. In such event, management believes that DFW would have adequate unrestricted cash and investments to allow it to continue operations until such time as it can (i) determine the degree to which airport operations may be affected and take appropriate steps to reduce costs, and (ii) make rate adjustments to those carriers continuing to operate at the Airport to offset any reduction in revenues.
DFW has initiated design and construction of a seven-year $1.92 billion Terminal Renewal and Improvement Program (TRIP) to renovate Terminals A, B, C, and E. AMR and the other signatory airlines approved the TRIP and associated debt financing as part of the Use Agreement that became effective October 1, 2010. AMR informed DFW subsequent to the bankruptcy filing that it desires to continue with the TRIP as scheduled. AMR also approved nine new capital projects totaling $231.4 million subsequent to the filing, including a Terminal B gate expansion (operated by American Eagle) and a new replacement Terminal A parking garage.
DFW has sufficient cash in the joint capital account, the DFW capital account, and available bond proceeds to fund projected capital expenditures through the end of FY 2012, if necessary. DFW intends to fund the TRIP and other major capital projects through the issuance of additional Joint Revenue Bonds in FY 2012 and the future. Although it is not planning to do so, DFW could delay or stop some or all of its capital projects, if necessary, since the TRIP and DFW’s capital programs are phased over time.
DFW’s bond ratings of A+ (Standard & Poor’s), A1 (Moody’s), and A+ (Fitch) have not changed since the bankruptcy filing. However, Moody’s and Fitch did revise their outlooks for DFW bonds from stable to negative. Standard & Poor’s has not made a revision to their outlook at this time. DFW has received no indication that the negative outlooks will have any impact on its ability to issue future bonds or any material impact on interest rates.
(b) Fiscal Year 2012 Debt Issuance
In October 2011, the Airport issued $106.2 million of fixed rate joint revenue refunding bonds (Taxable Series 2011E). The bonds were issued for the purpose of refunding old Joint Revenue Bonds Series 2003C-1 and Series 2003C-2.

“This Page Intentionally left Blank”
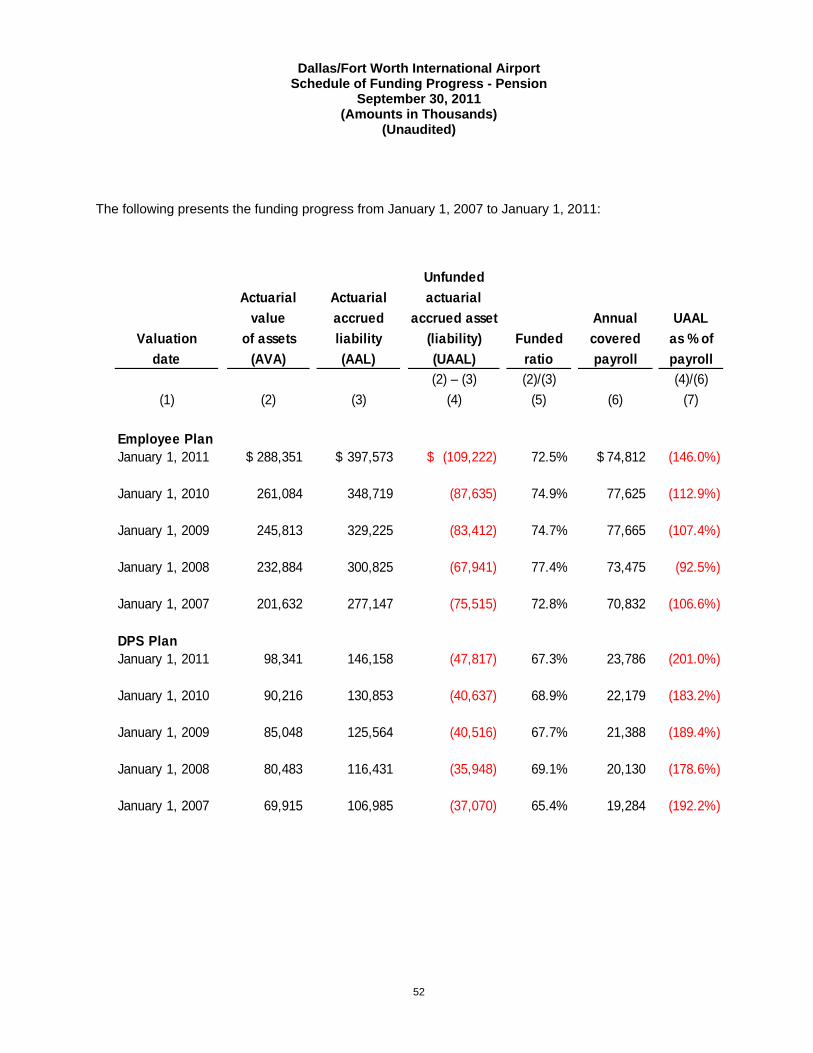
Dallas/Fort Worth International Airport Schedule of Funding Progress - Pension
September 30, 2011 (Amounts in Thousands)
(Unaudited)
52
The following presents the funding progress from January 1, 2007 to January 1, 2011:
Unfunded
Actuarial Actuarial actuarial
value accrued accrued asset Annual UAAL
Valuation of assets liability (liability) Funded covered as % of
date (AVA) (AAL) (UAAL) ratio payroll payroll
(2) – (3) (2)/(3) (4)/(6)
(1) (2) (3) (4) (5) (6) (7)
Employee PlanJanuary 1, 2011 288,351$ 397,573$ (109,222)$ 72.5% 74,812$ (146.0%)
January 1, 2010 261,084 348,719 (87,635) 74.9% 77,625 (112.9%)
January 1, 2009 245,813 329,225 (83,412) 74.7% 77,665 (107.4%)
January 1, 2008 232,884 300,825 (67,941) 77.4% 73,475 (92.5%)
January 1, 2007 201,632 277,147 (75,515) 72.8% 70,832 (106.6%)
DPS PlanJanuary 1, 2011 98,341 146,158 (47,817) 67.3% 23,786 (201.0%)
January 1, 2010 90,216 130,853 (40,637) 68.9% 22,179 (183.2%)
January 1, 2009 85,048 125,564 (40,516) 67.7% 21,388 (189.4%)
January 1, 2008 80,483 116,431 (35,948) 69.1% 20,130 (178.6%)
January 1, 2007 69,915 106,985 (37,070) 65.4% 19,284 (192.2%)
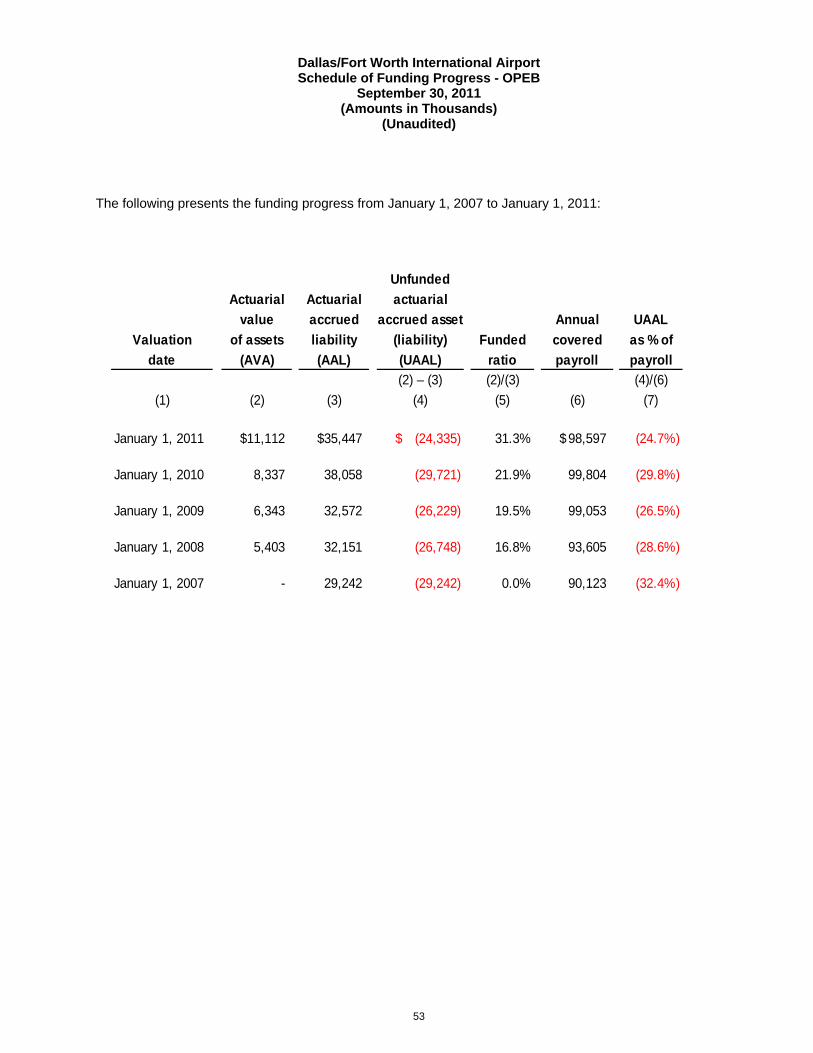
Dallas/Fort Worth International Airport Schedule of Funding Progress - OPEB
September 30, 2011 (Amounts in Thousands)
(Unaudited)
53
The following presents the funding progress from January 1, 2007 to January 1, 2011:
Unfunded
Actuarial Actuarial actuarial
value accrued accrued asset Annual UAAL
Valuation of assets liability (liability) Funded covered as % of
date (AVA) (AAL) (UAAL) ratio payroll payroll
(2) – (3) (2)/(3) (4)/(6)
(1) (2) (3) (4) (5) (6) (7)
January 1, 2011 11,112$ 35,447$ (24,335)$ 31.3% 98,597$ (24.7%)
January 1, 2010 8,337 38,058 (29,721) 21.9% 99,804 (29.8%)
January 1, 2009 6,343 32,572 (26,229) 19.5% 99,053 (26.5%)
January 1, 2008 5,403 32,151 (26,748) 16.8% 93,605 (28.6%)
January 1, 2007 - 29,242 (29,242) 0.0% 90,123 (32.4%)
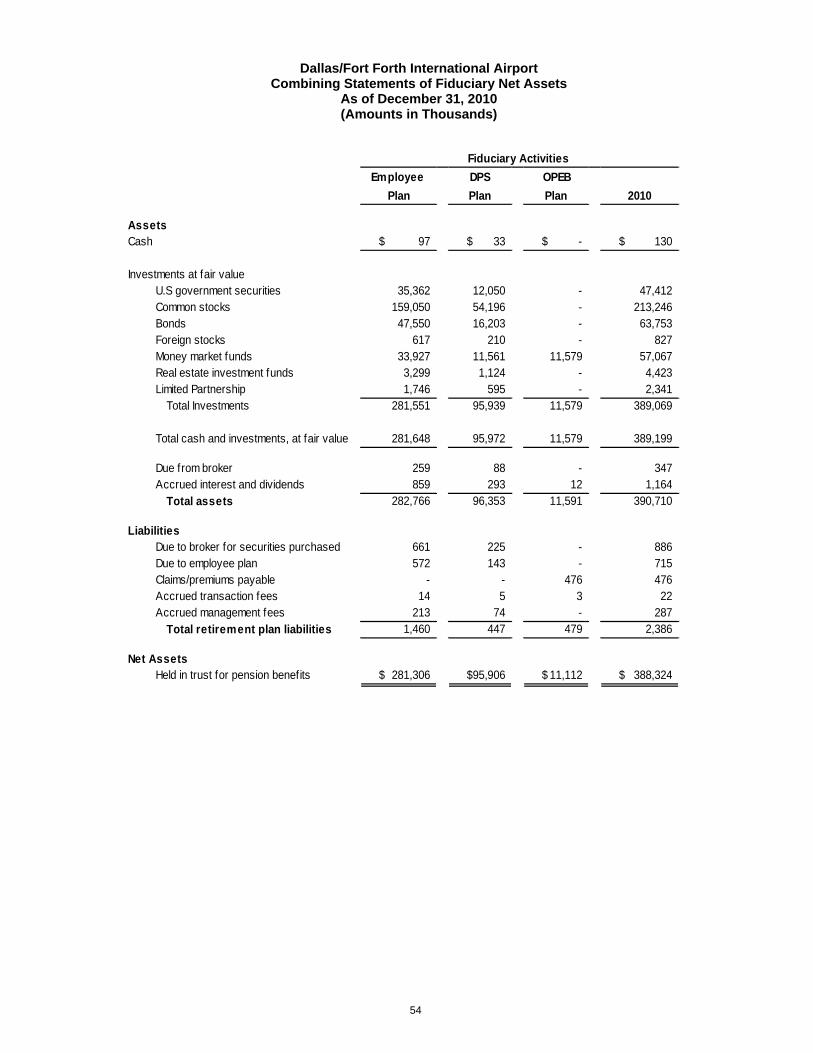
Dallas/Fort Forth International Airport Combining Statements of Fiduciary Net Assets
As of December 31, 2010 (Amounts in Thousands)
54
Employee DPS OPEB
Plan Plan Plan 2010
AssetsCash 97$ 33$ -$ 130$
Investments at fair valueU.S government securities 35,362 12,050 - 47,412 Common stocks 159,050 54,196 - 213,246 Bonds 47,550 16,203 - 63,753 Foreign stocks 617 210 - 827 Money market funds 33,927 11,561 11,579 57,067 Real estate investment funds 3,299 1,124 - 4,423 Limited Partnership 1,746 595 - 2,341
Total Investments 281,551 95,939 11,579 389,069
Total cash and investments, at fair value 281,648 95,972 11,579 389,199
Due from broker 259 88 - 347 Accrued interest and dividends 859 293 12 1,164
Total assets 282,766 96,353 11,591 390,710
LiabilitiesDue to broker for securities purchased 661 225 - 886 Due to employee plan 572 143 - 715 Claims/premiums payable - - 476 476 Accrued transaction fees 14 5 3 22 Accrued management fees 213 74 - 287
Total retirement plan liabilities 1,460 447 479 2,386
Net AssetsHeld in trust for pension benefits 281,306$ 95,906$ 11,112$ 388,324$
Fiduciary Activities
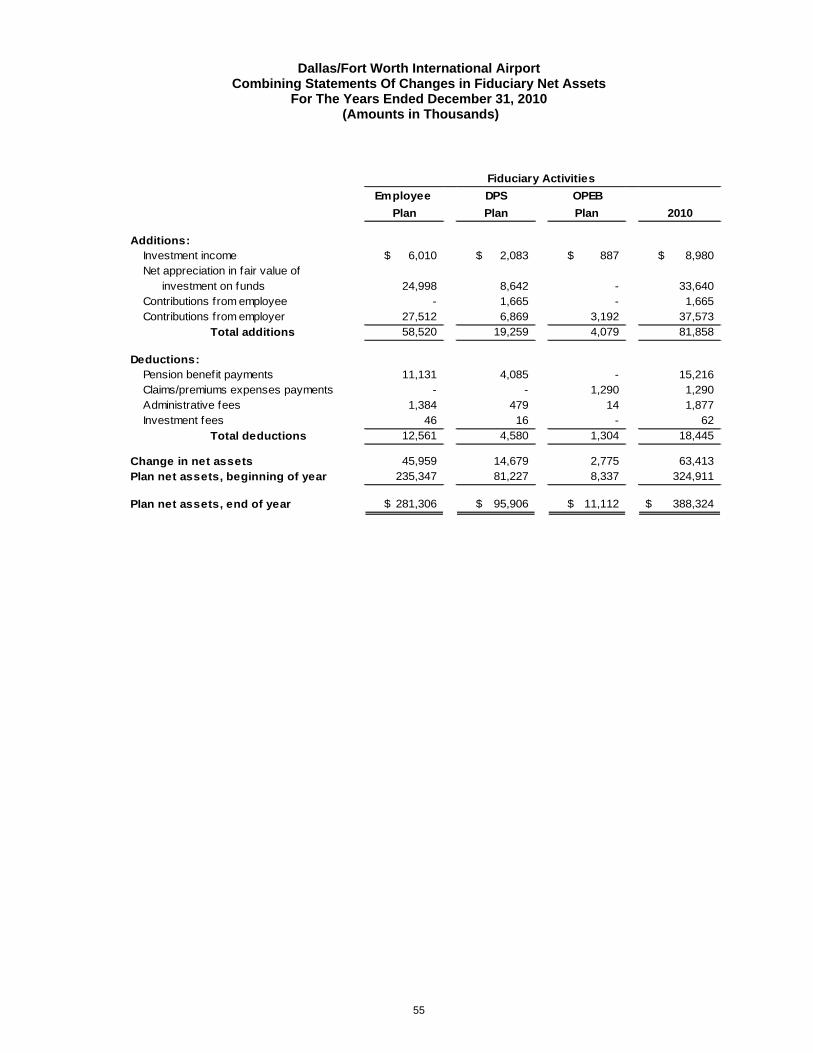
Dallas/Fort Worth International Airport Combining Statements Of Changes in Fiduciary Net Assets
For The Years Ended December 31, 2010 (Amounts in Thousands)
55
Employee DPS OPEB
Plan Plan Plan 2010
Additions:Investment income 6,010$ 2,083$ 887$ 8,980$ Net appreciation in fair value of investment on funds 24,998 8,642 - 33,640 Contributions from employee - 1,665 - 1,665 Contributions from employer 27,512 6,869 3,192 37,573
Total additions 58,520 19,259 4,079 81,858
Deductions:Pension benefit payments 11,131 4,085 - 15,216 Claims/premiums expenses payments - - 1,290 1,290 Administrative fees 1,384 479 14 1,877 Investment fees 46 16 - 62
Total deductions 12,561 4,580 1,304 18,445
Change in net assets 45,959 14,679 2,775 63,413 Plan net assets, beginning of year 235,347 81,227 8,337 324,911
Plan net assets, end of year 281,306$ 95,906$ 11,112$ 388,324$
Fiduciary Activities

“This Page Intentionally left Blank”
STATISTICAL SECTION
This section of DFW’s comprehensive and annual financial report presents detailed information for the purpose of supporting the reader’s understanding of DFW’s financial statements and note disclosures.
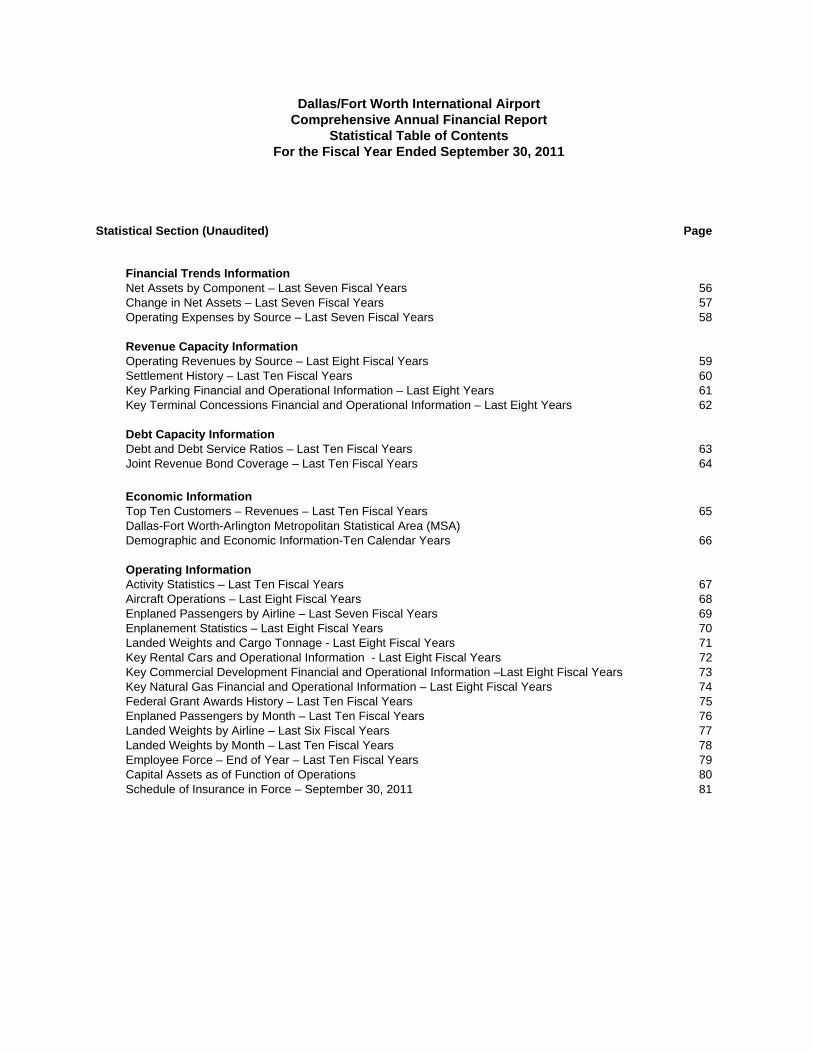
Dallas/Fort Worth International Airport Comprehensive Annual Financial Report
Statistical Table of Contents For the Fiscal Year Ended September 30, 2011
Statistical Section (Unaudited) Page Financial Trends Information Net Assets by Component – Last Seven Fiscal Years 56
Change in Net Assets – Last Seven Fiscal Years 57 Operating Expenses by Source – Last Seven Fiscal Years 58 Revenue Capacity Information Operating Revenues by Source – Last Eight Fiscal Years 59 Settlement History – Last Ten Fiscal Years 60 Key Parking Financial and Operational Information – Last Eight Years 61 Key Terminal Concessions Financial and Operational Information – Last Eight Years 62 Debt Capacity Information Debt and Debt Service Ratios – Last Ten Fiscal Years 63 Joint Revenue Bond Coverage – Last Ten Fiscal Years 64
Economic Information Top Ten Customers – Revenues – Last Ten Fiscal Years 65 Dallas-Fort Worth-Arlington Metropolitan Statistical Area (MSA) Demographic and Economic Information-Ten Calendar Years 66 Operating Information Activity Statistics – Last Ten Fiscal Years 67 Aircraft Operations – Last Eight Fiscal Years 68 Enplaned Passengers by Airline – Last Seven Fiscal Years 69 Enplanement Statistics – Last Eight Fiscal Years 70 Landed Weights and Cargo Tonnage - Last Eight Fiscal Years 71 Key Rental Cars and Operational Information - Last Eight Fiscal Years 72 Key Commercial Development Financial and Operational Information –Last Eight Fiscal Years 73 Key Natural Gas Financial and Operational Information – Last Eight Fiscal Years 74 Federal Grant Awards History – Last Ten Fiscal Years 75 Enplaned Passengers by Month – Last Ten Fiscal Years 76 Landed Weights by Airline – Last Six Fiscal Years 77 Landed Weights by Month – Last Ten Fiscal Years 78 Employee Force – End of Year – Last Ten Fiscal Years 79 Capital Assets as of Function of Operations 80 Schedule of Insurance in Force – September 30, 2011 81
FINANCIAL TRENDS INFORMATION
The following tables are designed to assist the reader in gaining a greater understanding of how DFW’s financial performance has changed over time.
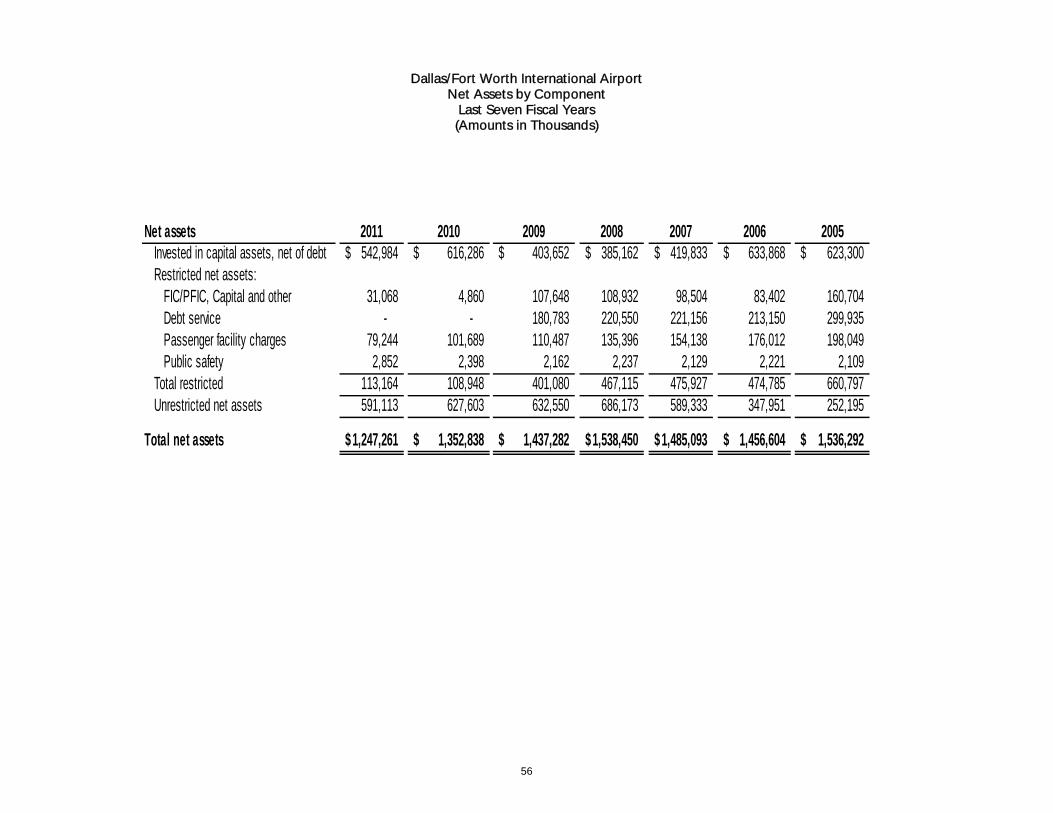
Dallas/Fort Worth International Airport Net Assets by Component
Last Seven Fiscal Years (Amounts in Thousands)
56
Net assets 2011 2010 2009 2008 2007 2006 2005Invested in capital assets, net of debt 542,984$ 616,286$ 403,652$ 385,162$ 419,833$ 633,868$ 623,300$ Restricted net assets:
FIC/PFIC, Capital and other 31,068 4,860 107,648 108,932 98,504 83,402 160,704 Debt service - - 180,783 220,550 221,156 213,150 299,935 Passenger facility charges 79,244 101,689 110,487 135,396 154,138 176,012 198,049 Public safety 2,852 2,398 2,162 2,237 2,129 2,221 2,109
Total restricted 113,164 108,948 401,080 467,115 475,927 474,785 660,797 Unrestricted net assets 591,113 627,603 632,550 686,173 589,333 347,951 252,195
Total net assets 1,247,261$ 1,352,838$ 1,437,282$ 1,538,450$ 1,485,093$ 1,456,604$ 1,536,292$
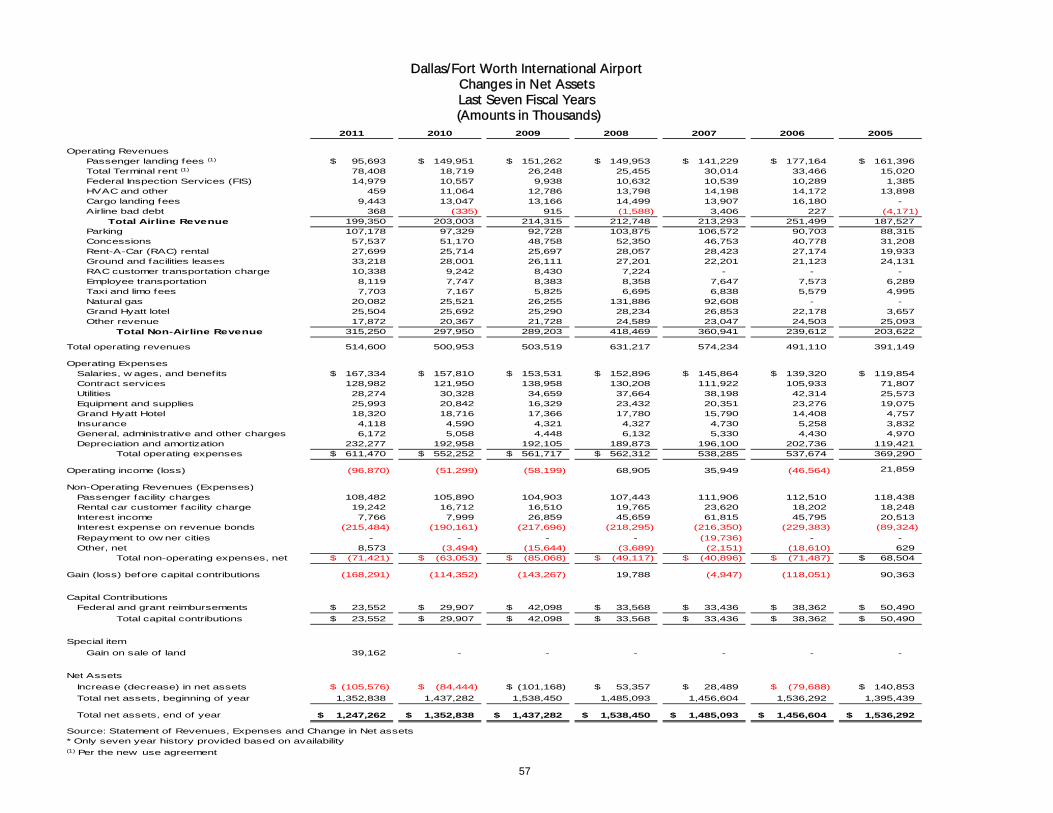
Dallas/Fort Worth International Airport Changes in Net Assets Last Seven Fiscal Years
(Amounts in Thousands)
57
2011 2010 2009 2008 2007 2006 2005
Operating Revenues Passenger landing fees (1) 95,693$ 149,951$ 151,262$ 149,953$ 141,229$ 177,164$ 161,396$ Total Terminal rent (1) 78,408 18,719 26,248 25,455 30,014 33,466 15,020 Federal Inspection Services (FIS) 14,979 10,557 9,938 10,632 10,539 10,289 1,385 HVAC and other 459 11,064 12,786 13,798 14,198 14,172 13,898 Cargo landing fees 9,443 13,047 13,166 14,499 13,907 16,180 - Airline bad debt 368 (335) 915 (1,588) 3,406 227 (4,171) Total Airline Revenue 199,350 203,003 214,315 212,748 213,293 251,499 187,527 Parking 107,178 97,329 92,728 103,875 106,572 90,703 88,315 Concessions 57,537 51,170 48,758 52,350 46,753 40,778 31,208 Rent-A-Car (RAC) rental 27,699 25,714 25,697 28,057 28,423 27,174 19,933 Ground and facilities leases 33,218 28,001 26,111 27,201 22,201 21,123 24,131 RAC customer transportation charge 10,338 9,242 8,430 7,224 - - - Employee transportation 8,119 7,747 8,383 8,358 7,647 7,573 6,289 Taxi and limo fees 7,703 7,167 5,825 6,695 6,838 5,579 4,995 Natural gas 20,082 25,521 26,255 131,886 92,608 - - Grand Hyatt lotel 25,504 25,692 25,290 28,234 26,853 22,178 3,657 Other revenue 17,872 20,367 21,728 24,589 23,047 24,503 25,093
Total Non-Airline Revenue 315,250 297,950 289,203 418,469 360,941 239,612 203,622
Total operating revenues 514,600 500,953 503,519 631,217 574,234 491,110 391,149
Operating ExpensesSalaries, w ages, and benefits 167,334$ 157,810$ 153,531$ 152,896$ 145,864$ 139,320$ 119,854$ Contract services 128,982 121,950 138,958 130,208 111,922 105,933 71,807 Utilities 28,274 30,328 34,659 37,664 38,198 42,314 25,573 Equipment and supplies 25,993 20,842 16,329 23,432 20,351 23,276 19,075 Grand Hyatt Hotel 18,320 18,716 17,366 17,780 15,790 14,408 4,757 Insurance 4,118 4,590 4,321 4,327 4,730 5,258 3,832 General, administrative and other charges 6,172 5,058 4,448 6,132 5,330 4,430 4,970 Depreciation and amortization 232,277 192,958 192,105 189,873 196,100 202,736 119,421
Total operating expenses 611,470$ 552,252$ 561,717$ 562,312$ 538,285 537,674 369,290
Operating income (loss) (96,870) (51,299) (58,199) 68,905 35,949 (46,564) 21,859
Non-Operating Revenues (Expenses)Passenger facility charges 108,482 105,890 104,903 107,443 111,906 112,510 118,438 Rental car customer facility charge 19,242 16,712 16,510 19,765 23,620 18,202 18,248 Interest income 7,766 7,999 26,859 45,659 61,815 45,795 20,513 Interest expense on revenue bonds (215,484) (190,161) (217,696) (218,295) (216,350) (229,383) (89,324)
Repayment to ow ner cities - - - - (19,736) - - Other, net 8,573 (3,494) (15,644) (3,689) (2,151) (18,610) 629
Total non-operating expenses, net (71,421)$ (63,053)$ (85,068)$ (49,117)$ (40,896)$ (71,487)$ 68,504$
Gain (loss) before capital contributions (168,291) (114,352) (143,267) 19,788 (4,947) (118,051) 90,363
Capital ContributionsFederal and grant reimbursements 23,552$ 29,907$ 42,098$ 33,568$ 33,436$ 38,362$ 50,490$
Total capital contributions 23,552$ 29,907$ 42,098$ 33,568$ 33,436$ 38,362$ 50,490$
Special item
Gain on sale of land 39,162 - - - - - -
Net Assets
Increase (decrease) in net assets (105,576)$ (84,444)$ (101,168)$ 53,357$ 28,489$ (79,688)$ 140,853$
Total net assets, beginning of year 1,352,838 1,437,282 1,538,450 1,485,093 1,456,604 1,536,292 1,395,439
Total net assets, end of year 1,247,262$ 1,352,838$ 1,437,282$ 1,538,450$ 1,485,093$ 1,456,604$ 1,536,292$
Source: Statement of Revenues, Expenses and Change in Net assets* Only seven year history provided based on availability(1) Per the new use agreement
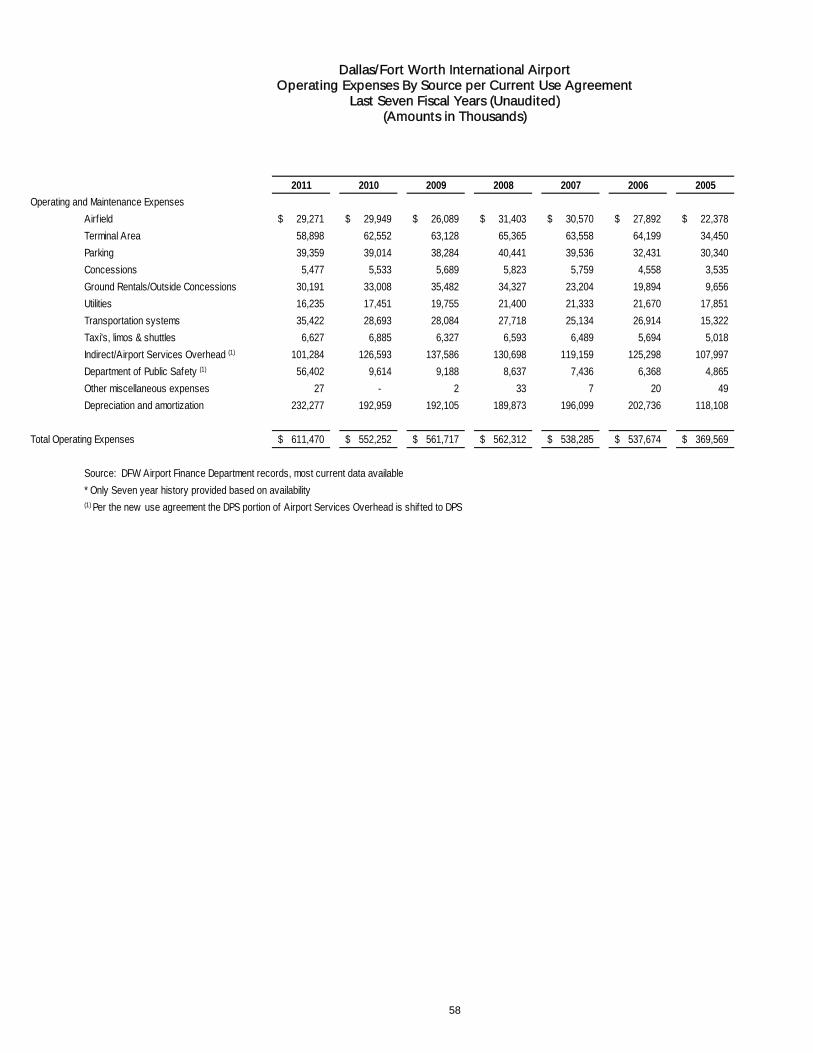
Dallas/Fort Worth International Airport Operating Expenses By Source per Current Use Agreement
Last Seven Fiscal Years (Unaudited) (Amounts in Thousands)
58
2011 2010 2009 2008 2007 2006 2005
Operating and Maintenance Expenses
Airf ield 29,271$ 29,949$ 26,089$ 31,403$ 30,570$ 27,892$ 22,378$
Terminal Area 58,898 62,552 63,128 65,365 63,558 64,199 34,450
Parking 39,359 39,014 38,284 40,441 39,536 32,431 30,340
Concessions 5,477 5,533 5,689 5,823 5,759 4,558 3,535
Ground Rentals/Outside Concessions 30,191 33,008 35,482 34,327 23,204 19,894 9,656
Utilities 16,235 17,451 19,755 21,400 21,333 21,670 17,851
Transportation systems 35,422 28,693 28,084 27,718 25,134 26,914 15,322
Taxi's, limos & shuttles 6,627 6,885 6,327 6,593 6,489 5,694 5,018
Indirect/Airport Services Overhead (1) 101,284 126,593 137,586 130,698 119,159 125,298 107,997
Department of Public Safety (1) 56,402 9,614 9,188 8,637 7,436 6,368 4,865
Other miscellaneous expenses 27 - 2 33 7 20 49
Depreciation and amortization 232,277 192,959 192,105 189,873 196,099 202,736 118,108
Total Operating Expenses 611,470$ 552,252$ 561,717$ 562,312$ 538,285$ 537,674$ 369,569$
Source: DFW Airport Finance Department records, most current data available
* Only Seven year history provided based on availability(1) Per the new use agreement the DPS portion of Airport Services Overhead is shifted to DPS

REVENUE CAPACITY INFORMATION
The following tables are designed to assist the reader in gaining a greater understanding of the underlying factors affecting key DFW revenue trends.
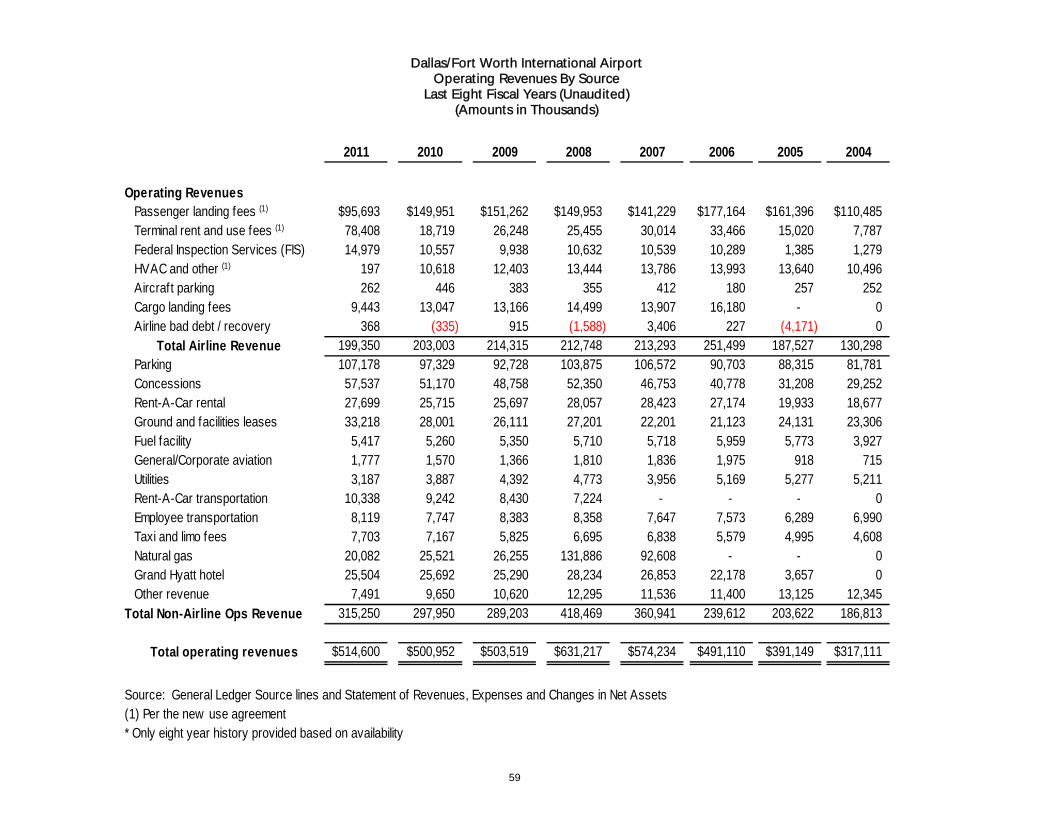
Dallas/Fort Worth International Airport Operating Revenues By Source
Last Eight Fiscal Years (Unaudited) (Amounts in Thousands)
59
2011 2010 2009 2008 2007 2006 2005 2004
Operating Revenues Passenger landing fees (1) $95,693 $149,951 $151,262 $149,953 $141,229 $177,164 $161,396 $110,485 Terminal rent and use fees (1) 78,408 18,719 26,248 25,455 30,014 33,466 15,020 7,787 Federal Inspection Services (FIS) 14,979 10,557 9,938 10,632 10,539 10,289 1,385 1,279 HVAC and other (1) 197 10,618 12,403 13,444 13,786 13,993 13,640 10,496 Aircraft parking 262 446 383 355 412 180 257 252 Cargo landing fees 9,443 13,047 13,166 14,499 13,907 16,180 - 0 Airline bad debt / recovery 368 (335) 915 (1,588) 3,406 227 (4,171) 0 Total Airline Revenue 199,350 203,003 214,315 212,748 213,293 251,499 187,527 130,298 Parking 107,178 97,329 92,728 103,875 106,572 90,703 88,315 81,781 Concessions 57,537 51,170 48,758 52,350 46,753 40,778 31,208 29,252 Rent-A-Car rental 27,699 25,715 25,697 28,057 28,423 27,174 19,933 18,677 Ground and facilities leases 33,218 28,001 26,111 27,201 22,201 21,123 24,131 23,306 Fuel facility 5,417 5,260 5,350 5,710 5,718 5,959 5,773 3,927 General/Corporate aviation 1,777 1,570 1,366 1,810 1,836 1,975 918 715 Utilities 3,187 3,887 4,392 4,773 3,956 5,169 5,277 5,211 Rent-A-Car transportation 10,338 9,242 8,430 7,224 - - - 0 Employee transportation 8,119 7,747 8,383 8,358 7,647 7,573 6,289 6,990 Taxi and limo fees 7,703 7,167 5,825 6,695 6,838 5,579 4,995 4,608 Natural gas 20,082 25,521 26,255 131,886 92,608 - - 0 Grand Hyatt hotel 25,504 25,692 25,290 28,234 26,853 22,178 3,657 0 Other revenue 7,491 9,650 10,620 12,295 11,536 11,400 13,125 12,345
Total Non-Airline Ops Revenue 315,250 297,950 289,203 418,469 360,941 239,612 203,622 186,813
Total operating revenues 514,600$ 500,952$ 503,519$ 631,217$ 574,234$ 491,110$ 391,149$ 317,111$
Source: General Ledger Source lines and Statement of Revenues, Expenses and Changes in Net Assets (1) Per the new use agreement* Only eight year history provided based on availability
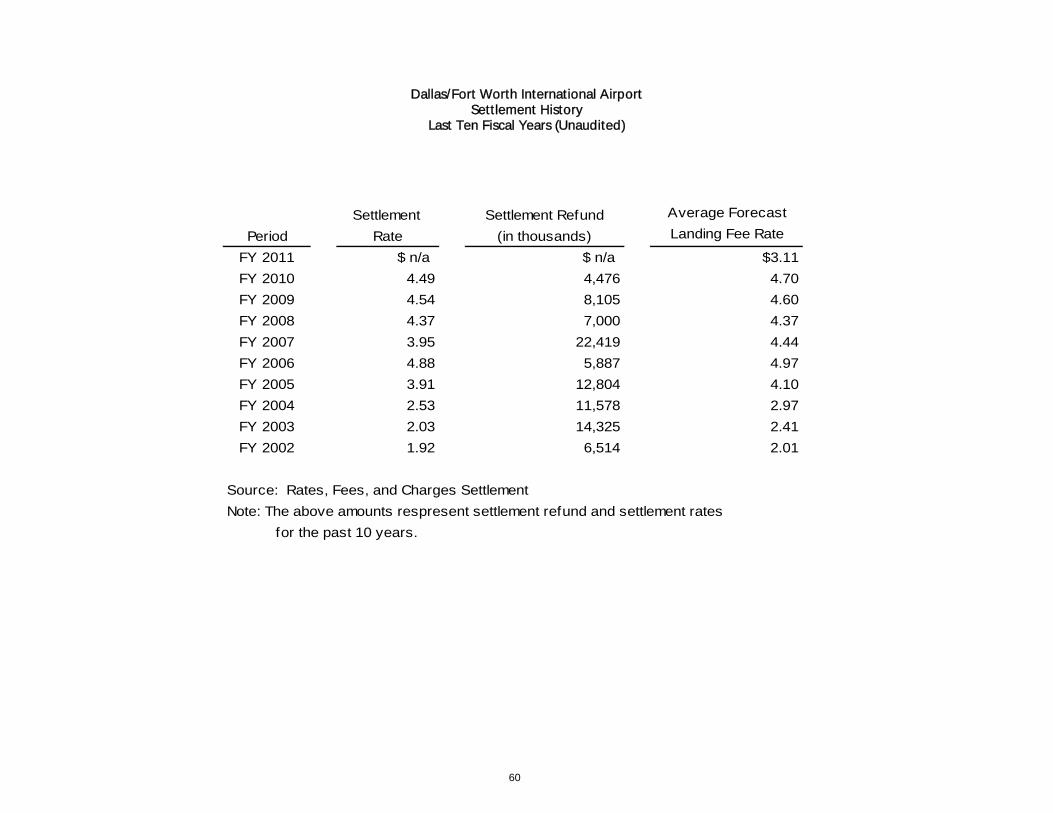
Dallas/Fort Worth International Airport Settlement History
Last Ten Fiscal Years (Unaudited)
60
Settlement Settlement Refund Average Forecast
Period Rate (in thousands) Landing Fee Rate
FY 2011 $ n/a $ n/a $3.11
FY 2010 4.49 4,476 4.70
FY 2009 4.54 8,105 4.60
FY 2008 4.37 7,000 4.37
FY 2007 3.95 22,419 4.44
FY 2006 4.88 5,887 4.97
FY 2005 3.91 12,804 4.10
FY 2004 2.53 11,578 2.97
FY 2003 2.03 14,325 2.41
FY 2002 1.92 6,514 2.01
Source: Rates, Fees, and Charges Settlement
Note: The above amounts respresent settlement refund and settlement rates
for the past 10 years.
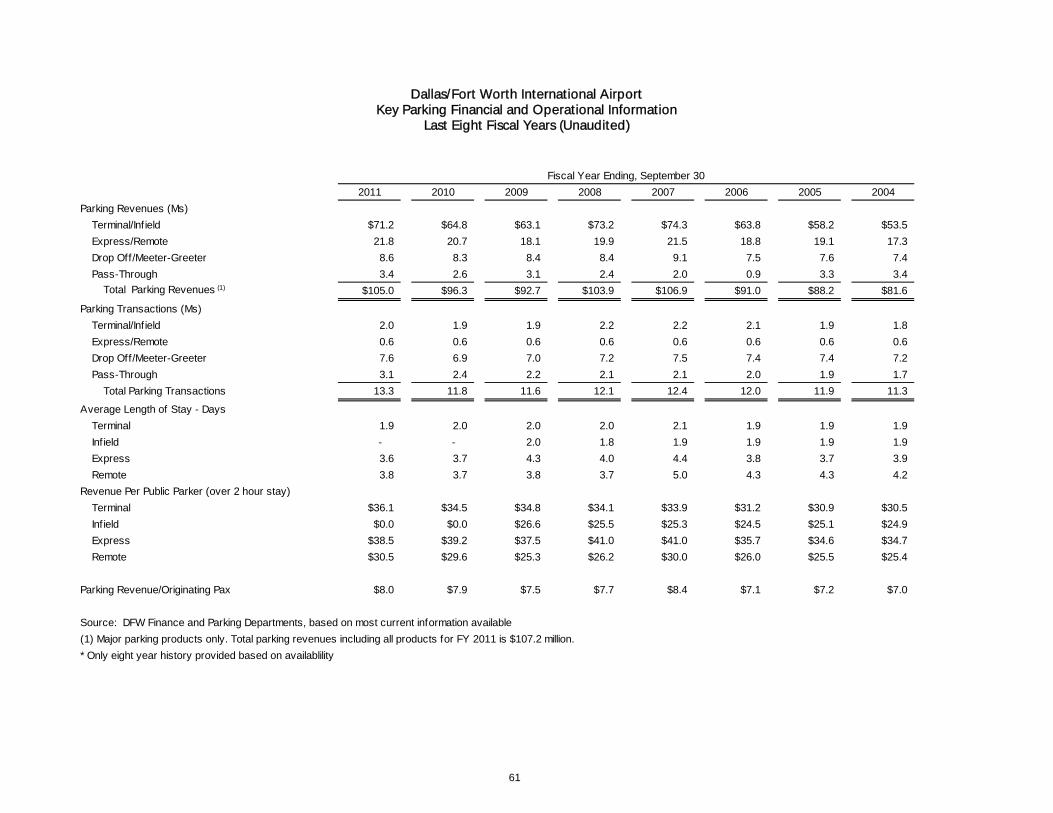
Dallas/Fort Worth International Airport Key Parking Financial and Operational Information
Last Eight Fiscal Years (Unaudited)
61
2011 2010 2009 2008 2007 2006 2005 2004
Parking Revenues (Ms)
Terminal/Inf ield $71.2 $64.8 $63.1 $73.2 $74.3 $63.8 $58.2 $53.5
Express/Remote 21.8 20.7 18.1 19.9 21.5 18.8 19.1 17.3
Drop Off/Meeter-Greeter 8.6 8.3 8.4 8.4 9.1 7.5 7.6 7.4
Pass-Through 3.4 2.6 3.1 2.4 2.0 0.9 3.3 3.4
Total Parking Revenues (1) $105.0 $96.3 $92.7 $103.9 $106.9 $91.0 $88.2 $81.6
Parking Transactions (Ms)
Terminal/Inf ield 2.0 1.9 1.9 2.2 2.2 2.1 1.9 1.8
Express/Remote 0.6 0.6 0.6 0.6 0.6 0.6 0.6 0.6
Drop Off/Meeter-Greeter 7.6 6.9 7.0 7.2 7.5 7.4 7.4 7.2
Pass-Through 3.1 2.4 2.2 2.1 2.1 2.0 1.9 1.7
Total Parking Transactions 13.3 11.8 11.6 12.1 12.4 12.0 11.9 11.3
Average Length of Stay - Days
Terminal 1.9 2.0 2.0 2.0 2.1 1.9 1.9 1.9
Inf ield - - 2.0 1.8 1.9 1.9 1.9 1.9
Express 3.6 3.7 4.3 4.0 4.4 3.8 3.7 3.9
Remote 3.8 3.7 3.8 3.7 5.0 4.3 4.3 4.2
Revenue Per Public Parker (over 2 hour stay)
Terminal $36.1 $34.5 $34.8 $34.1 $33.9 $31.2 $30.9 $30.5
Inf ield $0.0 $0.0 $26.6 $25.5 $25.3 $24.5 $25.1 $24.9
Express $38.5 $39.2 $37.5 $41.0 $41.0 $35.7 $34.6 $34.7
Remote $30.5 $29.6 $25.3 $26.2 $30.0 $26.0 $25.5 $25.4
Parking Revenue/Originating Pax $8.0 $7.9 $7.5 $7.7 $8.4 $7.1 $7.2 $7.0
Source: DFW Finance and Parking Departments, based on most current information available
(1) Major parking products only. Total parking revenues including all products for FY 2011 is $107.2 million.
* Only eight year history provided based on availablility
Fiscal Year Ending, September 30

Dallas/Fort Worth International Airport Key Terminal Concessions Financial and Operational Information
Last Eight Fiscal Years (Unaudited)
62
Fiscal Year Ending, September 30
2011 2010 2009 2008 2007 2006 2005 2004
Number of concessions locations 243 214 214 224 222 211 189 174
Leased sq. ft. EOY (000s) 241 231 229 237 233 224 184 156
Concessions Sales (Ms):
Food and beverage $165.9 $150.2 $141.5 $144.7 $142.9 $128.2 $111.2 $105.2
Retail and duty free 101.1 92.1 88.7 98.7 91.0 77.7 67.6 68.1
Other In Terminal 28.3 25.3 22.8 23.7 21.9 17.6 13.1 11.7
Total concessions sales $295.3 $267.6 $253.1 $267.1 $255.9 $223.6 $191.9 $185.0
Concessions sales/enplanement $10.23 $9.49 $9.06 $9.22 $8.59 $7.43 $6.53 $6.32
Concession sales/sq. ft. $1,224 $1,159 $1,105 $1,128 $1,097 $999 $1,045 $1,186
Concessions Income to DFW (Ms):
Food and beverage $20.6 $19.6 $17.8 $19.0 $17.5 $15.8 $14.2 $12.4
Retail and duty free 17.2 15.1 15.0 16.0 14.6 10.7 9.5 9.5
Other In Terminal 13.8 13.8 13.4 14.1 13.0 12.6 10.1 9.2
Other Not In Terminal (1) 4.7 1.6 1.6 1.8 1.7 1.6 1.3 1.3
Total income to DFW $56.3 $50.1 $47.8 $50.8 $46.8 $40.8 $35.0 $32.4
Concessions income/enplanement $1.79 $1.72 $1.65 $1.69 $1.51 $1.30 $1.15 $1.06
Concessions income/sq. ft. $286 $210 $202 $207 $193 $175 $184 $200
Concession reimbursable services (2) 1.2
Total concessions $57.5
Source: DFW Finance and Concessions Departments, most current data available, from concessionaire on-line reporting.
*Only eight year history provided based on availability
(1) Non-passenger/non-terminal income. Not included in ratios.
(2) Reimbursable services included per new use agreement

DEBT CAPACITY INFORMATION
The following tables are designed to assist the reader in gaining a greater understanding of DFW’s current outstanding debt, debt history and DFW’s ability to issue additional debt in the future.
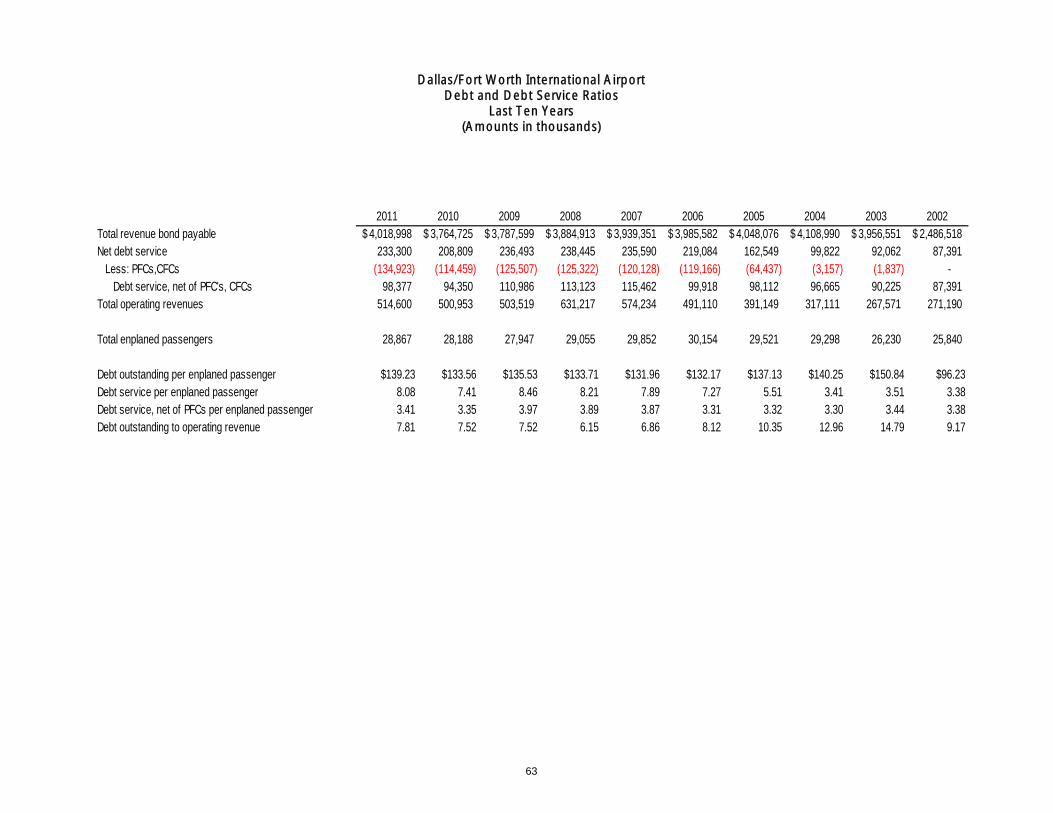
Dallas/Fort Worth International Airport Debt and Debt Service Ratios
Last Ten Years (Amounts in thousands)
63
2011 2010 2009 2008 2007 2006 2005 2004 2003 2002Total revenue bond payable 4,018,998$ 3,764,725$ 3,787,599$ 3,884,913$ 3,939,351$ 3,985,582$ 4,048,076$ 4,108,990$ 3,956,551$ 2,486,518$ Net debt service 233,300 208,809 236,493 238,445 235,590 219,084 162,549 99,822 92,062 87,391 Less: PFCs,CFCs (134,923) (114,459) (125,507) (125,322) (120,128) (119,166) (64,437) (3,157) (1,837) - Debt service, net of PFC's, CFCs 98,377 94,350 110,986 113,123 115,462 99,918 98,112 96,665 90,225 87,391 Total operating revenues 514,600 500,953 503,519 631,217 574,234 491,110 391,149 317,111 267,571 271,190
Total enplaned passengers 28,867 28,188 27,947 29,055 29,852 30,154 29,521 29,298 26,230 25,840
Debt outstanding per enplaned passenger $139.23 $133.56 $135.53 $133.71 $131.96 $132.17 $137.13 $140.25 $150.84 $96.23Debt service per enplaned passenger 8.08 7.41 8.46 8.21 7.89 7.27 5.51 3.41 3.51 3.38Debt service, net of PFCs per enplaned passenger 3.41 3.35 3.97 3.89 3.87 3.31 3.32 3.30 3.44 3.38Debt outstanding to operating revenue 7.81 7.52 7.52 6.15 6.86 8.12 10.35 12.96 14.79 9.17
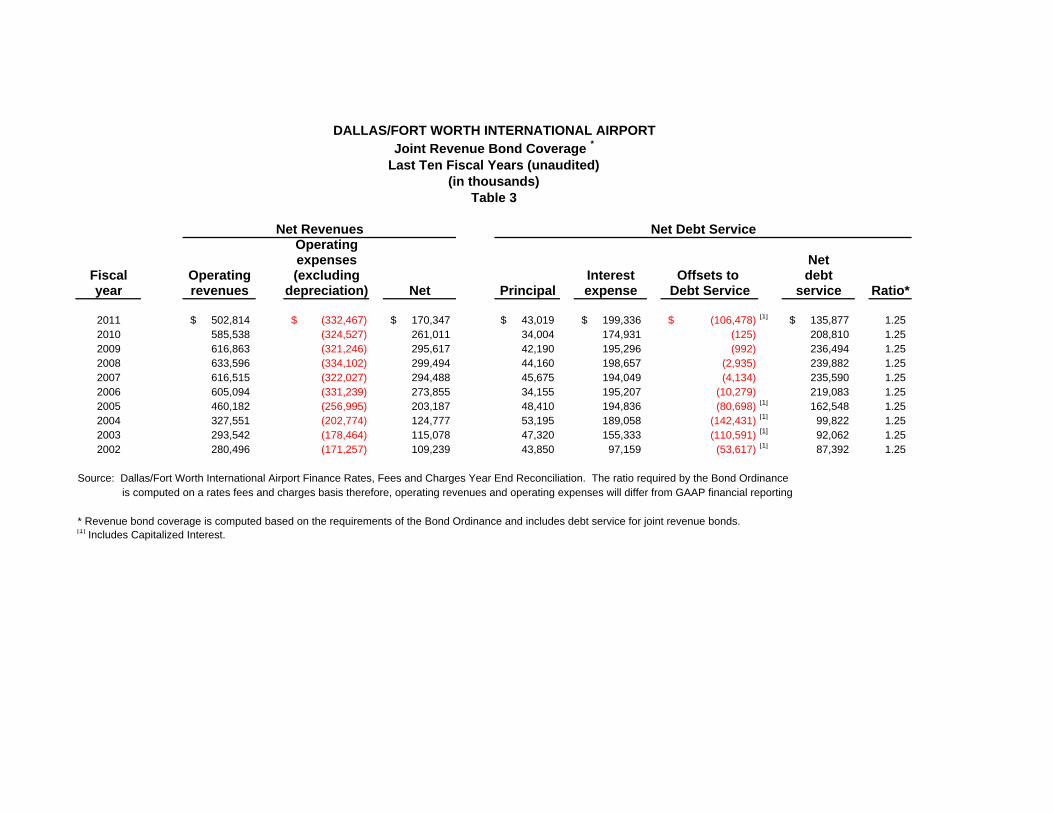
Joint Revenue Bond Coverage *
Last Ten Fiscal Years (unaudited)(in thousands)
Table 3
Net Revenues Net Debt ServiceOperating expenses Net
Fiscal Operating (excluding Interest Offsets to debtyear revenues depreciation) Net Principal expense Debt Service service Ratio*
2011 502,814$ (332,467)$ 170,347$ 43,019$ 199,336$ (106,478)$ [1] 135,877$ 1.25 2010 585,538 (324,527) 261,011 34,004 174,931 (125) 208,810 1.25 2009 616,863 (321,246) 295,617 42,190 195,296 (992) 236,494 1.25 2008 633,596 (334,102) 299,494 44,160 198,657 (2,935) 239,882 1.25 2007 616,515 (322,027) 294,488 45,675 194,049 (4,134) 235,590 1.25 2006 605,094 (331,239) 273,855 34,155 195,207 (10,279) 219,083 1.25 2005 460,182 (256,995) 203,187 48,410 194,836 (80,698) [1] 162,548 1.25 2004 327,551 (202,774) 124,777 53,195 189,058 (142,431) [1] 99,822 1.25 2003 293,542 (178,464) 115,078 47,320 155,333 (110,591) [1] 92,062 1.25 2002 280,496 (171,257) 109,239 43,850 97,159 (53,617) [1] 87,392 1.25
Source: Dallas/Fort Worth International Airport Finance Rates, Fees and Charges Year End Reconciliation. The ratio required by the Bond Ordinance is computed on a rates fees and charges basis therefore, operating revenues and operating expenses will differ from GAAP financial reporting
* Revenue bond coverage is computed based on the requirements of the Bond Ordinance and includes debt service for joint revenue bonds. [1] Includes Capitalized Interest.
DALLAS/FORT WORTH INTERNATIONAL AIRPORT

DEMOGRAPHIC & ECONOMIC INFORMATION
The following tables represent demographic and economic information for the purpose of increasing the reader’s understanding of the business environment in which DFW operates.
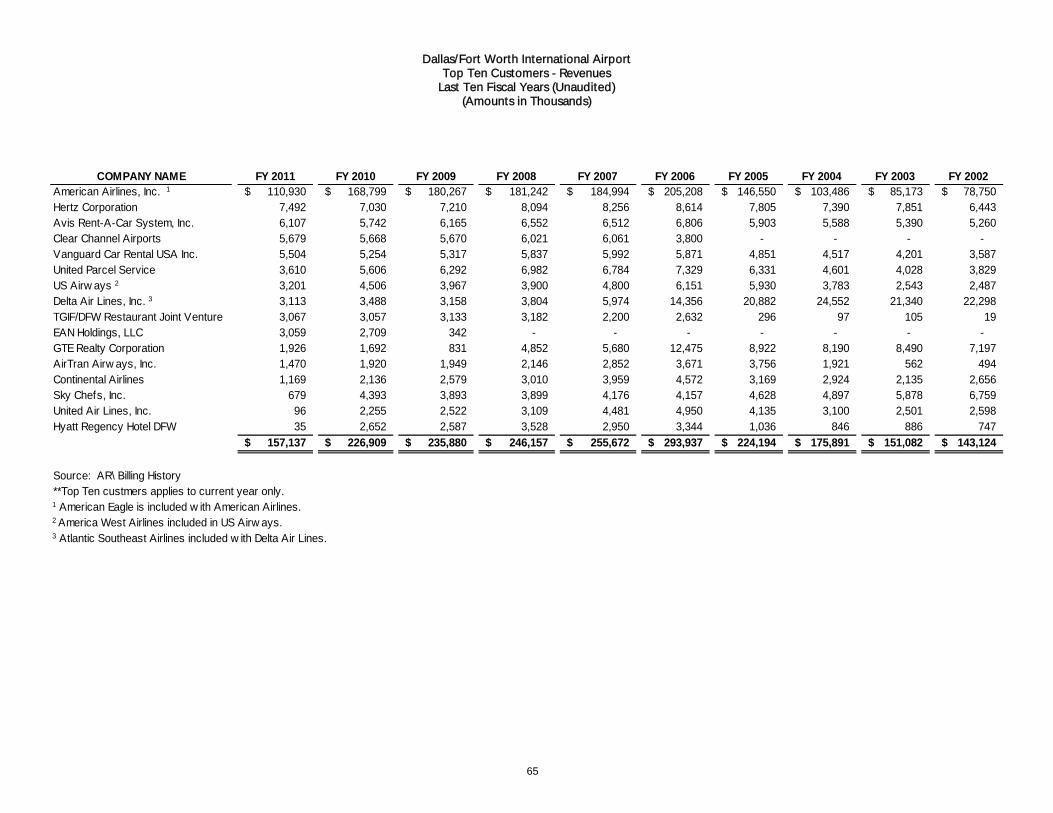
Dallas/Fort Worth International Airport Top Ten Customers - Revenues
Last Ten Fiscal Years (Unaudited) (Amounts in Thousands)
65
COMPANY NAME FY 2011 FY 2010 FY 2009 FY 2008 FY 2007 FY 2006 FY 2005 FY 2004 FY 2003 FY 2002American Airlines, Inc. 1 110,930$ 168,799$ 180,267$ 181,242$ 184,994$ 205,208$ 146,550$ 103,486$ 85,173$ 78,750$ Hertz Corporation 7,492 7,030 7,210 8,094 8,256 8,614 7,805 7,390 7,851 6,443Avis Rent-A-Car System, Inc. 6,107 5,742 6,165 6,552 6,512 6,806 5,903 5,588 5,390 5,260Clear Channel Airports 5,679 5,668 5,670 6,021 6,061 3,800 - - - - Vanguard Car Rental USA Inc. 5,504 5,254 5,317 5,837 5,992 5,871 4,851 4,517 4,201 3,587United Parcel Service 3,610 5,606 6,292 6,982 6,784 7,329 6,331 4,601 4,028 3,829US Airw ays 2 3,201 4,506 3,967 3,900 4,800 6,151 5,930 3,783 2,543 2,487Delta Air Lines, Inc. 3 3,113 3,488 3,158 3,804 5,974 14,356 20,882 24,552 21,340 22,298TGIF/DFW Restaurant Joint Venture 3,067 3,057 3,133 3,182 2,200 2,632 296 97 105 19EAN Holdings, LLC 3,059 2,709 342 - - - - - - - GTE Realty Corporation 1,926 1,692 831 4,852 5,680 12,475 8,922 8,190 8,490 7,197AirTran Airw ays, Inc. 1,470 1,920 1,949 2,146 2,852 3,671 3,756 1,921 562 494Continental Airlines 1,169 2,136 2,579 3,010 3,959 4,572 3,169 2,924 2,135 2,656Sky Chefs, Inc. 679 4,393 3,893 3,899 4,176 4,157 4,628 4,897 5,878 6,759United Air Lines, Inc. 96 2,255 2,522 3,109 4,481 4,950 4,135 3,100 2,501 2,598Hyatt Regency Hotel DFW 35 2,652 2,587 3,528 2,950 3,344 1,036 846 886 747
157,137$ 226,909$ 235,880$ 246,157$ 255,672$ 293,937$ 224,194$ 175,891$ 151,082$ 143,124$
Source: AR\ Billing History**Top Ten custmers applies to current year only.1 American Eagle is included w ith American Airlines.2 America West Airlines included in US Airw ays.3 Atlantic Southeast Airlines included w ith Delta Air Lines.
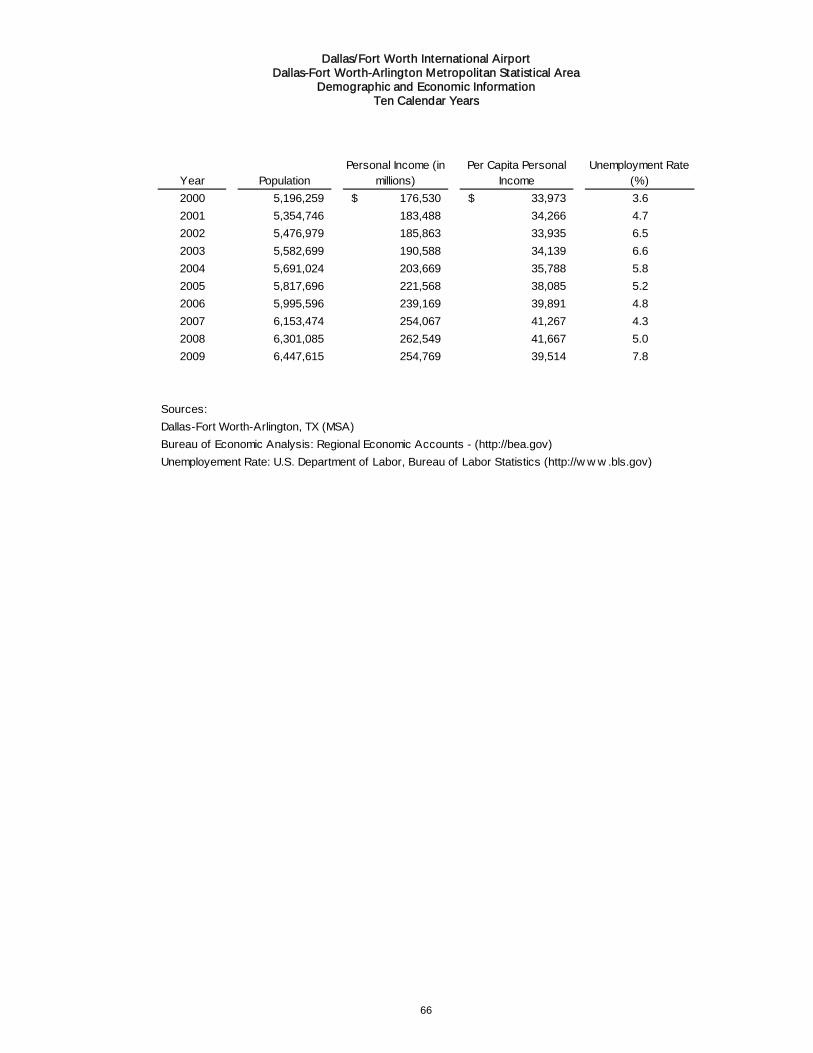
Dallas/Fort Worth International Airport Dallas-Fort Worth-Arlington Metropolitan Statistical Area
Demographic and Economic Information Ten Calendar Years
66
Year PopulationPersonal Income (in
millions)Per Capita Personal
IncomeUnemployment Rate
(%)
2000 5,196,259 176,530$ 33,973$ 3.6
2001 5,354,746 183,488 34,266 4.7
2002 5,476,979 185,863 33,935 6.5
2003 5,582,699 190,588 34,139 6.6
2004 5,691,024 203,669 35,788 5.8
2005 5,817,696 221,568 38,085 5.2
2006 5,995,596 239,169 39,891 4.8
2007 6,153,474 254,067 41,267 4.3
2008 6,301,085 262,549 41,667 5.0
2009 6,447,615 254,769 39,514 7.8
Sources:
Dallas-Fort Worth-Arlington, TX (MSA)
Bureau of Economic Analysis: Regional Economic Accounts - (http://bea.gov)
Unemployement Rate: U.S. Department of Labor, Bureau of Labor Statistics (http://w w w .bls.gov)

OPERATING INFORMATION
The following tables are designed to assist the reader in gaining a greater understanding of underlying factors affecting DFW’s ability to generate revenue, highlighting trends in operations, activities and resources.
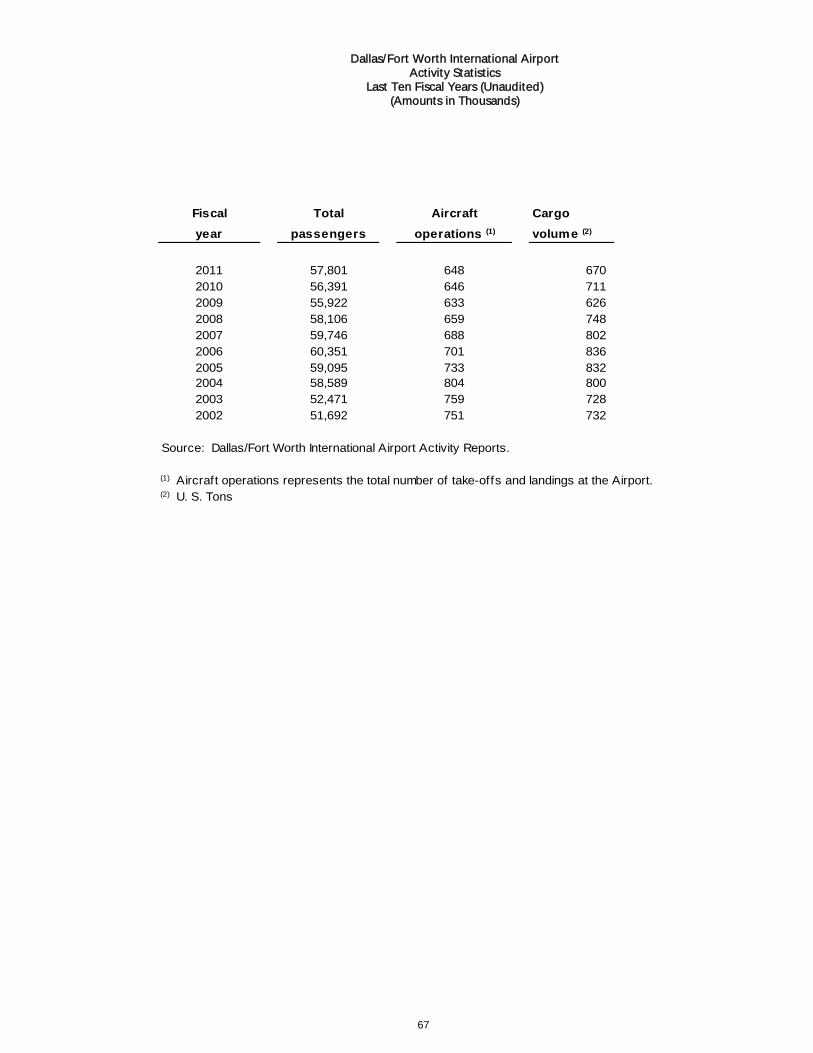
Dallas/Fort Worth International Airport Activity Statistics
Last Ten Fiscal Years (Unaudited) (Amounts in Thousands)
67
Fiscal Total Aircraft Cargo
year passengers operations (1) volume (2)
2011 57,801 648 6702010 56,391 646 7112009 55,922 633 6262008 58,106 659 7482007 59,746 688 8022006 60,351 701 8362005 59,095 733 8322004 58,589 804 8002003 52,471 759 7282002 51,692 751 732
Source: Dallas/Fort Worth International Airport Activity Reports.
(1) Aircraft operations represents the total number of take-offs and landings at the Airport.(2) U. S. Tons
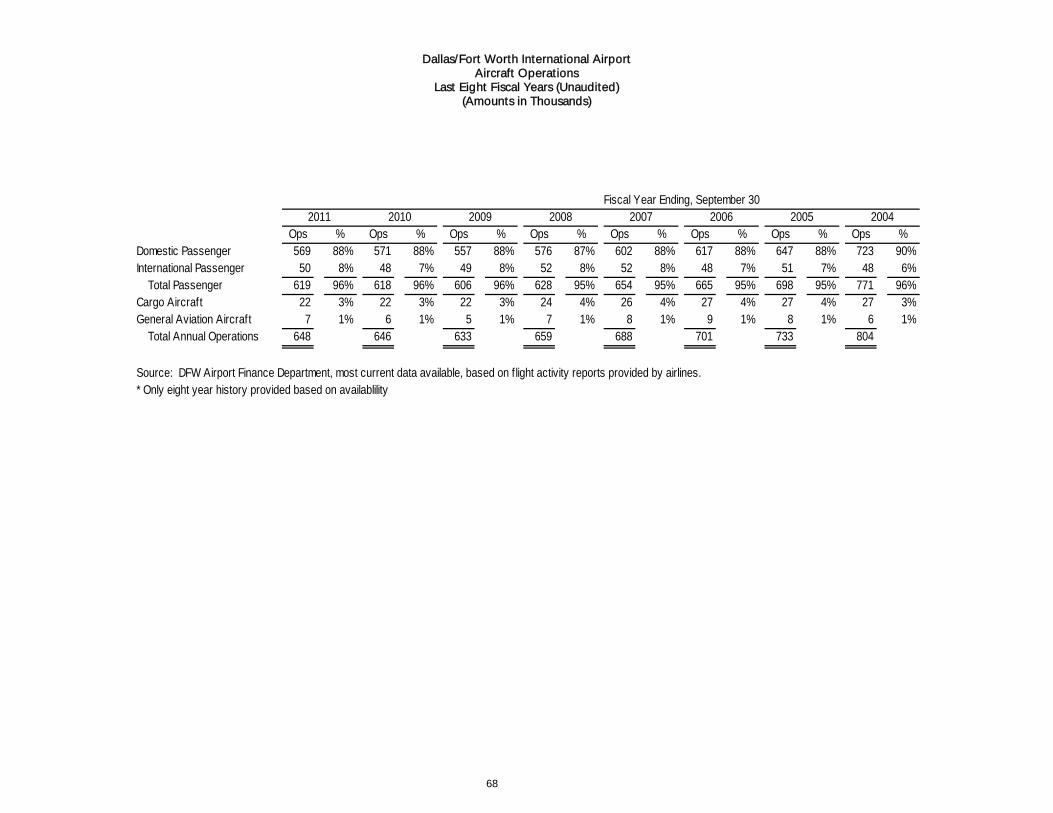
Dallas/Fort Worth International Airport Aircraft Operations
Last Eight Fiscal Years (Unaudited) (Amounts in Thousands)
68
Ops % Ops % Ops % Ops % Ops % Ops % Ops % Ops %Domestic Passenger 569 88% 571 88% 557 88% 576 87% 602 88% 617 88% 647 88% 723 90%International Passenger 50 8% 48 7% 49 8% 52 8% 52 8% 48 7% 51 7% 48 6%
Total Passenger 619 96% 618 96% 606 96% 628 95% 654 95% 665 95% 698 95% 771 96%Cargo Aircraft 22 3% 22 3% 22 3% 24 4% 26 4% 27 4% 27 4% 27 3%General Aviation Aircraft 7 1% 6 1% 5 1% 7 1% 8 1% 9 1% 8 1% 6 1%
Total Annual Operations 648 646 633 659 688 701 733 804
Source: DFW Airport Finance Department, most current data available, based on f light activity reports provided by airlines.* Only eight year history provided based on availablility
Fiscal Year Ending, September 302011 2005 20042010 2009 2008 2007 2006
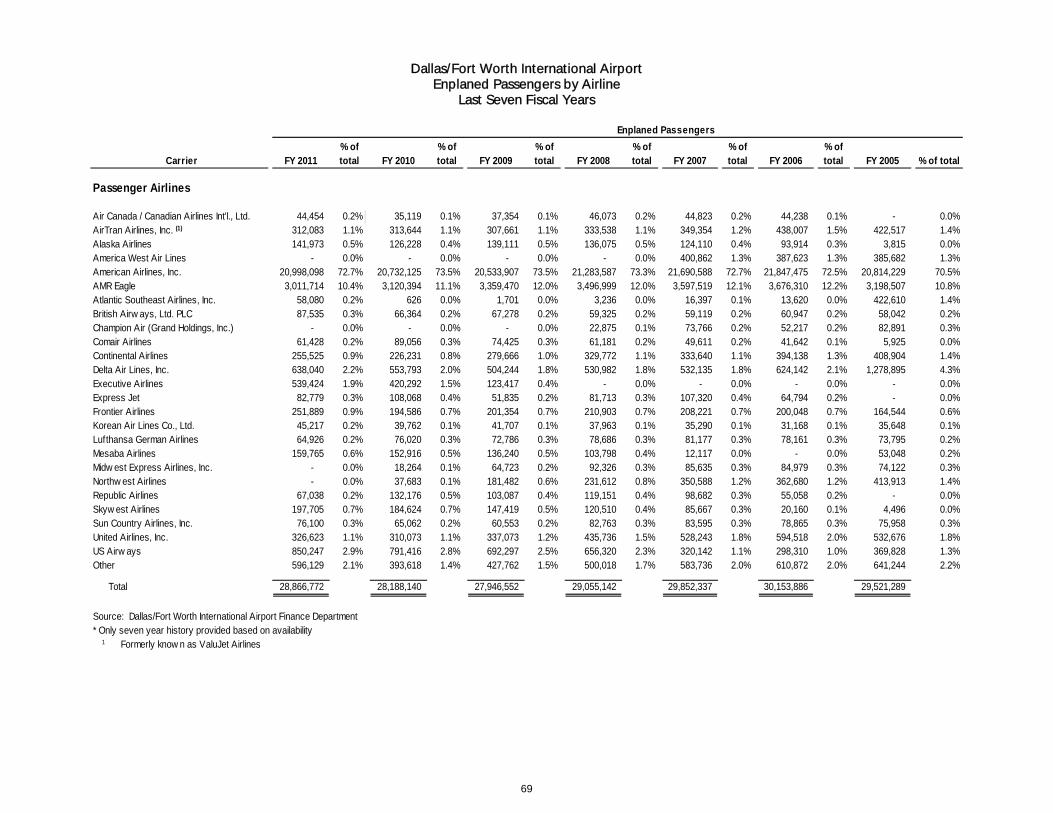
Dallas/Fort Worth International Airport Enplaned Passengers by Airline
Last Seven Fiscal Years
69
Carrier FY 2011% of total FY 2010
% of total FY 2009
% of total FY 2008
% of total FY 2007
% of total FY 2006
% of total FY 2005 % of total
Passenger Airlines
Air Canada / Canadian Airlines Int'l., Ltd. 44,454 0.2% 35,119 0.1% 37,354 0.1% 46,073 0.2% 44,823 0.2% 44,238 0.1% - 0.0%AirTran Airlines, Inc. (1) 312,083 1.1% 313,644 1.1% 307,661 1.1% 333,538 1.1% 349,354 1.2% 438,007 1.5% 422,517 1.4%Alaska Airlines 141,973 0.5% 126,228 0.4% 139,111 0.5% 136,075 0.5% 124,110 0.4% 93,914 0.3% 3,815 0.0%America West Air Lines - 0.0% - 0.0% - 0.0% - 0.0% 400,862 1.3% 387,623 1.3% 385,682 1.3%American Airlines, Inc. 20,998,098 72.7% 20,732,125 73.5% 20,533,907 73.5% 21,283,587 73.3% 21,690,588 72.7% 21,847,475 72.5% 20,814,229 70.5%AMR Eagle 3,011,714 10.4% 3,120,394 11.1% 3,359,470 12.0% 3,496,999 12.0% 3,597,519 12.1% 3,676,310 12.2% 3,198,507 10.8%Atlantic Southeast Airlines, Inc. 58,080 0.2% 626 0.0% 1,701 0.0% 3,236 0.0% 16,397 0.1% 13,620 0.0% 422,610 1.4%British Airw ays, Ltd. PLC 87,535 0.3% 66,364 0.2% 67,278 0.2% 59,325 0.2% 59,119 0.2% 60,947 0.2% 58,042 0.2%Champion Air (Grand Holdings, Inc.) - 0.0% - 0.0% - 0.0% 22,875 0.1% 73,766 0.2% 52,217 0.2% 82,891 0.3%Comair Airlines 61,428 0.2% 89,056 0.3% 74,425 0.3% 61,181 0.2% 49,611 0.2% 41,642 0.1% 5,925 0.0%Continental Airlines 255,525 0.9% 226,231 0.8% 279,666 1.0% 329,772 1.1% 333,640 1.1% 394,138 1.3% 408,904 1.4%Delta Air Lines, Inc. 638,040 2.2% 553,793 2.0% 504,244 1.8% 530,982 1.8% 532,135 1.8% 624,142 2.1% 1,278,895 4.3%Executive Airlines 539,424 1.9% 420,292 1.5% 123,417 0.4% - 0.0% - 0.0% - 0.0% - 0.0%Express Jet 82,779 0.3% 108,068 0.4% 51,835 0.2% 81,713 0.3% 107,320 0.4% 64,794 0.2% - 0.0%Frontier Airlines 251,889 0.9% 194,586 0.7% 201,354 0.7% 210,903 0.7% 208,221 0.7% 200,048 0.7% 164,544 0.6%Korean Air Lines Co., Ltd. 45,217 0.2% 39,762 0.1% 41,707 0.1% 37,963 0.1% 35,290 0.1% 31,168 0.1% 35,648 0.1%Lufthansa German Airlines 64,926 0.2% 76,020 0.3% 72,786 0.3% 78,686 0.3% 81,177 0.3% 78,161 0.3% 73,795 0.2%Mesaba Airlines 159,765 0.6% 152,916 0.5% 136,240 0.5% 103,798 0.4% 12,117 0.0% - 0.0% 53,048 0.2%Midw est Express Airlines, Inc. - 0.0% 18,264 0.1% 64,723 0.2% 92,326 0.3% 85,635 0.3% 84,979 0.3% 74,122 0.3%Northw est Airlines - 0.0% 37,683 0.1% 181,482 0.6% 231,612 0.8% 350,588 1.2% 362,680 1.2% 413,913 1.4%Republic Airlines 67,038 0.2% 132,176 0.5% 103,087 0.4% 119,151 0.4% 98,682 0.3% 55,058 0.2% - 0.0%Skyw est Airlines 197,705 0.7% 184,624 0.7% 147,419 0.5% 120,510 0.4% 85,667 0.3% 20,160 0.1% 4,496 0.0%Sun Country Airlines, Inc. 76,100 0.3% 65,062 0.2% 60,553 0.2% 82,763 0.3% 83,595 0.3% 78,865 0.3% 75,958 0.3%United Airlines, Inc. 326,623 1.1% 310,073 1.1% 337,073 1.2% 435,736 1.5% 528,243 1.8% 594,518 2.0% 532,676 1.8%US Airw ays 850,247 2.9% 791,416 2.8% 692,297 2.5% 656,320 2.3% 320,142 1.1% 298,310 1.0% 369,828 1.3%Other 596,129 2.1% 393,618 1.4% 427,762 1.5% 500,018 1.7% 583,736 2.0% 610,872 2.0% 641,244 2.2%
Total 28,866,772 28,188,140 27,946,552 29,055,142 29,852,337 30,153,886 29,521,289
Source: Dallas/Fort Worth International Airport Finance Department* Only seven year history provided based on availability
1 Formerly know n as ValuJet Airlines
Enplaned Passengers
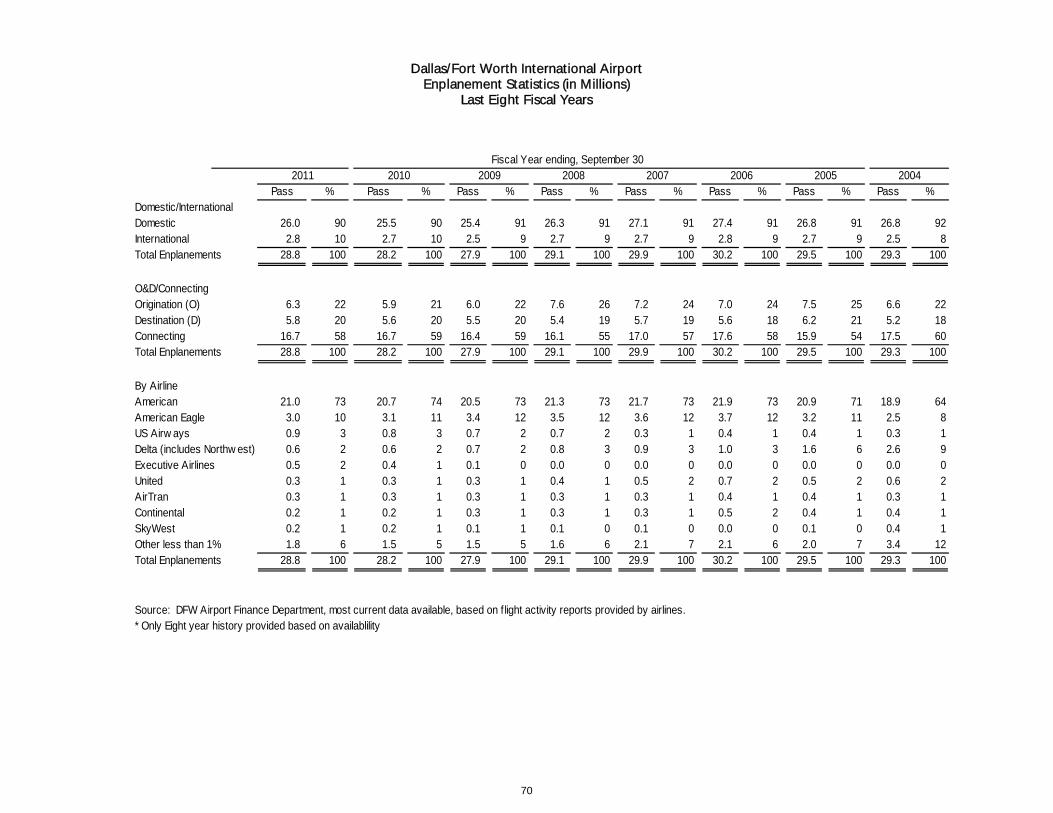
Dallas/Fort Worth International Airport Enplanement Statistics (in Millions)
Last Eight Fiscal Years
70
Pass % Pass % Pass % Pass % Pass % Pass % Pass % Pass %Domestic/International Domestic 26.0 90 25.5 90 25.4 91 26.3 91 27.1 91 27.4 91 26.8 91 26.8 92International 2.8 10 2.7 10 2.5 9 2.7 9 2.7 9 2.8 9 2.7 9 2.5 8Total Enplanements 28.8 100 28.2 100 27.9 100 29.1 100 29.9 100 30.2 100 29.5 100 29.3 100
O&D/Connecting Origination (O) 6.3 22 5.9 21 6.0 22 7.6 26 7.2 24 7.0 24 7.5 25 6.6 22Destination (D) 5.8 20 5.6 20 5.5 20 5.4 19 5.7 19 5.6 18 6.2 21 5.2 18Connecting 16.7 58 16.7 59 16.4 59 16.1 55 17.0 57 17.6 58 15.9 54 17.5 60Total Enplanements 28.8 100 28.2 100 27.9 100 29.1 100 29.9 100 30.2 100 29.5 100 29.3 100
By AirlineAmerican 21.0 73 20.7 74 20.5 73 21.3 73 21.7 73 21.9 73 20.9 71 18.9 64American Eagle 3.0 10 3.1 11 3.4 12 3.5 12 3.6 12 3.7 12 3.2 11 2.5 8US Airw ays 0.9 3 0.8 3 0.7 2 0.7 2 0.3 1 0.4 1 0.4 1 0.3 1Delta (includes Northw est) 0.6 2 0.6 2 0.7 2 0.8 3 0.9 3 1.0 3 1.6 6 2.6 9Executive Airlines 0.5 2 0.4 1 0.1 0 0.0 0 0.0 0 0.0 0 0.0 0 0.0 0United 0.3 1 0.3 1 0.3 1 0.4 1 0.5 2 0.7 2 0.5 2 0.6 2AirTran 0.3 1 0.3 1 0.3 1 0.3 1 0.3 1 0.4 1 0.4 1 0.3 1Continental 0.2 1 0.2 1 0.3 1 0.3 1 0.3 1 0.5 2 0.4 1 0.4 1SkyWest 0.2 1 0.2 1 0.1 1 0.1 0 0.1 0 0.0 0 0.1 0 0.4 1Other less than 1% 1.8 6 1.5 5 1.5 5 1.6 6 2.1 7 2.1 6 2.0 7 3.4 12Total Enplanements 28.8 100 28.2 100 27.9 100 29.1 100 29.9 100 30.2 100 29.5 100 29.3 100
Source: DFW Airport Finance Department, most current data available, based on f light activity reports provided by airlines.* Only Eight year history provided based on availablility
2006 2005 2004Fiscal Year ending, September 30
2011 2010 2009 2008 2007

Dallas/Fort Worth International Airport Landed Weights and Cargo Tonnage (in Millions of Pounds)
Last Eight Fiscal Years
71
Wgt. % Wgt. % Wgt. % Wgt. % Wgt. % Wgt. % Wgt. % Wgt. %By Carrier TypeDomestic Passenger Airlines 32.7 90 32.7 90 32.4 90 33.5 89 35.0 89 35.4 90 37.1 91 39.6 92International Pass. Airlines 0.6 2 0.6 2 0.7 2 0.7 2 0.6 1 0.6 1 0.5 1 0.5 1Cargo/Integrator Airlines 3.0 8 3.0 8 3.1 8 3.4 9 3.6 9 3.4 9 3.3 8 3.2 7Total Landed Weights 36.3 100 36.3 100 36.2 100 37.6 100 39.1 100 39.4 100 41.0 100 43.2 100
By Major AirlineAmerican 23.7 65 23.9 66 23.9 66 24.5 65 25.4 65 25.8 65 26.3 64 25.7 59American Eagle 3.5 10 3.8 11 4.1 11 4.2 11 4.2 11 4.3 11 3.9 10 3.1 7US Airw ays 0.9 3 0.9 2 0.8 2 0.8 2 0.4 1 0.4 1 0.5 1 0.4 1UPS 0.8 2 0.9 2 1.0 3 1.2 3 1.2 3 1.1 3 1.1 3 1.1 2Delta (includes Northw est) 0.8 2 0.7 2 0.8 2 0.9 2 1.1 3 1.2 3 2.2 5 3.6 8Executive Airlines 0.7 2 0.7 2 0.2 0 0.0 0 0.0 0 0.0 0 0.0 0 0.0 0Federal Express 0.5 1 0.5 1 0.5 1 0.6 2 0.7 2 0.6 2 0.7 2 0.7 2United 0.4 1 0.4 1 0.4 1 0.6 1 0.7 2 0.8 2 0.7 2 0.7 2AirTran 0.3 1 0.4 1 0.4 1 0.4 1 0.4 1 0.6 1 0.6 1 0.4 1Other 4.7 13 4.2 12 4.2 12 4.5 12 5.0 13 4.7 12 5.0 12 7.5 17Total Landed Weights 36.3 100 36.3 100 36.2 100 37.6 100 39.1 100 39.4 100 41.0 100 43.2 100
Cargo Tonnage 670 628 626 748 802 836 832 800
Source: DFW Finance Department, most current data available, based on f light activity reports provided by airlines.
2007Fiscal Year ending, September 30
2006 2005 20042011 2010 2009 2008

Dallas/Fort Worth International Airport Summary of Key Rental Cars and Operational Information (Unaudited)
Last Eight Fiscal Years
72
2011 2010 2009 2008 2007 2006 2005 2004
Transaction days (millions) 4.9 4.2 4.1 5.0 5.1 5.0 4.5 4.1
Rental car sales (millions) $236.3 $217.1 $217.5 $244.7 $245.4 $235.3 $200.6 $185.3
Income to DFW (millions) $27.7 $25.7 $25.7 $28.1 $28.4 $27.2 $19.9 $18.7
Income/destination passenger $2.37 $2.31 $2.31 $2.26 $2.30 $2.33 $1.76 $1.76
Avg. days/rental car contract 3.4 3.4 3.4 3.4 3.4 3.4 3.4 3.4
Source: DFW Finance and Concessions Departments, most current data available, from rental car companies self reporting.
* Only eight year history provided based on availablility
Fiscal Year Ending, September 30
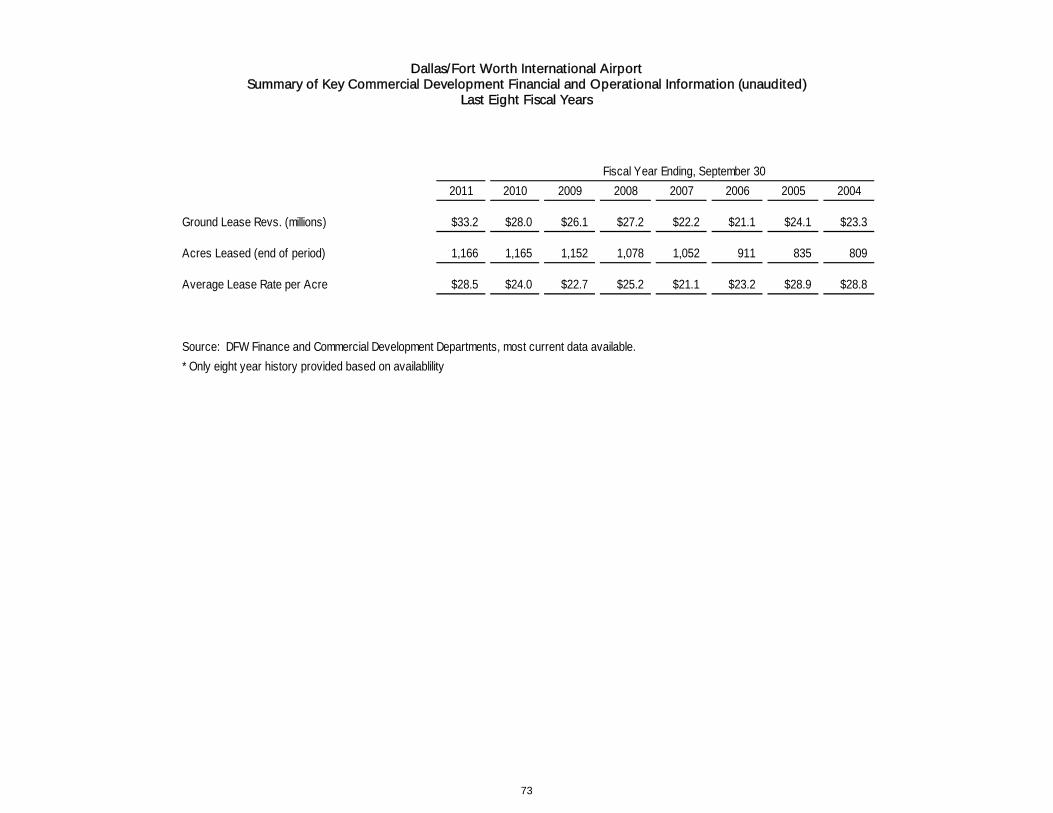
Dallas/Fort Worth International Airport Summary of Key Commercial Development Financial and Operational Information (unaudited)
Last Eight Fiscal Years
73
2011 2010 2009 2008 2007 2006 2005 2004
Ground Lease Revs. (millions) $33.2 $28.0 $26.1 $27.2 $22.2 $21.1 $24.1 $23.3
Acres Leased (end of period) 1,166 1,165 1,152 1,078 1,052 911 835 809
Average Lease Rate per Acre $28.5 $24.0 $22.7 $25.2 $21.1 $23.2 $28.9 $28.8
Source: DFW Finance and Commercial Development Departments, most current data available.
* Only eight year history provided based on availablility
Fiscal Year Ending, September 30

Dallas/Fort Worth International Airport Summary of Key Natural Gas Financial and Operational Information (unaudited)
Last Eight Fiscal Years
74
2011 2010 2009 2008 2007 2006 2005 2004
Revenues (millions)
Royalties $16.2 $23.8 $23.4 $35.1 $0.0 n/a n/a n/a
Surface use and other revenues 3.9 1.7 2.8 4.2 - n/a n/a n/a
Bonus n/a n/a n/a 92.6 92.6 n/a n/a n/a
Total Natural Gas Revenues $20.1 $25.5 $26.3 $131.9 $92.6 n/a n/a n/a
Operational Information
Wells in production 102 102 101 70 1 n/a n/a n/a
Production (MMcf) 12.5 23.2 24.7 17.3 1.0 n/a n/a n/a
Average price paid to DFW $3.8 $4.0 $3.6 $8.1 n/a n/a n/a n/a
Source: DFW Finance and Commercial Development Departments, most current data
available, production data from Chesapeake Energy.
* Only eight year history provided based on availablility
Fiscal Year Ending, September 30
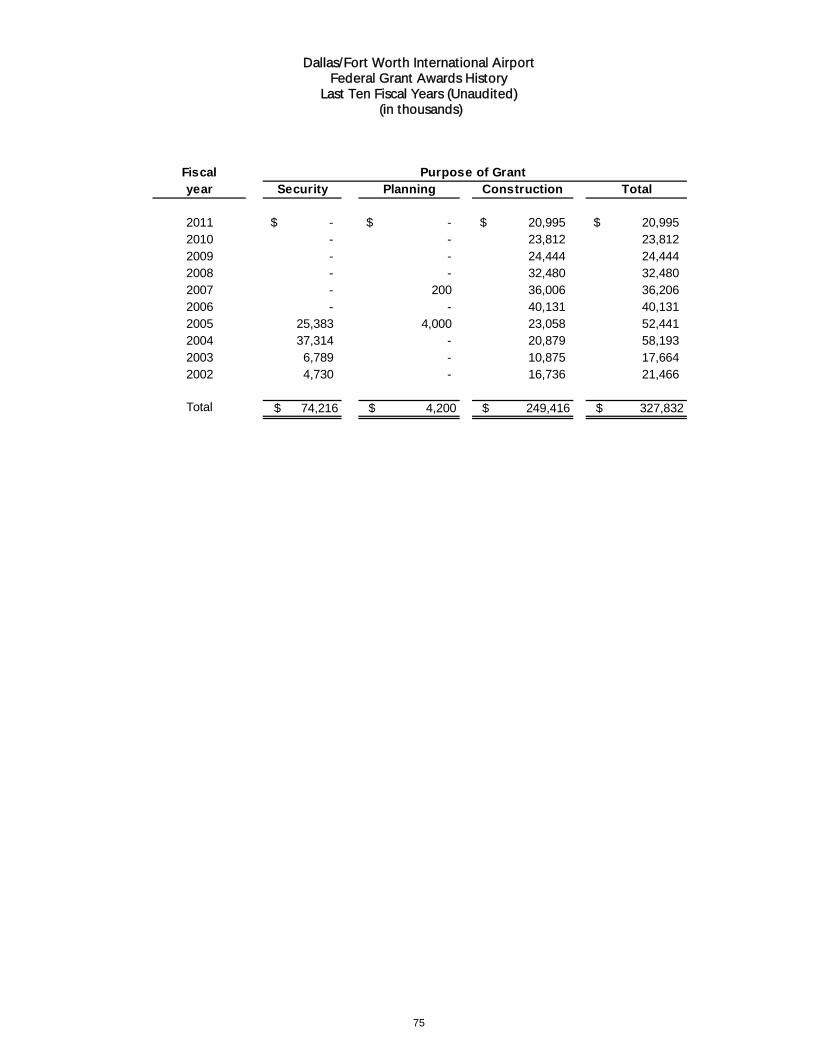
Dallas/Fort Worth International Airport Federal Grant Awards History
Last Ten Fiscal Years (Unaudited) (in thousands)
75
Fiscalyear Security Planning Construction Total
2011 -$ -$ 20,995$ 20,995$ 2010 - - 23,812 23,8122009 - - 24,444 24,4442008 - - 32,480 32,4802007 - 200 36,006 36,2062006 - - 40,131 40,1312005 25,383 4,000 23,058 52,4412004 37,314 - 20,879 58,1932003 6,789 - 10,875 17,6642002 4,730 - 16,736 21,466
Total $ 74,216 $ 4,200 $ 249,416 $ 327,832
Purpose of Grant
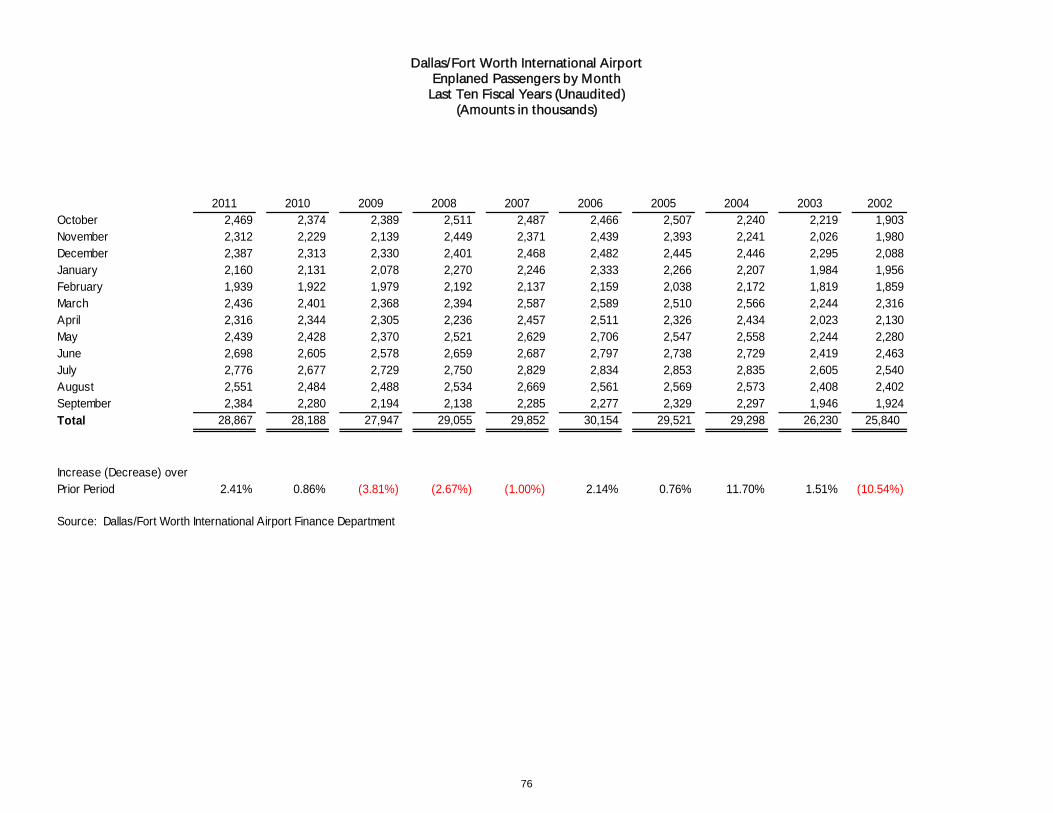
Dallas/Fort Worth International Airport Enplaned Passengers by Month
Last Ten Fiscal Years (Unaudited) (Amounts in thousands)
76
2011 2010 2009 2008 2007 2006 2005 2004 2003 2002October 2,469 2,374 2,389 2,511 2,487 2,466 2,507 2,240 2,219 1,903November 2,312 2,229 2,139 2,449 2,371 2,439 2,393 2,241 2,026 1,980December 2,387 2,313 2,330 2,401 2,468 2,482 2,445 2,446 2,295 2,088January 2,160 2,131 2,078 2,270 2,246 2,333 2,266 2,207 1,984 1,956February 1,939 1,922 1,979 2,192 2,137 2,159 2,038 2,172 1,819 1,859March 2,436 2,401 2,368 2,394 2,587 2,589 2,510 2,566 2,244 2,316April 2,316 2,344 2,305 2,236 2,457 2,511 2,326 2,434 2,023 2,130May 2,439 2,428 2,370 2,521 2,629 2,706 2,547 2,558 2,244 2,280June 2,698 2,605 2,578 2,659 2,687 2,797 2,738 2,729 2,419 2,463July 2,776 2,677 2,729 2,750 2,829 2,834 2,853 2,835 2,605 2,540August 2,551 2,484 2,488 2,534 2,669 2,561 2,569 2,573 2,408 2,402September 2,384 2,280 2,194 2,138 2,285 2,277 2,329 2,297 1,946 1,924
Total 28,867 28,188 27,947 29,055 29,852 30,154 29,521 29,298 26,230 25,840
Increase (Decrease) over Prior Period 2.41% 0.86% (3.81%) (2.67%) (1.00%) 2.14% 0.76% 11.70% 1.51% (10.54%)
Source: Dallas/Fort Worth International Airport Finance Department
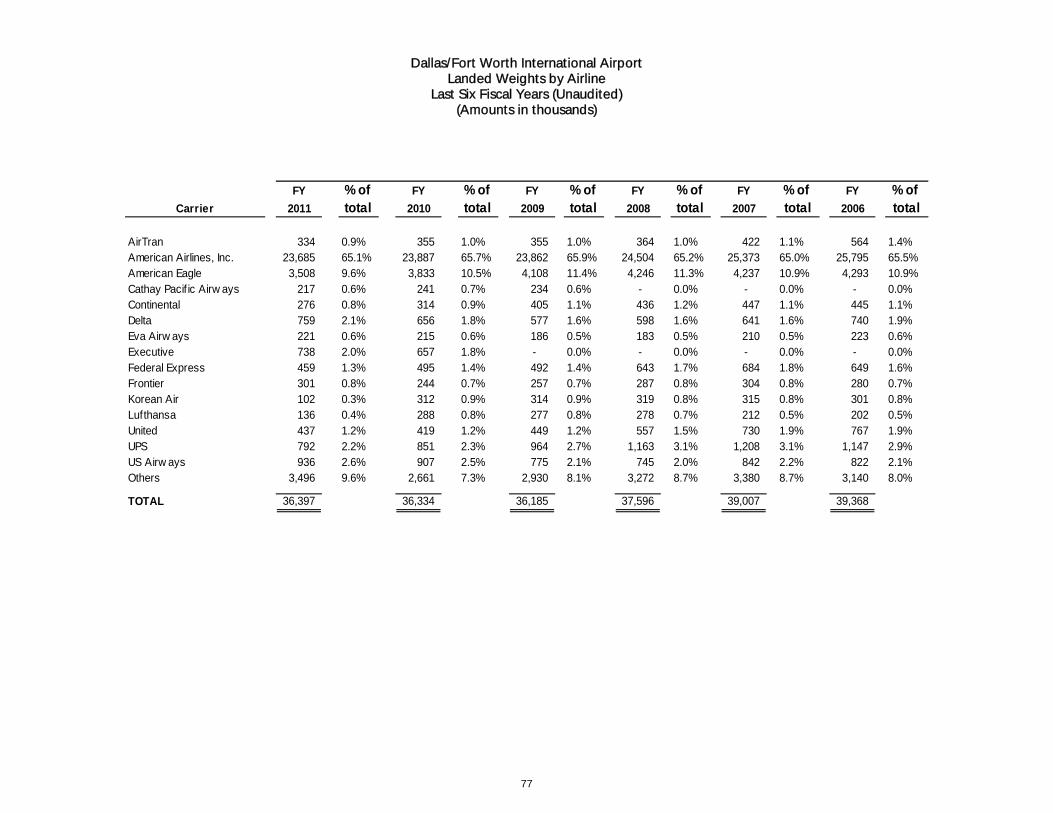
Dallas/Fort Worth International Airport Landed Weights by Airline
Last Six Fiscal Years (Unaudited) (Amounts in thousands)
77
FY % of FY % of FY % of FY % of FY % of FY % of
Carrier 2011 total 2010 total 2009 total 2008 total 2007 total 2006 total
AirTran 334 0.9% 355 1.0% 355 1.0% 364 1.0% 422 1.1% 564 1.4%American Airlines, Inc. 23,685 65.1% 23,887 65.7% 23,862 65.9% 24,504 65.2% 25,373 65.0% 25,795 65.5%American Eagle 3,508 9.6% 3,833 10.5% 4,108 11.4% 4,246 11.3% 4,237 10.9% 4,293 10.9%Cathay Pacif ic Airw ays 217 0.6% 241 0.7% 234 0.6% - 0.0% - 0.0% - 0.0%Continental 276 0.8% 314 0.9% 405 1.1% 436 1.2% 447 1.1% 445 1.1%Delta 759 2.1% 656 1.8% 577 1.6% 598 1.6% 641 1.6% 740 1.9%Eva Airw ays 221 0.6% 215 0.6% 186 0.5% 183 0.5% 210 0.5% 223 0.6%Executive 738 2.0% 657 1.8% - 0.0% - 0.0% - 0.0% - 0.0%Federal Express 459 1.3% 495 1.4% 492 1.4% 643 1.7% 684 1.8% 649 1.6%Frontier 301 0.8% 244 0.7% 257 0.7% 287 0.8% 304 0.8% 280 0.7%Korean Air 102 0.3% 312 0.9% 314 0.9% 319 0.8% 315 0.8% 301 0.8%Lufthansa 136 0.4% 288 0.8% 277 0.8% 278 0.7% 212 0.5% 202 0.5%United 437 1.2% 419 1.2% 449 1.2% 557 1.5% 730 1.9% 767 1.9%UPS 792 2.2% 851 2.3% 964 2.7% 1,163 3.1% 1,208 3.1% 1,147 2.9%US Airw ays 936 2.6% 907 2.5% 775 2.1% 745 2.0% 842 2.2% 822 2.1%Others 3,496 9.6% 2,661 7.3% 2,930 8.1% 3,272 8.7% 3,380 8.7% 3,140 8.0%
TOTAL 36,397 36,334 36,185 37,596 39,007 39,368

Dallas/Fort Worth International Airport Landed Weights by Month
Last Ten Fiscal Years (Unaudited) (Amounts in millions)
78
2011 2010 2009 2008 2007 2006 2005 2004 2003 2002October 3,101 3,076 3,132 3,361 3,218 3,263 3,440 3,640 3,452 3,464 November 2,963 2,942 2,902 3,213 3,218 3,263 3,440 3,640 3,452 3,464 December 3,106 3,058 3,076 3,223 2,904 2,937 2,985 3,422 3,011 3,105 January 3,000 2,995 2,962 3,146 3,342 3,319 3,397 3,728 3,497 3,543 February 2,633 2,653 2,716 2,925 3,188 3,186 3,259 3,562 3,287 3,510 March 3,134 3,094 3,022 3,022 3,363 3,437 3,643 3,786 3,466 3,690 April 2,937 2,986 2,947 2,963 3,262 3,357 3,449 3,626 3,368 3,623 May 2,961 3,064 3,033 3,165 3,393 3,401 3,560 3,699 3,553 3,770 June 3,121 3,076 3,023 3,115 3,423 3,455 3,547 3,677 3,507 3,747 July 3,204 3,182 3,194 3,245 3,177 3,198 3,246 3,389 3,334 3,496 August 3,202 3,200 3,164 3,226 3,348 3,315 3,558 3,540 3,724 3,412 September 3,035 3,008 3,014 2,992 3,171 3,237 3,437 3,460 3,406 3,236 Total 36,397 36,334 36,185 37,596 39,007 39,368 40,961 43,168 41,056 42,060
Increase (Decrease) over Prior Period 0.17% 0.41% (3.75%) (3.62%) (0.92%) (3.89%) (5.11%) 5.14% (2.39%) (9.73%)
Source: Dallas/Fort Worth International Airport Finance Department
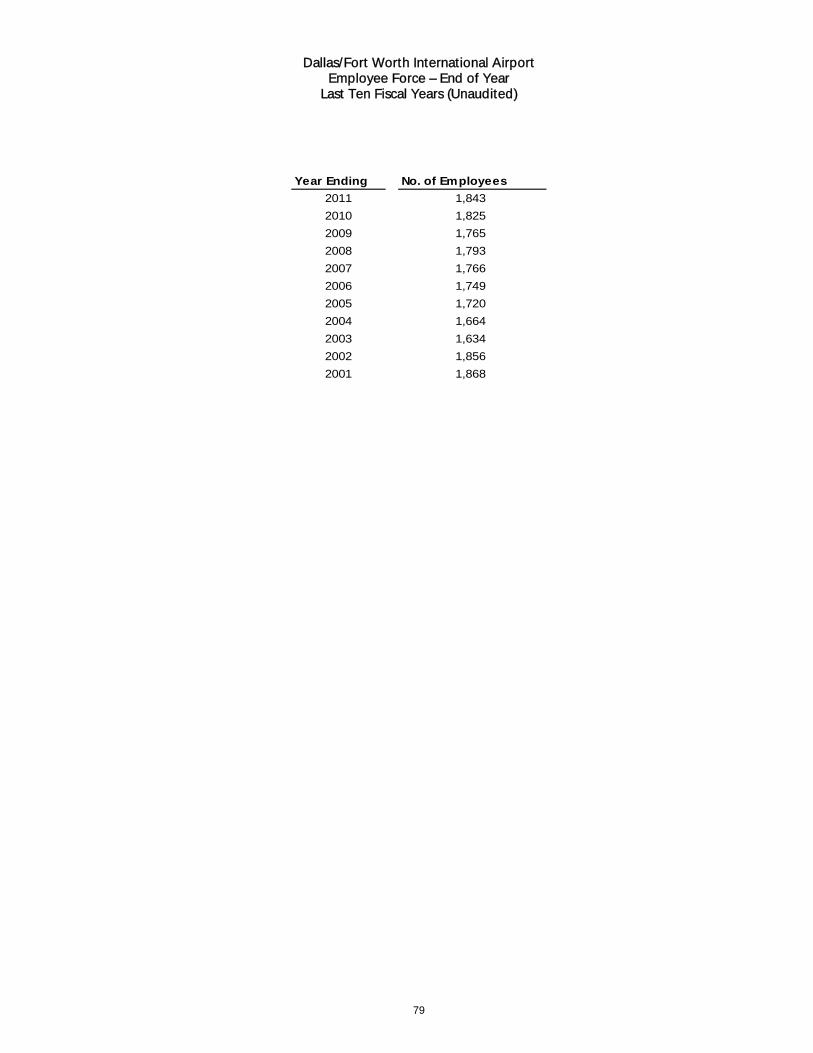
Dallas/Fort Worth International Airport Employee Force – End of Year
Last Ten Fiscal Years (Unaudited)
79
Year Ending No. of Employees
2011 1,843
2010 1,825
2009 1,765
2008 1,793
2007 1,766
2006 1,749
2005 1,720
2004 1,664
2003 1,634
2002 1,856
2001 1,868

Dallas/Fort Worth International Airport Capital Assets as a Function of Operations
Fiscal Year Ended September 30, 2011
80
Asset Type: Nature of Capital Asset:
Terminals Enplanements and Concessions
Grand Hyatt Hotel associated revenues
Ground and facilities buildings Tenant usage for various businesses
Utility operations Electrical, water, sewer and gas usage
Runways Aircraft Landings
Parking infrastructure Parking for airport passengers
Machinery and equipment System infrastructure and other equipment for maintaining the airport
Vehicles Transportation for police, fire, and maintenance activities
Balance Transfer and Balance
September 30, Completed September 30,Description 2010 Additions Projects Retirements 2011
Capital assets not being depreciated: Land 296,095$ -$ (197)$ 295,898$ Construction in progress 163,959 260,859 (177,711) 247,107
460,054 260,859 (177,711) (197) 543,005
Depreciable capital assets: Buildings 2,236,572 - 24,029 (6,643) 2,253,958 Improvements other than buildings 2,348,979 - 32,550 (4,114) 2,377,415 Machinery and equipment 870,142 - 111,655 (20,512) 961,285 Vehicles 156,932 9,477 (9,529) 156,880
5,612,625 - 177,711 (40,798) 5,749,538
Less accumulated depreciation for: Buildings (676,324) (94,108) - 3,809 (766,623) Improvements other than buildings (885,320) (71,854) - 1,232 (955,942) Machinery and equipment (359,041) (53,512) - 11,383 (401,169) Vehicles (66,158) (12,803) - 9,410 (69,551) Accumulated depreciation (1,986,842) (232,277) - 25,834 (2,193,285)
Depreciable capital assets, net 3,625,783 (232,277) 177,711 (14,964) 3,556,253 Total, net 4,085,837$ 28,582$ -$ (15,161)$ 4,099,258$
2011
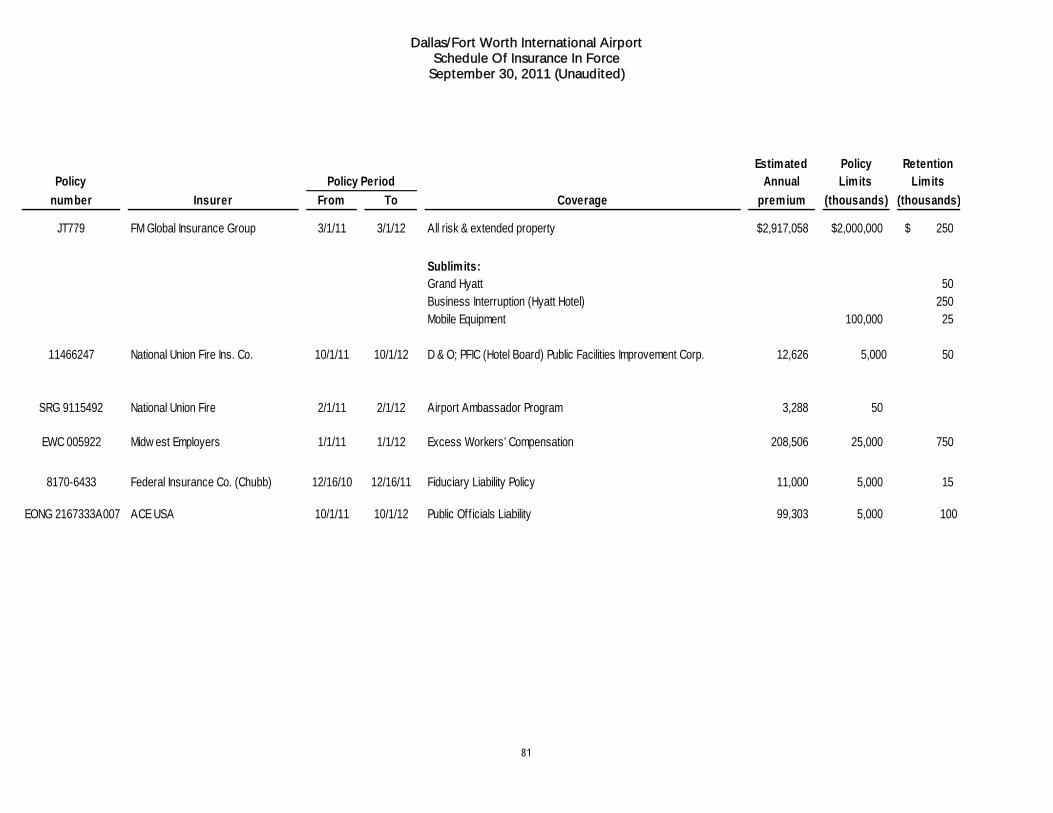
Dallas/Fort Worth International Airport
Schedule Of Insurance In Force September 30, 2011 (Unaudited)
81
PolicyEstimated
AnnualPolicy Limits
Retention Limits
number Insurer From To Coverage premium (thousands) (thousands)
JT779 FM Global Insurance Group 3/1/11 3/1/12 All risk & extended property 2,917,058$ 2,000,000$ 250$
Sublimits:Grand Hyatt 50 Business Interruption (Hyatt Hotel) 250 Mobile Equipment 100,000 25
11466247 National Union Fire Ins. Co. 10/1/11 10/1/12 D & O; PFIC (Hotel Board) Public Facilities Improvement Corp. 12,626 5,000 50
SRG 9115492 National Union Fire 2/1/11 2/1/12 Airport Ambassador Program 3,288 50
EWC 005922 Midw est Employers 1/1/11 1/1/12 Excess Workers’ Compensation 208,506 25,000 750
8170-6433 Federal Insurance Co. (Chubb) 12/16/10 12/16/11 Fiduciary Liability Policy 11,000 5,000 15
EONG 2167333A007 ACE USA 10/1/11 10/1/12 Public Off icials Liability 99,303 5,000 100
Policy Period
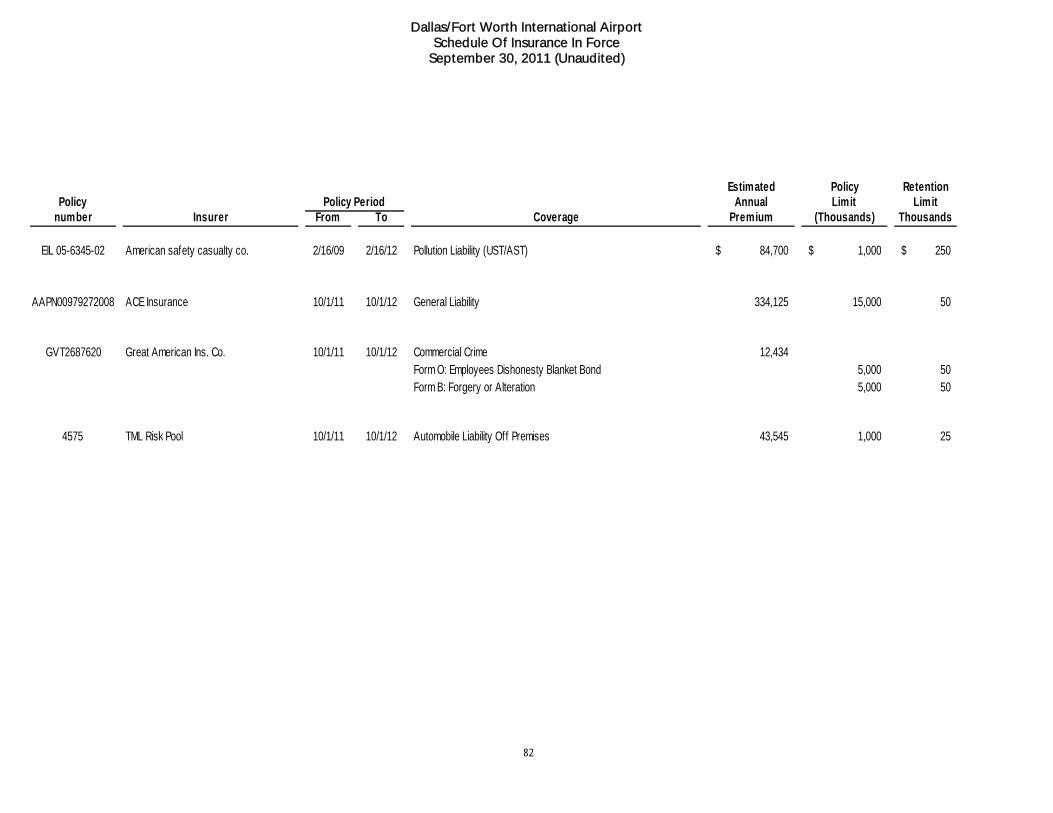
Dallas/Fort Worth International Airport Schedule Of Insurance In Force
September 30, 2011 (Unaudited)
82
Estimated Policy RetentionPolicy Annual Limit Limit
number Insurer From To Coverage Premium (Thousands) Thousands
EIL 05-6345-02 American safety casualty co. 2/16/09 2/16/12 Pollution Liability (UST/AST) 84,700$ 1,000$ 250$
AAPN00979272008 ACE Insurance 10/1/11 10/1/12 General Liability 334,125 15,000 50
GVT2687620 Great American Ins. Co. 10/1/11 10/1/12 Commercial Crime 12,434 Form O: Employees Dishonesty Blanket Bond 5,000 50 Form B: Forgery or Alteration 5,000 50
4575 TML Risk Pool 10/1/11 10/1/12 Automobile Liability Off Premises 43,545 1,000 25
Policy Period


![Airport Surface Operation Collaborative Automation Concept · important factor affecting airport operations, the Dallas – Fort Worth (DFW) Airport Development Plan [10] includes](https://img.dokumen.tips/doc/110x75/5f77025e5092e0635c33d742/airport-surface-operation-collaborative-automation-important-factor-affecting-airport.jpg)