Embed Size (px)
Citation preview

COMPREHENSIVE ANNUAL FINANCIAL REPORT YEARS ENDED JUNE 30, 2014 AND 2013
SERVING
CHARLOTTESVILLE & ALBEMARLE COUNTY, VIRGINIA


RIVANNA WATER & SEWER AUTHORITY
CHARLOTTESVILLE, VIRGINIA
COMPREHENSIVE ANNUAL FINANCIAL REPORT
YEARS ENDED JUNE 30, 2014 AND 2013
Prepared By:
Department of Finance and Administration


RIVANNA WATER & SEWER AUTHORITY
Comprehensive Annual Financial Report
Fiscal Years Ended June 30, 2014 and 2013
Table of Contents
Page INTRODUCTORY SECTION
Authority Officials 1
Letter of Transmittal 3-6
Certificate of Achievement 7
Organizational Chart 9
FINANCIAL SECTION
Independent Auditors’ Report 11-12 Management’s Discussion and Analysis 13-22 Basic Financial Statements Exhibit 1 Statement of Net Position 24-25 Exhibit 2 Statement of Revenues, Expenses, and Changes in Net Position 26 Exhibit 3 Statement of Cash Flows 27 Notes to the Financial Statements 29-60 Required Supplementary Information Schedule of Pension Funding Progress 63 Schedule of OPEB Funding Progress 64

RIVANNA WATER & SEWER AUTHORITY
Comprehensive Annual Financial Report
Fiscal Years Ended June 30, 2014 and 2013
Table of Contents
Page
STATISTICAL SECTION
Table 1 Net Position by Component 67
Table 2 Changes in Net Position 68
Table 3 Revenues by Source 69
Table 4 Water and Wastewater Rates and Flows 70
Table 5 Ten Largest Customers 71
Table 6 Expenses by Type 72
Table 7 Outstanding Debt by Type 73
Table 8 Revenue Bond Debt Service Coverage 74
Table 9 Demographic Data for the Service Area 75
Table 10 Principal Employers in the Charlottesville Area 76
Table 11 Number of Employees by Identifiable Activity 77
Table 12 Operating and Capital Indicators 78
Table 13 Schedule of Insurance in Force 79
Table 14 Miscellaneous Statistical Data-Albemarle County Service Authority 80
Table 15 Miscellaneous Statistical Data-City of Charlottesville 81
COMPLIANCE SECTION
Independent Auditors’ Report on Internal Control over Financial Reporting and on Compliance and Other Matters Based on an Audit of Financial Statements Performed in Accordance with Government Auditing Standards
83-84
Independent Auditors’ Report on Compliance for Each Major Program and on Internal Control over Compliance Required by OMB Circular A-133
85-86
Schedule of Expenditures of Federal Awards 87
Notes to Schedule of Expenditures of Federal Awards 88
Schedule of Findings and Questioned Costs 89

BOARD MEMBERS
Michael A. Gaffney, Chairman
Maurice Jones, Vice-Chairman
Thomas Foley, Secretary/Treasurer
Judith M. Mueller
Kenneth C. Boyd
Kathleen Galvin
Gary B. O’Connell
EXECUTIVE DIRECTOR
Thomas L. Frederick, Jr., P.E.
DIRECTOR OF FINANCE/ADMINISTRATION
Lonzy E. Wood, III, CPA
GENERAL COUNSEL
McGuire Woods, LLP Charlottesville, Virginia
TRUSTEE AND ESCROW AGENT
Bank of New York Mellon New York, New York
1


695 MOORES CREEK LANE CHARLOTTESVILLE, VA 22902-9016
TEL: 434.977.2970 FAX: 434.293.8858
WWW.RIVANNA.ORG
October 6, 2014 To the Board of Directors Rivanna Water and Sewer Authority Charlottesville, Virginia The Comprehensive Annual Financial Report (CAFR) of the Rivanna Water and Sewer Authority (Authority) for the fiscal year ended June 30, 2014 is submitted herewith. This report has been prepared in conformity with the reporting and accounting standards promulgated by the Government Accounting Standards Board and the Financial Accounting Standards Board and with the accounting and reporting standards for enterprise funds set out by the Government Finance Officers Association of the United States and Canada, with such modifications as apply to our status as an independently chartered corporation. Based upon a comprehensive framework of internal control that it has established for this purpose, management assumes responsibility for the completeness and reliability of the information contained in this report. The objective of internal control is to provide reasonable, rather than absolute, assurance that the financial statements are free of material misstatements, because the cost of each internal control should not outweigh the potential benefit. Management’s discussion and analysis (MD&A) immediately follows the independent auditors’ report and provides a narrative introduction, overview, and analysis of the basic financial statements. MD&A complements this letter of transmittal and should be read in conjunction with it. ORGANIZATION AND SERVICES PROVIDED The Rivanna Water and Sewer Authority is a regional non-profit public corporation and political subdivision of the Commonwealth of Virginia chartered in 1972 under the Virginia Water and Waste Authorities Act (1950, as amended), that supplies drinking water to and treats the sewage of Charlottesville (City) and certain areas of Albemarle County (County). The Authority is a wholesale agency and bills monthly both Charlottesville and the Albemarle County Service Authority, which handle retail distribution of water and collection of sewage in their respective service areas. The Authority is charged to acquire, finance, construct, operate and maintain facilities for the impoundment, production, storage, treatment and transmission of potable water and for the interception, treatment and discharge of wastewater. The Authority operates under the terms of a Service Agreement signed June 12, 1973 by the officers of the Charlottesville City Council, the Albemarle County Board of Supervisors, the Albemarle County Service Authority and the Rivanna Water and Sewer Authority. The Authority has determined that it is not part of the reporting entity of either the City of Charlottesville or the County of Albemarle and will not be included in the financial report of either (see Note 1 to the Financial Statements).
3

ORGANIZATION AND SERVICES PROVIDED: (CONTINUED) The Authority is governed by a seven member Board of Directors (Board). The Board appoints an Executive Director, who manages Authority operations under their direction. The Authority is now organized in administration, laboratory, engineering, maintenance, water, and wastewater departments. The Authority operates and maintains five water treatment plants and three wastewater treatment plants and the associated water storage facilities, pump stations, transmission mains and interceptor sewers, as well as a hydropower generating facility. Retail distribution of water and collection of wastewater is performed by the Authority's two customers: the City of Charlottesville's Public Utilities Division and the Albemarle County Service Authority. JOINT ADMINISTRATION By mutual agreement of the respective Boards of Directors, the Authority currently shares administrative staff and office space with the Rivanna Solid Waste Authority, which is billed monthly for its portion of the costs. Administrative procedures were implemented to ensure proper segregation of funds, purchasing activity, personnel, and similar matters. In general, the Rivanna Solid Waste Authority adopted existing Authority administrative policies, procedures and regulations for its own use. The Authorities have also agreed to adopt and administer joint Safety Regulations and a joint Safety Program. ECONOMIC CONDITION AND PROSPECTS The University of Virginia provides a significant buffer against large swings in the economy of our service area. In addition, the Charlottesville urban area is a major retail trade center for the surrounding region. Housing growth remains steady. Although the majority of such growth occurs in County developments, in-filling in Charlottesville continues. Both Charlottesville and Albemarle County enjoy low unemployment rates, steady economic growth and high bond ratings. A recent ten-year compilation analysis report dated August 2014 by the Charlottesville Area Chamber of Commerce examining employment in the Greater Charlottesville Region showed total jobs grew from 101,907 in 2002 to 114,911 in 2013, an increase of 12.7%. This growth occurred despite the national recession during this time period and, in particular, two years of job declines of -622 in 2008 and -3,440 in 2009 and no growth or loss in 2010. The report describes some concerns that the overall growth rate for 2013 was slightly less than the 2012, but there was three straight years of job growth in the region. The report noted that non-governmental private enterprise jobs growth of 13.1% significantly outperformed job growth for the Commonwealth which was 5.6%. The Charlottesville-Albemarle area attracts many visitors to its historic sites and the wine industry has been popular and has served to help benefit the tourism sector of the regional economy. The travel and tourism industry make a vital contribution to the local economy. The University of Virginia has begun several large capital projects that will continue to be the impetus of growth for water and sewer services. Our current Capital Improvement Program, as discussed below, reflects the Authority's response to the current and projected service burden on our facilities and to the need to respond to regulatory requirements.
4

LONG-TERM FINANCIAL PLANNING The Authority expects continued growth in demand for water supply and sewage disposal services as well as the ever changing regulatory environment. Our current five-year Capital Improvement Program (CIP) for Fiscal years 2014-2018 is heavily driven by regulatory changes in the future for water quality standards in particular meeting the requirements of the Disinfectant By-product Rule (DPBR). This rule regulates maximum contaminant level for total trihalomethanes (THMs) and haloacetic acids (HAAs) in drinking water. The long-term goal is to finance the majority of these projects with revenue bonds; however, the Authority has targeted using a significant portion of cash reserves to fund its current $152 million CIP. For details, please refer to the MD&A. MAJOR INITIATIVES Several capital projects were completed in FY 2014, including most of the Meadowcreek Interceptor Improvements, Mitigation Plan Implementation, and Stillhouse Pump Station. Continued construction of the Rivanna Pump Station and Tunnel over the next 5 years is currently the largest capital project in the wastewater system. This project is anticipated to cost $33 million. For the water system, construction was completed in September 2014 on the much anticipated new Ragged Mountain Dam that will replace two older 1888 and 1901 upper and lower Ragged Mountain Dams. The dams were found to have safety deficiencies and were in need of capital investment to correct. This project is also the result of a 10 plus year community water supply process that identified all possible alternatives with the Ragged Mountain Dam being the selected alternative requiring numerous federal and state permitting efforts. This project essentially takes care of two separate and significant capital investment needs. As mentioned previously, The DPBR regulations are requiring the water plants to undergo major capital upgrades to install Granular Activated Carbon treatment systems. These systems carry significant capital costs as well as significant operating costs in the future. ACCOUNTING AND BUDGETARY CONTROLS The Authority's accounting records are maintained on the accrual basis of accounting. Under this method, revenues are recognized when earned and expenses are recorded when incurred, without regard to receipt or payment of cash. Current controls provide reasonable assurance that the Authority's assets are properly recorded and protected and that the financial data may be used with confidence in the preparation of historical reports and projections. Accounting control is maintained by segregation of duties and data security systems in all areas of record keeping, disbursements, and purchasing authority. All of these control systems are reviewed regularly by staff and are evaluated as part of the annual financial audit (see Annual Audit section below). The Authority is required by the Service Agreement to adopt an annual budget for setting wholesale rates as well as for fiscal guidance to staff. Separate fiscal year budgets are currently prepared for six rate centers to include direct costs and allocations of administrative, engineering, maintenance, lab and debt service expenses. Projections of flows and expenses are used to calculate rates per thousand gallons for the two Urban rate centers and flat monthly charges for the other rate centers. A proposed budget for each fiscal year is prepared by the Authority Directors and the Executive Director and submitted to the Board of Directors, usually in February, with a public hearing held on the proposed rates in April or May. All budget items lapse at the end of the fiscal year, with the exception of encumbrances and capital commitments. It should be noted that the budget is prepared for internal use and does not reflect the accrual basis of accounting. An example of this is that principal payments on debt are shown as an expense.
5

Budgetary compliance is monitored and reported to the Board by the Director of Finance & Administration and the Executive Director. Projections of both revenues and expenses are understood to reflect anticipated service levels and to incorporate a variety of economic, climatic, and demographic forecasts. Variances from budget line items are examined at least monthly to assure a reasonable relation between actual costs and actual service levels, emergencies, or economic conditions. ANNUAL AUDIT The Code of Virginia, the June 12, 1973 Service Agreement, the Trust Agreement and its Supplements require an annual audit of the books and records of the Authority. The opinion of our independent certified public accountants is included in the Financial Section. AWARDS The Government Finance Officers Association of the United States and Canada (GFOA) awarded a Certificate of Achievement for Excellence in Financial Reporting to Rivanna Water and Sewer Authority for its comprehensive annual financial report for the fiscal year ended June 30, 2013. In order to be awarded a Certificate of Achievement, a governmental unit must publish an easily readable and efficiently organized comprehensive annual financial report. This report must satisfy both generally accepted accounting principles and applicable legal requirements. A Certificate of Achievement is valid for a period of one year only. We believe that our current comprehensive annual financial report continues to meet the Certificate of Achievement Program’s requirements and we are submitting it to the GFOA to determine its eligibility for another certificate. ACKNOWLEDGEMENTS The help of the Authority’s staff and of our certified public accountants is gratefully acknowledged. Such help and the Board of Directors’ support and commitment to financial reporting excellence are essential to the preparation of this report. Respectfully submitted, Lonzy E. Wood, III Director of Finance and Administration
6

7

This page intentionally left blank

9

This page intentionally left blank

ROBINSON, FARMER, COX ASSOCIATES
CERTIFIED PUBLIC ACCOUNTANTS A PROFESSIONAL LIMITED LIABILITY COMPANY
Independent Auditors’ Report
To the Board of Directors Rivanna Water & Sewer Authority Charlottesville, Virginia Report on the Financial Statements We have audited the accompanying financial statements of the business-type activities of Rivanna Water & Sewer Authority as of and for the years ended June 30, 2014 and 2013, and the related notes to the financial statements, which collectively comprise the Authority’s basic financial statements, as listed in the table of contents. Management’s Responsibility for the Financial Statements Management is responsible for the preparation and fair presentation of these financial statements in accordance with accounting principles generally accepted in the United States of America; this includes the design, implementation, and maintenance of internal control relevant to the preparation and fair presentation of financial statements that are free from material misstatement, whether due to fraud or error. Auditors’ Responsibility Our responsibility is to express an opinion on these financial statements based on our audits. We conducted our audits in accordance with auditing standards generally accepted in the United States of America; the standards applicable to financial audits contained in Government Auditing Standards, issued by the Comptroller General of the United States; and the Specifications for Audits of Authorities, Boards, and Commissions, issued by the Auditor of Public Accounts of the Commonwealth of Virginia. Those standards require that we plan and perform the audit to obtain reasonable assurance about whether the financial statements are free from material misstatement. An audit involves performing procedures to obtain audit evidence about the amounts and disclosures in the financial statements. The procedures selected depend on the auditors’ judgment, including the assessment of the risks of material misstatement of the financial statements, whether due to fraud or error. In making those risk assessments, the auditor considers internal control relevant to the entity’s preparation and fair presentation of the financial statements in order to design audit procedures that are appropriate in the circumstances, but not for the purpose of expressing an opinion on the effectiveness of the entity’s internal control. Accordingly, we express no such opinion. An audit also includes evaluating the appropriateness of accounting policies used and the reasonableness of significant accounting estimates made by management, as well as evaluating the overall presentation of the financial statements. We believe that the audit evidence we have obtained is sufficient and appropriate to provide a basis for our audit opinion. Opinion In our opinion, the financial statements referred to above present fairly, in all material respects, the respective financial position of the business-type activities of Rivanna Water & Sewer Authority, as of June 30, 2014 and 2013, and the respective changes in financial position, and cash flows thereof for the years then ended in accordance with accounting principles generally accepted in the United States of America.
11

Other Matters
Required Supplementary Information
Accounting principles generally accepted in the United States of America require that the management’s discussion and analysis and schedules of pension and OPEB funding progress on pages 13-22 and 63-64 be presented to supplement the basic financial statements. Such information, although not a part of the basic financial statements, is required by the Governmental Accounting Standards Board, who considers it to be an essential part of financial reporting for placing the basic financial statements in an appropriate operational, economic, or historical context. We have applied certain limited procedures to the required supplementary information in accordance with auditing standards generally accepted in the United States of America, which consisted of inquiries of management about the methods of preparing the information and comparing the information for consistency with management’s responses to our inquiries, the basic financial statements, and other knowledge we obtained during our audit of the basic financial statements. We do not express an opinion or provide any assurance on the information because the limited procedures do not provide us with sufficient evidence to express an opinion or provide any assurance.
Other Information
Our audit was conducted for the purpose of forming an opinion on the financial statements that collectively comprise the Rivanna Water & Sewer Authority’s basic financial statements. The introductory and statistical sections are presented for purposes of additional analysis and are not a required part of the basic financial statements. The schedule of expenditures of federal awards is presented for purposes of additional analysis as required by U.S. Office of Management and Budget Circular A-133, Audits of States, Local Governments, and Non-Profit Organizations, and is also not a required part of the basic financial statements.
The schedule of expenditures of federal awards is the responsibility of management and was derived from and relates directly to the underlying accounting and other records used to prepare the basic financial statements. Such information has been subjected to the auditing procedures applied in the audit of the basic financial statements and certain additional procedures, including comparing and reconciling such information directly to the underlying accounting and other records used to prepare the basic financial statements or to the basic financial statements themselves, and other additional procedures in accordance with auditing standards generally accepted in the United States of America. In our opinion, the schedule of expenditures of federal awards is fairly stated in all material respects in relation to the basic financial statements as a whole.
The introductory and statistical sections have not been subjected to the auditing procedures applied in the audit of the basis financial statements and, accordingly, we do not express an opinion or provide any assurance on them.
Other Reporting Required by Government Auditing Standards
In accordance with Government Auditing Standards, we have also issued our report dated October 6, 2014, on our consideration of Rivanna Water & Sewer Authority’s internal control over financial reporting and on our tests of its compliance with certain provisions of laws, regulations, contracts, and grant agreements and other matters. The purpose of that report is to describe the scope of our testing of internal control over financial reporting and compliance and the results of that testing, and not to provide an opinion on internal control over financial reporting or on compliance. That report is an integral part of an audit performed in accordance with Government Auditing Standards in considering Rivanna Water & Sewer Authority’s internal control over financial reporting and compliance.
Charlottesville, Virginia October 6, 2014
12

Management's Discussion and Analysis To the Board of Directors Rivanna Water & Sewer Authority Charlottesville, Virginia As management of the Rivanna Water & Sewer Authority (the Authority), we offer readers of our financial statements this narrative overview and analysis of the financial activities of the Authority for the fiscal year ended June 30, 2014. We encourage readers to consider the information presented here in conjunction with additional information that we have furnished in our letter of transmittal, which can be found on pages 3 through 6 of this report. Overview of the Financial Statements This discussion and analysis is intended to serve as an introduction to the Authority's basic financial statements. Since the Authority is engaged only in business-type activities, its basic financial statements are comprised of only two components: 1) enterprise fund financial statements and 2) notes to the financial statements. This report also contains required supplementary information in addition to the basic financial statements themselves. Enterprise fund financial statements. The enterprise fund financial statements are designed to provide readers with a broad overview of the Authority's finances, in a manner similar to a private-sector business. The statement of net position presents information on the Authority's assets, deferred outflows of resources, and liabilities, with the difference reported as net position. Over time, increases or decreases in net position may serve as a useful indicator of whether the financial position of the Authority is improving or deteriorating. The statement of revenues, expenses, and changes in net position presents information showing how the Authority's net position changed during the most recent fiscal year. All changes in net position are reported as soon as the underlying event giving rise to the change occurs, regardless of the timing of the cash flows. Thus, revenues and expenses are reported in this statement for some items that will only result in cash flows in future fiscal periods (e.g. earned but unused vacation leave). The basic enterprise fund financial statements can be found on pages 24 through 27 of this report. Notes to the financial statements. The notes provide additional information that is essential to a full understanding of the data provided in the financial statements. The notes to the financial statements can be found on pages 29 through 60 of this report. Required supplementary information. This report also includes required supplementary information concerning the Authority's progress in funding its obligation to provide pension and other postemployment benefits to its employees. It is located immediately following the notes to financial statements.
13

Financial Highlights
− The assets and deferred outflows of resources of Rivanna Water & Sewer Authority exceeded its liabilities at the close of the most recent fiscal year by $129 million (net position). Of this amount $32 million (unrestricted net position) may be used to meet the Authority's normal ongoing operating obligations to customers and creditors while $3 million of net position are restricted for the bondholders.
− The Authority’s total net position increased by $7 million in FY 2014 and by $8 million in FY 2013, which is an indication of improvement in financial position.
− The Authority's total assets increased 10 to15% during each of the past two fiscal years, primarily due to investment in capital assets. Several large capital projects have been completed and many more are in progress.
− Total liabilities decreased by $2 million this year after increasing by $25 million in FY 2013. While new debt was issued in both years to finance capital projects, proceeds were $24 million lower this year and principal repayments exceeded proceeds.
− Wastewater revenues increased 5% this year and 8% last year primarily due to heavy wastewater flows.
− Capital grants revenue decreased by $3 million since FY 2012 due to the completion of a grant-funded project.
− Depreciation expense went up 29% this year and 21% last year due to completion of capital projects and equipment purchases, while other operating expenses have remained relatively steady.
Financial Analysis The largest portion of Rivanna Water and Sewer Authority's net position (73 percent) reflects its investment in capital assets, net of related debt outstanding that was used to acquire those assets. The Authority uses these capital assets to provide services to its customers; consequently, these assets are not available for future spending. Although the Authority's investment in capital assets is reported net of related debt, the resources needed to repay this debt are derived from the revenue generating capability of these capital assets and not from the capital assets themselves. At the end of the past three fiscal years, the Authority has reported positive balances in all categories of net position.
Net Position2014 2013 2012
Current and other assets $ 54,979,836 $ 67,129,844 $ 59,075,088 Capital assets 205,376,290 186,591,006 162,004,351
Total assets $ 260,356,126 $ 253,720,850 $ 221,079,439
Deferred outflow of resources $ 1,020,521 $ 1,084,278 $ 1,173,464
Noncurrent liabilities $ 121,346,381 $ 123,544,610 $ 100,185,703 Current liabilities 11,231,897 9,665,346 8,273,620
Total liabilities $ 132,578,278 $ 133,209,956 $ 108,459,323
Net position:Net investment in capital assets $ 93,538,673 $ 87,302,949 $ 86,135,840 Restricted for bond covenants 2,870,788 2,782,090 3,173,804 Unrestricted 32,388,908 31,510,133 24,483,936
Total net position $ 128,798,369 $ 121,595,172 $ 113,793,580
14

Financial Analysis: (Continued) Operating revenues increased $0.4 million in FY 2014 due to high wastewater flows. There was a $1.8 million increase in FY 2013 as a result of increased rates and high wastewater flows. No grant revenues were received this year after decreasing by $2.8 million in the prior year due to the FY 2013 completion of the Moores Creek Enhanced Nutrient Removal (ENR) project which was partially funded with a Water Quality Improvement Fund state grant. Total operating expenses increased by $1.4 million this year and $.8 million in the prior year primarily due to increased depreciation. It should be noted that $1.9 million of interest payments were capitalized to the unfinished projects this year as a cost of acquisition and $1.8 million in the prior year, which reduced interest expense for both years. Key elements of these changes are explained further in the Review of Operations section.
Changes in Net Position2014 2013 2012
Revenues:Operating revenues
Metered water sales $ 11,353,630 $ 11,728,840 $ 11,058,083 Wastewater service charges 14,620,353 13,889,105 12,807,628
Nonoperating revenuesInvestment earnings 92,839 157,526 124,832 Buck Mountain revenue 89,000 78,000 68,200 Administrative reimbursement 257,000 257,000 276,000 Other revenues 251,373 225,034 214,908
Capital grants - 226,265 3,003,552 Total revenues $ 26,664,195 $ 26,561,770 $ 27,553,203
Expenses:Operating expenses
Personnel costs $ 5,756,273 $ 5,928,994 $ 5,879,080 Professional services 418,858 282,427 336,166 Other services and charges 2,683,136 2,430,718 2,463,176 Operations and maintenance 3,543,311 3,383,574 3,201,971 Depreciation expense 4,662,094 3,601,730 2,965,612
Nonoperating expensesInterest expense 2,336,245 2,552,331 1,830,696 Debt issuance costs 61,081 580,404 - Total expenses $ 19,460,998 $ 18,760,178 $ 16,676,701
Change in net position $ 7,203,197 $ 7,801,592 $ 10,876,502 Net position, beginning of year 121,595,172 113,793,580 103,866,908 Adjustment - - (949,830) Net position, end of year $ 128,798,369 $ 121,595,172 $ 113,793,580
The Authority implemented GASB Statement No. 63 and 65 effective July 1, 2011 and restated net position by $949,830 accordingly.
15

Capital Asset and Debt Administration:
Capital Assets - The Authority's investment in capital assets net of accumulated depreciation increased 10% in the current year and 15% in the prior year as a result of costs incurred on major water and wastewater construction projects in both years. $23 million of construction costs were incurred this year and $28 million last year. $25 million of costs were capitalized as completed capital projects this year and $69 million in the prior year. There are still many capital projects in progress with accumulated costs totaling $51 million. More detailed information on the Authority’s capital assets is presented in Notes 5 and 6 of the notes to the financial statements and is addressed further under the operations discussion below.
The various categories of capital assets net of depreciation at the end of the past three fiscal years are as follows:
2014 2013 2012Land and improvements $ 10,557,573 $ 7,740,670 $ 7,740,670 Buildings and operating equipment 143,703,996 126,125,667 60,803,055 Trucks and autos 52,200 70,467 125,652 Office equipment 9,009 4,396 13,187 Construction work in progress 51,053,512 52,649,806 93,321,788
Total capital assets, net $ 205,376,290 $ 186,591,006 $ 162,004,352
Long-Term Debt - At the end of the current fiscal year, the Authority had $126 million in bonds outstanding versus $128 million last year, a $2 million decrease. This change is the net of principal repayments of $5 million and proceeds of $3 million. $29 million Revenue Bond Series 2014A was issued in March to help fund the Rivanna Interceptor and Pump Station projects. This bond is a Virginia Revolving Loan Fund debt instrument which is like a construction loan where the proceeds stay with the State until the construction costs are paid to the contractor, and $3 million has been drawn down this year. In FY 2013, there was a $23.7 million increase in debt primarily due to the October 2012 issuance of Bond Series 2012B for a total of $26.2 million in proceeds to finance the construction of the Ragged Mountain Dam and associated Mitigation projects. More detailed information regarding the Authority’s long-term debt is presented in Note 7 of the notes to the financial statements.
MCWWTP Digester Upgrade
Ragged Mountain Dam Construction $ 7,534,797 MCWWTP Digester Heating & Mixing Upgrade 4,454,099 Meadow Creek Interceptor Improvements 3,406,567 Rivanna Pump Station and Tunnel 2,939,502 Urban Water Granular Activated Carbon 1,101,171 Valve Repair-Replacement (Phase 1) 414,952 Mitigation Plan Implementation 270,087 Albemarle-Berkley Interceptor 230,695 S. Fork Rivanna WTP Improvements 196,095 Stillhouse System Pump Station 113,841 Other 482,343 Subtotal 21,144,149 Capitalized Interest 1,950,250 Retainage on Construction in Progress 315,402 Total Current Year Construction Costs and Adjustments $ 23,409,801
Major capital asset activity for the current fiscal year included:
16

Review of Operations Operating revenues increased 1.4 percent or $356,000 in total in Fiscal Year 2014 mainly due to higher flows for the wastewater systems. Revenues for wastewater increased $731,000 while water revenues declined $375,000. A decline in rate revenues was expected because the rates for Urban Water charges were
decreased by the Board of Directors roughly 4 percent for FY 2014 and Urban Wastewater rates were flat or declining slightly for FY 2014. However, Urban Waste-water revenues increased due to a 9 percent increase in the volume of flow. The only other revenue item of note is that capital grant revenues ceased in FY 2013 when the project funded by the State Water Quality Improvement Fund (WQIF) grant was completed. No other projects have been funded with capital grants. The Authority has been steadily increasing rates over the years due to the aggressive capital improve-ment plan adopted by the Board of
Directors. The significant debt service impacts related to the capital program has been the single largest driver to our revenue requirements, especially for wastewater rates. FY 2014 was unique with respect to rates for several reasons. The Authority refinanced the 2001 and 2003 bonds late in FY 2012 which creates a saving in debt service payments that were fully realized in the FY 2014 budget. Additionally, some older debt had fully matured and was paid off, which was another reason the rates were able to be lowered. The rate decreases for our water customers and the flat or declining rates for wastewater charges were nonrecurring in nature. The Authority strived to keep water rates from rising the past several years. As can be seen from the table on Urban Rates below, water rates for FY 2014 were below those set in FY 2012 after several small increases for Urban Water the previous two years. Urban wastewater rates were stable after significant increases for the previous two years. Wastewater revenues were higher despite flat to decreasing rate because flows treated were higher than budget estimates.
Urban Rates per 1,000 gallons
Water WastewaterCity Rates 2.443$ 0.2% FY 2012 3.179$ 10.5%
2.443$ 0.0% FY 2013 3.565$ 12.1%2.341$ -4.2% FY 2014 3.593$ 0.8%
Water WastewaterACSA Rates 3.390$ 2.6% FY 2012 3.348$ 9.8%
3.465$ 2.2% FY 2013 3.732$ 11.5%3.333$ -3.8% FY 2014 3.463$ -7.2%
$0
$2,000,000
$4,000,000
$6,000,000
$8,000,000
$10,000,000
$12,000,000
$14,000,000
$16,000,000
FY 2012 FY 2013 FY 2014
Revenues
Water Sales Wastewater Charges Nonoperating Revenues Capital Grants
17

Review of Operations: (Continued)
Flows in the two urban rate centers are the single largest determining factor in the revenues billed to our two customers. The graphs below show the flows for the year compared to the last two years and the five-year average.
July Aug. Sept. Oct. Nov. Dec. Jan. Feb. Mar. Apr. May June
5 YR AVG. 10.70 10.74 10.50 9.64 8.84 8.22 8.41 8.81 8.77 9.46 9.49 10.06
FY 2012 10.78 10.87 10.13 9.46 8.72 8.16 8.32 8.64 8.88 9.50 9.63 10.01
FY 2013 11.01 10.37 10.25 9.67 9.21 8.65 8.93 9.21 9.02 9.79 9.72 9.93
FY 2014 10.27 10.18 10.83 10.17 9.46 8.27 9.02 9.19 8.86 9.37 9.65 10.15
5.00
6.00
7.00
8.00
9.00
10.00
11.00
12.00
Mill
ion
Ga
llon
s P
er
Da
y
Urban Water Flows
Urban Water flows have trended close to the five-year average. Urban Wastewater flows (below) by comparison are much more erratic from weather patterns that can significantly affect metered flows and revenues. Because of this, it is very difficult to predict the revenues and charges to our customers for Wastewater services from one year to the next.
July Aug. Sept. Oct. Nov. Dec. Jan. Feb. Mar. Apr. May June
5 YR AVG 8.66 8.88 9.84 9.55 10.10 10.68 10.09 9.93 11.29 10.03 10.44 9.64
FY 2012 8.53 8.68 10.72 11.21 9.04 10.95 9.96 9.16 9.91 9.83 11.76 10.03
FY 2013 9.32 9.93 10.36 9.11 10.00 8.36 9.85 9.23 10.76 9.26 9.21 11.25
FY 2014 10.47 9.92 10.36 9.59 9.21 10.58 10.55 12.23 10.72 11.84 11.96 9.48
5.0
6.0
7.0
8.0
9.0
10.0
11.0
12.0
13.0
Mill
ion
Ga
llon
s P
er
Da
y
Urban Wastewater Flows
18

Review of Operations: (Continued) Total expenses increased by $700,000 this year and again that was capital project driven. As shown in the next table, direct operating costs such as personnel, utilities, operating and maintenance costs were kept fairly even with FY 2013 expenses with an increase of only 3%. The most notable operating expense changes were a decrease in personnel expenses of $173,000 related to turnover and vacant positions and an increase in utility costs of $200,000 related to the very cold winter. There was also an upgrade in the digesters at the Moores Creek Wastewater Treatment Plant that caused the use of more natural gas than normal that increased utilities this year temporarily. There was an increase in the professional services cost items for general engineering and legal services this year for over $136,000. General operating costs for equipment and building maintenance increased $160,000 from the previous year.
Change in Expenses FY 2014 vs. FY 2013:FY 2014 FY 2013 Change
Direct Operating* $ 12,401,578 $ 12,025,713 $ 375,865 3%Depreciation 4,662,094 3,601,730 1,060,364 29%Interest 2,336,245 2,552,331 (216,086) -8%Debt issuance costs 61,081 580,404 (519,323) -89%
$ 19,460,998 $ 18,760,178 $ 700,820 4%
* - Personnel, chemicals, O&M, Utilities
Depreciation expense increased $1.06 million from FY 2013 because capital projects costing $93.8 million were completed and added to depreciable assets the last two years ($68.8 million in FY 2013 and $22 million in FY 2014). Interest expense decreased slightly due to the refinancing mentioned earlier, the retirement of older debt, and capitalization of interest. Cash balances have been stable for the past few years, maintaining a strong debt service coverage ratio the past several years. (See Table 8 in the Statistical Section.) Unrestricted cash balances for FY 2014 are at $34.9 million. This is a $2 million increase over FY 2013 levels. This increase is a direct result of increased revenues and lower than expected budgeted debt service payments. The Authority has been able to meet targets to increase cash reserves for rate stabilization, maintenance and capital replacement through the rate setting policies. After the drought of 2002, which occurred in FY 2003, the Authority began setting aside funds for rate stabilization to better handle wide fluctuations in flow. Rate stabilization reserves totaled $2,000,000 at June 30, 2014. This reserve was increased in FY 2014 from $1,000,000 the year before. Recognizing the increase in debt service obligations over the years, the Board of Director wisely increased the reserve to mitigate a decline in revenues should another drought or other unforeseen event that would affect revenues occur. Additionally, the Authority began setting aside funds in FY 2004 for watershed and water resources management projects related to the environmental health of the community’s watershed. These funds totaled $421,000 at the end of FY 2014. The Authority generally targets to have 60 days of working capital which is roughly $4.1 million and there is currently earmarked $14 million for capital projects. The $15 million remaining unrestricted cash would be undesignated reserves for future projects or additional rate stabilization needs. The Capital fund cash had been accumulating in previous fiscal years according to the Capital Improvement Plan; however, these past two years we have used a large portion of the capital fund to pay project costs that are not fully covered by the recently issued Revolving loan fund loan/bonds mentioned previously. The Authority has a financial goal of using 10% cash reserves to fund our total capital program. Over the last five years, the authority has used capital cash to fund roughly $14 million in projects.
19

Review of Operations: (Continued) Capital Improvements & Long-Term Trends The Authority generally updates the five-year projection of our Capital Improvement Plan (CIP) annually. The following estimates from the CIP adopted in January 2014 are broken out by fiscal year:
2014 $ 63,802,922 Capital Budget2015 37,186,084 CIP estimate2016 27,525,353 CIP estimate2017 9,733,000 CIP estimate2018 13,790,003 CIP estimate
$ 152,037,362 Total 5 year plan
$ 29,162,000 In progress and paid
$ 122,875,362 Future capital spending
Currently Adopted CIP
The fiscal challenges placed on the Authority with such an aggressive CIP have prompted management to target funding a portion of these capital costs with cash reserves. The total five-year CIP is estimated at $152 million in capital needs through the year 2018. About 20 percent of that is under construction and paid for. Of the $123 million left to be completed, the Authority has roughly $20 million in available bond proceeds on hand and is targeting $17.3 million in cash reserves as funding sources. This would leave the remaining CIP to be funded with $85.7 million in additional debt. The follow table shows the changes in the CIP adopted in January 2014 compared to the previously adopted capital plan:
2013-2017 $ 156,325,199 Previously adopted CIP (22,923,130) Budgets for completed projects18,635,293 New project budgets added
2014-2018 $ 152,037,362 Current CIP
Changes in CIP
Several years ago, the RWSA Board of Directors identified an important need to renew the community's sewer transmission system, and initiated goals that have already brought successful results in support of our environment and will continue to through an ambitious capital improvement plan over the next five years and beyond. With the support of the City of Charlottesville Utilities Division and the ACSA, a comprehensive study was undertaken that metered dry weather and wet weather flows in the sewer system over an extended period, and then used the data to develop a computer model from which both present and future needs can be forecasted. That information, plus a significant goal developed among the three agencies to reduce rainwater inflow and infiltration into the sewer system by 25% by 2020, led to a comprehensive master plan. All of that work was developed based on local initiative; a local desire by the three agencies to reverse years of declining infrastructure. During this time, The State Department of Environmental Quality took interest for various reasons in the problems of sanitary sewer overflows within the system. Working with the City, ACSA and Rivanna, the DEQ incorporated into a consent order the master plan to address this problem; thereby making the master plan mandatory.
20

Review of Operations: (Continued) Currently, most of the projects identified within the consent order have been completed. The largest remaining renewal and replacement project for the sewer system is the replacement of the Rivanna Pump Station. Over $26 million in contracts have been awarded for this project during the year. The current facility is undersized and sits adjacent to the Woolen Mills neighborhood and a public Riverview Park. This facility will be decommissioned with a force main traveling beneath a section of the residences in the neighborhood and a railroad right of way and will terminate on the existing site of the Moores Creek Advance Wastewater Treatment Plant. The termination point will be a newly constructed pump station designed to manage a peaking flow of 53 million gallons per day (mgd).
New Ragged Mountain Dam
One of the largest and most publicly scrutinized capital projects is the future increase to water supply better known as the Community Water Supply project. With support from the City, County and ACSA, Rivanna obtained a permit to expand the Ragged Mountain Reservoir, replace the existing dam, and construct a new pipeline between the new reservoir and the South Fork Rivanna Reservoir. This plan will supply the community with the raw water it needs for the next 55 years. The dam portion of this project is now near completion. The State has given their approval to start filling the new dam, which will take several years. This project represents over 15 years of planning, debate and execution which took only two years to construct from the issuance of the notice to proceed in April 2012.
21

Review of Operations: (Continued) Despite the significant infrastructure needs identified in the CIP, the Authority is positioned to provide for these needs by using more cash up front for projects and having a debt and rate structure that will accommodate more debt in the future. The Authority has been slowly but consistently implementing rate increases to pay for such infrastructure needs in 5 year increments. As shown in the following graph, which represents debt service payments on existing debt, the Authority has a fairly consistent to a declining debt structure for the next 17 years with large declines thereafter. Additionally, the rates are currently programmed to generate $12.1 million annually in debt service revenues; however, the water and wastewater capital needs will require additional rate increases in the future to maintain solid cash positions and future debt service needs.
-
1,000,000
2,000,000
3,000,000
4,000,000
5,000,000
6,000,000
7,000,000
8,000,000
9,000,000
10,000,000
2015 2017 2019 2021 2023 2025 2027 2029 2031 2033 2035 2037 2039 2041 2043
Deb
t S
ervi
ce i
n $
Fiscal Year
Debt Service FY2015-2043
Interest
Principal
Requests for Information This financial report is designed to provide a general overview of the Authority’s finances. Questions concerning any of the information provided in this report or requests for additional financial information should be addressed to the Finance Department at 695 Moores Creek Lane, Charlottesville, Virginia 22902-9016.
22

Basic Financial Statements
23

RIVANNA WATER & SEWER AUTHORITY Exhibit 1
Statement of Net PositionAt June 30, 2014 and 2013
2014 2013
ASSETSCurrent assets: Cash and cash equivalents (Note 2) $ 34,887,436 $ 32,910,784 Restricted cash and cash equivalents 11,676,356 25,664,332 Accounts receivable 2,135,859 2,362,410 Unbilled accounts receivable 26,900 30,600 Prepaid expenses 91,568 -
Total current assets $ 48,818,119 $ 60,968,126
Noncurrent assets:Restricted assets: Cash and cash equivalents $ 6,145,881 $ 6,144,084 Investments (Note 4) 15,836 17,634 Total restricted assets $ 6,161,717 $ 6,161,718 Capital assets: (Note 5) Land and improvements $ 10,557,573 $ 7,740,670 Buildings and operating equipment 209,923,728 187,783,379 Trucks and autos 1,155,195 1,135,736 Office equipment 93,659 482,091 Less accumulated depreciation (67,407,377) (63,200,676)
Subtotal net capital assets $ 154,322,778 $ 133,941,200 Construction work in progress (Note 6) 51,053,512 52,649,806
Total net capital assets $ 205,376,290 $ 186,591,006
Total noncurrent assets $ 211,538,007 $ 192,752,724
Total assets $ 260,356,126 $ 253,720,850
DEFERRED OUTFLOW OF RESOURCES Deferred charge on refunding $ 1,020,521 $ 1,084,278
The accompanying notes to financial statements are an integral part of this statement.
At June 30,
24

RIVANNA WATER & SEWER AUTHORITY Exhibit 1
Statement of Net PositionAt June 30, 2014 and 2013
2014 2013
LIABILITIES AND NET POSITIONLiabilities:Current liabilities: Accounts payable and other accrued expenses $ 4,022,152 $ 2,914,129 Compensated absences - current portion (Note 7) 334,000 339,000 Revenue bonds - current portion (Note 7) 2,360,059 2,262,517
Subtotal current liabilities $ 6,716,211 $ 5,515,646
Current liabilities (payable from restricted assets): Retainage payable $ 1,037,344 $ 721,941 Accrued interest payable 1,107,554 1,145,669 Revenue bond principal - current portion (Note 7) 2,370,788 2,282,090
Subtotal current liabilities (payable from restricted assets) $ 4,515,686 $ 4,149,700
Total current liabilities $ 11,231,897 $ 9,665,346
Noncurrent liabilities: Compensated absences (net of current portion) (Note 7) $ 39,296 $ 38,125 Net OPEB obligation (Note 11) 357,406 502,406 Revenue bonds (net of current portion) (Note 7) 120,949,679 123,004,079
Total noncurrent liabilities $ 121,346,381 $ 123,544,610
Total liabilities $ 132,578,278 $ 133,209,956
Net Position:Net investment in capital assets $ 93,538,673 $ 87,302,949 Restricted for bond covenants 2,870,788 2,782,090 Unrestricted 32,388,908 31,510,133
Total net position $ 128,798,369 $ 121,595,172
At June 30,
25
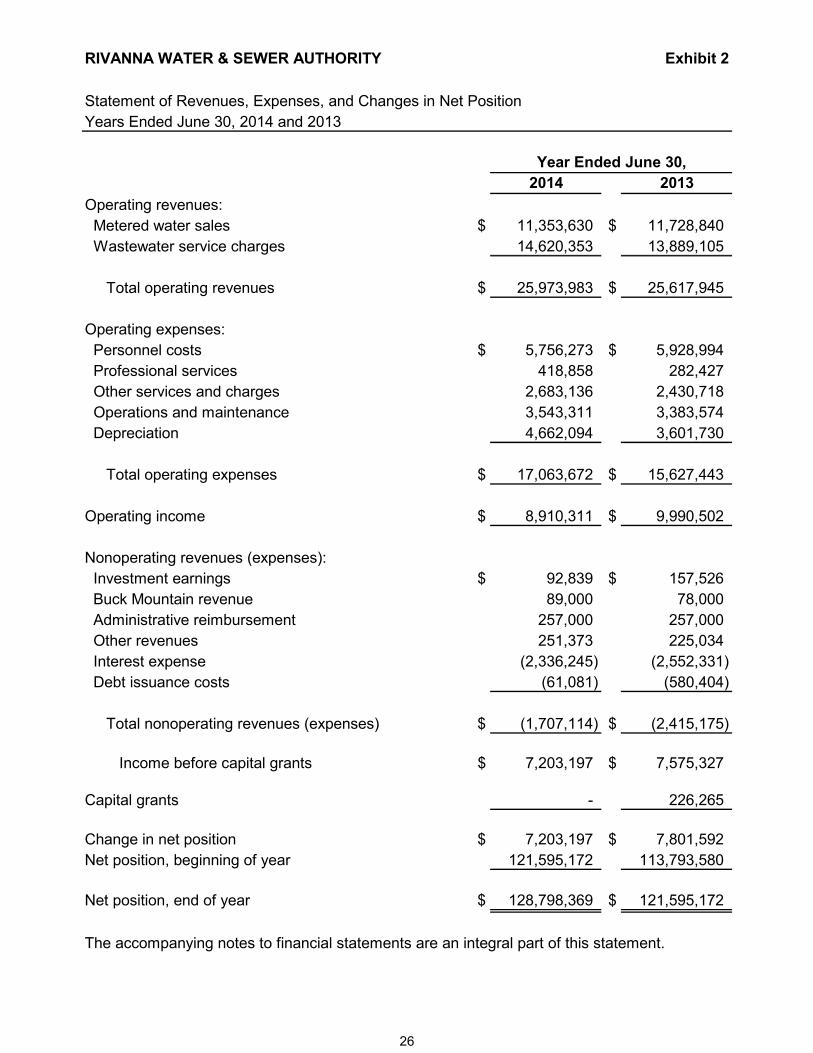
RIVANNA WATER & SEWER AUTHORITY Exhibit 2
Statement of Revenues, Expenses, and Changes in Net PositionYears Ended June 30, 2014 and 2013
Year Ended June 30,2014 2013
Operating revenues: Metered water sales $ 11,353,630 $ 11,728,840 Wastewater service charges 14,620,353 13,889,105
Total operating revenues $ 25,973,983 $ 25,617,945
Operating expenses: Personnel costs $ 5,756,273 $ 5,928,994 Professional services 418,858 282,427 Other services and charges 2,683,136 2,430,718 Operations and maintenance 3,543,311 3,383,574 Depreciation 4,662,094 3,601,730
Total operating expenses $ 17,063,672 $ 15,627,443
Operating income $ 8,910,311 $ 9,990,502
Nonoperating revenues (expenses): Investment earnings $ 92,839 $ 157,526 Buck Mountain revenue 89,000 78,000 Administrative reimbursement 257,000 257,000 Other revenues 251,373 225,034 Interest expense (2,336,245) (2,552,331) Debt issuance costs (61,081) (580,404)
Total nonoperating revenues (expenses) $ (1,707,114) $ (2,415,175)
Income before capital grants $ 7,203,197 $ 7,575,327
Capital grants - 226,265
Change in net position $ 7,203,197 $ 7,801,592 Net position, beginning of year 121,595,172 113,793,580
Net position, end of year $ 128,798,369 $ 121,595,172
The accompanying notes to financial statements are an integral part of this statement.
26

RIVANNA WATER & SEWER AUTHORITY Exhibit 3
Statement of Cash FlowsYears Ended June 30, 2014 and 2013
Year Ended June 30,2014 2013
Cash flows from operating activities: Receipts from customers and users $ 26,801,606 $ 25,882,492 Payments to suppliers of goods and services (6,856,772) (5,897,565) Payments to and on behalf of employees for services (5,892,899) (5,708,407)
Net cash provided by (used for) operating activities $ 14,051,935 $ 14,276,520
Cash flows from capital and related financing activities: Additions to capital assets $ (19,966,006) $ (26,143,642) Principal payments on bonds (4,565,880) (4,161,945) Capital grants - 226,265 Proceeds of bonds, net of issue costs, premiums 2,960,690 28,098,529 Debt issuance costs (61,081) (621,760) Interest payments (4,523,822) (4,072,224)
Net cash provided by (used for) capital and related financing activities $ (26,156,099) $ (6,674,777)
Cash flows from investing activities: Maturity of investments $ 1,745 $ 1,618 Interest and dividends received 92,892 157,950
Net cash provided by (used for) investing activities $ 94,637 $ 159,568
Increase (decrease) in cash and cash equivalents $ (12,009,527) $ 7,761,311
Cash and cash equivalents at beginning of year (including $31,808,416 and $31,237,244, respectively reported in restricted accounts) 64,719,200 56,957,889
Cash and cash equivalents at end of year (including $17,822,237 and $31,808,416, respectively reported in restricted accounts) $ 52,709,673 $ 64,719,200
Reconciliation of operating income (loss) to net cash provided by (used for) operating activities: Operating income $ 8,910,311 $ 9,990,502 Adjustments to reconcile operating income (loss) to net cash provided by (used for) operating activities: Depreciation 4,662,094 3,601,730 Buck Mountain revenue 89,000 78,000 Other nonoperating revenues 508,372 482,034 Changes in operating assets and liabilities: (Increase) decrease in receivables 230,251 (295,487) Increase (decrease) in net OPEB obligation (145,000) 81,707 Increase (decrease) in compensated absences (3,829) 20,264 (Increase) decrease in prepaid expenses (91,568) - Increase (decrease) in operating payables and accrued expenses (107,696) 317,770
Net cash provided by (used for) operating activities $ 14,051,935 $ 14,276,520
Noncash investing, capital and financing activities: Increase (decrease) in fair value of investments $ (53) $ (424) (Increase) decrease in accounts payable for capital projects (1,215,719) (81,042) (Increase) decrease in retainage payable for capital projects (315,403) (212,828)
The accompanying notes to financial statements are an integral part of this statement.
27

This page intentionally left blank
RIVANNA WATER & SEWER AUTHORITY
Notes to the Financial Statements At June 30, 2014 and 2013
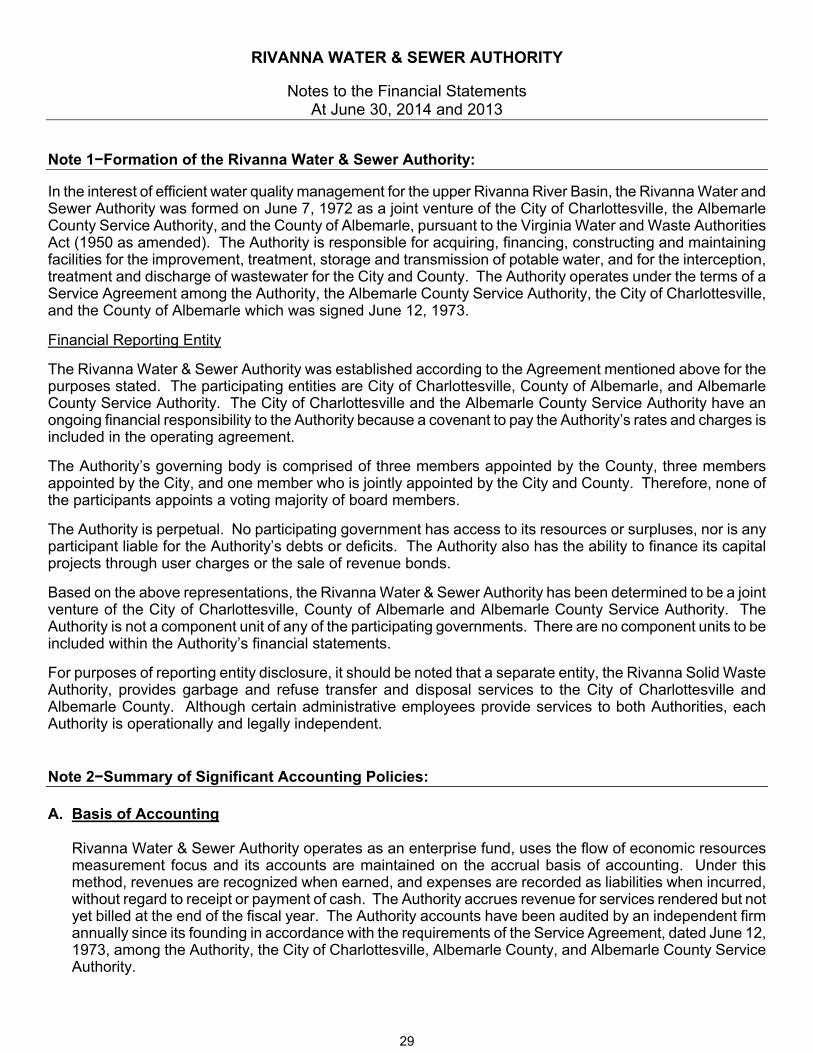
Note 1−Formation of the Rivanna Water & Sewer Authority:
In the interest of efficient water quality management for the upper Rivanna River Basin, the Rivanna Water and Sewer Authority was formed on June 7, 1972 as a joint venture of the City of Charlottesville, the Albemarle County Service Authority, and the County of Albemarle, pursuant to the Virginia Water and Waste Authorities Act (1950 as amended). The Authority is responsible for acquiring, financing, constructing and maintaining facilities for the improvement, treatment, storage and transmission of potable water, and for the interception, treatment and discharge of wastewater for the City and County. The Authority operates under the terms of a Service Agreement among the Authority, the Albemarle County Service Authority, the City of Charlottesville, and the County of Albemarle which was signed June 12, 1973.
Financial Reporting Entity
The Rivanna Water & Sewer Authority was established according to the Agreement mentioned above for the purposes stated. The participating entities are City of Charlottesville, County of Albemarle, and Albemarle County Service Authority. The City of Charlottesville and the Albemarle County Service Authority have an ongoing financial responsibility to the Authority because a covenant to pay the Authority’s rates and charges is included in the operating agreement.
The Authority’s governing body is comprised of three members appointed by the County, three members appointed by the City, and one member who is jointly appointed by the City and County. Therefore, none of the participants appoints a voting majority of board members.
The Authority is perpetual. No participating government has access to its resources or surpluses, nor is any participant liable for the Authority’s debts or deficits. The Authority also has the ability to finance its capital projects through user charges or the sale of revenue bonds.
Based on the above representations, the Rivanna Water & Sewer Authority has been determined to be a joint venture of the City of Charlottesville, County of Albemarle and Albemarle County Service Authority. The Authority is not a component unit of any of the participating governments. There are no component units to be included within the Authority’s financial statements.
For purposes of reporting entity disclosure, it should be noted that a separate entity, the Rivanna Solid Waste Authority, provides garbage and refuse transfer and disposal services to the City of Charlottesville and Albemarle County. Although certain administrative employees provide services to both Authorities, each Authority is operationally and legally independent. Note 2−Summary of Significant Accounting Policies: A. Basis of Accounting
Rivanna Water & Sewer Authority operates as an enterprise fund, uses the flow of economic resources measurement focus and its accounts are maintained on the accrual basis of accounting. Under this method, revenues are recognized when earned, and expenses are recorded as liabilities when incurred, without regard to receipt or payment of cash. The Authority accrues revenue for services rendered but not yet billed at the end of the fiscal year. The Authority accounts have been audited by an independent firm annually since its founding in accordance with the requirements of the Service Agreement, dated June 12, 1973, among the Authority, the City of Charlottesville, Albemarle County, and Albemarle County Service Authority.
29

RIVANNA WATER & SEWER AUTHORITY Notes to the Financial Statements At June 30, 2014 and 2013 (Continued)
Note 2−Summary of Significant Accounting Policies: (Continued)
A. Basis of Accounting (Continued) The Authority distinguishes operating revenues and expenses from nonoperating items. Operating revenues and expenses generally result from providing services and producing and delivering goods in connection with the Authority’s principal ongoing operations. The principal operating revenues of the Authority are charges to customers for sales and services. Operating expenses include the cost of sales and services, administrative expenses, and depreciation on capital assets. All revenues and expenses not meeting this definition are reported as nonoperating revenues and expenses.
B. Accounts Receivable
Accounts receivable are stated at book value utilizing the direct write-off method for immaterial uncollectible accounts.
C. Basic Financial Statements
Since the Authority is only engaged in business-type activities, it is required to present only the financial statements required for enterprise funds. For the Authority, the basic financial statements and required supplementary information consist of:
• Management’s discussion and analysis • Enterprise fund financial statements
– Statement of Net Position
– Statement of Revenues, Expenses, and Changes in Net Position
– Statement of Cash Flows
– Notes to the Financial Statements
• Required Supplementary Information
– Schedule of Pension Funding Progress – Schedule of OPEB Funding Progress
D. Capital Assets
Capital assets, which include property, plant, equipment, and infrastructure assets (e.g., roads, bridges, sidewalks, and similar items), are reported in the financial statements. Capital assets are defined by the Authority as assets with an initial, individual cost of more than $5,000 (amount not rounded) and an estimated useful life in excess of one year. Such assets are recorded at historical cost or estimated historical cost if purchased or constructed. Donated capital assets are recorded at estimated fair market value at the date of donation.
30

RIVANNA WATER & SEWER AUTHORITY Notes to the Financial Statements At June 30, 2014 and 2013 (Continued)
Note 2−Summary of Significant Accounting Policies: (Continued) D. Capital Assets: (Continued)
The costs of normal maintenance and repairs that do not add to the value of the asset or materially extend its useful life are not capitalized. Major outlays for capital assets and improvements are capitalized as projects are constructed. Interest incurred during the construction phase of capital assets of business-type activities is included as part of the capitalized value of the assets constructed. The Authority capitalized interest in the amount of $1,950,250 and $1,750,872 for the years ended June 30, 2014 and 2013, respectively.
Property, plant, equipment and infrastructure are depreciated using the straight line method over the following estimated useful lives:
Assets Years
Buildings & operating equipment 5 to 50Trucks & autos 5 to 10Office equipment 5 to 10Data processing equipment 5
E. Cash and Cash Equivalents
The Authority's cash and cash equivalents consist of demand deposits, certificates of deposit, short-term U.S. Governmental obligations, and other investments with an original maturity of three months or less from the date of acquisition, all of which are readily convertible to known amounts of cash.
F. Investments Investments are reported at fair value.
G. Budgets and Budgetary Accounting
A budget is prepared for information, fiscal planning purposes, and to provide the basis for setting wholesale rates, in accordance with the requirements of the Service Agreement, dated June 12, 1973, among the Authority, the City of Charlottesville, Albemarle County, and the Albemarle County Service Authority. Rates charged by the six rate centers are not subjected to regulatory scrutiny but may be changed at any time by the Authority's Board of Directors, if necessary, in order to adjust revenues. None of the participating entities are required to approve the budget. The budget is adopted as a planning document and is not a legal control on expenses.
31

RIVANNA WATER & SEWER AUTHORITY Notes to the Financial Statements At June 30, 2014 and 2013 (Continued)
Note 2−Summary of Significant Accounting Policies: (Continued)
G. Budgets and Budgetary Accounting (Continued) The budgets are adopted on an appropriation basis. Principally, the appropriation basis of budgeting provides for a full accrual basis of accounting, capital expenditures, and bond principal payments and partially provides for depreciation of utility plant and amortization.
H. Inventory
Consumption of materials and supplies is recorded as an expense when used. No inventory amounts are recorded as an asset, as available inventories are not significant.
I. Use of Estimates
The preparation of financial statements in conformity with generally accepted accounting principles requires management to make estimates and assumptions that affect certain reported amounts and disclosures. Accordingly, actual results could differ from those estimates.
J. Net Position Net position is the difference between assets and deferred outflows of resources and liabilities and deferred inflows of resources. Net investment in capital assets represents capital assets, reduced by accumulated depreciation and by any outstanding debt, deferred outflows of resources and increased by deferred inflows of resources related to the acquisition, construction or improvement of those assets. Restricted net position represents restricted assets reduced by liabilities and deferred inflows of resources related to those assets. The balance in the replacement reserve is presented as restricted net position.
K. Restricted Assets
Certain proceeds of the Authority’s revenue bonds and certain resources set aside for their repayment are classified as restricted assets on the statement of net position, because they are maintained in separate bank accounts, and their use is limited by applicable bond covenants. The “revenue bond general operating reserve” is used to report resources set aside to subsidize potential deficiencies from the Authority’s operation that could adversely affect debt service payments. The “revenue bond payment account” is used to segregate resources accumulated for debt service payments over the next twelve months. The “debt service reserve” is used to report resources set aside to make up potential future deficiencies in the revenue bond payment account. The “repair and replacement reserve” is used to report resources set aside to meet unexpected contingencies or to fund asset renewals and replacements.
32
RIVANNA WATER & SEWER AUTHORITY Notes to the Financial Statements At June 30, 2014 and 2013 (Continued)
Note 2−Summary of Significant Accounting Policies: (Continued)
L. Long-Term Obligations
Bond premiums and discounts are amortized over the life of the bonds. Bonds payable are reported net of the applicable bond premium or discount. Bond issuance costs are expensed as incurred.
M. Reclassification Certain amounts in previously issued financial statements have been restated to conform to the current year’s classifications.
N. Deferred Inflows and Outflows of Resources In addition to liabilities, the statement of net position will sometimes report a separate section for deferred inflows of resources. This separate financial statement element, deferred inflows of resources, represents an acquisition of net position that applies to future periods and so will not be recognized as an inflow of resources (revenue) until then. The Authority does not have any deferred inflows of resources as of June 30, 2014. In addition to assets, the statement of net position will sometimes report a separate section for deferred outflows of resources. This separate financial statement element, deferred outflows of resources, represents a consumption of net position that applies to future periods and so will not be recognized as an outflow of resources (expense/expenditure) until then. The Authority only has one item that qualifies for reporting in this category. It is the deferred charge on refunding which results from the difference in the carrying value of refunded debt and its reacquisition price. This amount is deferred and amortized over the shorter of the life of the refunded or refunding debt.
O. Net Position Flow Assumption Sometimes the Authority will fund outlays for a particular purpose from both restricted (e.g., restricted bond or grant proceeds) and unrestricted resources. In order to calculate the amounts to report as restricted net position and unrestricted net position in the financial statements, a flow assumption must be made about the order in which the resources are considered to be applied. It is the Authority’s policy to consider restricted net position to have been depleted before unrestricted net position is applied.
Note 3−Acquisition of Water and Wastewater Facilities: Under the terms of the Service Agreement (See Note 1), the Authority agreed to purchase certain water production, transmission and storage facilities and wastewater interception and treatment facilities from the City and the Albemarle County Service Authority. The agreement provides that the sale be consummated ten years from the date of the agreement or at such later time as the debts, if any, attributed to each such facility have been paid or provision is made for their payment, and that the Authority will lease the facility until such time as the sale is consummated. The purchase price is the fair value of the facilities as of June 12, 1973, as determined by all payments paid by the Authority during the term of lease applicable to the principal retired on the debt of such facilities. In accordance with generally accepted accounting principles, the aforementioned agreement has been treated as an installment purchase of the facilities, with the purchase price being discounted at an annual rate of 6% for ten years.
33

RIVANNA WATER & SEWER AUTHORITY Notes to the Financial Statements At June 30, 2014 and 2013 (Continued)
Note 3−Acquisition of Water and Wastewater Facilities: (Continued) The following tabulation reflects the agreed upon purchase price and accounting thereof:
Fair value as of June 12, 1973:Facilities acquired from City of Charlottesville $ 6,128,124 Facilities acquired from Albemarle County Service Authority 3,604,384
Total purchase price $ 9,732,508
Add: Interest portion of rental payments not applied to principal reduction 1,154,074
Total contracts payable $ 10,886,582
Less: Interest included in contract price computed at annual rate of 6% for 10 years 4,940,705
Asset carrying value $ 5,945,877
The contracts payable have been reduced by the amount of the annual rental payments on the facilities as outlined in the following tabulation:
AlbemarleCity of County Service
Charlottesville Authority
Contracts payable, June 12, 1973 $ 6,354,634 $ 4,531,948
Rental payments and contract adjustments in prior fiscal years $ 1,760,676 $ 3,680,395 Total rental payments $ 1,760,676 $ 3,680,395
Final payment on facilities with no outstanding debtas of June 30, 1983 4,593,958 851,553
Total payments $ 6,354,634 $ 4,531,948
Contracts payable, June 30, 2014 $ - $ -
The total annual rental payments over the initial ten year agreement were not sufficient to retire the contracts payable to the Albemarle County Service Authority. The deferred interest was amortized over the initial ten year period of the agreement and was fully amortized as of June 30, 1983. Depreciation has been based upon the engineer’s estimates of useful lives remaining as of the valuation date (June 12, 1973). Depreciation expense on these facilities amounted to $79,399 and $79,427 for the years ended June 30, 2014 and 2013, respectively.
34

RIVANNA WATER & SEWER AUTHORITY Notes to the Financial Statements At June 30, 2014 and 2013 (Continued)
Note 4−Deposits and Investments: Deposits Deposits with banks are covered by the Federal Deposit Insurance Corporation (FDIC) and collateralized in accordance with the Virginia Security for Public Deposits Act (the “Act”) Section 2.2-4400 et. seq. of the Code of Virginia. Under the Act, banks and savings institutions holding public deposits in excess of the amount insured by the FDIC must pledge collateral to the Commonwealth of Virginia Treasury Board. Financial Institutions may choose between two collateralization methodologies and depending upon that choice, will pledge collateral that ranges in the amounts from 50% to 130% of excess deposits. Accordingly, all deposits are considered fully collateralized. Investments Statutes authorize the Authority to invest in obligations of the United States or agencies thereof, obligations of the Commonwealth of Virginia or political subdivisions thereof, obligations of the International Bank for Reconstruction and Development (World Bank), the Asian Development Bank, the African Development Bank, “prime quality” commercial paper and certain corporate notes, banker’s acceptances, repurchase agreements and the State Treasurer’s Local Government Investment Pool (LGIP). The Authority does not have a formal investment policy that addresses credit risk or interest rate risk. Credit Risk of Debt Securities The Authority’s rated debt investments as of June 30, 2014 were rated by Standard & Poor’s and the ratings are presented below using Standard & Poor’s rating scale.
Fair Quality
Rated Debt Investments AAA
U.S. Agencies Securities $ 15,836Local Government Investment Pool 27,299,318Virginia State Non-Arbitrage Pool 8,198,014U.S. Treasury & Agency Money Market Fund 4,054,703
Total $ 39,567,871
Authority's Rated Debt Investments' Values
Ratings
Interest Rate Risk
GreaterThan
Investment Type Fair Value 10 Years
U.S. Agencies Securities $ 15,836 $ 15,836
Total $ 15,836 $ 15,836
Investment Maturities (in years)
35

RIVANNA WATER & SEWER AUTHORITY Notes to the Financial Statements At June 30, 2014 and 2013 (Continued)
Note 4−Deposits and Investments: (Continued)
External Investment Pools
The fair value of the positions in the external investment pool (Local Government Investment Pool) is the same as the value of the pool shares. As these pools are not SEC registered, regulatory oversight of the pool rests with the Virginia State Treasury. Local Government Investment Pool maintains a policy to operate in a manner consistent with SEC Rule 2a-7.
Note 5−Capital Assets:
Details of changes in capital assets for the year ended June 30, 2014 are as follows:
Balance BalanceJuly 1, June 30,2013 Increases Decreases Transfers 2014
Capital assets not being depreciated:
Land and improvements $ 7,740,670 $ 2,816,903 $ - $ - $ 10,557,573Construction in progress 52,649,806 23,409,801 25,006,095 - 51,053,512
Total capital assets not being depreciated $ 60,390,476 $ 26,226,704 $ 25,006,095 $ - $ 61,611,085
Other capital assets:
Buildings & operating equipment: Water system $ 57,749,569 $ 2,785,536 $ 33,184 $ - $ 60,501,921 Wastewater system 129,745,363 19,403,656 23,767 - 149,125,252 Support departments 288,447 8,108 - - 296,555
Subtotal $ 187,783,379 22,197,300 $ 56,951 $ - $ 209,923,728
Accumulated depreciation (61,657,712) (4,618,971) (56,951) - (66,219,732)
Total $ 126,125,667 $ 17,578,329 $ - $ - $ 143,703,996
Trucks and autos: Water system $ 161,309 $ - $ - $ (17,700) $ 143,609 Wastewater system 159,796 19,459 - - 179,255 Support departments 814,631 - - 17,700 832,331
Subtotal $ 1,135,736 $ 19,459 $ - $ - $ 1,155,195
Accumulated depreciation (1,065,269) (37,726) - - (1,102,995)
Total $ 70,467 $ (18,267) $ - $ - $ 52,200
Office equipment: Water system $ 282,987 $ - $ 280,272 $ - $ 2,715 Wastewater system 109,291 - 106,577 - 2,714 Support departments 89,813 10,010 11,593 - 88,230
Subtotal $ 482,091 $ 10,010 $ 398,442 $ - $ 93,659
Accumulated depreciation (477,695) (5,397) (398,442) - (84,650)
Other capital assets, net $ 4,396 $ 4,613 $ - $ - $ 9,009
Capital assets, net $ 186,591,006 $ 43,791,379 $ 25,006,095 $ - $ 205,376,290
36

RIVANNA WATER & SEWER AUTHORITY Notes to the Financial Statements At June 30, 2014 and 2013 (Continued)
Note 5−Capital Assets: (Continued) Details of changes in capital assets for the year ended June 30, 2013 are as follows:
Balance BalanceJuly 1, June 30,2012 Increases Decreases Transfers 2013
Capital assets not being depreciated:
Land and improvements $ 7,740,670 $ - $ - $ - $ 7,740,670Construction in progress 93,321,788 28,161,687 68,833,669 - 52,649,806
Total capital assets not being depreciated $ 101,062,458 $ 28,161,687 $ 68,833,669 $ - $ 60,390,476
Other capital assets:
Buildings & operating equipment: Water system $ 51,125,641 $ 6,623,928 $ - $ - $ 57,749,569 Wastewater system 67,530,035 62,216,328 - - 129,746,363 Support departments 274,297 14,150 - - 288,447
Subtotal $ 118,929,973 68,854,406 $ - $ - $ 187,784,379
Accumulated depreciation (58,125,918) (3,531,794) - - (61,657,712)
Total $ 60,804,055 $ 65,322,612 $ - $ - $ 126,126,667
Trucks and autos: Water system $ 161,309 $ - $ - $ - $ 161,309 Wastewater system 159,796 - - - 159,796 Support departments 808,671 5,960 - - 814,631
Subtotal $ 1,129,776 $ 5,960 $ - $ - $ 1,135,736
Accumulated depreciation (1,004,124) (61,145) - - (1,065,269)
Total $ 125,652 $ (55,185) $ - $ - $ 70,467
Office equipment: Water system $ 282,987 $ - $ - $ - $ 282,987 Wastewater system 109,291 - - - 109,291 Support departments 89,813 - - - 89,813
Subtotal $ 482,091 $ - $ - $ - $ 482,091
Accumulated depreciation (468,904) (8,791) - - (477,695)
Other capital assets, net $ 13,187 $ (8,791) $ - $ - $ 4,396
Capital assets, net $ 162,005,352 $ 93,420,323 $ 68,833,669 $ - $ 186,592,006
37

RIVANNA WATER & SEWER AUTHORITY Notes to the Financial Statements At June 30, 2014 and 2013 (Continued)
Note 6−Construction Work in Progress: Details of construction work in progress for the year ended June 30, 2014 are as follows:
Expense/Balance Transfer to BalanceJuly 1, Cost of Capital June 30,2013 Construction Assets 2014
Pantops Tank Repairs $ - $ 6,426 $ - $ 6,426Mitigation Plan Implementation 1,926,858 270,087 2,196,945 - South Fork Reservoir to Ragged Mtn Pipeline R/W 24,859 - - 24,859Ragged Mountain Dam Construction 16,804,668 7,534,797 - 24,339,465Route 29 Pumping Station 415,212 28,764 - 443,976Alderman Road Pump Station Improvements 96,036 42,679 - 138,715Stillhouse System Pump Station 1,432,891 113,841 1,546,732 - Stillhouse Tank Repairs and System Improvements - 60 - 60Valve Repair-Replacement (Phase 1) 22,341 414,952 437,293 - Urban Water Disinfection Optimization - Chloramines 970,371 ** (168,860) 801,511 - Meadowcreek Interceptor Improvements 18,473,068 3,406,567 18,473,067 3,406,568Shenks Branch Interceptor 3,354,987 69,785 - 3,424,772Albemarle-Berkley Interceptor 295,283 230,695 - 525,978New Rivanna Pump Station and Tunnel 3,254,333 2,939,502 - 6,193,835Observatory Water Treatment Plant Improvements - 13,327 - 13,327Interceptor Sewer & Manhole Repair 582,159 30,453 - 612,612Wholesale Water Master Metering-Urban - 50,239 - 50,239Crozet Water Treatment Plant Improvements - 56,235 - 56,235Crozet Pump Station Two Automatic Bar Screens - 64,950 - 64,950MCAWWTP Odor Control-Phase 2 - 70,376 - 70,376MCAWWTP Admin Building Repairs - 18,850 - 18,850North Fork Water Treatment Plant Improvements - 47,983 - 47,983South Fork Hydropower Plant Rehabilitaion - 1,598 - 1,598South Fork Rivanna Reservoir Dredging 125,788 1,770 - 127,558Disinfection Byproduct Optimization - Crozet 166,435 64,047 - 230,482Partial Transite Pipe Replacement 111,752 29,176 - 140,928*Scottsville Water Granular Activated Carbon 69,145 30,210 - 99,355Crozet Interceptor 102,551 24,275 - 126,826Moores Creek Bridge Repairs 10,490 - - 10,490MCWWTP Digester Upgrades 1,213,172 4,454,099 - 5,667,271*Urban Water Granular Activated Carbon 186,988 ** 1,101,171 - 1,288,159Beaver Creek Dam Alterations 129,548 - - 129,548South Fork Rivanna Water Treatment Plant Improvements 2,117 196,095 - 198,212Capitalized Interest 2,156,813 1,950,250 1,550,547 2,556,516Retainage on Construction in Progress 721,941 315,402 - 1,037,343
$ 52,649,806 $ 23,409,801 $ 25,006,095 $ 51,053,512
*Note-Project name changed**Note-Prior year construction costs were reclassified from one project to another. Cost of construction includes interest capitalized during the fiscal year, where applicable. For the years ended June 30, 2014 and 2013, capitalized interest was $1,950,250 and $1,750,872.
38

RIVANNA WATER & SEWER AUTHORITY Notes to the Financial Statements At June 30, 2014 and 2013 (Continued)
Note 6−Construction Work in Progress: (Continued) Details of construction work in progress for the year ended June 30, 2013 are as follows:
Expense/Balance Transfer to BalanceJuly 1, Cost of Capital June 30,2012 Construction Assets 2013
Mitigation Plan Implementation $ 653,128 $ 1,273,730 $ - $ 1,926,858South Fork Reservoir to Ragged Mtn Pipeline R/W 24,859 - - 24,859Ragged Mountain Dam Design 6,033,859 - 6,033,859 - Ragged Mountain Dam Construction 2,560,328 14,244,340 - 16,804,668Route 29 Pumping Station 414,870 342 - 415,21229N Pipeline Removal / Temporary Pump Connect 153,906 274,239 428,145 - Alderman Road Pump Station Improvements 56,930 39,106 - 96,036Stillhouse System Pump Station 275,563 1,157,328 - 1,432,891Valve Repair-Replacement 16,292 6,049 - 22,341*Urban Water Disinfection Optimization - Chloramines 602,816 367,555 - 970,371Meters for Sanitary Sewer Flow Monitoring - - - - Meadowcreek Interceptor Improvements 17,855,135 617,933 - 18,473,068Shenks Branch Interceptor 760,729 2,594,258 - 3,354,987Albemarle-Berkley Interceptor 43,535 251,748 - 295,283*New Rivanna Pump Station and Tunnel 1,080,023 2,174,310 - 3,254,333Moores Creek Pump Station & Force Main Upgrade 4,633,093 77,536 4,710,629 - UWW Misc. Repairs to Pipelines Adjacent to Streams 78,540 190,360 268,900 - Interceptor Sewer & Manhole Repair 567,631 14,528 - 582,159MCWWTP Upgrade to ENR Design 2,817,270 - 2,817,270 - MCWWTP Upgrade to ENR Construction 43,507,708 518,965 44,026,673 - MCWWTP Odor Control 321,606 9,800 331,406 - MCWWTP Septage Receiving 1,050,324 109,320 1,159,644 - MCWWTP Wet Weather Capacity 7,262,991 477,746 7,740,737 - SWWTP Conversion to Ultraviolet Disinfection 186,994 28,592 215,586 - South Fork Rivanna Reservoir Dredging 117,062 8,726 - 125,788Pantops Tank Mixing System 57,720 97,617 155,337 - Disinfection Byproduct Optimization - Crozet 48,570 117,865 - 166,435Partial Transite Pipe Replacement 4,618 107,134 - 111,752Disinfection Byproduct Optimization - Scottsville 7,980 61,165 - 69,145Crozet Interceptor 8,383 94,168 - 102,551Moores Creek Bridge Repairs 5,245 5,245 - 10,490MCWWTP Digester Upgrades 253,543 959,629 - 1,213,172Urban Water Disinfection Optimization - GAC - 186,988 - 186,988Beaver Creek Dam Alterations - 129,548 - 129,548South Fork Rivanna Water Treatment Plant Improvements - 2,117 - 2,117Capitalized Interest 1,351,424 1,750,872 945,483 2,156,813Retainage on Construction in Progress 509,113 212,828 - 721,941
$ 93,321,788 $ 28,161,687 $ 68,833,669 $ 52,649,806
*Note-Project name changed
39

RIVANNA WATER & SEWER AUTHORITY Notes to the Financial Statements At June 30, 2014 and 2013 (Continued)
Note 7−Long-Term Obligations: A. Changes in Long-Term Obligations
The following is a summary of long-term obligation transactions for the year ended June 30, 2014:
Balance BalanceJuly 1, June 30, Due Within2013 Issuances Retirements 2014 One Year
Revenue bonds payable $ 123,284,603 $ 2,960,690 $ (4,565,880) $ 121,679,413 $ 4,730,847Add (less) deferred amounts:
For issuance premiums (discounts) 4,264,083 - (262,970) 4,001,113 -
Total revenue bonds $ 127,548,686 $ 2,960,690 $ (4,828,850) $ 125,680,526 $ 4,730,847
Net OPEB obligation $ 502,406 $ (114,000) $ (31,000) $ 357,406 $ -
Compensated absences $ 377,125 $ 324,709 $ (328,538) $ 373,296 $ 334,000
Totals $ 128,428,217 $ 3,171,399 $ (5,188,388) $ 126,411,228 $ 5,064,847
The following is a summary of long-term obligation transactions for the year ended June 30, 2013:
Balance BalanceJuly 1, June 30, Due Within2012 Issuances Retirements 2013 One Year
Revenue bonds payable $ 99,994,270 $ 27,452,278 $ (4,161,945) $ 123,284,603 $ 4,544,607Add (less) deferred amounts:
For issuance premiums (discounts) 3,839,875 646,251 (222,043) 4,264,083 -
Total revenue bonds $ 103,834,145 $ 28,098,529 $ (4,383,988) $ 127,548,686 $ 4,544,607
Net OPEB obligation $ 420,699 $ 186,656 $ (104,949) $ 502,406 $ -
Compensated absences $ 356,861 $ 359,641 $ (339,377) $ 377,125 $ 339,000
Totals $ 104,611,705 $ 28,644,826 $ (4,828,314) $ 128,428,217 $ 4,883,607
40

RIVANNA WATER & SEWER AUTHORITY Notes to the Financial Statements At June 30, 2014 and 2013 (Continued)
Note 7−Long-Term Obligations: (Continued) B. Details of Long-Term Obligations
Amount Total Due Within Amount One Year Revenue Bonds Regional Water and Sewer System Revenue Bonds, Series 1994 B - On November 23, 1994, the Authority issued $1,321,652 in bonds through theVirginia Revolving Loan Fund for the purpose of financing improvements tothe Scottsville Wastewater Treatment System. These bonds are secured by a supplemental trust agreement between the Authority and the trustee forthe bondholders. This agreement states that these obligations will be repaidfrom revenue generated by the Authority and also provides for theestablishment of several accounts to ensure the timely payment of interestand debt maturities. These accounts are included in the restricted currentassets section of the statement of net position. The bond resolution provides a redemption schedule with interest only dueon October 1, 1995 and semi-annual payments of combined principal andinterest of $47,010 through April 1, 2015. Effective April 1, 2004, the bondsbear interest at an annual rate of 2.9%. $ 92,013 $ 92,013 Water and Sewer System Revenue Bonds, Series 2005B - On December 7, 2005, the Authority issued $25,805,000 in Revenue Refunding Bonds withan interest rate between 3.50% to 5.00% to advance refund $10,675,000 ofoutstanding 1999 Series bonds with an interest rate from 4.85% to 6.00%and $6,060,000 of outstanding 2000 Series bonds with an interest rate from4.35% to 5.40%. Proceeds of $7,800,000 were used for the construction ofvarious water and sewer projects. The net proceeds (after payment of$383,538 in underwriting and other issuance costs, construction funds of $7,800,000 and a deposit of $368,870 to the debt service reserve) of$17,266,922 plus an additional $151,827 of prior debt service reserve fundswere used to purchase the Revenue bonds. These funds were deposited inan irrevocable trust with an escrow agent to call the bonds beginningOctober 2027. The bond resolution provides a redemption schedule with interest due semi-annually and principal due annually from April 1, 2006 through October 1,2035. The bonds bear interest at an annual rate of 3.50% to 5.00%. The Authority advance refunded the 1999 and 2000 Series bonds to reduce itstotal debt service payments over the next 25 years by $1.81 million and toobtain an economic gain (difference between the present values of the debtservice payments on the old and new debt) of $1.17 million. 22,145,000 830,000
41

RIVANNA WATER & SEWER AUTHORITY Notes to the Financial Statements At June 30, 2014 and 2013 (Continued)
Note 7−Long-Term Obligations: (Continued) B. Details of Long-Term Obligations (Continued)
Amount Total Due Within Amount One Year Water and Sewer System Revenue Bonds - Series of 2005A - On November 10, 2005, the Authority issued $2,340,929 in bonds for purposes of financing the Moores Creek wastewater pre-treatment project. These bonds are secured by a supplemental trust agreement between the Authorityand trustee for the bondholders. This agreement states that theseobligations will be repaid from revenue generated by the Authority and arebacked by a restricted cash account. The bond resolution provides a redemption schedule with an interest onlypayment due in April 2007 and semi-annual payments of principal andinterest of $79,670 from October 2007 through October 2026. The bondsbear interest at 3%. $ 1,650,724 $ 110,641 $24,000,000 Regional Water and Sewer System Revenue Bond - Series 2009A - On August 1, 2009 the Authority issued $24,000,000 in bonds forpurposes of financing the Moores Creek Wastewater Treatment Plantupgrades, including the Enhanced Nutrient Removal project. These bondsare secured by a supplemental trust agreement between the Authority andtrustee for the bondholders. This agreement states that the obligation will be repaid from revenue generated by the Authority and is backed by a restrictedcash account. The bond resolution provides a redemption schedule with an interest onlypayment due in April 2011 and semi-annual payments of principal andinterest of $843,077 from October 2011 through October 2030. The bondsbear interest at 3.35%. 21,236,273 982,901 $15,179,718 Regional Water and Sewer System Revenue Bond - Series 2010A - On June 29, 2010 the Authority issued $15,179,718 in bonds forpurposes of financing the acquisition, construction and equipping ofimprovements to the Authority's water and sewer system, including thereplacement of the Meadow Creek Sanitary Sewer Interceptor together withrelated expenses. These bonds are secured by a supplemental trust agreement between the Authority and trustee for the bondholders. Thisagreement states that the obligation will be repaid from revenue generatedby the Authority and is backed by a restricted cash account. The bond resolution provides a redemption schedule with an interest onlypayment due in April 2012 and semi-annual payments of principal andinterest of $513,715 from October 2012 through April 2030 and $412,769 due in October 2030. The bonds bear interest at 2.93%. $634,121 of the original bond principal will not be expended. 13,304,364 642,680
42

RIVANNA WATER & SEWER AUTHORITY Notes to the Financial Statements At June 30, 2014 and 2013 (Continued)
Note 7−Long-Term Obligations: (Continued)
B. Details of Long-Term Obligations (Continued) Amount Total Due Within Amount One Year $6,982,662 Regional Water and Sewer System Revenue Bond - Series 2011A - on March 17, 2011 the Authority issued $6,982,662 in bonds for purposes of financing the acquisition, construction and equipping ofimprovements to the Authority's sewer system including improvementsnecessary to address the wet weather flows at the Moores CreekWastewater Treatment Plant. These bonds are secured by a supplementaltrust agreement between the Authority and trustee for the bondholders. Thisagreement states that the obligation will be repaid from revenue generatedby the Authority and is backed by a restricted cash account.
The bond resolution provides a redemption schedule with an interest onlypayment due in April 2012 and semi-annual payments of principal andinterest of $236,308 from October 2012 through October 2031. The bondsbear interest at 2.93%. $ 6,434,717 $ 286,161
$1,017,338 Regional Water and Sewer System Revenue Bond - Series 2011B - on March 17, 2011 the Authority issued $1,017,338 in bonds forpurposes of financing the acquisition, construction and equipping ofimprovements to the Authority's sewer system including improvements necessary to address the wet weather flows at the Moores CreekWastewater Treatment Plant. These bonds are secured by a supplementaltrust agreement between the Authority and trustee for the bondholders. Thisagreement states that the obligation will be repaid from revenue generatedby the Authority and is backed by a restricted cash account. The bond resolution provides a redemption schedule with an interest onlypayment due in April 2012 and semi-annual payments of principal and interest of $34,429 from October 2012 through April 2031 and $8,575 due October 2031. The bonds bear interest at 2.93%. $748 of the original bond principal will not be expended. 921,965 42,151
$4,241,488 Regional Water and Sewer System Revenue Bond - Series 2011D - on September 9, 2011 the Authority issued $4,241,488 in bonds forpurposes of financing the acquisition, construction and equipping ofimprovements to the Authority's water and sewer system. These bonds aresecured by a supplemental trust agreement between the Authority andtrustee for the bondholders. This agreement states that the obligation will berepaid from revenue generated by the Authority and is backed by a restrictedcash account.
The bond resolution provides a redemption schedule with an interest only payment due in October 2012 and semi-annual payments of principal and interest of $143,541 from April 2013 through April 2032. The bonds bearinterest at 2.93%. 3,993,683 171,313
43

RIVANNA WATER & SEWER AUTHORITY Notes to the Financial Statements At June 30, 2014 and 2013 (Continued)
Note 7−Long-Term Obligations: (Continued) B. Details of Long-Term Obligations (Continued)
Amount Total Due Within Amount One Year $443,937 Regional Water and Sewer System Revenue Bond - Series 2011E - on September 9, 2011 the Authority issued $443,937 in bonds for purposes of financing the acquisition, construction and equipping ofimprovements to the Authority's water and sewer system. These bonds aresecured by a supplemental trust agreement between the Authority andtrustee for the bondholders. This agreement states that the obligation will berepaid from revenue generated by the Authority and is backed by a restrictedcash account. The bond resolution provides a redemption schedule with an interest onlypayment due in October 2012 and semi-annual payments of principal and interest of $15,024 from April 2013 through October 2031 and $11,635 due in April 2032. The bonds bear interest at 2.93%. $ 416,094 $ 17,987 $25,100,000 Water and Sewer System Revenue and Refunding Bonds,Series 2012A - On June 13, 2012, the Authority issued $25,100,000 inRevenue and Refunding Bonds for purposes of financing various water andsewer capital projects and to refund Series 2001 bond with an outstandingamount of $5,490,000 and Series 2003 bond with an outstanding amount of $4,827,000. The bonds were issued at a premium in the amount of$3,706,939. The bond resolution provides a redemption schedule with interest due semi-annually and principal due annually from October 1, 2012 through October 1,2042. The bonds bear interest at an annual rate ranging from 2.125% to5.125%. The Authority refunded the 2001 and 2003 Series bonds to reduceits total debt service payments over the next 13 years by $4.93 million and toobtain a net economic gain (difference between the present values of thedebt service payments on the old and new debt) of $1,079,384 after applyingexisting reserve funds of $3.55 million. 22,885,000 995,000
44

RIVANNA WATER & SEWER AUTHORITY Notes to the Financial Statements At June 30, 2014 and 2013 (Continued)
Note 7−Long-Term Obligations: (Continued) B. Details of Long-Term Obligations (Continued)
Amount Total Due Within Amount One Year $26,240,000 Water and Sewer System Revenue and Refunding Bonds,Series 2012B - On October 30, 2012, the Authority issued $26,240,000 inRevenue and Refunding Bonds for purposes of financing various water and sewer capital projects including the design, development and construction ofa new dam; the implementation of wetlands and streambank mitigation plansand costs of issuance. The bonds were issued at a premium in the amountof $646,250. The bond resolution provides a redemption schedule with interest due semi-annually and principal due annually from April 1, 2013 through October 1,2042. The bonds bear interest at an annual rate ranging from 2.125% to4.0%. The bonds are subject to federal arbitrage regulations. Total annual payments range from $1,337,000 to $1,342,000. $ 25,695,000 $ 560,000 $29,043,290 Water and Sewer Revenue Bonds, Series 2014A - On March 28, 2014, the Authority issued $29,043,290 in revenue bonds for purposes of financing capital improvements and capacity upgrades of the RivannaInterceptor and pump station at Moores Creek Wastewater Treatment Plant. The bond resolution provides a redemption schedule with interest andprincipal payments of $941,168 due semi-annually from April 1, 2017 through April 1, 2036. An interest only payment is due on October 1, 2016.The bonds bear interest at an annual rate of 2.45%. As of June 30, 2014 theAuthority has requested draw down of bond proceeds in the amount of $2,904,580. 2,904,580 - Total Revenue Bonds $ 121,679,413 $ 4,730,847 Net OPEB obligation $ 357,406 $ - Compensated Absences $ 373,296 $ 334,000 Total $ 122,410,115 $ 5,064,847
45

RIVANNA WATER & SEWER AUTHORITY Notes to the Financial Statements At June 30, 2014 and 2013 (Continued)
Note 7−Long-Term Obligations: (Continued) C. Annual Amortization of Long-Term Debt
The annual requirements to amortize all long-term debt outstanding as of June 30, 2014 are as follows:
Year EndingJune 30, Principal Interest
2015 $ 4,730,847 $ 4,363,886 2016 4,809,228 4,185,873 2017 5,040,712 4,214,235 2018 4,831,668 3,903,643 2019 4,932,314 3,733,387 2020-2024 27,102,489 15,819,1322025-2029 30,912,743 10,485,6872030-2034 18,738,804 5,521,629 2035-2039 11,160,608 2,974,613 2040-2043 9,420,000 772,141
Total $ 121,679,413 $ 55,974,226
Revenue Bonds
D. Advance Refunding
In 2005, the Authority issued $25,085,000 (of which $16,735,000 was used for the refunding) of revenue refunding bonds to provide resources to purchase U.S. Government State and Local Government Series securities that were placed in an irrevocable trust for the purpose of generating resources for all future debt service payments of $16,735,000 of outstanding 1999 and 2000 Series revenue bonds. As a result, the refunded bonds are considered to be defeased and the liability has been removed from the Authority’s Statement of Net Position. The reacquisition price exceeded the net carrying amount of the old debt by $1,028,259. This amount is being netted against the new debt and amortized over the life of the debt. This advance refunding was undertaken to reduce total debt service payments over the next 25 years by $1,819,511 and resulted in an economic gain of $1,172,758.
E. Prior Year Defeasance of Debt
In prior years, the Authority defeased certain revenue bonds by placing the proceeds of new bonds in an irrevocable trust to provide for all future debt service payments on the old bonds. Accordingly, the trust account assets and the liability for the defeased bonds are not included in the Authority’s financial statements. At June 30, 2014, $2,235,000 of bonds outstanding is considered defeased.
Note 8−Compensated Absences: Authority employees earn vacation leave each month at a scheduled rate in accordance with the years of service and sick leave at the rate of eight hours per month. Accumulated unpaid vacation leave amounts are accrued when incurred. At June 30, 2014 and 2013, the liability for accrued vacation leave was $373,296 and $377,125, respectively.
46

RIVANNA WATER & SEWER AUTHORITY Notes to the Financial Statements At June 30, 2014 and 2013 (Continued)
Note 9−Pension Plan: A. Plan Description
Name of Plan: Virginia Retirement System (VRS) Identification of Plan: Agent and Cost-Sharing Multiple-Employer Pension Plan Administering Entity: Virginia Retirement System (System)
All full-time, salaried permanent (professional) employees of public school divisions and employees of participating employers are automatically covered by VRS upon employment. Members earn one month of service credit for each month they are employed and they and their employer are paying contributions to VRS. Members are eligible to purchase prior public service, active duty military service, certain periods of leave and previously refunded VRS service as service credit in their plan.
Within the VRS Plan, the System administers three different benefit plans for local government employees – Plan 1, Plan 2, and, Hybrid. Each plan has a different eligibility and benefit structure as set out below:
VRS − PLAN 1
1. Plan Overview - VRS Plan 1 is a defined benefit plan. The retirement benefit is based on a member’s
age, creditable service and average final compensation at retirement using a formula. Employees are eligible for VRS Plan 1 if their membership date is before July 1, 2010, and they were vested as of January 1, 2013.
2. Eligible Members - Employees are in VRS Plan 1 if their membership date is before July 1, 2010, and
they were vested as of January 1, 2013.
3. Hybrid Opt-In Election - VRS non-hazardous duty covered Plan 1 members were allowed to make an irrevocable decision to opt into the Hybrid Retirement Plan during a special election window held January 1 through April 30, 2014.
The Hybrid Retirement Plan’s effective date for eligible VRS Plan 1 members who opted in was July 1, 2014.
If eligible deferred members returned to work during the election window, they were also eligible to opt into the Hybrid Retirement Plan.
Members who were eligible for an optional retirement plan (ORP) and had prior service under VRS Plan 1 were not eligible to elect the Hybrid Retirement Plan and remain as VRS Plan 1 or ORP.
4. Retirement Contributions - Members contribute up to 5% of their compensation each month to their
member contribution account through a pre-tax salary reduction. Some school divisions and political subdivisions elected to phase in the required 5% member contribution; all employees will be paying the full 5% by July 1, 2016. Member contributions are tax-deferred until they are withdrawn as part of a retirement benefit or as a refund. The employer makes a separate actuarially determined contribution to VRS for all covered employees. VRS invests both member and employer contributions to provide funding for the future benefit payment.
47

RIVANNA WATER & SEWER AUTHORITY Notes to the Financial Statements At June 30, 2014 and 2013 (Continued)
Note 9−Pension Plan: (Continued) A. Plan Description (Continued)
VRS − PLAN 1 (CONTINUED) 5. Creditable Service - Creditable service includes active service. Members earn creditable service for
each month they are employed in a covered position. It also may include credit for prior service the member has purchased or additional creditable service the member was granted. A member’s total creditable service is one of the factors used to determine their eligibility for retirement and to calculate their retirement benefit. It also may count toward eligibility for the health insurance credit in retirement, if the employer offers the health insurance credit.
6. Vesting - Vesting is the minimum length of service a member needs to qualify for a future retirement
benefit. Members become vested when they have at least five years (60 months) of creditable service. Vesting means members are eligible to qualify for retirement if they meet the age and service requirements for their plan. Members also must be vested to receive a full refund of their member contribution account balance if they leave employment and request a refund.
Members are always 100% vested in the contributions that they make.
7. Calculating the Benefit - The Basic Benefit is calculated based on a formula using the member’s
average final compensation, a retirement multiplier and total service credit at retirement. It is one of the benefit payout options available to a member at retirement.
An early retirement reduction factor is applied to the Basic Benefit if the member retires with a reduced retirement benefit or selects a benefit payout option other than the Basic Benefit.
8. Average Final Compensation - A member’s average final compensation is the average of the 36
consecutive months of highest compensation as a covered employee. 9. Service Retirement Multiplier - The retirement multiplier is a factor used in the formula to determine
a final retirement benefit. The retirement multiplier for non-hazardous duty members is 1.7%. The retirement multiplier for sheriffs and regional jail superintendents is 1.85%. The retirement multiplier of eligible political subdivision hazardous duty employees other than sheriffs and regional jail superintendents is 1.7% or 1.85% as elected by the employer.
10. Normal Retirement Age - Age 65. 11. Earliest Unreduced Retirement Eligibility - Members who are not in hazardous duty positions are
eligible for an unreduced retirement benefit at age 65 with at least five years (60 months) of creditable service or at age 50 with at least 30 years of creditable service.
Hazardous duty members are eligible for an unreduced retirement benefit at age 60 with at least five years of creditable service or age 50 with at least 25 years of creditable service.
12. Earliest Reduced Retirement Eligibility - Members may retire with a reduced benefit as early as age
55 with at least five years (60 months) of creditable service or age 50 with at least 10 years of creditable service.
48

RIVANNA WATER & SEWER AUTHORITY Notes to the Financial Statements At June 30, 2014 and 2013 (Continued)
Note 9−Pension Plan: (Continued) A. Plan Description (Continued)
VRS − PLAN 1 (CONTINUED)
13. Cost-of-Living Adjustment (COLA) in Retirement - The Cost-of-Living Adjustment (COLA) matches
the first 3% increase in the Consumer Price Index for all Urban Consumers (CPI-U) and half of any additional increase (up to 4%) up to a maximum COLA of 5%.
14. Eligibility - For members who retire with an unreduced benefit or with a reduced benefit with at least
20 years of creditable service, the COLA will go into effect on July 1 after one full calendar year from the retirement date.
For members who retire with a reduced benefit and who have less than 20 years of creditable service, the COLA will go into effect on July 1 after one calendar year following the unreduced retirement eligibility date.
15. Exceptions to COLA Effective Dates - The COLA is effective July 1 following one full calendar year
(January 1 to December 31) under any of the following circumstances:
The member is within five years of qualifying for an unreduced retirement benefit as of January 1, 2013.
The member retires on disability.
The member retires directly from short-term or long-term disability under the Virginia Sickness and Disability Program (VSDP).
The member is involuntarily separated from employment for causes other than job performance or misconduct and is eligible to retire under the Workforce Transition Act or the Transitional Benefits Program.
The member dies in service and the member’s survivor or beneficiary is eligible for a monthly death-in-service benefit. The COLA will go into effect on July 1 following one full calendar year (January 1 to December 31) from the date the monthly benefit begins.
16. Disability Coverage – For members who are eligible to be considered for disability retirement and
retire on disability, the retirement multiplier is 1.7% on all service, regardless of when it was earned, purchased or granted.
Most state employees are covered under the Virginia Sickness and Disability Program (VSDP), and are not eligible for disability retirement.
VSDP members are subject to a one-year waiting period before becoming eligible for non-work related disability benefits.
49

RIVANNA WATER & SEWER AUTHORITY Notes to the Financial Statements At June 30, 2014 and 2013 (Continued)
Note 9−Pension Plan: (Continued) A. Plan Description (Continued)
VRS − PLAN 1 (CONTINUED)
17. Purchase of Prior Service - Members may be eligible to purchase service from previous public
employment, active duty military service, an eligible period of leave or VRS refunded service as creditable service in their plan. Prior creditable service counts toward vesting, eligibility for retirement and the health insurance credit. Only active members are eligible to purchase prior service. When buying service, members must purchase their most recent period of service first. Members also may be eligible to purchase periods of leave without pay.
VRS − PLAN 2
1. Plan Overview - VRS Plan 2 is a defined benefit plan. The retirement benefit is based on a member’s
age, creditable service and average final compensation at retirement using a formula. Employees are eligible for VRS Plan 2 if their membership date is on or after July 1, 2010, or their membership date is before July 1, 2010, and they were not vested as of January 1, 2013.
2. Eligible Members - Employees are in VRS Plan 2 if their membership date is on or after July 1, 2010,
or their membership date is before July 1, 2010, and they were not vested as of January 1, 2013.
3. Hybrid Opt-In Election - VRS Plan 2 members were allowed to make an irrevocable decision to opt into the Hybrid Retirement Plan during a special election window held January 1 through April 30, 2014.
The Hybrid Retirement Plan’s effective date for eligible VRS Plan 2 members who opted in was July 1, 2014.
If eligible deferred members returned to work during the election window, they were also eligible to opt into the Hybrid Retirement Plan.
Members who were eligible for an optional retirement plan (ORP) and have prior service under VRS Plan 2 were not eligible to elect the Hybrid Retirement Plan and remain as VRS Plan 2 or ORP.
4. Retirement Contributions – Same as VRS Plan 1−Refer to Section 4. 5. Creditable Service – Same as VRS Plan 1− Refer to Section 5. 6. Vesting – Same as VRS Plan 1−Refer to Section 6. 7. Calculating the Benefit – Same as VRS Plan 1−Refer to Section 7. 8. Average Final Compensation - A member’s average final compensation is the average of their 60
consecutive months of highest compensation as a covered employee.
50

RIVANNA WATER & SEWER AUTHORITY Notes to the Financial Statements At June 30, 2014 and 2013 (Continued)
Note 9−Pension Plan: (Continued) A. Plan Description (Continued)
VRS − PLAN 2 (CONTINUED)
9. Service Retirement Multiplier - Same as Plan 1 for service earned, purchased or granted prior to
January 1, 2013. For non-hazardous duty members the retirement multiplier is 1.65% for creditable service earned, purchased or granted on or after January 1, 2013.
10. Normal Retirement Age - Normal Social Security retirement age. 11. Earliest Unreduced Retirement Eligibility - Members who are not in hazardous duty positions are
eligible for an unreduced retirement benefit when they reach normal Social Security retirement age and have at least five years (60 months) of creditable service or when their age and service equal 90.
Hazardous duty members are eligible for an unreduced retirement benefit at age 60 with at least five years of creditable service or age 50 with at least 25 years of creditable service.
12. Earliest Reduced Retirement Eligibility - Members may retire with a reduced benefit as early as age
60 with at least five years (60 months) of creditable service. 13. Cost-of-Living Adjustment (COLA) in Retirement - The Cost-of-Living Adjustment (COLA) matches
the first 2% increase in the CPI-U and half of any additional increase (up to 2%), for a maximum COLA of 3%.
14. Eligibility – Same as VRS Plan 1−Refer to Section 14. 15. Exceptions to COLA Effective Dates – Same as VRS Plan 1−Refer to Section 15. 16. Disability Coverage – For members who are eligible to be considered for disability retirement and
retire on disability, the retirement multiplier is 1.65% on all service, regardless of when it was earned, purchased or granted.
Most state employees are covered under the Virginia Sickness and Disability Program (VSDP), and are not eligible for disability retirement.
VSDP members are subject to a one-year waiting period before becoming eligible for non-work related disability benefits.
17. Purchase of Prior Service – Same as VRS Plan 1−Refer to Section 17.
51

RIVANNA WATER & SEWER AUTHORITY Notes to the Financial Statements At June 30, 2014 and 2013 (Continued)
Note 9−Pension Plan: (Continued) A. Plan Description (Continued)
HYBRID RETIREMENT PLAN 1. Plan Overview - The Hybrid Retirement Plan combines the features of a defined benefit plan and a
defined contribution plan. Most members hired on or after January 1, 2014 are in this plan, as well as VRS Plan 1 and VRS Plan 2 members who were eligible and opted into the plan during a special election window. (See “Eligible Members”)
The defined benefit is based on a member’s age, creditable service and average final
compensation at retirement using a formula.
The benefit from the defined contribution component of the plan depends on the member and employer contributions made to the plan and the investment performance of those contributions.
In addition to the monthly benefit payment payable from the defined benefit plan at retirement, a
member may start receiving distributions from the balance in the defined contribution account, reflecting the contributions, investment gains or losses, and any required fees.
2. Eligible Members - Employees are in the Hybrid Retirement Plan if their membership date is on or
after January 1, 2014. This includes:
State employees* School division employees
Political subdivision employees*
Judges appointed or elected to an original term on or after January 1, 2014
Members in VRS Plan 1 or VRS Plan 2 who elected to opt into the plan during the election window held January 1-April 30, 2014; the plan’s effective date for opt-in members was July 1, 2014
3. *Non-Eligible Members - Some employees are not eligible to participate in the Hybrid Retirement
Plan. They include:
Members of the State Police Officers’ Retirement System (SPORS) Members of the Virginia Law Officers’ Retirement System (VaLORS)
Political subdivision employees who are covered by enhanced benefits for hazardous duty employees
Those employees eligible for an optional retirement plan (ORP) must elect the ORP plan or the Hybrid Retirement Plan. If these members have prior service under VRS Plan 1 or VRS Plan 2, they are not eligible to elect the Hybrid Retirement Plan and must select VRS Plan 1 or VRS Plan 2 (as applicable) or ORP.
52

RIVANNA WATER & SEWER AUTHORITY Notes to the Financial Statements At June 30, 2014 and 2013 (Continued)
Note 9−Pension Plan: (Continued) A. Plan Description (Continued)
HYBRID RETIREMENT PLAN (CONTINUED)
4. Retirement Contributions - A member’s retirement benefit is funded through mandatory and
voluntary contributions made by the member and the employer to both the defined benefit and the defined contribution components of the plan. Mandatory contributions are based on a percentage of the employee’s creditable compensation and are required from both the member and the employer. Additionally, members may choose to make voluntary contributions to the defined contribution component of the plan, and the employer is required to match those voluntary contributions according to specified percentages.
5. Creditable Service
Defined Benefit Component - Under the defined benefit component of the plan, creditable service includes active service. Members earn creditable service for each month they are employed in a covered position. It also may include credit for prior service the member has purchased or additional creditable service the member was granted. A member’s total creditable service is one of the factors used to determine their eligibility for retirement and to calculate their retirement benefit. It also may count toward eligibility for the health insurance credit in retirement, if the employer offers the health insurance credit.
Defined Contribution Component - Under the defined contribution component, creditable service is used to determine vesting for the employer contribution portion of the plan.
6. Vesting
Defined Benefit Component - Defined benefit vesting is the minimum length of service a member needs to qualify for a future retirement benefit. Members are vested under the defined benefit component of the Hybrid Retirement Plan when they reach five years (60 months) of creditable service. VRS Plan 1 or VRS Plan 2 members with at least five years (60 months) of creditable service who opted into the Hybrid Retirement Plan remain vested in the defined benefit component.
Defined Contribution Component - Defined contribution vesting refers to the minimum length of service a member needs to be eligible to withdraw the employer contributions from the defined contribution component of the plan.
Members are always 100% vested in the contributions that they make.
53

RIVANNA WATER & SEWER AUTHORITY Notes to the Financial Statements At June 30, 2014 and 2013 (Continued)
Note 9−Pension Plan: (Continued) A. Plan Description (Continued)
HYBRID RETIREMENT PLAN (CONTINUED)
6. Vesting (Continued)
Upon retirement or leaving covered employment, a member is eligible to withdraw a percentage of employer contributions to the defined contribution component of the plan, based on service.
After two years, a member is 50% vested and may withdraw 50% of employer contributions.
After three years, a member is 75% vested and may withdraw 75% of employer contributions.
After four or more years, a member is 100% vested and may withdraw 100% of employer contributions.
Distribution is not required by law until age 70½.
7. Calculating the Benefit
Defined Benefit Component – Same as VRS Plan 1−Refer to Section 7.
Defined Contribution Component - The benefit is based on contributions made by the member and any matching contributions made by the employer, plus net investment earnings on those contributions.
8. Average Final Compensation – Same as VRS Plan 2−Refer to Section 8. It is used in the retirement
formula for the defined benefit component of the plan.
9. Service Retirement Multiplier - The retirement multiplier is 1.0%.
For members that opted into the Hybrid Retirement Plan from VRS Plan 1 or VRS Plan 2, the applicable multipliers for those plans will be used to calculate the retirement benefit for service credited in those plans.
10. Normal Retirement Age
Defined Benefit Component – Same as VRS Plan 2−Refer to Section 10.
Defined Contribution Component - Members are eligible to receive distributions upon leaving employment, subject to restrictions.
11. Earliest Unreduced Retirement Eligibility
Defined Benefit Component - Members are eligible for an unreduced retirement benefit when they reach normal Social Security retirement age and have at least five years (60 months) of creditable service or when their age and service equal 90.
Defined Contribution Component - Members are eligible to receive distributions upon leaving employment, subject to restrictions.
54

RIVANNA WATER & SEWER AUTHORITY Notes to the Financial Statements At June 30, 2014 and 2013 (Continued)
Note 9−Pension Plan: (Continued) 1. Plan Description (Continued)
HYBRID RETIREMENT PLAN (CONTINUED)
12. Earliest Reduced Retirement Eligibility
Defined Benefit Component - Members may retire with a reduced benefit as early as age 60 with at least five years (60 months) of creditable service.
Defined Contribution Component - Members are eligible to receive distributions upon leaving employment, subject to restrictions.
13. Cost-of-Living Adjustment (COLA) in Retirement
Defined Benefit Component – Same as VRS Plan 2−Refer to Section 13.
Defined Contribution Component – Not Applicable.
14. Eligibility – Same as VRS Plan 1 and VRS Plan 2−Refer to Section 14. 15. Exceptions to COLA Effective Dates – Same as VRS Plan 1 and VRS Plan 2−Refer to Section 15.
16. Disability Coverage - Eligible political subdivision and school division members (including VRS Plan
1 and VRS Plan 2 opt-ins) participate in the Virginia Local Disability Program (VLDP) unless their local governing body provides an employer-paid comparable program for its members.
State employees (including VRS Plan 1 and VRS Plan 2 opt-ins) participating in the Hybrid Retirement Plan are covered under the Virginia Sickness and Disability Program (VSDP), and are not eligible for disability retirement.
Hybrid members (including VRS Plan 1 and VRS Plan 2 opt-ins) covered under VSDP or VLDP are subject to a one-year waiting period before becoming eligible for non-work related disability benefits.
17. Purchase of Prior Service
Defined Benefit Component - Same as VRS Plan 1 and VRS Plan 2−Refer to Section 17.
Defined Contribution Component – Not Applicable.
The System issues a publicly available comprehensive annual financial report (CAFR) that includes financial statements and required supplementary information for the plans administered by VRS. A copy of the most recent report may be obtained from the VRS website at http://www.varetire.org/Pdf/Publications/ 2013-annual-report.pdf, or by writing to the System’s Chief Financial Officer at P.O. Box 2500, Richmond, VA, 23218-2500.
55

RIVANNA WATER & SEWER AUTHORITY Notes to the Financial Statements At June 30, 2014 and 2013 (Continued)
Note 9−Pension Plan: (Continued) B. Funding Policy
Plan members are required by Title 51.1 of the Code of Virginia (1950), as amended, to contribute 5.00% of their compensation toward their retirement. All or part of the 5.00% member contribution may be assumed by the employer. Beginning July 1, 2012 new employees were required to pay the 5% member contribution. In addition, for existing employees, employers were required to begin making the employee pay the 5% member contribution. This could be phased in over a period up to 5 years and the employer is required to provide a salary increase equal to the amount of the increase in the employee-paid member contribution. In addition, the Authority is required to contribute the remaining amounts necessary to fund its participation in the VRS using the actuarial basis specified by the Code of Virginia and approved by the VRS Board of Trustees. The Authority’s contribution rate for the fiscal year ended June 30, 2014 was 10.48% of the annual covered payroll.
C. Annual Pension Cost
For fiscal year 2014, the Authority’s annual pension cost of $428,317 for VRS was equal to the required and actual contributions.
Fiscal Year Annual Pension Cost Percentage of APC Net PensionEnding (APC) Contributed Obligation
June 30, 2014 $ 428,317 100% $ - June 30, 2013 426,490 100% - June 30, 2012 308,088 100% -
Three-Year Trend Information forRivanna Water & Sewer Authority
The fiscal year 2014 required contribution was determined as part of the June 30, 2011 actuarial valuation using the entry age actuarial cost method. The actuarial assumptions at June 30, 2011 included (a) an investment rate of return (net of administrative expenses) of 7.00%, (b) projected salary increases ranging from 3.75% to 5.6% per year for local general government employees, and (c) a cost-of-living adjustment of 2.50% per year for Plan 1 employees and 2.25% for Plan 2 employees. Both the investment rate of return and the projected salary increases include an inflation component of 2.50%. The actuarial value of the Authority’s assets is equal to the modified market value of assets. This method uses techniques that smooth the effects of short-term volatility in the market value of assets over a five-year period. The Authority’s unfunded actuarial accrued liability is being amortized as a level percentage of projected payroll on a closed basis. The remaining amortization period at June 30, 2013 for the Unfunded Actuarial Accrued Liability (UAAL) was 30 years.
D. Funded Status and Funding Progress
As of June 30, 2013, the most recent actuarial valuation date, the Authority’s plan was 74.81% funded. The actuarial accrued liability for benefits was $18,141,668, and the actuarial value of assets was $13,572,160, resulting in an unfunded actuarial accrued liability (UAAL) of $4,569,508. The covered payroll (annual payroll of active employees covered by the plan) was $4,109,405 and ratio of the UAAL to the covered payroll was 111.20%.
56

RIVANNA WATER & SEWER AUTHORITY Notes to the Financial Statements At June 30, 2014 and 2013 (Continued)
Note 9−Pension Plan: (Continued)
D. Funded Status and Funding Progress (Continued)
The schedule of funding progress, presented as Required Supplementary Information (RSI) following the notes to the financial statements, presents multiyear trend information about whether the actuarial value of plan assets is increasing or decreasing over time relative to the actuarial accrued liability (AAL) for benefits.
Note 10−Risk Management:
The Authority is exposed to various risks of loss related to torts; theft of, damage to and destruction of assets; errors and omissions; injuries to employees; and natural disasters. The Authority joined together with other local governments in the Commonwealth to form the Virginia Municipal Group Self Insurance Association, a public entity risk pool currently operating as a common risk management and insurance program for member governments. The Authority pays an annual premium to the pool for its workers compensation coverage. For property and liability insurance the Authority joined together with other local governments in the State to form the Virginia Association of Counties Group Self-Insurance Pool, a public entity risk pool. The Agreements for Formation of the associations provide that the associations will be self-sustaining through member premiums. Settled claims have not exceeded pool coverage in any of the past three fiscal years.
Note 11−Other Postemployment Benefits−Health Insurance:
Background
In fiscal year 2009 the Authority implemented Governmental Accounting Standards Board (GASB) Statement No. 45 for other postemployment benefits (OPEB) offered to retirees. This standard addresses how governmental reporting entities should account for and report their costs related to postemployment healthcare and non-pension benefits, such as the Authority’s retiree health benefit. Historically, the Authority’s subsidy was funded on a pay-as-you-go basis, but GASB Statement No. 45 requires that the Authority accrue the cost of the retiree health subsidy and other postemployment benefits during the period of the employees’ active employment, while the benefits are being earned, and disclose the unfunded actuarial accrued liability in order to accurately account for the total future cost of postemployment benefits and the financial impact on the Authority. This funding methodology mirrors the funding approach used for pension benefits.
Plan Description
In addition to the pension benefits described in Note 9, the Authority previously provided post-retirement healthcare benefits for employees who were eligible under a single-employer defined benefit plan. The Plan and benefits have been terminated except for a closed group of retirees, who will continue to receive benefits under the previous plan policy. The Authority permitted retirees to participate and purchase medical benefits under the Authority’s existing plan for current employees. Retirees were responsible for the entire cost of the benefits. Benefits were available for a period of five years or until age 65, whichever came first. The OPEB Plan does not issue separate audited financial statements.
Eligible employees must have met the age and service criteria for unreduced retirement benefits from VRS and been covered by the Authority’s group health plan for active employees at retirement or been eligible for reduced retirement benefits at age 50 and employed by the Authority in a benefits-eligible position for 10 years.
57

RIVANNA WATER & SEWER AUTHORITY Notes to the Financial Statements At June 30, 2014 and 2013 (Continued)
Note 11−Other Postemployment Benefits−Health Insurance: (Continued) Funding Policy The retirees pay and participate in the same plan for medical benefits as current employees creating an implicit rate subsidy liability for the Authority. The Authority determines how the liability will be funded each year, whether it will partially or fully fund the liability. Eligibility under the plan ceases when retirees reach the age of 65. Participating dependents are also entitled to continue coverage under the plan after the death of the retiree.
Annual Required Contribution (ARC) The annual cost of other postemployment benefits (OPEB) under GASB 45 is called the annual required contribution or ARC. Based on an actuarial valuation dated July 1, 2013, the estimated pay-as-you-go cost for OPEB benefits is ($114,000) for fiscal year 2014. The Authority has paid an estimated $31,000 towards this obligation during the fiscal year. The Authority is required to contribute the annual required contribution of the employer (ARC), an amount actuarially determined in accordance within the parameters of GASB Statement 45. The ARC represents a level of funding that, if paid on an ongoing basis, is projected to cover normal cost each year and amortize any unfunded actuarial liabilities (or funding excess) over a period of three years.
Annual OPEB Cost and Net OPEB Obligation The estimated contributions are based on projected medical premium payments and credit for the implicit rate subsidy made during the year for the retirees by the Authority. The following table depicts the components of the Authority’s annual OPEB cost for the year, the estimated annual contributions to the plan and changes in the Authority’s net OPEB obligation.
Annual required contribution $ 42,000 Interest on net OPEB obligation 20,000 Adjustment to annual required contribution (176,000)
Annual OPEB cost (expense) $ (114,000) Contributions made (31,000)
Decrease in net OPEB obligation $ (145,000)
Net OPEB obligation, beginning of year 502,406
Net OPEB obligation, end of year $ 357,406
For fiscal year 2014, the Authority’s expected cash payment of $31,000 was more than the OPEB cost (the Plan was terminated). The Authority’s annual OPEB cost, the percentage of annual OPEB cost contributed to the plan, and the net OPEB obligation for 2014, and the preceding two years are as follows:
Fiscal Annual Percentage of NetYear OPEB Annual OPEB OPEB
Ended Cost Cost Contributed Obligation
June 30, 2012 $ 179,603 48% $ 420,699 June 30, 2013 186,656 56% 502,406 June 30, 2014 (114,000) n/a 357,406
58

RIVANNA WATER & SEWER AUTHORITY Notes to the Financial Statements At June 30, 2014 and 2013 (Continued)
Note 11−Other Postemployment Benefits−Health Insurance: (Continued) Funded Status and Funding Progress The funded status of the plan as of July 1, 2013, the most recent actuarial valuation date, was as follows:
Actuarial accrued liability (AAL) $ 119,000 Actuarial value of plan assets - Unfunded actuarial accrued liability $ 119,000 Funded ratio (actuarial value of plan assets / AAL) 0%Covered payroll (active plan members) $ n/aUAAL as a percentage of covered payroll n/a
The required schedule of funding progress for the other postemployment benefits plan, presented as Required Supplementary Information immediately following the notes to the financial statements, presents multi-year trend information about whether the actuarial value of plan assets is increasing or decreasing over time relative to the actuarial accrued liability for benefits. Actuarial Methods and Assumptions Projections of benefits for financial reporting purposes are based on the substantive plan (the plan as understood by the employer and the plan members) and include the type of benefits provided at the time of each valuation and the historical pattern of sharing of benefit costs between the employer and plan members to that point. The actuarial methods and assumptions used include techniques that are designed to reduce the effects of short-term volatility in actuarial accrued liabilities and the actuarial value of assets, consistent with the long-term perspective of the calculations. Actuarial valuations of an ongoing plan involve estimates of the value of reported amounts and assumptions about the probability of occurrence of events far into the future. Examples include assumptions about future employment, mortality, and the healthcare cost trend. Amounts determined regarding the funded status of the plan and the annual required contributions of the employer are subject to continual revisions as actual results are compared with past expectations and new estimates are made about the future.
Cost Method The projected unit credit cost method was used to determine the plan’s funding liabilities with costs prorated to the date of benefit commencement. The valuation of the liabilities is based on a closed group of retirees only. Under the projected unit credit method the liability is projected from the date of the actuarial valuation to the expected end date of benefits. The liability is computed by measuring each unit of benefit during the period of obligation.
Assumptions
Interest/Discount rate (unfunded) 4.00%Inflation rate 2.80%Amortization period 3 years - level percentage of projected payroll on a closed basisHealthcare cost trend rate 6.40% - 4.30%Payroll growth rate 3.00%
59

RIVANNA WATER & SEWER AUTHORITY Notes to the Financial Statements At June 30, 2014 and 2013 (Continued)
Note 12−Related Parties: Rivanna Solid Waste Authority (RSWA) and Rivanna Water and Sewer Authority (RWSA) share common office space and administrative staff. Procedures are in place to ensure proper segregation of funds, purchasing activity, personnel and similar matters. RSWA pays RWSA monthly for its share of joint administrative expenses, which totaled $257,000 in FY 2014 and FY 2013 and for leachate acceptance and treatment of $1,322 in FY 2014 and $1,415 in FY 2013. Rivanna Solid Waste Authority billed Rivanna Water & Sewer Authority $63,258 for hauling and tipping fees in FY 2014 and $85,913 in the previous year. RSWA owed RWSA $21,591 and $15,320 at June 30, 2014 and 2013, respectively. Note 13−Construction Commitments: Rivanna Water and Sewer Authority had the following significant construction contract commitments for capital projects as of June 30, 2014:
Paid to RemainingProject Date Commitment
Ragged Mountain Dam Construction $ 21,915,709 $ 3,300,023 Rivanna Pump Station and Tunnel 1,305,391 23,925,736 Digester Heating and Mixing Upgrade 5,281,629 553,237 Partial Transite Pipe Replacement - 1,518,817
These contracts give the Authority the right to terminate the contract for any reason. Note 14−Pending GASB Statements: The Governmental Accounting Standards Board has issued Statement No. 68, Accounting and Financial Reporting for Pensions; an amendment of GASB Statement No. 27. This Statement replaces the requirements of Statements No. 27 and No. 50 related to pension plans that are administered through trusts or equivalent arrangements. The requirements of Statements No. 27 and No. 50 remain applicable for pensions that are not administered as trusts or equivalent arrangements. The requirements of this Statement are effective for financial statements for fiscal years beginning after June 15, 2014. The Authority believes the implementation of Statement No. 68 will significantly impact the Authority’s net position; however, no formal study or estimate of the impact of this standard has been performed.
60

Required Supplementary Information
61

This page intentionally left blank

RIVANNA WATER & SEWER AUTHORITY Schedule of Pension Funding Progress Last Five Fiscal Years
Actuarial Unfunded UAALActuarial Accrued Actuarial as % of
Actuarial Value of Liability Accrued Liability Funded Covered CoveredValuation Assets (AAL) (UAAL) Ratio Payroll Payroll
Date (a) (b) (b) - (a) (a) / (b) (c) (b - a) / (c)
06/30/09 $ 12,288,978 $ 14,220,772 $ 1,931,794 86.42% $ 3,880,191 49.79%06/30/10 12,487,469 15,815,225 3,327,756 78.96% 3,742,046 88.93%06/30/11 12,950,494 16,454,688 3,504,194 78.70% 3,760,261 93.19%06/30/12 13,101,119 17,427,239 4,326,120 75.18% 4,072,553 106.23%06/30/13 13,572,160 18,141,668 4,569,508 74.81% 4,109,405 111.20%
63

RIVANNA WATER & SEWER AUTHORITY Schedule of OPEB Funding Progress
Actuarial Actuarial Unfunded UAALValue of Accrued Actuarial Annual as % of
Actuarial Assets Liability Accrued Liability Funded Covered CoveredValuation (AVA) (AAL) (UAAL) Ratio Payroll Payroll
Date (a) (b) (b) - (a) (a) / (b) (c) (b - a) / (c)
07/01/08 $ - $ 1,355,828 $ 1,355,828 0.00% $ 3,486,972 38.88%07/01/10 - 1,767,166 1,767,166 0.00% 3,880,191 45.54%07/01/13 - 119,000 119,000 0.00% n/a n/a
64

Contents Tables
Financial TrendsThese tables contain trend information to help the reader understand how the the Authority's financial performance has changed over time. 1-2
Revenue, Rates and Useage InformationThese tables contain information to help the reader assess the factors affectingthe Authority's change in revenues and its ability to generate revenues. 3-5
ExpensesThis table contains comparative information about the Authority's expenses. 6
Debt CapacityThese tables present information to help the reader assess the affordability of
the Authority's current levels of outstanding debt and the Authority's ability to issuedebt in the future. 7-8
Demographic and Economic InformationThese tables offer demographic and economic indicators to help the readerunderstand the environment within which the Authority's financial activities takeplace and to help make comparisons over time. 9-10
Operating InformationThese tables contain information about the Authority's operations and resourcesto help the reader understand how the Authority's financial information relate tothe activities it performs. 11-12
Other InformationThese tables contain miscellaneous data such as insurance coverage and datafrom related organizations, Albemarle County Service Authority and City of Charlottesville. 13-15
Sources:Unless otherwise noted, the information in these tables is derived from the comprehensiveannual financial reports for the relevant year. The Authority implemented GASB Statement34 in fiscal year 2002; tables presenting net asset information include information beginningin that year.
Statistical Section
65

This page intentionally left blank

RIV
AN
NA
WA
TE
R &
SE
WE
R A
UT
HO
RIT
Y
Tab
le 1
Net
Pos
ition
by
Com
pone
ntLa
st T
en F
isca
l Yea
rs
2014
2013
2012
2011
2010
2009
2008
2007
2006
2005
Net
inve
stm
ent i
n ca
pita
l ass
ets
$93
,538
,673
$87
,302
,949
$86
,135
,840
$77
,662
,172
$62
,172
,653
$47
,324
,770
$40
,935
,774
$36
,586
,542
$36
,777
,712
$37
,147
,880
Res
tric
ted
2,87
0,78
82,
782,
090
3,17
3,80
43,
048,
111
2,52
2,53
03,
230,
185
3,12
4,16
53,
030,
350
2,91
9,26
92,
763,
638
Unr
estr
icte
d32
,388
,908
31,5
10,1
3324
,483
,936
23,1
56,6
2526
,697
,587
20,4
19,2
7420
,840
,956
19,4
31,9
3813
,138
,107
8,95
2,11
1T
otal
net
pos
ition
$12
8,79
8,36
9$
121,
595,
172
$11
3,79
3,58
0$
103,
866,
908
$91
,392
,770
$70
,974
,229
$64
,900
,895
$59
,048
,830
$52
,835
,088
$48
,86
3,62
9
Fis
cal Y
ears
En
ded
Ju
ne
30,
67

RIV
AN
NA
WA
TE
R &
SE
WE
R A
UT
HO
RIT
YT
able
2
Cha
nges
in N
et P
ositi
onLa
st T
en F
isca
l Yea
rs
2014
2013
2012
2011
2010
2009
2008
2007
2006
2005
Ope
ratin
g re
venu
es:
Met
ered
wat
er s
ales
$11
,353
,630
$11
,728
,840
$11
,058
,083
$10
,895
,551
$10
,746
,260
$9,
867,
555
$9,
826,
958
$10
,114
,752
$9,
876,
219
$8,
816,
327
Was
tew
ater
ser
vice
cha
rges
14,6
20,3
5313
,889
,105
12,8
07,6
2811
,069
,488
12,7
01,8
599,
671,
122
8,21
1,37
88,
143,
177
6,79
5,11
86,
818,
840
T
otal
ope
ratin
g re
venu
es$
25,9
73,9
83$
25,6
17,9
45$
23,8
65,7
11$
21,9
65,0
39$
23,4
48,1
19$
19,5
38,6
77$
18,0
38,3
36$
18,2
57,9
29$
16,6
71,3
37$
15,6
35,1
67
Ope
ratin
g ex
pens
es:
Per
sonn
el c
osts
$5,
756,
273
$5,
928,
994
$5,
879,
080
$5,
525,
332
$5,
428,
691
$5,
449,
513
$5,
224,
525
$4,
939,
525
$4,
619,
754
$4,
256,
623
Pro
fess
iona
l ser
vice
s41
8,85
828
2,42
733
6,16
633
8,81
423
8,97
521
0,71
021
5,37
721
1,37
023
2,97
018
2,45
0 O
ther
ser
vice
s an
d ch
arge
s2,
683,
136
2,43
0,71
82,
463,
176
2,34
1,12
32,
137,
741
2,29
1,94
62,
054,
600
1,66
6,17
81,
765,
687
1,42
7,06
7 O
pera
tions
and
mai
nten
ance
3,54
3,31
13,
383,
574
3,20
1,97
12,
415,
211
2,41
2,75
22,
515,
504
2,36
6,11
12,
233,
192
2,48
9,62
51,
976,
379
Dep
reci
atio
n4,
662,
094
3,60
1,73
02,
965,
612
2,96
2,91
22,
966,
823
2,90
6,35
12,
702,
333
2,57
2,14
32,
512,
244
2,42
4,57
6
T
otal
ope
ratin
g ex
pens
es$
17,0
63,6
72$
15,6
27,4
43$
14,8
46,0
05$
13,5
83,3
92$
13,1
84,9
82$
13,3
74,0
24$
12,5
62,9
46$
11,6
22,4
08$
11,6
20,2
80$
10,2
67,0
95
Ope
ratin
g in
com
e$
8,91
0,31
1$
9,99
0,50
2$
9,01
9,70
6$
8,38
1,64
7$
10,2
63,1
37$
6,16
4,65
3$
5,47
5,39
0$
6,63
5,52
1$
5,05
1,05
7$
5,36
8,07
2
Non
oper
atin
g re
venu
es (
expe
nses
): I
nves
tmen
t ear
ning
s$
92,8
39$
157,
526
$12
4,83
2$
120,
623
$14
9,58
7$
418,
585
$1,
169,
571
$1,
350,
896
$72
8,97
8$
306,
789
Non
-cap
ital g
rant
rev
enue
-
-
-
-
-
-
-
21
,000
-
-
Buc
k M
ount
ain
reve
nue
89,0
0078
,000
68,2
0052
,400
93,3
0090
,300
120,
300
128,
900
104,
600
120,
200
Adm
inis
trat
ive
reim
burs
emen
t25
7,00
025
7,00
027
6,00
027
7,00
041
8,00
042
0,00
041
9,00
139
9,80
036
5,50
035
9,91
5 O
ther
rev
enue
s25
1,37
322
5,03
421
4,90
825
6,54
111
0,39
614
0,20
510
4,58
259
,139
101,
659
100,
115
Int
eres
t exp
ense
(2,3
36,2
45)
(2,5
52,3
31)
(1,8
30,6
96)
(2,6
07,5
02)
(2,1
07,3
81)
(2,0
90,5
83)
(2,2
13,0
64)
(2,3
47,4
43)
(2,3
46,0
22)
(2,3
48,3
80)
Deb
t iss
uanc
e co
sts
(61,
081)
(580
,404
) A
mor
tizat
ion
expe
nse
-
-
-
(8
6,82
7)(3
9,52
5)(3
9,99
5)(3
3,76
8)(3
4,07
1)(3
4,31
3)(2
0,85
2)
T
otal
non
oper
atin
g re
venu
es (
expe
nses
)$
(1,7
07,1
14)$
(2,4
15,1
75)$
(1,1
46,7
56)$
(1,9
87,7
65)$
(1,3
75,6
23)$
(1,0
61,4
88)$
(433
,378
)$
(421
,779
)$
(1,0
79,5
98)$
(1,4
82,2
13)
Inco
me
befo
re c
apita
l gra
nts
and
cont
ribut
ions
$7,
203,
197
$7,
575,
327
$7,
872,
950
$6,
393,
882
$8,
887,
514
$5,
103,
165
$5,
042,
012
$6,
213,
742
$3,
971,
459
$3,
885,
859
Cap
ital g
rant
s$
-
$
226,
265
$3,
003,
552
$6,
080,
256
$11
,531
,027
$97
0,16
9$
810,
053
$-
$-
$-
Cap
ital c
ontr
ibut
ions
-
-
-
-
-
-
-
-
-
-
Cha
nge
in n
et p
ositi
on$
7,20
3,19
7$
7,80
1,59
2$
10,8
76,5
02$
12,4
74,1
38$
20,4
18,5
41$
6,07
3,33
4$
5,85
2,06
5$
6,21
3,74
2$
3,97
1,45
9$
3,88
5,85
9
Fis
cal Y
ears
En
ded
Ju
ne
30,
68

RIV
AN
NA
WA
TE
R &
SE
WE
R A
UT
HO
RIT
YT
able
3
Rev
enue
s by
Sou
rce
Last
Ten
Fis
cal Y
ears
Oth
erF
isca
l Yea
rsW
aste
wat
erT
ota
lB
uck
No
n-c
apit
alT
ota
lC
apit
alE
nd
edW
ater
Ser
vice
Op
erat
ing
Inve
stm
ent
Mo
un
tain
Oth
erG
ran
t N
on
op
erat
ing
Gra
nts
an
d
To
tal
Jun
e 30
,S
ales
Ch
arg
esR
even
ues
Ear
nin
gs
Rev
enu
eR
even
ue
Rev
enu
eR
even
ues
Co
ntr
ibu
tio
ns
Rev
enu
es
2005
$8,
816,
327
$6,
818,
840
$15
,635
,167
$30
6,78
9$
120,
200
$46
0,03
0$
-
$
887,
019
$-
$16
,522
,186
2006
9,87
6,21
96,
795,
118
16,6
71,3
3772
8,97
810
4,60
046
7,15
9-
1,30
0,73
7-
17,9
72,0
7420
0710
,114
,752
8,14
3,17
718
,257
,929
1,35
0,89
612
8,90
045
8,93
921
,000
1,95
9,73
5-
20,2
17,6
6420
089,
826,
958
8,21
1,37
818
,038
,336
1,16
9,57
112
0,30
052
3,58
3-
1,81
3,45
481
0,05
320
,661
,843
2009
9,86
7,55
59,
671,
122
19,5
38,6
7741
8,58
590
,300
560,
205
-
1,
069,
090
970,
169
21,5
77,9
3620
1010
,746
,260
12,7
01,8
5923
,448
,119
149,
587
93,3
0052
8,39
6-
771,
283
11,5
31,0
2735
,750
,429
2011
10,8
95,5
5111
,069
,488
21,9
65,0
3912
0,62
352
,400
533,
541
-
70
6,56
46,
080,
256
28,7
51,8
5920
1211
,058
,083
12,8
07,6
2823
,865
,711
124,
832
68,2
0049
0,90
8-
683,
940
3,00
3,55
227
,553
,203
2013
11,7
28,8
4013
,889
,105
25,6
17,9
4515
7,52
678
,000
482,
034
-
71
7,56
022
6,26
526
,561
,770
2014
11,3
53,6
3014
,620
,353
25,9
73,9
8392
,839
89,0
0050
8,37
3-
690,
212
-
26
,664
,195
Op
erat
ing
Rev
enu
esN
on
op
erat
ing
Rev
enu
es
69

RIV
AN
NA
WA
TE
R &
SE
WE
R A
UT
HO
RIT
YT
able
4
Wat
er a
nd W
aste
wat
er R
ates
and
Flo
ws
Last
Ten
Fis
cal Y
ears
2014
2013
2012
2011
2010
2009
2008
2007
2006
2005
Rat
es
Urb
an W
ater
- C
ity (
per
1000
gal
lons
)2.
341
$
2.
443
$
N
ote
12.
438
$
2.
461
$
2.
285
$
2.
226
$
2.
149
$
2.
071
$
1.
995
$
U
rban
Wat
er -
AC
SA
(pe
r 10
00 g
allo
ns)
3.33
3$
3.46
5$
Not
e 1
3.30
5$
3.32
0$
2.98
3$
2.91
2$
2.71
7$
2.58
2$
2.42
2$
Sco
ttsvi
lle W
ater
(pe
r m
onth
)41
,047
$
36
,280
$
31
,665
$
32
,834
$
32
,089
$
31
,421
$
34
,127
$
31
,227
$
32
,571
$
32
,794
$
C
roze
t Wat
er (
per
mon
th)
84,6
30$
82,9
16$
60,8
53$
50,7
12$
52,3
15$
50,2
26$
43,3
72$
43,5
87$
45,3
37$
41,8
57$
Urb
an W
aste
wat
er -
City
(pe
r 10
00 g
allo
ns)
3.59
3$
3.56
5$
3.17
9$
2.87
8$
2.78
4$
2.46
6$
2.23
3$
1.86
5$
1.68
5$
1.54
3$
Urb
an W
aste
wat
er -
AC
SA
(pe
r 10
00 g
allo
ns)
3.46
3$
3.73
2$
3.34
8$
3.04
8$
3.06
3$
2.72
2$
2.46
0$
2.10
1$
1.95
5$
1.81
5$
Sco
ttsvi
lle W
aste
wat
er (
per
mon
th)
28,2
95$
27,6
19$
26,5
79$
25,6
03$
25,2
16$
25,9
68$
24,8
97$
24,0
22$
21,9
36$
21,3
02$
Gle
nmor
e W
aste
wat
er (
per
mon
th)
24,1
89$
23,4
36$
23,2
46$
21,8
06$
22,9
68$
24,6
06$
19,7
26$
18,7
72$
17,4
88$
17,2
62$
Not
e 1:
The
Urb
an W
ater
rat
es w
ere
revi
sed
durin
g fis
cal y
ear
2012
as
follo
ws:
Effe
ctiv
e 7/
1/11
-12/
31/1
1U
rban
Wat
er -
City
(pe
r 10
00 g
allo
ns)
E
ffect
ive
7/1/
11-1
2/31
/11
2.44
3$
E
ffect
ive
1/1/
12-6
/30/
122.
403
$
U
rban
Wat
er -
AC
SA
(pe
r 10
00 g
allo
ns)
E
ffect
ive
7/1/
11-1
2/31
/11
3.39
0$
E
ffect
ive
1/1/
12-6
/30/
123.
439
$
2014
2013
2012
2011
2010
2009
2008
2007
2006
2005
Flo
ws
(in
mill
ion
gal
lon
s p
er d
ay):
Urb
an W
ater
9.61
89.
647
9.45
49.
569
9.35
29.
344
9.54
610
.435
10.6
079.
933
Cro
zet W
ater
0.56
60.
503
0.45
00.
436
0.42
00.
384
0.37
80.
386
0.39
50.
341
Sco
ttsvi
lle W
ater
0.05
60.
053
0.04
90.
056
0.07
70.
077
0.08
70.
108
0.11
80.
136
10.2
4010
.203
9.95
310
.060
9.84
89.
805
10.0
1110
.929
11.1
2010
.410
Urb
an W
aste
wat
er10
.566
9.71
910
.014
9.44
211
.158
9.30
78.
553
10.0
478.
993
9.80
2S
cotts
ville
Was
tew
ater
0.06
60.
050
0.05
40.
054
0.08
30.
064
0.06
00.
087
0.07
50.
080
Gle
nmor
e W
aste
wat
er0.
114
0.12
10.
122
0.13
70.
125
0.11
50.
117
0.12
30.
111
0.10
610
.746
9.89
010
.190
9.63
211
.367
9.48
68.
730
10.2
579.
179
9.98
8
Fis
cal Y
ears
En
ded
Ju
ne
30,
70

RIV
AN
NA
WA
TE
R &
SE
WE
R A
UT
HO
RIT
Y
Tab
le 5
Ten
Lar
gest
Cus
tom
ers
Cur
rent
Yea
r an
d N
ine
Yea
rs A
go
Am
ou
nt
%A
mo
un
t%
Alb
emar
le C
ount
y S
ervi
ce A
utho
rity
6,97
5,92
7$
61.4
4%6,
874,
008
$
47
.02%
City
of C
harlo
ttesv
ille
4,37
7,70
3$
38.5
6%7,
397,
832
$
50
.60%
Oth
ers
-$
0.
00%
348,
513
$
2.38
%
11,3
53,6
30$
100.
00%
14,6
20,3
53$
100.
00%
Am
ou
nt
%A
mo
un
t%
Alb
emar
le C
ount
y S
ervi
ce A
utho
rity
4,94
6,77
1$
56.1
1%3,
230,
656
$
47
.38%
City
of C
harlo
ttesv
ille
3,86
9,55
6$
43.8
9%3,
241,
149
$
47
.53%
Oth
ers
-$
0.
00%
347,
036
$
5.09
%
8,81
6,32
7$
10
0.00
%6,
818,
841
$
100.
00%
Not
e: T
he A
utho
rity'
s tw
o w
hole
sale
cus
tom
ers,
whi
ch a
re b
oth
gove
rnm
enta
l ent
ities
, pro
vide
d 10
0% o
fw
ater
rev
enue
and
98%
of w
aste
wat
er r
even
ue in
FY
201
4 an
d 95
% in
FY
200
5. T
he r
emai
ning
rev
enue
ca
me
from
sep
tage
acc
epta
nce
cust
omer
s in
FY
201
4 an
d al
so fr
om c
ompo
st s
ales
in F
Y 2
005.
Due
to la
ck o
f mat
eria
lity,
the
num
ber
of c
usto
mer
s by
type
that
pro
vide
that
rev
enue
is n
ot p
rese
nted
her
e.
Wat
er R
even
ue
Was
tew
ater
Rev
enu
e
Wat
er R
even
ue
Was
tew
ater
Rev
enu
e
Fis
cal Y
ear
2014
(C
urr
ent
Yea
r)
Fis
cal Y
ear
2005
(N
ine
Yea
rs A
go
)
71

RIV
AN
NA
WA
TE
R &
SE
WE
R A
UT
HO
RIT
Y
Tab
le 6
Exp
ense
s by
Typ
eLa
st T
en F
isca
l Yea
rs
Fis
cal Y
ears
Inte
rest
Bo
nd
E
nd
edan
d
Issu
ance
Jun
e 30
,O
per
atio
ns
Dep
reci
atio
nA
mo
rtiz
atio
nC
ost
sT
ota
l
2005
$7,
842,
519
$2,
424,
576
$
2,36
9,23
2
$-
$
12,6
36,3
27
2006
9,10
8,03
6
2,
512,
244
2,
380,
335
-
14
,000
,615
20
079,
050,
265
2,57
2,14
3
2,38
1,51
4
-
14,0
03,9
22
2008
9,86
0,61
3
2,
702,
333
2,
246,
832
-
14
,809
,778
20
0910
,467
,673
2,
906,
351
2,
130,
578
-
15
,504
,602
20
1010
,218
,159
2,
966,
823
2,
146,
906
-
15
,331
,888
20
1110
,620
,480
2,
962,
912
2,
694,
329
-
16
,277
,721
20
1211
,880
,393
2,
965,
612
1,
830,
696
-
16
,676
,701
20
1312
,025
,713
3,
601,
730
2,
552,
331
58
0,40
4
18
,760
,178
20
1412
,401
,578
4,
662,
094
2,
336,
245
61
,081
19,4
60,9
98
72

RIV
AN
NA
WA
TE
R &
SE
WE
R A
UT
HO
RIT
YT
able
7
Out
stan
ding
Deb
t by
Typ
eLa
st T
en F
isca
l Yea
rs
2014
2013
2012
2011
2010
2009
2008
2007
2006
2005
Rev
enue
bon
ds p
ayab
le$
125,
680,
526
$
127,
548,
686
$
103,
834,
145
$
73,8
31,2
74
$57
,250
,353
$
44,3
50,0
79
$47
,765
,367
$
51,0
09,9
97
$52
,364
,550
$
46,2
80,9
40
Con
trac
ts p
ayab
le-
-
-
-
-
-
-
-
35,2
65
63,0
53
Line
of c
redi
t pay
able
-
-
-
-
-
-
-
-
-
665,
542
Tot
al o
utst
andi
ng d
ebt
$12
5,68
0,52
6
$12
7,54
8,68
6$
103,
834,
145
$73
,831
,274
$57
,250
,353
$44
,350
,079
$
47,7
65,3
67$
51,0
09,9
97$
52,3
99,8
15$
47,0
09,5
35
Deb
t per
cap
ita
859.
61$
87
2.38
$
719.
88$
51
7.19
$
40
5.67
$
31
8.58
$
34
9.81
$
37
8.08
$
39
6.15
$
36
2.25
$
Deb
t as
a pe
rcen
tage
of p
erso
nal i
ncom
e1.
68%
1.70
%1.
46%
1.13
%0.
90%
0.68
%0.
75%
0.85
%0.
95%
0.92
%
Not
es:
D
ebt p
er c
apita
was
cal
cula
ted
base
d on
pop
ulat
ion
figur
es fo
r th
e ca
lend
ar y
ear
(CY
) en
ding
with
in th
e fis
cal y
ear
(FY
) ob
tain
ed fr
om U
.S. D
epar
tmen
t of C
omm
erce
- B
urea
u of
Eco
nom
ic A
naly
sis
for
the
City
of C
harlo
ttesv
ille
and
Cou
nty
of A
lbem
arle
. S
ince
the
popu
latio
n fo
r C
Y 2
013
is n
ot y
et a
vaila
ble,
the
popu
latio
n fo
r C
Y 2
012
was
use
d fo
r th
e F
Y 2
013
and
2014
cal
cula
tion.
See
Tab
le 9
.
Deb
t as
a pe
rcen
tage
of p
erso
nal i
ncom
e w
as c
alcu
late
d ba
sed
on p
erso
nal i
ncom
e fo
r th
e C
Y e
ndin
g w
ithin
the
FY
obt
aine
d fr
om U
.S. D
epar
tmen
t of C
omm
erce
- B
urea
u of
Eco
nom
ic A
naly
sis
for
the
City
of C
harlo
ttesv
ille
and
Cou
nty
of A
lbem
arle
. S
ince
per
sona
l inc
ome
for
CY
201
3 is
not
yet
ava
ilabl
e, th
e pe
rson
al in
com
e fo
r C
Y 2
012
was
use
d fo
r th
e F
Y 2
013
and
2014
cal
cula
tion.
See
Tab
le 9
.
Fis
cal Y
ears
En
ded
Ju
ne
30,
73

RIV
AN
NA
WA
TE
R &
SE
WE
R A
UT
HO
RIT
Y
Tab
le 8
Rev
enue
Bon
d D
ebt S
ervi
ce C
over
age
Last
Ten
Fis
cal Y
ears
Fis
cal Y
ears
Dir
ect
Req
uir
edE
nd
edG
ross
Op
erat
ing
Net
Deb
t S
ervi
ceJu
ne
30,
Rev
enu
e (1
)E
xpen
se (
2)A
vaila
ble
Pay
men
ts (
3)C
ove
rag
e
2005
$16
,522
,186
$7,
842,
519
$8,
679,
667
$5,
079,
040
1.7X
2006
17,9
72,0
749,
108,
036
8,86
4,03
84,
942,
800
1.8X
2007
20,1
96,6
649,
050,
265
11,1
46,3
995,
526,
143
2.0X
2008
19,8
51,7
909,
860,
613
9,99
1,17
75,
603,
277
1.8X
2009
20,6
07,7
6710
,467
,673
10,1
40,0
945,
591,
120
1.8X
2010
24,2
19,4
0210
,218
,159
14,0
01,2
435,
592,
641
2.5X
2011
22,6
71,6
0310
,620
,480
12,0
51,1
236,
962,
703
1.7X
2012
24,5
49,6
5111
,880
,393
12,6
69,2
586,
724,
261
1.9X
2013
26,3
35,5
0512
,025
,713
14,3
09,7
928,
234,
169
1.7X
2014
26,6
64,1
9512
,401
,578
14,2
62,6
179,
089,
702
1.6X
(1)
Exc
ludi
ng g
rant
rev
enue
(2)
Exc
ludi
ng d
epre
ciat
ion
expe
nse
(3)
Inc
ludi
ng p
aym
ents
on
reve
nue
bond
s an
d co
ntra
cts
paya
ble
Fis
cal y
ear
2012
Req
uire
d D
ebt S
ervi
ce P
aym
ents
am
ount
exc
lude
s re
fund
ing
and
ear
ly p
ayof
f sin
ce th
e pa
ymen
ts w
ere
not r
equi
red
to b
e m
ade
in th
at y
ear.
74

RIV
AN
NA
WA
TE
R A
ND
SE
WE
R A
UT
HO
RIT
YT
able
9
Dem
ogra
phic
Dat
a fo
r th
e S
ervi
ce A
rea
City
of C
harlo
ttesv
ille
& A
lbem
arle
Cou
nty,
Virg
inia
Last
Ten
Cal
enda
r Y
ears
Per
son
al In
com
eP
er C
apit
a P
erso
nal
Un
emp
loym
ent
Cal
end
ar Y
ear
Po
pu
lati
on
(2)
(th
ou
san
ds
of
$) (
2)In
com
e ($
) (2
)R
ate
(1)
2004
129,
772
5,13
0,59
439
,535
3.3%
2005
132,
273
5,49
2,22
741
,522
3.1%
2006
134,
918
5,98
8,97
544
,390
2.6%
2007
136,
547
6,33
0,66
746
,363
2.5%
2008
139,
211
6,50
8,61
446
,754
3.3%
2009
141,
125
6,39
6,06
945
,322
5.9%
2010
142,
756
6,53
0,87
445
,749
6.0%
2011
144,
238
7,10
9,71
949
,292
5.4%
2012
146,
207
7,49
3,86
951
,255
5.1%
2013
not a
vaila
ble
not a
vaila
ble
not a
vaila
ble
4.6%
(1)
Virg
inia
Em
ploy
men
t Com
mis
sion
- V
irgin
ia W
orkf
orce
Con
nect
ion
- fo
r C
harlo
ttesv
ille
Met
ropo
litan
Ser
vice
Are
a(2
) U
.S. D
epar
tmen
t of C
omm
erce
- B
urea
u of
Eco
nom
ic A
naly
sis
- fo
r C
ity o
f Cha
rlotte
svill
e an
d A
lbem
arle
Cou
nty
75

RIV
AN
NA
WA
TE
R &
SE
WE
R A
UT
HO
RIT
Y
Tab
le 1
0
Prin
cipa
l Em
ploy
ers
in th
e C
harlo
ttesv
ille
Are
aC
urre
nt Y
ear
and
Nin
e Y
ears
Ago
Num
ber
ofN
umbe
r of
Em
plo
yer
Em
ploy
ees
Ran
kE
mpl
oyee
sR
ank
Uni
vers
ity o
f Virg
inia
/ Blu
e R
idge
Hos
pita
l1,
000
& o
ver
11,
000
& o
ver
1U
nive
rsity
of V
irgin
ia M
edic
al C
ente
r1,
000
& o
ver
21,
000
& o
ver
2C
ount
y of
Alb
emar
le1,
000
& o
ver
31,
000
& o
ver
3M
arth
a Je
ffers
on H
ospi
tal
1,00
0 &
ove
r4
1,00
0 &
ove
r4
City
of C
harlo
ttesv
ille
1,00
0 &
ove
r5
1,00
0 &
ove
r5
UV
A H
ealth
Ser
vice
s F
ound
atio
n1,
000
& o
ver
61,
000
& o
ver
7S
tate
Far
m M
utua
l Aut
omob
ile In
sura
nce
1,00
0 &
ove
r7
1,00
0 &
ove
r8
Cha
rlotte
svill
e C
ity S
choo
l Boa
rd50
0-99
98
500-
999
9U
.S. D
epar
tmen
t of D
efen
se50
0-99
99
Wal
Mar
t50
0-99
910
Nor
thro
p G
rum
man
Cor
pora
tion
1,00
0 &
ove
r6
Ara
mar
k C
ampu
s50
0-99
910
Sou
rce:
Virg
inia
Em
ploy
men
t Com
mis
sion
, Qua
rter
ly C
ensu
s of
Em
ploy
men
t and
Wag
es
-
for
Cha
rlotte
svill
e M
etro
polit
an S
ervi
ce A
rea
(MS
A)
Eac
h em
ploy
er's
per
cent
age
of to
tal e
mpl
oym
ent i
s no
t ava
ilabl
e.
Fou
rth
Qua
rter
of 2
013
Fou
rth
Qua
rter
of 2
004
76

RIV
AN
NA
WA
TE
R &
SE
WE
R A
UT
HO
RIT
Y
Tab
le 1
1
Num
ber
of E
mpl
oyee
s by
Iden
tifia
ble
Act
ivity
Last
Ten
Fis
cal Y
ears
2014
2013
2012
2011
2010
2009
2008
2007
2006
2005
Num
ber
of b
udge
ted
full-
time
equi
vale
nt p
ositi
ons:
Wat
er22
.023
.023
.023
.023
.027
.027
.027
.027
.027
.0W
aste
wat
er17
.018
.018
.015
.016
.025
.025
.026
.025
.025
.0M
aint
enan
ce (
1)17
.016
.016
.015
.014
.0G
roun
ds c
rew
mai
nten
ance
(2)
2.0
2.0
4.0
4.0
4.0
Ope
ratio
ns M
anag
emen
t2.
02.
02.
02.
02.
02.
02.
02.
02.
02.
0A
dmin
istr
atio
n (3
)12
.012
.012
.012
.013
.013
.012
.012
.012
.012
.0La
bora
tory
3.0
3.0
3.0
3.0
3.0
3.0
3.0
3.0
3.0
3.0
Eng
inee
ring
9.0
9.0
9.0
9.0
11.0
11.0
10.0
7.0
7.0
7.0
Tot
al
82.0
83.0
83.0
79.0
82.0
83.0
81.0
81.0
80.0
80.0
(1)
Mai
nten
ance
incl
udes
mec
hani
cs a
nd m
aint
enan
ce w
orke
rs fo
r W
ater
and
Was
tew
ater
.
(2)
Gro
unds
cre
w m
aint
enan
ce p
ositi
ons
wor
ked
appr
oxim
atel
y 60
% (
80%
in F
Y 2
004-
2005
) on
was
tew
ater
depa
rtm
ent m
aint
enan
ce a
nd 4
0% (
20%
in F
Y 2
004-
2005
) on
wat
er d
epar
tmen
t mai
nten
ance
. B
egin
ning
in F
Y 2
010,
gro
unds
cre
w m
aint
enan
ce p
ositi
ons
are
incl
uded
in M
aint
enan
ce.
(3)
Adm
inis
trat
ion
staf
f is
shar
ed w
ith R
ivan
na S
olid
Was
te A
utho
rity.
Fis
cal Y
ears
En
ded
Ju
ne
30,
77

RIV
AN
NA
WA
TE
R &
SE
WE
R A
UT
HO
RIT
YT
able
12
Ope
ratin
g an
d C
apita
l Ind
icat
ors
Last
Ten
Fis
cal Y
ears
2014
2013
2012
2011
2010
2009
2008
2007
2006
2005
Wat
erS
ize
of w
ater
shed
(sq
uare
mile
s)76
676
676
676
676
676
676
676
676
676
6R
aw w
ater
saf
e yi
eld
(mgd
)U
rban
sys
tem
12.8
012
.80
12.8
012
.80
12.8
012
.80
12.8
012
.80
12.8
012
.80
Rur
al s
yste
m3.
403.
403.
403.
403.
403.
403.
403.
003.
003.
00M
iles
of p
ipel
ines
64.3
064
.30
64.3
064
.30
64.3
064
.30
64.3
064
.30
64.3
064
.30
Num
ber
of tr
eatm
ent p
lant
s5
55
55
55
55
5N
umbe
r of
pum
ping
sta
tions
77
77
77
77
77
Num
ber
of r
eser
voirs
44
44
44
44
44
Num
ber
of fi
nish
ed w
ater
sto
rage
tank
s11
1111
1111
1111
1111
11M
axim
um tr
eatm
ent c
apac
ity (
mgd
)22
.750
22.7
5022
.750
22.7
5022
.750
22.7
5022
.750
22.7
5022
.750
22.7
50W
ater
trea
ted
(mgd
)10
.239
10.2
039.
953
10.0
609.
984
9.80
510
.011
10.9
2911
.120
10.4
10U
nuse
d ca
paci
ty (
mgd
)12
.511
12.5
4712
.797
12.6
9012
.766
12.9
4512
.739
11.8
2111
.630
12.3
40P
erce
ntag
e of
cap
acity
util
ized
45.0
1%44
.85%
43.7
5%44
.22%
43.8
9%43
.10%
44.0
0%48
.04%
48.8
8%45
.76%
Was
tew
ater
Mile
s of
pip
elin
es37
3737
3737
3737
3737
37N
umbe
r of
trea
tmen
t pla
nts
44
55
55
55
55
Num
ber
of p
umpi
ng s
tatio
ns7
77
77
77
77
7M
axim
um tr
eatm
ent c
apac
ity (
mgd
)15
.945
15.9
4515
.945
15.9
4515
.945
15.9
4515
.945
15.9
4515
.945
15.9
45W
aste
wat
er tr
eate
d (m
gd)
10.7
469.
890
10.1
909.
632
8.73
09.
486
8.73
010
.257
9.17
99.
988
Unu
sed
capa
city
(m
gd)
5.19
96.
055
5.75
56.
313
7.21
56.
459
7.21
55.
688
6.76
65.
957
Per
cent
age
of c
apac
ity u
tiliz
ed67
.39%
62.0
3%63
.91%
60.4
1%54
.75%
59.4
9%54
.75%
64.3
3%57
.57%
62.6
4%
Not
es:
mgd
= m
illio
ns o
f gal
lons
per
day
Saf
e yi
eld
is a
mea
sure
of r
aw w
ater
res
ourc
es d
urin
g a
drou
ght o
f rec
ord.
Fis
cal Y
ears
En
ded
Ju
ne
30,
78

RIV
AN
NA
WA
TE
R &
SE
WE
R A
UT
HO
RIT
YT
able
13
Sch
edul
e of
Insu
ranc
e in
For
ceJu
ne 3
0, 2
014
An
nu
alT
ype
Co
vera
ge/
Co
mp
any
Nam
eP
rem
ium
Com
mer
cial
Pro
pert
yV
irgin
ia A
ssoc
iatio
n of
Cou
ntie
s17
6,13
8,39
6$
P
rope
rty
Val
ue a
nd78
,773
$
07/0
1/13
-07/
01/1
4B
usin
ess
Inco
me/
Ext
ra E
xpen
seW
orke
r's C
ompe
nsat
ion
Virg
inia
Mun
icip
al G
roup
1,
000,
000
$
E
ach
Occ
urre
nce
53,9
66$
S
elf I
nsur
ance
Ass
ocia
tion
07/0
1/13
-07/
01/1
4
Com
preh
ensi
ve A
utom
obile
Virg
inia
Ass
ocia
tion
of C
ount
ies
10,0
00,0
00$
17,8
50$
07
/01/
13-0
7/01
/14
Gen
eral
Lia
bilit
yV
irgin
ia A
ssoc
iatio
n of
Cou
ntie
s10
,000
,000
$
E
ach
Occ
urre
nce
19,8
06$
07
/01/
13-0
7/01
/14
Pub
lic O
ffici
als
Liab
ility
Virg
inia
Ass
ocia
tion
of C
ount
ies
5,00
0,00
0$
Eac
h O
ccur
renc
e9,
905
$
07
/01/
13-0
7/01
/14
Crim
e C
over
age
Virg
inia
Ass
ocia
tion
of C
ount
ies
500,
000
$
1,63
5$
07/0
1/13
-07/
01/1
4
Co
vera
ge
79

RIV
AN
NA
WA
TE
R &
SE
WE
R A
UT
HO
RIT
YT
able
14
Mis
cella
neou
s S
tatis
tical
Dat
aA
lbem
arle
Cou
nty
Ser
vice
Aut
horit
y
Yea
r of
Inco
rpor
atio
n:
196
4
Typ
e of
Ent
ity:
Inde
pend
ent a
utho
rity
crea
ted
purs
uant
to th
e "V
irgin
ia W
ater
& W
aste
Aut
horit
ies
Act
",
Sec
tion
15.1
-123
9, C
ode
of V
irgin
ia (
1950
), a
s am
ende
d
Num
ber
of w
ater
con
nect
ions
18,1
31N
umbe
r of
sew
er c
onne
ctio
ns15
,168
Mile
s of
wat
er li
nes
352
Mile
s of
sew
er li
nes
258
Num
ber
of fi
re h
ydra
nts
2,33
0
Rat
es (
effe
ctiv
e F
Y 2
014)
per
1,0
00 g
allo
ns
met
ered
co
nsu
mp
tio
n:
Wat
e rR
esid
entia
l Wat
er R
ates
and
all
irrig
atio
n us
age:
Leve
l 1 (
0-3,
000
gallo
ns p
er m
onth
)$3
.33
Leve
l 2 (
3,00
1-6,
000
gallo
ns p
er m
onth
)$6
.66
Leve
l 3 (
6,00
1-9,
000
gallo
ns p
er m
onth
)$9
.99
Leve
l 4 (
over
9,0
00 g
allo
ns p
er m
onth
)$1
3.32
Non
-Res
iden
tial a
nd M
ulti-
Fam
ily R
esid
entia
l Wat
er R
ate
(e
xcep
t irr
igat
ion
wat
er)
$6.4
3
Was
tew
ate r
$7.4
9
Ten
Lar
ges
t C
ust
om
ers
in F
Y 2
014:
Bill
edP
erce
nta
ge
Bill
edP
erce
nta
ge
(in
gal
lon
s)R
ank
of
To
tal
(in
gal
lon
s)R
ank
of
To
tal
Sou
thw
ood
Mob
ile H
omes
23,2
84,0
00
1
1.
52%
12,4
85,7
36
10
0.96
%M
arth
a Je
ffers
on H
ospi
tal
22,5
55,4
00
2
1.
47%
21,3
44,4
00
1
1.
64%
Cou
nty
of A
lbem
arle
21,6
64,2
00
3
1.
41%
16,7
69,4
00
6
1.
29%
Tro
phy
Cha
se A
part
men
ts18
,474
,875
4
1.20
%18
,474
,875
3
1.42
%U
nive
rsity
of V
irgin
ia18
,457
,900
5
1.20
%O
ld S
alem
Apa
rtm
ents
18,1
34,8
00
6
1.
18%
18,1
34,8
00
4
1.
40%
Fou
r S
easo
ns A
part
men
ts17
,286
,800
7
1.13
%17
,286
,800
5
1.33
%Jo
int S
ecur
ity C
ompl
ex16
,042
,000
8
1.05
%16
,042
,000
7
1.24
%T
urtle
Cre
ek A
part
men
ts15
,066
,600
9
0.98
%15
,066
,600
8
1.16
%W
estm
inst
er C
ante
rbur
y13
,910
,000
10
0.
91%
13,7
57,0
00
9
1.
06%
Abb
ingt
on C
ross
ing
(Squ
ire H
ill)
19,6
80,9
00
2
1.
52%
184,
876,
575
12
.05%
169,
042,
511
13
.02%
Wat
e rW
aste
wat
er
80

RIV
AN
NA
WA
TE
R &
SE
WE
R A
UT
HO
RIT
YT
able
15
Mis
cella
neou
s S
tatis
tical
Dat
aC
ity o
f Cha
rlotte
svill
e, V
irgin
ia
Dat
e of
inco
rpor
atio
n18
88D
ate
pres
ent c
hart
er a
dopt
ed19
76F
orm
of g
over
nmen
tC
ounc
il M
anag
er
Are
a10
.4 s
quar
e m
iles
Mile
s of
str
eets
156
Num
ber
of w
ater
cus
tom
ers
14,5
54N
umbe
r of
sew
er c
usto
mer
s14
,406
Mile
s of
wat
er li
nes
180
Mile
s of
san
itary
sew
er li
nes
166
Num
ber
of fi
re h
ydra
nts
1026
Bon
d R
atin
gA
AA
/Aaa
Rat
es F
Y 2
014
per
1,00
0 cu
bic
feet
:
Wat
erM
ay -
Sep
t.$5
0.62
Oct
. - A
pr.
$38.
94
Was
tew
ater
$54.
00
Ten
Lar
ges
t C
ust
om
ers
in F
Y 2
014:
Wat
erP
erce
nta
ge
Was
tew
ater
Per
cen
tag
eC
on
sum
pti
on
Bill
edo
f T
ota
lT
reat
edB
illed
of
To
tal
(in
cu
bic
fee
t)R
even
ue
Rev
enu
e(i
n c
ub
ic f
eet)
Rev
enu
eR
even
ue
Uni
vers
ity o
f Virg
inia
65,9
23,8
09
$1,
509,
341
17
.91%
50,6
02,4
35
$2,
395,
435
21
.19%
Pep
si C
ola
4,61
8,71
0
211,
457
2.51
%4,
593,
928
24
6,88
5
2.
18%
Cha
rlotte
svill
e R
edev
elop
men
t and
Hou
sing
2,41
9,76
3
107,
702
1.28
%2,
419,
763
13
1,65
1
1.
16%
Woo
dard
Pro
pert
ies
2,34
7,44
8
118,
774
1.41
%2,
347,
448
13
1,64
2
1.
16%
City
of C
harlo
ttesv
ille
2,01
0,68
2
94,9
11
1.
13%
1,65
2,14
6
91,1
52
0.
81%
Om
ni C
harlo
ttesv
ille
Hot
el1,
536,
200
74
,061
0.88
%1,
326,
476
71
,017
0.63
%E
dgew
ood
Man
agem
ent
1,07
2,26
0
51,0
63
0.
61%
1,07
2,26
0
57,6
38
0.
51%
Can
non/
Hea
rthw
ood
LTD
Par
tner
1,03
8,44
8
50,6
33
0.
60%
1,03
8,44
8
56,2
41
0.
50%
FM
W R
RI O
PC
O L
LC90
7,07
0
43
,736
0.52
%90
7,07
0
48
,817
0.43
%C
DQ
Hot
els
821,
040
39,6
72
0.
47%
821,
040
44,1
21
0.
39%
82,6
95,4
30
$ 2,
301,
350
27
.32%
66,7
81,0
14
$
3,27
4,59
9
28.9
6%
Wat
erW
aste
wat
er
81

This page intentionally left blank

ROBINSON, FARMER, COX ASSOCIATES
A PROFESSIONAL LIMITED LIABILITY COMPANY CERTIFIED PUBLIC ACCOUNTANTS
Independent Auditors’ Report on Internal Control over Financial Reporting and on
Compliance and Other Matters Based on an Audit of Financial Statements Performed in Accordance with Government Auditing Standards
To the Board of Directors Rivanna Water & Sewer Authority Charlottesville, Virginia We have audited, in accordance with the auditing standards generally accepted in the United States of America; the standards applicable to financial audits contained in Government Auditing Standards, issued by the Comptroller General of the United States; and the Specifications for Audits of Authorities, Boards, and Commissions, issued by the Auditor of Public Accounts of the Commonwealth of Virginia, the financial statements of the business-type activities of Rivanna Water & Sewer Authority as of and for the year ended June 30, 2014, and the related notes to the financial statements, which collectively comprise the Rivanna Water & Sewer Authority’s basic financial statements and have issued our report thereon dated October 6, 2014. Internal Control over Financial Reporting In planning and performing our audit of the financial statements, we considered Rivanna Water & Sewer Authority’s internal control over financial reporting (internal control) to determine the audit procedures that are appropriate in the circumstances for the purpose of expressing our opinion on the financial statements, but not for the purpose of expressing an opinion on the effectiveness of Rivanna Water & Sewer Authority’s internal control. Accordingly, we do not express an opinion on the effectiveness of Rivanna Water & Sewer Authority’s internal control. A deficiency in internal control exists when the design or operation of a control does not allow management or employees, in the normal course of performing their assigned functions, to prevent, or detect and correct, misstatements on a timely basis. A material weakness is a deficiency, or a combination of deficiencies, in internal control such that there is a reasonable possibility that a material misstatement of the entity’s financial statements will not be prevented, or detected and corrected on a timely basis. A significant deficiency is a deficiency, or a combination of deficiencies, in internal control that is less severe than a material weakness, yet important enough to merit attention by those charged with governance. Our consideration of internal control was for the limited purpose described in the first paragraph of this section and was not designed to identify all deficiencies in internal control that might be material weaknesses or, significant deficiencies. Given these limitations, during our audit we did not identify any deficiencies in internal control that we consider to be material weaknesses. However, material weaknesses may exist that have not been identified.
83

Compliance and Other Matters As part of obtaining reasonable assurance about whether Rivanna Water & Sewer Authority’s financial statements are free from material misstatement, we performed tests of its compliance with certain provisions of laws, regulations, contracts, and grant agreements, noncompliance with which could have a direct and material effect on the determination of financial statement amounts. However, providing an opinion on compliance with those provisions was not an objective of our audit, and accordingly, we do not express such an opinion. The results of our tests disclosed no instances of noncompliance or other matters that are required to be reported under Government Auditing Standards. Purpose of this Report The purpose of this report is solely to describe the scope of our testing of internal control and compliance and the results of that testing, and not to provide an opinion on the effectiveness of the entity’s internal control or on compliance. This report is an integral part of an audit performed in accordance with Government Auditing Standards in considering the entity’s internal control and compliance. Accordingly, this communication is not suitable for any other purpose. Charlottesville, Virginia October 6, 2014
84

ROBINSON, FARMER, COX ASSOCIATES
A PROFESSIONAL LIMITED LIABILITY COMPANY CERTIFIED PUBLIC ACCOUNTANTS
Independent Auditors’ Report on Compliance for Each Major Program and on Internal Control over Compliance Required by OMB Circular A-133
To the Board of Directors Rivanna Water & Sewer Authority Charlottesville, Virginia Report on Compliance for Each Major Federal Program We have audited Rivanna Water & Sewer Authority’s compliance with the types of compliance requirements described in the OMB Circular A-133 Compliance Supplement that could have a direct and material effect on each of Rivanna Water & Sewer Authority’s major federal programs for the year ended June 30, 2014. Rivanna Water & Sewer Authority’s major federal programs are identified in the summary of auditors’ results section of the accompanying schedule of findings and questioned costs. Management’s Responsibility Management is responsible for compliance with the requirements of laws, regulations, contracts, and grants applicable to its federal programs. Auditors’ Responsibility Our responsibility is to express an opinion on compliance for each of Rivanna Water & Sewer Authority’s major federal programs based on our audit of the types of compliance requirements referred to above. We conducted our audit of compliance in accordance with auditing standards generally accepted in the United States of America; the standards applicable to financial audits contained in Government Auditing Standards, issued by the Comptroller General of the United States; and OMB Circular A-133, Audits of States, Local Governments, and Non-Profit Organizations. Those standards and OMB Circular A-133 require that we plan and perform the audit to obtain reasonable assurance about whether noncompliance with the types of compliance requirements referred to above that could have a direct and material effect on a major federal program occurred. An audit includes examining, on a test basis, evidence about Rivanna Water & Sewer Authority’s compliance with those requirements and performing such other procedures as we considered necessary in the circumstances. We believe that our audit provides a reasonable basis for our opinion on compliance for each major federal program. However, our audit does not provide a legal determination of Rivanna Water & Sewer Authority’s compliance. Opinion on Each Major Federal Program In our opinion, Rivanna Water & Sewer Authority complied, in all material respects, with the types of compliance requirements referred to above that could have a direct and material effect on each of its major federal programs for the year ended June 30, 2014.
85

Report on Internal Control over Compliance Management of Rivanna Water & Sewer Authority is responsible for establishing and maintaining effective internal control over compliance with the types of compliance requirements referred to above. In planning and performing our audit of compliance, we considered Rivanna Water & Sewer Authority’s internal control over compliance with the types of requirements that could have a direct and material effect on each major federal program to determine the auditing procedures that are appropriate in the circumstances for the purpose of expressing an opinion on compliance for each major federal program and to test and report on internal control over compliance in accordance with OMB Circular A-133, but not for the purpose of expressing an opinion on the effectiveness of internal control over compliance. Accordingly, we do not express an opinion on the effectiveness of Rivanna Water & Sewer Authority’s internal control over compliance. A deficiency in internal control over compliance exists when the design or operation of a control over compliance does not allow management or employees, in the normal course of performing their assigned functions, to prevent, or detect and correct, noncompliance with a type of compliance requirement of a federal program on a timely basis. A material weakness in internal control over compliance is a deficiency, or combination of deficiencies, in internal control over compliance, such that there is a reasonable possibility that material noncompliance with a type of compliance requirement of a federal program will not be prevented, or detected and corrected, on a timely basis. A significant deficiency in internal control over compliance is a deficiency, or a combination of deficiencies, in internal control over compliance with a type of compliance requirement of a federal program that is less severe than a material weakness in internal control over compliance, yet important enough to merit attention by those charged with governance. Our consideration of internal control over compliance was for the limited purpose described in the first paragraph of this section and was not designed to identify all deficiencies in internal control over compliance that might be material weaknesses or significant deficiencies. We did not identify any deficiencies in internal control over compliance that we consider to be material weaknesses. However, material weaknesses may exist that have not been identified. The purpose of this report on internal control over compliance is solely to describe the scope of our testing of internal control over compliance and the results of that testing based on the requirements of OMB Circular A-133. Accordingly, this report is not suitable for any other purpose. Charlottesville, Virginia October 6, 2014
86

RIVANNA WATER & SEWER AUTHORITY
Schedule of Expenditures of Federal AwardsYear Ended June 30, 2014
Federal Pass-ThroughFederal Grantor/Pass-Through CFDA Entity Identifying Federal
Grantor/Program or Cluster Title Number Number Expenditures
Environmental Protection AgencyPass-through payment:Virginia Department of Environmental Quality Capitalization Grants for Clean Water State Revolving Funds 66.458 Unknown $ 2,904,580
Total Environmental Protection Agency $ 2,904,580
Total expenditures of federal awards $ 2,904,580
87

RIVANNA WATER & SEWER AUTHORITY
Notes to Schedule of Expenditures of Federal AwardsYear Ended June 30, 2014
Note 1- Basis of Presentation:
The accompanying schedule of expenditures of federal awards (the Schedule) includes thefederal grant activity of Rivanna Water & Sewer Authority under programs of the federalgovernment for the year ended June 30, 2014. The information in this Schedule is presentedin accordance with reporting requirements of OMB Circular A-133, Audits of States, LocalGovernments, and Non-Profit Organizations . Because the Schedule presents only a selectedportion of operations of Rivanna Water & Sewer Authority, it is not intended to and does notpresent the financial position, changes in net position, or cash flows of Rivanna Water &Sewer Authority.
Note 2 – Basis of Accounting
Expenditures reported on the Schedule are reported on the accrual basis of accounting. Suchexpenditures are recognized following the cost principles contained in OMB Circular A-87,Cost Principles for State, Local, and Indian Tribal Governments , wherein certain types ofexpenditures are not allowable or are limited as to reimbursement. Pass-through entityidentifying numbers were not available for presentation.
Note 3 – Relationship to Financial Statements
Federal expenditures, revenues and capital contributions are reported in the Authority’sfinancial statements as follows:
Loan proceeeds $ 2,904,580
Total federal expenditures per the Schedule of Expenditures of Federal Awards $ 2,904,580
88

RIVANNA WATER & SEWER AUTHORITY
Schedule of Findings and Questioned CostsYear Ended June 30, 2014
Section I - Summary of Auditors' Results
Financial Statements
Type of auditors' report issued: Unmodified
Internal control over financial reporting:Material weakness(es) identified? No
Significant deficiency(ies) identified? None reported
Noncompliance material to financial statements noted? No
Federal Awards
Internal control over major programs:Material weakness(es) identified? No
Significant deficiency(ies) identified? None Reported
Type of auditors' report issued on compliance for major programs: Unmodified
Any audit findings disclosed that are required to be reported in accordance with Circular A-133, Section .510 (a)? No
Identification of major programs:
CFDA # Name of Federal Program or Cluster
66.458 Capitalization Grants for Clean Water State Revolving Funds
Dollar threshold used to distinguish between Type A and Type B programs $300,000
Auditee qualified as low-risk auditee? No
Section II - Financial Statement Findings
There are no financial statement findings to report.
Section III - Federal Award Findings and Questioned Costs
There are no federal award findings and questioned costs to report.
Section IV - Prior Year Audit Findings
There were no prior year audit findings.
89

This page intentionally left blank