Embed Size (px)
Citation preview

COMPREHENSIVE ANNUAL FINANCIAL REPORT AS OF AND FOR THE YEARS ENDED SEPTEMBER 30, 2016 AND 2015
CITY OF NAPLES AIRPORT AUTHORITY NAPLES, FLORIDA
NAPLES MUNICPAL AIRPORT

CITY OF NAPLES AIRPORT AUTHORITY NAPLES, FLORIDA
COMPREHENSIVE ANNUAL FINANCIAL REPORT
AS OF AND FOR THE YEARS ENDED SEPTEMBER 30, 2016 AND 2015
Prepared By:
FINANCE DEPARTMENT

CITY OF NAPLES AIRPORT AUTHORITY Comprehensive Annual Financial Report
As of and for the Years Ended September 30, 2016 and 2015
TABLE OF CONTENTS
PAGE INTRODUCTORY SECTION
Letter of Transmittal i Board of Commissioners and Executive Director vii Certificate of Achievement for Excellence in Financial Reporting viii
Organizational Chart ix
FINANCIAL SECTION
Independent Auditors’ Report 1 Management’s Discussion and Analysis 5
Financial Statements: Statements of Net Position 13 Statements of Revenues, Expenses, and Changes in Net Position 14 Statements of Cash Flows 15 Notes to Financial Statements 17
Supplementary Information: Schedule of Revenues, Receipts, Expenses and Expenditures – Non-GAAP Budgetary Basis and Actual 29
STATISTICAL SECTION
33 34 3636 37 38 38 39 39 40 41 42 43 44
Net Position by Component, Last Ten Fiscal Years Changes in Net Position, Last Ten Fiscal Years Average Aviation Fuel Margins (Per Gallon) Aviation Fuel Sales (Gallons) Aviation Fuel Sales (Net Revenue) Principal Customers – by Gross Sales Principal Customers – by Aviation Fuel Gallons Debt Limitations Demographic and Economic Statistics Principal Employers Aviation Fuel and Aircraft Operations Statistics Commercial Passenger Statistics Full-Time Equivalent Employees by Function Airport Information Capital Contributions 45

COMPLIANCE SECTION
Independent Auditors’ Report on Internal Control Over Financial Reporting and on Compliance and Other Matters Based on an Audit of Financial Statements Performed in Accordance With Government Auditing Standards 47
MANAGEMENT LETTER
Management Letter 49 Independent Accountant’s Report 53 Response to Management Letter 55


BLANK PAGE


ii
upon the audit, that there was a reasonable basis for rendering an unmodified opinion that the Authority’s financial statements for the fiscal years ended September 30, 2016 and 2015 are fairly presented in conformity with GAAP. The independent auditors’ report is the first component of the Financial Section of this report. GAAP requires that management provide a narrative introduction, overview and analysis to accompany the financial statements in the form of a Management Discussion and Analysis (MD&A). This letter of transmittal is designed to complement the MD&A and should be read in conjunction with it. The MD&A can be found in the financial section, immediately following the report of the independent auditors. The Airport The Naples Municipal Airport was originally constructed in 1943 as the “Naples Airdrome” and served as an Air Corps base for training gunners, bomber crews and fighter pilots for combat during World War II. After the end of the war, the city and county jointly operated the airport until the county sold its interest to the city in 1958. Naples Municipal Airport is located in western Collier County, approximately one mile from the City of Naples business district and approximately one and a half miles inland of the Gulf of Mexico. The airport, which is owned by the City of Naples, is leased to the Authority under a 99 year lease. Historically, the Naples Municipal Airport has been classified in the National Plan of Integrated Airport Systems as a primary commercial service airport (a commercial service airport which enplanes 10,000 or more passengers each year). Naples Municipal Airport was the only commercial service airport in Collier County and was ranked (by passenger count) as the smallest commercial service airport in Florida. In October 2008, the only air carrier operating at the Naples Municipal Airport discontinued service. In February of 2016, commercial service was reintroduced when one carrier started offering a limited number of flights. General aviation has always generated the majority of aircraft activity at Naples Municipal Airport. Of the 95,050 aircraft operations (one operation is one landing or one takeoff) at Naples Municipal Airport during fiscal year 2016, all but 348 operations (air carrier and military) were attributed to general aviation. All types of aircraft, from small piston engine trainers to large business jets, can be seen at the Naples Municipal Airport. Use of the airport is restricted to aircraft less than 75,000 pounds maximum gross landing weight supported by dual landing gear, and Stage 1 and Stage 2 jets are banned, except for public agency and emergency medical flights.


City of Naples Airport Authority
Raymond Stricklen
Commissioner
Christopher A. RozanskyExecutive Director
James T. RideoutteCommissioner
Donna M. MesserChair
Dick Evans
Commissioner
John Nocera
Vice Chair
vii

viii

9/22
/201
6
City
of N
aple
s A
irpor
t Aut
horit
y O
rgan
izat
ion
Cha
rt
Aut
horit
y C
ouns
elA
utho
rity
Aud
itors
Rob
in M
enar
dE
xecu
tive
Ass
ista
nt
She
ila D
ugan
Dep
uty
Exe
cutiv
e D
irect
or
Virg
inia
Ben
dle
Hum
an R
esou
rces
Man
ager
Dia
ne T
erril
lD
irect
or o
f Stra
tegy
and
Com
mun
icat
ions
Sue
Har
tA
dmin
istra
tive
Ass
ista
nt
And
rea
Gab
elM
anag
er o
fFi
nanc
ial S
yste
ms
and
Rep
ortin
g
Info
rmat
ion
Tech
nolo
gy
Acc
ount
ing
Sta
ff
Adm
inis
trativ
eS
taff
Glo
ria A
llen
Fina
nce
and
Adm
inis
tratio
nM
anag
er
She
ila E
tela
mak
iS
enio
r Dire
ctor
of
Fina
nce
and
Adm
inis
tratio
n
Pam
ela
Rin
ehar
tA
dmin
istra
tive
Ass
ista
nt
Dut
yO
ffice
rsO
pera
tions
Sta
ff
Dav
id H
illA
ssis
tant
Man
ager
of O
pera
tions
Sec
urity
Sta
ff
Rau
l Est
rada
Ope
ratio
nsM
anag
er
Rya
n Fr
ost
Sen
ior D
irect
or o
fO
pera
tions
Ute
Van
ders
luis
Airp
ort D
evel
opm
ent
Spe
cial
ist S
teve
Dan
scec
Adm
inis
trativ
eA
ssis
tant
Mai
nten
ance
Sta
ff
Cus
todi
al S
taff
Ron
Jef
fers
onA
ssis
tant
Dire
ctor
of
Faci
litie
s
Ker
ry K
eith
Sen
ior D
irect
or o
fA
irpor
t Dev
elop
men
t & F
acilit
ies
Saf
ety
Offi
cer
Chr
is R
ozan
sky
Exe
cutiv
e D
irect
or
Boa
rd o
f Com
mis
sion
ers
ix


BLANK PAGE

CliftonLarsonAllen LLPCLAconnect.com
INDEPENDENT AUDITORS’ REPORT Board of Commissioners City of Naples Airport Authority Naples, Florida Report on the Financial Statements We have audited the accompanying financial statements of the City of Naples Airport Authority (Authority), as of and for the years ended September 30, 2016 and 2015, and the related notes to the financial statements, which collectively comprise the entity’s basic financial statements as listed in the table of contents. Management’s Responsibility for the Financial Statements
Management is responsible for the preparation and fair presentation of these financial statements in accordance with accounting principles generally accepted in the United States of America; this includes the design, implementation, and maintenance of internal control relevant to the preparation and fair presentation of financial statements that are free from material misstatement, whether due to fraud or error. Auditors’ Responsibility
Our responsibility is to express an opinion on these financial statements based on our audits. We conducted our audits in accordance with auditing standards generally accepted in the United States of America and the standards applicable to financial audits contained in Government Auditing Standards, issued by the Comptroller General of the United States. Those standards require that we plan and perform the audit to obtain reasonable assurance about whether the financial statements are free from material misstatement. An audit involves performing procedures to obtain audit evidence about the amounts and disclosures in the financial statements. The procedures selected depend on the auditors’ judgment, including the assessment of the risks of material misstatement of the financial statements, whether due to fraud or error. In making those risk assessments, the auditor considers internal control relevant to the entity’s preparation and fair presentation of the financial statements in order to design audit procedures that are appropriate in the circumstances, but not for the purpose of expressing an opinion on the effectiveness of the entity’s internal control. Accordingly, we express no such opinion. An audit also includes evaluating the appropriateness of accounting policies used and the reasonableness of significant accounting estimates made by management, as well as evaluating the overall presentation of the financial statements. We believe that the audit evidence we have obtained is sufficient and appropriate to provide a basis for our audit opinion.
1
Board of Commissioners City of Naples Airport Authority
Opinion
In our opinion, the financial statements referred to above present fairly, in all material respects, the financial position of the Authority as of September 30, 2016 and 2015, and the changes in its financial position and its cash flows for the years then ended in accordance with accounting principles generally accepted in the United States of America. Other Matters
Required Supplementary Information
Accounting principles generally accepted in the United States of America require that the management’s discussion and analysis on pages 5 – 12 be presented to supplement the basic financial statements. Such information, although not a part of the basic financial statements, is required by the Governmental Accounting Standards Board who considers it to be an essential part of financial reporting for placing the basic financial statements in an appropriate operational, economic, or historical context. We have applied certain limited procedures to the required supplementary information in accordance with auditing standards generally accepted in the United States of America, which consisted of inquiries of management about the methods of preparing the information and comparing the information for consistency with management’s responses to our inquiries, the basic financial statements, and other knowledge we obtained during our audit of the basic financial statements. We do not express an opinion or provide any assurance on the information because the limited procedures do not provide us with sufficient evidence to express an opinion or provide any assurance. Other Information
Our audit was conducted for the purpose of forming an opinion on the financial statements that collectively comprise the Authority’s basic financial statements. The introductory and the statistical sections and the schedule of revenues, receipts, expenses, and expenditures – Non-GAAP budgetary basis and actual are presented for purposes of additional analysis and are not a required part of the basic financial statements. The schedule of revenues, receipts, expenses and expenditures – Non-GAAP budgetary basis and actual is the responsibility of management and was derived from and relates directly to the underlying accounting and other records used to prepare the basic financial statements. Such information has been subjected to the auditing procedures applied in the audit of the basic financial statements and certain additional procedures, including comparing and reconciling such information directly to the underlying accounting and other records used to prepare the basic financial statements or to the basic financial statements themselves, and other additional procedures in accordance with auditing standards generally accepted in the United States of America. In our opinion, the schedule of revenues, receipts, expenses and expenditures – Non-GAAP budgetary basis and actual is fairly stated, in all material respects, in relation to the basic financial statements as a whole. The introductory and statistical sections have not been subjected to the auditing procedures applied in the audit of the basic financial statements, and accordingly, we do not express an opinion or provide any assurance on them.
2

Board of Commissioners City of Naples Airport Authority
Other Reporting Required by Government Auditing Standards In accordance with Government Auditing Standards, we have also issued our report dated February 14, 2017, on our consideration of the Authority's internal control over financial reporting and on our tests of its compliance with certain provisions of laws, regulations, contracts, and grant agreements and other matters. The purpose of that report is to describe the scope of our testing of internal control over financial reporting and compliance and the result of that testing, and not to provide an opinion on internal control over financial reporting or on compliance. That report is an integral part of an audit performed in accordance with Government Auditing Standards in considering the Authority’s internal control over financial reporting and compliance.
CliftonLarsonAllen LLP
Fort Myers, Florida February 14, 2017
3

PAGE INTENTIONALLY LEFT BLANK

MANAGEMENT'S DISCUSSION AND ANALYSIS
The following Management Discussion and Analysis (MD&A) of the City of Naples Airport Authority's activities and financial performance provides the reader with an introduction and overview to the financial statements of the City of Naples Airport Authority (the Authority) for the fiscal years ended September 30, 2016 and 2015, with selected comparative information for the fiscal year ended September 30, 2014. The information presented in this MD&A should be considered in conjunction with the accompanying financial statements, notes, and supplementary information found in this report. This information, taken collectively, is designed to provide readers with an understanding of the Authority’s financial condition. Airport Activities and Highlights The Authority operates the Naples Municipal Airport which provides general aviation, non-scheduled and limited scheduled commercial airline service to the public. Major measures of activities of the Naples Municipal Airport are as follows: 2016 2015 2014 Aviation fuel gallons sold 6,714,000 6,411,000 6,117,000 % increase (decrease) from prior year 4.7% 4.8% 21.7% Aircraft operations 95,000 100,000 95,000 % increase (decrease) from prior year (5.0)% 5.3% 3.3% During fiscal year 2014, the number of gallons sold increased significantly from fiscal year 2013, due to competitive fuel pricing and higher traffic volume in the recovering economy. The growth in fuel sales in fiscal year 2015 slowed but was still a healthy pace. In FY 2016, the number of operations declined, however the quantity of gallons sold continued to increase. This reflects the changing mix of the aircraft using the airport, with fewer small transient piston planes flown by flight schools and recreational pilots. The statistic shows that departing aircraft are purchasing a greater number of gallons of fuel. Naples Municipal Airport provided scheduled commercial air service to the community for 50+ years. In 2008 the Airport lost all scheduled commercial air service. While limited scheduled commercial air service has returned to Naples, passenger levels did not reach the threshold of 2,500 enplanements during FY 2016 to be classified as a nonprimary commercial service airport.
5

Financial Highlights and Summary
The following is a condensed summary of the Authority’s revenues, expenses and changes in net position at September 30.
2016 2015 2014 Total operating revenues, net $ 14,279,000 $ 13,845,000 $ 13,021,000 Total non-operating revenues 319,000 406,000 335,000 Total revenues 14,598,000 14,251,000 13,356,000
Total operating expenses 13,262,000 12,005,000 11,413,000 Total non-operating expenses 16,000 - 13,000 Total expenses 13,278,000 12,005,000 11,426,000
Income before capital contributions 1,320,000 2,246,000 1,930,000
Capital contributions 1,140,000 2,470,000 4,308,000
Increase in net position 2,460,000 4,716,000 6,238,000
Beginning net position 78,730,000 74,014,000 67,776,000
Ending net position $ 81,190,000 $ 78,730,000 $ 74,014,000
Operating revenues for FY 2016 increased $434,000 over the prior year. This 3.1% increase is largely due to a $476,000 or 5.7% increase in net fuel sales. Two new landhold leases contributed to the $71,000 or 5.7% increase in building and land rents. This increase was tempered by a $94,000 or 11.6% decrease in Concession fees, of which $86,000 is attributed to car rental revenues. Car rental fees dropped $86,000 or 12% at the Commercial and General Aviation terminals combined due to a decrease in revenues reported by the car rental agencies themselves.
Operating revenues for fiscal year 2015 increased $824,000 over the prior year. This 6.3% increase is attributed largely to a $405,000 or 5.1% increase in net fuel sales. New hangar rental space was available this year with the Authority’s purchase of a hangar and rental income increased by $171,000 or 7.5% due to increased tenancy. Ramp fees increased by $86,000 or 18.8% and other Line Services revenues increased by $15,000 or 8.1%.
In 2016, non-operating revenues were down by $87,000, mostly due to 2015 being inflated by one-time revenues received (see paragraph below). The decrease in car rental revenues mentioned above also translated to a decrease in customer facility charges of $42,000, a 17.1% drop from 2015. Interest revenues were up substantially in 2016 by $50,000, an 84.7% increase over fiscal year 2015 due to the greatly increased cash position.
Non-operating revenues for 2015 increased by $71,000 over the prior year. Final settlement of $25,000 was received from a bankruptcy case and $15,000 was received as restitution for several property damage cases. An insurance rebate of $20,000 was received. Interest income was $9,000 less than in FY 2014. The Authority received $21,000 from the State of Florida SBA as final distribution of the Fund B Reserves and this amount is reflected as a realized gain on investments. Customer Facility Charges were $9,000 greater than in FY 2014 related to increased car rental activity.
6

Total operating expenses rose $1,257,000 in fiscal year 2016, a 10.5% increase over the prior year. $403,000 of this is due to an increase in personnel costs. Salaries, wages and payroll taxes increased $284,000 or 7% with the filling of two vacant positions that had been held open until work volume required. Health insurance premiums increased modestly again during the May renewal period, and the Authority elected not to pass along the increase in premiums to employees. Travel expenses also contributed to the overall increase in personnel costs, increasing $48,000 or 109.6% due to expenses related to interviewing candidates for the Executive Director position, attendance at and sponsorship of various airport conferences, and sponsorships of airport-related events. The other major category of increase in operating expenses of $556,000 is repair and maintenance costs. In FY 2016, the Authority incurred significant costs to clean swales and culverts and to remove exotic vegetation. This project was budgeted in the Capital Improvement Budget (CIP), however the work performed did not meet the criteria for a capital improvement so the expenditure was recorded as an operating expense. Other significant costs included repairs and replacements related to the airport-wide gate and door access controls, as well as re-carpeting and re-painting the commercial terminal. The Air Traffic Control Tower also incurred $43,000 of painting and stucco repair costs. Operating expenses in FY 2015 were $592,000 greater than in FY 2014. This 5.2% increase is primarily attributed to increased personnel costs of $426,000 or 9.4% due to implementation of a formalized training and development program; sponsorship and participation at several state conferences; increased cost of employee health benefits; and wage increases. Professional fees are higher by $78,000 or 12.4% due to the use of an airline consulting firm to assess the community support for commercial airline service at Naples Municipal Airport and the use of a recruitment firm to assist in identifying top candidates for the Executive Director position. Communications expenses in 2015 were lower by $64,000 or 34.6% in comparison with the prior year’s expenses which were elevated due to the special events held in honor of the airports 75th birthday and the Authority’s 45th Anniversary. ARFF expenses were increased in FY 15 by $136,000 or 27.8% in the areas of contractual costs of the firefighters, training and vehicle maintenance. Also significant is a decrease in maintenance expense of $108,000 or 17.7% because FY 2014 contained a one-time expense of $80,000 for airfield maintenance in response to FAA recommendations. Lastly, depreciation expense increased by $187,000 or 5.4% due to the addition of capital assets. In FY 2016 there was a net loss of $16,000 on the disposal of infrastructure and equipment. In 2015 there were no non-operating expenses. In FY 2016, capital contributions were $1,140,000. The majority of the contributed capital resulted from the recognition of certain infrastructure assets totaling $1,469,000, constructed as part of lease abatement agreement with the sole respondent to a Request for Proposals in 2008. During the abatement period, rental revenue and a corresponding receivable had been recordeded, based on the published lease rates in each applicable fiscal year. When the assets were transferred to the Authority in March of 2016, $1,028,000, the value in excess of the receivable, was recorded as contributed capital. Additional information can be found in Note 7 to the Financial Statements. The remainder of the year’s capital contribution is from an FAA grant to fund the reconfiguration of Taxiway A to meet certain design standards. The grant was signed on September 15th, 2016 and there were only $112,000 of eligible costs in FY 2016. Total estimated costs of the project are $1.8 million, with FAA agreeing to reimburse 90%, or up to $1,581,000.
7

In FY 2015, capital contributions for construction projects totaled $2,470,000. The major project in FY 2015 was the FDOT grant-funded “Ramp and Apron Pavement Rehabilitation Project”, in which $2.3 million was expended and the state contributed $1.9 million. The Water Management Systems Improvements and Taxiway A Extension Project, which commenced in late FY 2012, was concluded, and FY 2015 expenditures totaled $485,000. The Federal government and the Florida Department of Transportation (FDOT) contributed $437,000 and $24,000 respectively. The following chart shows the major sources of operating revenue as a percentage of total operating revenues for the year ended September 30, 2016.
The following is a summary of the Authority’s operating revenues at 30 September. Operating revenues: 2016 2015 2014 vv V Fuel sales (net) $ 8,786,000 $ 8,310,000 $ 7,905,000 Concession fees 716,000 810,000 732,000 Hangar/T-shelter/tiedown 2,413,000 2,439,000 2,268,000 Building and land rent 1,327,000 1,256,000 1,221,000 Line Services 698,000 738,000 639,000 U.S. Customs & Border Protection 311,000 277,000 251,000 Other 28,000 15,000 5,000 Total operating revenues $ 14,279,000 $ 13,845,000 $ 13,021,000
The following chart shows the major sources of operating expense before depreciation as a percentage of total operating expenses before depreciation for the year ended September 30, 2016.
Fuel sales (net)62%
Concession fees5%
Hangar/T‐shelter/tiedown
17%
Building and land rent
Line services5%
U.S. Customs and Border Protection user fees
Other0%
8

The following is a summary of the Authority’s operating expenses before depreciation at September 30.
2016 2015 2014 vv Operating expenses:
Personnel $ 5,385,000 $ 4,982,000 $ 4,556,000 Professional fees 783,000 706,000 628,000 Communications 199,000 121,000 185,000 Insurance 461,000 464,000 447,000 Utilities and environmental 265,000 251,000 277,000 ATCT, ARFF and police service 715,000 700,000 664,000 U.S. Customs & Border Protection 295,000 309,000 317,000 Maintenance and repair 1,100,000 541,000 610,000 Other 269,000 312,000 297,000
Total operating expenses $ 9,472,000 $ 8,386,000 $ 7,981,000 before depreciation
The following is a condensed summary of the Authority’s net position at September 30.
2016 2015 2014 vv Current and other assets $ 26,777,000 $ 21,844,000 $ 20,985,000
Capital assets (after depreciation) 61,145,000 61,131,000 55,891,000 Total assets 87,922,000 82,975,000 76,876,000 xx
Current liabilities 2,455,000 2,869,000 2,406,000 Non-current liabilities 4,277,000 1,376,000 456,000 Total Liabilities 6,732,000 4,245,000 2,862,000
Net Position Investment in capital assets 60,738,000 60,372,000 55,323,000 Restricted 1,381,000 1,173,000 928,000 Unrestricted 19,071,000 17,185,000 17,763,000
Net Position $ 81,190,000 $ 78,730,000 $ 74,014,000
Personnel57%
Professional fees8%
Communications2%
Insurance5%
Utilities and environmental
3%
ATCT, ARFF and police service7%
U.S. Customs & Border Protection3%
Maintenance and repair12%
Other3%
9

In FY 2016, total assets increased by $4.9 million, or 6.0%. The majority of this increase, $5.2 million, is an increase in cash and cash equivalents, of which $2.9 million came from four additional land lease tenants purchasing lease extensions under the the Lease-Term Buy-back program. Total liabilities increased by $2.5 million or 58.6%, again largely due to the $2.9 million in additional Lease Term Buy-backs which are recorded as long-term unearned revenue. Accounts payable due to capital projects decreased by $352,000 primarily due to a lull between construction projects. Compensated absences also decreased by $120,000 with the liquidation of liability upon retirements and resignations. Total assets increased by $6.1 million or 7.9% in FY 2015. Of this increase, $5.3 million is a net increase in capital assets, consisting of $8.8 million of capital projects and purchases offset by $3.6 million of non-cash depreciation expense. Cash and cash equivalents increased by $926,000 or 4.8%, with $6,664,000 of cash having been generated by operating activities; $80,000 generated from investing activities; and reduced by $5,818,000 million of capital expenditures net of capital contributions. Total liabilities increased by $1.4 million or 48.4% due primarily to $1.0 million being accounted for as unearned revenue upon closing two Lease Term Buy-back programs. Other smaller increases are in accounts payable for construction as well as an increase in unearned operating revenue and the accrual for compensated absences. The Authority’s total assets exceeded liabilities by $81.2 million in FY 2016 and $78.7 million in FY 2015. The largest portion of the Authority’s net position each year (74.8% of total net position for FY 2016) represents its investment in capital assets (e.g. land, infrastructure, buildings, improvements, intangible assets and equipment). Restricted net position of $1.4 million (1.7% of total net position for FY 2016) consists of the accumulated balance of Customer Facility Charges collected by car rental companies, and this money is available only for car rental facility improvements. The remaining $19.0 million of net position (23.5% of total net position for FY 2016) may be used to meet any of the Authority’s ongoing obligations. A comparison of the Authority's current assets to current liabilities (current ratio) is a way to analyze the Authority's ability to satisfy short-term obligations as they become due. A low ratio may indicate an inability to meet its short-term debts in an emergency. A high ratio is considered favorable to creditors but may indicate excessive investment in working capital items. In 2016, current assets increased significantly, while the Authority experienced an overall decrease in current liabilities, which contributed to a jump in the current ratio to 10.91. While both current assets and current liabilities increased in FY 2015, the proportionate increase in accounts payable for capital projects and in unearned revenue outweighed the increase in cash, resulting in a decrease in the current ratio to 7.47.
10

The following is a summary of the major sources and uses of cash and cash equivalents for the past three years. Cash Equivalents are considered cash-on-hand, bank deposits and highly liquid investments with a maturity of three months or less when purchased.
2016 2015 2014 vv Cash flows from: Operating activities $ 7,702,000 $ 6,664,000 $ 5,235,000 Capital and related financing activities (2,393,000) (5,818,000) (2,133,000) Investing activities 109,000 80,000 164,000 xx Net increase in Cash and Cash Equivalents 5,418,000 926,000 3,266,000 Cash and Cash Equivalents: Beginning of Year 20,252,000 19,326,000 16,060,000 End of Year $ 25,670,000 $20,252,000 $ 19,326,000
The Authority’s available cash and cash equivalents were $25.7 million and $20.3 million at the end of 2016 and 2015, respectively. The increase of $5.4 million in cash and equivalents in FY 2016 is attributed to the payments received from four tenants for Lease Term Buy-back programs. The increase of $0.9 million in FY 2015 is attributed to the payments received from two tenants for Lease Term Buy-back programs. The Authority does not have a written investment policy as defined by Florida Statute 218.415, therefore its investment options are limited. Authority investments had been held in the Local Government Surplus Funds Trust Fund and related Investment Pool (Fund B) administered by the State Board of Administration. Fund B consisted of restructured or defaulted securities and it was uncertain if the Authority would ultimately recover the total amount of these funds upon maturity. Fund B investments fully matured in 2014 and the final distribution of the Authority’s remaining principal balance was made in September 2014. Based on information provided to the Authority by the State Board of Administration over the life of Fund B, the Authority had recorded unrealized gains and losses, and with the final distribution payment, a loss of $13,000 was realized and recognized in FY 2014. In July of 2015, the SBA distributed their final remaining Reserves to participants on a pro-rata basis based upon participant balances as of November 2007 and the Authority received $21,000 which was recognized as a gain. Capital Acquisitions and Construction Activities At the end of 2016, the Authority had $61.1 million, net of accumulated depreciation, invested in a broad range of capital assets, including its terminal and office buildings, aircraft hangars, fuel facilities and equipment, runways and taxiways, and buildings and equipment for fire/rescue, air traffic control, and U.S. Customs. This amount represents a net increase of $14,000 or 0.0% over the prior year. There were two major disposals: the razing of the PBA Hangar ($500 thousand) and the destruction of various paving improvements in preparation for new overlays ($1.4 million). These were offset by the receipt of almost $1.5 million in infrastructure assets as part of the lease abatement agreement mentioned above, in which assets were constructed in return for a period of rent abatement. The total amount of the contributed assets, when netted with the two disposals, served to create a minimal net change for the fiscal year.
11

During 2016, completed projects and capital purchases totaling $4.5 million were closed from construction-in-progress to their respective capital asset accounts. The major completed projects were: Runway 14-32 safety area drainage $ 3,257,000 Replacement of hangar doors (10) 255,000 Installation of new phone system 158,000 Installation of fiber-optic cabling to Commercial Terminal 148,000 Financial System - NAV & Serenic Payroll 112,000 Small projects & equipment 565,000 $ 4,495,000
At the end of 2016 major projects within construction-in-progress consisted of the following:
Taxilane F Development $ 624,000 Tower Drive Drainage Modification 312,000 Taxiway D West Quad Extension 172,000 Taxiway A Reconfiguration to Meet Design Standards 124,000 Small Projects and Equipment 303,000 $ 1,535,000
Capital asset acquisitions and improvements are funded using a variety of financing techniques, including Federal and State grants, airport funds, and airport revenues. Additional information on the Authority’s capital assets and commitments can be found in the Notes to Financial Statements, Notes 3 and 13 respectively. Debt The Authority has maintained a zero debt balance in fiscal years 2014 through 2016. Economic Factors and Future Impacts The Authority financially supports itself directly from airport user fees and indirectly by airport user taxes. No local, state or federal general taxes, such as property, utility, sales, intangible property or income taxes directly support the Authority. The Authority receives, for certain capital projects, state and federal financial grants from trust funds established largely from aviation fuel taxes and airline ticket taxes. Contacting the Authority's Financial Management This financial report is designed to provide a general overview of the Authority's finances and to demonstrate the Authority's accountability for the money it receives. If you have questions about this report or require additional financial information, please contact the Authority's Director of Finance at 160 Aviation Drive North, Naples, Florida, 34104.
12

CITY OF NAPLES AIRPORT AUTHORITYSTATEMENTS OF NET POSITIONSeptember 30,
ASSETS
CURRENT ASSETS 2016 2015
Cash and cash equivalents 24,289,000$ 19,079,000$ Restricted cash 1,381,000 1,173,000
Accounts receivable (net) 365,000 482,000
Accounts receivable - restricted funds 10,000 13,000
Inventories 263,000 308,000 Due from governmental agencies 109,000 128,000 Prepaid expenses 360,000 242,000
Total current assets 26,777,000 21,425,000
NONCURRENT ASSETS
Other asset - 419,000 Capital assets, net of accumulated depreciation 61,145,000 61,131,000
Total noncurrent assets 61,145,000 61,550,000
Total assets 87,922,000 82,975,000
LIABILITIES
CURRENT LIABILITIES
Accounts payable 508,000 461,000 Accounts payable - capital improvements 407,000 759,000 Unearned revenue 1,362,000 1,371,000 Compensated absences 43,000 163,000 Accrued expenses and other liabilities 135,000 115,000
Total current liabilities 2,455,000 2,869,000
NONCURRENT LIABILITIES
Compensated absences 387,000 363,000 Unearned Revenue - Lease Term Buy-back Program 3,890,000 1,013,000
Total noncurrent liabilities 4,277,000 1,376,000
Total liabilities 6,732,000 4,245,000
NET POSITION
Investment in capital assets 60,738,000 60,372,000 Restricted for rental car facility improvements 1,381,000 1,173,000 Unrestricted 19,071,000 17,185,000
Total net position 81,190,000$ 78,730,000$
The notes to the financial statements are an integral part of this statement.13

CITY OF NAPLES AIRPORT AUTHORITYSTATEMENTS OF REVENUES, EXPENSES AND CHANGES IN NET POSITION Years Ended September 30,
OPERATING REVENUES 2016 2015Fuel sales (net) 8,786,000$ 8,310,000$ Concession fees 716,000 810,000 Hangar/T-shelter/tiedown 2,413,000 2,439,000 Building and land rent 1,327,000 1,256,000 Line services 698,000 738,000 U.S. Customs and Border Protection user fees 311,000 277,000 Other 28,000 15,000
Net operating revenues 14,279,000 13,845,000
OPERATING EXPENSESPersonnel 5,385,000 4,982,000 Professional fees 783,000 706,000 Communications 199,000 121,000 Insurance 461,000 464,000 Utilities and environmental 265,000 251,000 Office/postage/printing 116,000 134,000
ATCT, ARFF and police service 715,000 700,000 U.S. Customs and Border Protection 295,000 309,000 Dues/subscriptions/fees 43,000 49,000
Auto gas and diesel fuel 48,000 61,000 Pilot services 64,000 68,000
Maintenance and repair 1,097,000 541,000 Depreciation and amortization 3,791,000 3,619,000
Total operating expenses 13,262,000 12,005,000
Operating income 1,017,000 1,840,000
NON-OPERATING REVENUES (EXPENSES)Customer facility charges 204,000 246,000 Interest revenue 109,000 59,000 Realized gain on investment - 21,000 Claims and insurance settlements 6,000 75,000 Gain (loss) on disposal of capital assets (16,000) 5,000
Total non-operating revenues (expenses) 303,000 406,000
Income before capital contributions 1,320,000 2,246,000
Capital contributions 1,140,000 2,470,000
Change in net position 2,460,000 4,716,000 Total net position - beginning 78,730,000 74,014,000
Total net position - ending 81,190,000$ 78,730,000$
The notes to the financial statements are an integral part of this statement.14

CITY OF NAPLES AIRPORT AUTHORITY STATEMENTS OF CASH FLOWSYears Ended September 30,
CASH FLOWS FROM OPERATING ACTIVITIES 2016 2015Cash received from customers 29,329,000$ 30,466,000$ Cash payments to suppliers for goods and services (16,181,000) (18,880,000) Cash payments for personnel services (5,474,000) (4,937,000) Other operating revenues 28,000 15,000
Net cash provided by operating activities 7,702,000 6,664,000
CASH FLOWS FROM CAPITAL AND RELATED FINANCING ACTIVITIESCustomer facility charges 206,000 243,000 Acquisition and construction of capital assets (2,745,000) (8,708,000) Capital contributed 134,000 2,567,000 Proceeds from sale of capital assets 6,000 5,000 Claims and insurance settlements 6,000 75,000
Net cash used in capital and related financing activities (2,393,000) (5,818,000)
CASH FLOWS FROM INVESTING ACTIVITIESInterest and dividends on investments 109,000 59,000
Realized gain on SBA fund B investments/return of reserves - 21,000
Net cash provided by investing activities 109,000 80,000
Net increase in cash and cash equivalents 5,418,000 926,000
CASH AND CASH EQUIVALENTS, beginning of year 20,252,000 19,326,000
CASH AND CASH EQUIVALENTS, end of year 25,670,000$ 20,252,000$
RECONCILIATION OF CASH AND CASH EQUIVALENTS
TO STATEMENT OF NET POSITIONRestricted Cash 1,381,000$ 1,173,000$
Unrestricted cash and cash equivalents 24,289,000 19,079,000 25,670,000$ 20,252,000$
The notes to the financial statements are an integral part of this statement.15

CITY OF NAPLES AIRPORT AUTHORITY STATEMENTS OF CASH FLOWS (Continued) Years Ended September 30,
RECONCILIATION OF OPERATING INCOME TO NET CASH PROVIDED BY OPERATING ACTIVITIES 2016 2015Operating income 1,017,000$ 1,840,000$ Adjustments to reconcile operating income to net cash
provided by operating activitiesDepreciation and amortization 3,791,000 3,619,000 Depreciation on owned fuel trucks recorded as Cost of Goods Sold 42,000 42,000
Revenue recognized from land lease abatement (22,000) (57,000)
Changes in assets and liabilitiesDecrease (increase) in receivable 108,000 (52,000) Decrease in inventories 45,000 139,000
(Increase) in prepaid expenses (118,000) (59,000) Increase (decrease) in accounts payable 47,000 (67,000) Increase (decrease) in compensated absences (96,000) 33,000 Increase in accrued expenses and other current liabilities 20,000 12,000 Increase in unearned revenue - Lease Term Buy-back Program 2,877,000 1,013,000
Increase (decrease) in unearned revenue (9,000) 201,000 Total adjustments 6,685,000 4,824,000
NET CASH PROVIDED BY OPERATING ACTIVITIES 7,702,000$ 6,664,000$
NONCASH INVESTING, CAPITAL, AND FINANCING ACTIVITIES
Capital asset trade-in 6,000$ 5,000$ Property improvements from rent abatement 6,000$ 3,000$ Capital assets transferred to Authority 1,469,000$ -$ Capital Contributions part of Asset Transfer 1,028,000$ -$
The notes to the financial statements are an integral part of this statement.16

CITY OF NAPLES AIRPORT AUTHORITY NOTES TO FINANCIAL STATEMENTS September 30, 2016 and 2015
NOTE 1 - SUMMARY OF SIGNIFICANT ACCOUNTING POLICIES
A. Reporting entity
The City of Naples Airport Authority (the “Authority”) was created under Laws of Florida 69-1326, as amended, as an independent authority responsible for the operation of the airport located in Naples, Florida, or any other airport in Collier County, Florida, which the Authority may contract to operate. The City of Naples, recognizing the benefits of an authority-type management concept, established the Authority in 1969 for the purpose of enhancing service to users, improving the community gateway image and eliminating financial subsidies by City taxpayers. Commissioners of the Authority are appointed by the Naples City Council. (Also see Note 11 - Related Party Transactions).
Governmental Accounting Standards Board (GASB) Statement Number 14, “Financial Reporting Entity,” as amended, requires the financial statements of the Authority (the primary government) to include its component units, if any. A component unit is a legally separate organization for which the officials of the primary government are financially accountable. Based on the criteria established in GASB Statement Number 14, there are no component units required to be included in the Authority’s financial statements.
B. Basis of presentation
The Authority uses enterprise fund accounting to report its activities. An enterprise fund is a proprietary fund used to account for business-like activities provided to the general public. These activities are financed primarily by user charges and the measurement of financial activity focuses on net income measurement similar to the private sector.
C. Measurement focus
The Authority is accounted for on an “economic resources” measurement focus. Accordingly, all assets and liabilities are included on the statement of Net Position, and the reported Net Position (total reported assets less total reported liabilities) provides an indication of the economic net worth of the Authority. The operating statement reports increases (revenues) and decreases (expenses) in total economic net worth.
D. Basis of accounting
Basis of accounting refers to when revenues and expenses are recognized in the accounts and reported in the financial statements. Basis of accounting relates to the timing of the measurements made, regardless of the measurement focus applied.
The Authority uses the accrual basis of accounting. Under this method, revenues are recognized when they are earned; expenses are recognized when they are incurred.
17

CITY OF NAPLES AIRPORT AUTHORITY NOTES TO FINANCIAL STATEMENTS September 30, 2016 and 2015 NOTE 1 - SUMMARY OF SIGNIFICANT ACCOUNTING POLICIES (Continued)
E. Budgetary process The budget is adopted by Resolution of the Board of Commissioners and amendments, if any, are also approved by the Board of Commissioners. The budget is adopted consistent with Generally Accepted Accounting Principles (GAAP) except that, in order to clarify the Authority’s intent to present total expenses and expenditures, capital projects are included as expenditures and depreciation and amortization are excluded. Expenditures cannot legally exceed the total amount of budgeted expenditures. Appropriations lapse at the fiscal year-end. F. Use of estimates
The preparation of financial statements in conformity with accounting principles generally accepted in the United States of America requires management to make estimates and assumptions that affect the amounts reported in the financial statements and accompanying notes. Although these estimates are based on management's knowledge of current events and actions it may undertake in the future, they may differ from actual results. G. Assets, liabilities and net position Cash and cash equivalents For purposes of the statements of cash flows, the Authority considers all highly liquid investments (including restricted cash assets) with a maturity of three months or less when purchased to be cash equivalents. When both restricted and unrestricted resources are available, restricted resources will be used first for eligible incurred expenses, and then unrestricted as needed. Accounts receivable The Authority’s accounts receivable are recorded net of allowance for doubtful accounts. At September 30, 2016 the allowance was $1,000. Inventories Inventories, consisting of aviation fuel and other petroleum products held for sale, are stated at the lower of cost (first-in, first-out method) or market.
18

CITY OF NAPLES AIRPORT AUTHORITY NOTES TO FINANCIAL STATEMENTS September 30, 2016 and 2015 NOTE 1 - SUMMARY OF SIGNIFICANT ACCOUNTING POLICIES (Continued)
G. Assets, liabilities and net position (continued) Capital assets Capital assets include property, plant, equipment, infrastructure and intangible assets. Infrastructure assets are defined as public domain capital assets such as roads, drainage systems, lighting systems, runways, and similar assets that are immovable and of value only to the government unit. Intangible assets are without physical substance that provide economic benefits through the rights and privileges associated with their possession. Intangible assets may be classified as identifiable or unidentifiable and externally acquired or internally developed. The threshold for capitalization is $2,000. Capital assets purchased for use in the operations of the Authority are recorded at cost. Interest on borrowed funds for construction projects is capitalized as part of the cost of construction along with all other direct construction costs. Contributed property and equipment are recorded at fair market value at the date of contribution. Expenditures for maintenance, repairs, and minor renewals are expensed as incurred. Major renewals and enhancements are capitalized. The cost of assets retired or sold, together with the related accumulated depreciation, is removed from the accounts, and any gain or loss on disposition is credited or charged to earnings. Depreciation is calculated using the straight-line method over the estimated useful lives of the related assets. The estimated useful lives are determined based upon the Authority’s experience with similar assets and its planned use of those assets. The ranges of the estimated useful lives are as follows:
Assets Years Infrastructure 10 – 40 Buildings & Improvements 15 – 40 Equipment 3 – 30 Improvements other than buildings 5 – 15 Vehicles 5 – 10 Intangible 3 – 7 Furniture and office equipment 3 – 5 Software 3 – 5
Compensated absences
Employees accrue vacation time for each week of service. The amount of time accrued by each employee varies with length of employment and whether they are full-time or part-time employees. The Authority allows employees to carry over into subsequent fiscal years up to 340 hours of vacation time. Upon leaving the employ of the Authority, employees are paid 100% of their accrued vacation time. Employees receive up to 10 sick days per year depending on whether they are full- or part-time employees. The Authority allows employees to carry over into subsequent fiscal years up to 600 hours of sick time. 19

CITY OF NAPLES AIRPORT AUTHORITY NOTES TO FINANCIAL STATEMENTS September 30, 2016 and 2015
NOTE 1 - SUMMARY OF SIGNIFICANT ACCOUNTING POLICIES (Continued)
G. Assets, liabilities and net position (continued)
Employees exceeding 600 hours will be paid 50% of the sick hours exceeding the 600 hours annually. Upon leaving the employ of the Authority, employees with at least seven years of service will be paid 50% of their available sick hours.
In accordance with GASB Statement Number 16 “Accounting for Compensated Absences”, employee benefits under these policies, plus their related tax and retirement costs, are classified as compensated absences and are accrued for as incurred.
Unearned revenue
The Authority offers a reduced fuel price to customers who pay for aviation fuel in advance. The prepayments are recorded as a liability when received and the liability is reduced as the associated revenues are earned. The Authority also introduced a new “Lease-Term Buy-back” program in 2015, the proceeds of which are recorded as unearned revenue. Revenues are earned over the term of the lease extension.
Net position
Net position is categorized as investment in capital assets, restricted and unrestricted. Restriction of net position indicates amounts that are limited for a specific purpose.
H. Revenues and expenses
Operating revenues and expenses
Operating revenues and expenses for enterprise funds are those that result from providing services and producing and delivering goods. It also includes all revenue and expenses not related to capital and related financing, noncapital financing, or investing activities.
Non-operating revenues and expenses
Non-operating revenues and expenses represent revenue and expense items that are not incurred from the normal user activity of the Authority. This classification includes revenue received from operating grants, passenger and customer facility charges, surcharges for specific capital improvement expenditures, interest earned on bank accounts, realized gain (loss) on investments, interest paid on debt service, finance charge revenue, claims and insurance settlements, and the gain or loss on the sale or disposal of Authority property.
20

CITY OF NAPLES AIRPORT AUTHORITY NOTES TO FINANCIAL STATEMENTS September 30, 2016 and 2015
NOTE 1 - SUMMARY OF SIGNIFICANT ACCOUNTING POLICIES (Continued)
I. Capital contributions
Capital contributions consist primarily of grants and contributions from Federal and state governmental agencies. Capital contributions are recognized as earned as related project costs are incurred. Donated property is recognized when received.
In FY 2016 the Authority received and recognized a non-cash capital contribution of land improvements and infrastructure which had been constructed as part of a long-term land lease agreement valued at $1,469,091, of which $1,028,472 was recognized as a Capital Contribution. See Note 7 for further details.
NOTE 2 - CASH, CASH EQUIVALENTS AND INVESTMENTS
Deposits
Custodial credit risk is the risk that in the event of a bank failure, the Authority’s deposits may not be returned to it. In accordance with its policy, all Authority depositories are banks designated by the Florida State Chief Financial Officer (CFO) as qualified public depositories. Chapter 280 of the Florida Statutes “Florida Security for Public Deposits Act” provides procedures for public depositories to ensure public monies in banks and saving and loans are collateralized with the CFO as agent for the public entities. Chapter 280 defines deposits as demand deposit accounts, time deposit accounts, and nonnegotiable certificates of deposit.
Financial institutions qualifying as public depositories shall deposit with the CFO eligible collateral having a market value equal to or in excess of the average daily balance of public deposits times the depository collateral pledging level required pursuant to Chapter 280 as computed and reported monthly or 125 percent of the average monthly balance, whichever is greater. The Public Deposit Security Trust Fund has a procedure to allocate and recover losses in the event of a default or insolvency. When public deposits are made in accordance with Chapter 280, no public depositor shall be liable for any loss thereof, and therefore, the Authority is not exposed to custodial credit risk.
With the nonnegotiable certificate of deposit, there is no document that, if lost or stolen, would affect the Authority’s rights to its assets.
21

CITY OF NAPLES AIRPORT AUTHORITY NOTES TO FINANCIAL STATEMENTS September 30, 2016 and 2015
NOTE 2 - CASH, CASH EQUIVALENTS AND INVESTMENTS (Continued)
Investments
The Authority limits its investments to those allowed under Section 218.415(17)(a) – (d), Florida Statutes, which include: the Local Government Surplus Funds Trust Fund, or any intergovernmental investment pool authorized pursuant to the Florida Interlocal Cooperation Act of 1969, SEC-registered money market funds, interest-bearing time deposits or savings accounts in qualified public depositories, and direct obligations of the U.S. Treasury. The Authority does not have a policy related to credit risk or interest rate risk. The Authority did not hold any investments in either fiscal years 2016 nor 2015.
NOTE 3 - CAPITAL ASSETS
A summary of changes in capital assets for the years ended September 30 is as follows:
Fiscal Year 2016 Beginning Ending Balance Increases Decreases Balance
Capital Assets not being depreciated: Land $ 2,974,000 $ - $ - $ 2,974,000 Construction in progress 3,666,000 2,364,000 4,495,000 1,535,000Total capital assets not being depreciated 6,640,000 2,364.000 4,495.000 4,509,000
Capital Assets being depreciated: Infrastructure 53,522,000 3,549,000 1,450,000 55,621,000 Buildings 25,768,000 294,000 488,000 25,574,000 Equipment 7,534,000 229,000 57,000 7,706,000 Improvements other than buildings 4,035,000 1,396,000 471,000 4,960,000 Vehicles 992,000 86,000 15,000 1,063,000 Intangibles 1,274,000 - 31,000 1,243,000
Software 85,000 268,000 - 353,000 Furniture and office equipment 657,000 189,000 83,000 763,000Total capital assets being depreciated 93,867,000 6,011,000 2,595,000 97,283,000
Less accumulated depreciation for: Infrastructure 21,098,000 2,130,000 1,438,000 21,790,000 Buildings 9,249,000 764,000 488,000 9,525,000 Equipment 4,916,000 564,000 57,000 5,423,000 Improvements other than buildings 1,885,000 111,000 471,000 1,525,000 Vehicles 836,000 78,000 15,000 899,000 Intangibles 943,000 66,000 31,000 978,000
Software 9,000 45,000 - 54,000 Furniture and office equipment 440,000 75,000 62,000 453,000Total accumulated depreciation 39,376,000 3,833,000 2,604,000 40,647,000Total capital assets being depreciated, net 54,491,000 2,178,000 (9,000) 56,636,000
Total capital assets, net $61,131,000 $ 4,542,000 $ 4,486,000 $61,145,000
In 2016, reported depreciation expense totals $3,791,000. Two fuel trucks were placed into service in October of 2014. The related depreciation of $42,000 was recorded as “Cost of Goods Sold” in both FY 2015 and FY 2016.
22

CITY OF NAPLES AIRPORT AUTHORITY NOTES TO FINANCIAL STATEMENTS September 30, 2016 and 2015
NOTE 3 - CAPITAL ASSETS (Continued)
Fiscal Year 2015 Beginning Ending Balance Increases Decreases Balance
Capital Assets not being depreciated: Land $ 2,974,000 $ - $ - $ 2,974,000 Construction in progress 4,768,000 8,902,000 10,004,000 3,666,000 Total capital assets not being depreciated 7,742,000 8,902.000 10,004.000 6,640.000
Capital Assets being depreciated: Infrastructure 46,292,000 7,230,000 - 53,522,000 Buildings 23,892,000 1,876,000 - 25,768,000 Equipment 7,077,000 490,000 33,000 7,534,000
Improvements other than buildings 4,032,000 3,000 - 4,035,000 Vehicles 929,000 81,000 18,000 992,000 Intangibles 1,124,000 150,000 - 1,274,000
Software 4,000 81,000 - 85,000 Furniture and office equipment 585,000 93,000 21,000 657,000Total capital assets being depreciated 83,935,000 10,004,000 72,000 93,867,000
Less accumulated depreciation for: Infrastructure 19,139,000 1,959,000 - 21,098,000
Buildings 8,500,000 749,000 - 9,249,000 Equipment 4,370,000 579,000 33,000 4,916,000
Improvements other than buildings 1,771,000 114,000 - 1,885,000 Vehicles 769,000 85,000 18,000 836,000
Intangibles 834,000 109,000 - 943,000 Software - 9,000 - 9,000 Furniture and office equipment 403,000 57,000 20,000 440,000Total accumulated depreciation 35,786,000 3,661,000 71,000 39,376,000Total capital assets being depreciated, net 48,149,000 6,343,000 1,000 54,491,000
Total capital assets, net $55,891,000 $15,245,000 $10,005,000 $61,131,000
In 2015, reported depreciation expense totals $3,619,000. Two new fuel trucks were placed into service in October of 2014. The related depreciation of $42,000 was recorded as “Cost of Goods Sold”.
NOTE 4 - UNEARNED REVENUE – LEASE TERM BUY-BACK PROGRAM PAYMENTS
In 2015, the Authority introduced a new Lease Term Buy-back program, available to all existing aviation land tenants. The tenant could enter into a new lease with the Authority within certain parameters for a cost calculated according to a set formula based on current values. This program benefits the leaseholder in that he can more readily secure financing for improvements to his facility or a potential buyer. The Authority concluded four such Agreements in FY 2016 totaling $2.9 million. The money is available for any business purpose. The money is accounted for as a long-term liability (unearned revenue) and will be earned over the years beyond the term of the initial lease.
23

CITY OF NAPLES AIRPORT AUTHORITY NOTES TO FINANCIAL STATEMENTS September 30, 2016 and 2015
NOTE 5 - CHANGES IN NONCURRENT LIABILITIES
A summary of changes in noncurrent liabilities for the years ended September 30 were as follows:
Beginning Ending Current Fiscal Year 2016 Balance Increases Decreases Balance Portion
Compensated absences $ 526,000 $ 25,000 $ (121,000) $ 430,000 $ 43,000 Unearned revenue 1,013,000 2,877,000 - 3,890,000 - Total noncurrent liabilities $ 1,539,000 $ 2,909,000 $ (121,000) $ 4,320,000 $ 43,000
Beginning Ending Current Fiscal Year 2015 Balance Increases Decreases Balance Portion
Compensated absences $ 493,000 $ 332,000 $ (261,000) $ 526,000 $ 163,000 Unearned revenue - 1,013,000 - 1,013,000 - Total noncurrent liabilities $ 493,000 $ 1,345,000 $ (261,000) $ 1,539,000 $ 163,000
NOTE 6 - RENTAL REVENUE UNDER OPERATING LEASES
The Authority subleases land and leases certain buildings and office space to various tenants with lease terms extending out to 2046. Certain leases include both fixed minimum rentals and contingent rentals based on gross receipts. Minimum future rentals under noncancelable operating leases as of September 30, 2016 are as follows:
Year Ending September 30, Amount
2017 $1,143,000 2018 1,144,000 2019 912,000 2020 892,000 2021 892,000
thereafter 11,525,000 Total $16,508,000
Minimum lease payments do not include contingent rentals which may be received under certain leases based on a percentage of the tenants’ sales revenues. The contingent rentals for the year ended September 30, 2016 and 2015 were $622,000 and $682,000, respectively, and were reported as concession fees in the Statement of Revenues, Expenses and Changes in Net Position.
24

CITY OF NAPLES AIRPORT AUTHORITY NOTES TO FINANCIAL STATEMENTS September 30, 2016 and 2015
NOTE 6 - RENTAL REVENUE UNDER OPERATING LEASES (Continued)
Following is a summary of assets on lease for the years ended September 30:
2016 2015 Hangar $10,421,000 $10,421,000 Other buildings 5,291,000 5,291,000 Total cost 15,712,000 15,712,000 Less accumulated depreciation (7,275,000) ( 6,830,000) Net carrying amount $ 8,437,000 $ 7,919,000
Depreciation for the assets on lease was $445,000 and $447,000 for the years ended September 30, 2016 and 2015 respectively.
NOTE 7 - OTHER ASSET
In April of 2008, the Authority entered into a long-term land lease with the sole respondent to a Request for Proposal for the development of an aircraft storage area. Under the lease, the tenant was required to construct specific infrastructure improvements outside of the leasehold and to convey these improvements to the Authority upon completion. In exchange for these improvements, rent payments were to be abated for the first nine (9) years and eleven (11) months. The terms were amended in 2011 to reduce the rent abatement period by two (2) years in exchange for the completion of a portion of the infrastructure improvements at the Authority’s expense. The abatement period ended in March of 2016, and the completed infrastructure improvements were conveyed to the Authority. The amended lease requires the tenant to complete the aviation facility construction by April 2017.
The Authority recorded non-cash rent revenue and a long-term receivable during the infrastructure construction period based on the current published land rent rate set by the Authority. Upon transfer of the completed improvements to the Authority, the Authority recognized the value of the improvements at the certified construction cost, which was deemed to be fair market value. The value of the improvements in excess of the recorded receivable was recorded as contributed capital.
Non-cash rent revenue was $22,000 for the year ended September 30, 2016 and $57,000 for fiscal year 2015. The value of the infrastructure improvements transferred to the Authority in March was $1,469,000. The total value of rent abatement booked as a receivable was $441,000 when infrastructure was conveyed in March, 2016. Contributed capital at the time of completion was $1,028,000.
25

CITY OF NAPLES AIRPORT AUTHORITY NOTES TO FINANCIAL STATEMENTS September 30, 2016 and 2015
NOTE 8 - RETIREMENT PLAN
The City of Naples Airport Authority ICMA Retirement Corporation Governmental Money Purchase Plan and Trust is a defined contribution retirement plan for the benefit of its employees. The plan is for full-time employees and has eligibility provisions with required retirement funding percentages applied to the salaries of those participating. Retirement contribution expense for the years ended September 30, 2016 and 2015 was $245,000 and $225,000, respectively. The Authority has reserved the right to establish and amend all plan provisions. The contribution requirements of plan members and the Authority are established and may be amended by the Authority. The Authority’s total salaries and wages on September 30, 2016 and 2015 were $4,028,000 and $3,668,000, and its covered payroll was $3,622,000 and $3,533,000 respectively.
The plan has fewer than 100 participants and does not issue a separate audited financial report. The postemployment retirement benefit plan is administered by ICMA-RC, Washington, D.C..
NOTE 9 - RISK MANAGEMENT
The Authority is exposed to various risks of loss related to torts; theft, damage, and destruction of assets; errors and omissions; injuries to employees; and natural disasters.
Insurance coverage for such losses is purchased from commercial insurance companies. The financial impact of the Authority’s risk management activities are reported in the accompanying financial statements. For the years ended September 30, 2016 and 2015, the Authority paid $461,000 and $464,000, respectively, in premiums for policies to insure for these risks. No accrual has been provided for claims and incidents not reported to insurers. All known claims have been reported to the insurers. Claims made have not exceeded the insurance coverage for any of the past twelve fiscal years.
NOTE 10 - CUSTOMER FACILITY CHARGE (CFC)
A $2.50 per day CFC was approved by the Board of Commissioners effective September 1, 2000. The CFC collection is limited to seven days per rental contract. For the years ended September 30, 2016 and 2015, the Authority collected $204,000 and $245,000, respectively. There was a balance of $1,381,000 and $1,173,000 in 2016 and 2015 respectively, restricted for future car rental facilities projects.
26

CITY OF NAPLES AIRPORT AUTHORITY NOTES TO FINANCIAL STATEMENTS September 30, 2016 and 2015
NOTE 11 - RELATED PARTY TRANSACTIONS
The Airport is located on an area of approximately 732 acres of which 640 acres is leased land. The Authority holds a ninety-nine year lease from the City of Naples, which allows the Authority to use and sublet the land. The lease requires annual payments of one dollar. The lease expires in 2069. The Authority prepaid this lease in January 1997.
The City provides certain services to the Authority including firefighting personnel, fire truck maintenance, police services and utilities. Total expense incurred by the Authority during the years ended September 30, 2016 and 2015 for these services were $621,000 and $689,000, respectively.
The City leases approximately 16 acres of a former landfill site from the Authority to use as a garbage collection and recycle transfer facility. In lieu of rent, the City provides recyclable material collection services and post-disaster recovery assistance.
NOTE 12 - CAPITAL CONTRIBUTIONS
Since its inception, the Authority has received capital contributions through federal and state grants and from the City of Naples, Collier County and other parties as follows:
Year ended Inception 2016 To date
Federal $ 112,000 $ 39,894,000 State - 15,464,000 City of Naples - 202,000 Collier County - 163,000 Others 1,028,000 5,439,000 Total $ 1,140,000 $ 61,162,000
NOTE 13 - COMMITMENTS AND CONTINGENCIES
At September 30, 2016, the Authority had in process various construction, consulting and engineering contracts totaling $2,109,000. Expenditures on these contracts were $1,284,000, leaving commitments of up to $825,000.
The Authority is currently receiving, and has received in the past, grants which are subject to special compliance audits by the grantor agency, which may result in disallowed expense amounts. These amounts would constitute a contingent liability of the Authority. The Authority does not believe any contingent liabilities to be material.
27

CITY OF NAPLES AIRPORT AUTHORITY NOTES TO FINANCIAL STATEMENTS September 30, 2016 and 2015
NOTE 14 - EXPENDITURE OF FEDERAL AWARDS AND STATE ASSISTANCE
During 2016, the Authority expended the following on capital improvement projects:
Allowable Costs
Requiring Match
Match Requirement
Percent
Match Requirement
Dollars Cash Match
Applied
Federal
Construct Taxiway A (Reconfigure Taxiway A to Meet Design Standards)
Design Phase $ 124,353 10% $ 12,435 $ 12,435
28

CITY OF NAPLES AIRPORT AUTHORITYSCHEDULE OF AVAILABLE RESOURCES, REVENUES, RECEIPTS, EXPENSES AND EXPENDITURESNON-GAAP BUDGETARY BASIS AND ACTUALYear Ended September 30, 2016
Original and Final VarianceBudget Actual (Un)Favorable
AVAILABLE RESOURCES, REVENUES AND RECEIPTSAVAILABLE RESOURCES AT BEGINNING OF YEARRestricted 1,174,000$ 1,173,000$ (1,000)$ Operating and capital reserves 4,000,000 4,000,000 - Unrestricted 16,392,000 12,792,000 (3,600,000)
Total available resources at beginning of year 21,566,000 17,965,000 (3,601,000)
OPERATING REVENUESFuel sales (net) 8,558,000 8,786,000 228,000Concession fees 829,000 716,000 (113,000)Hangar/T-shelter rents 2,498,000 2,413,000 (85,000)Building and land rents 1,271,000 1,327,000 56,000Line services 764,000 698,000 (66,000)U.S. Customs and Border Protection user fees 288,000 311,000 23,000Fuel vendor's cooperative marketing 20,000 23,000 3,000Other 5,000 5,000 -
Net operating revenues 14,233,000 14,279,000 46,000
NON-OPERATING REVENUESCustomer facility charges 275,000 204,000 (71,000)Claims and insurance settlements - 6,000 6,000Investment earnings 66,000 109,000 43,000
Total non-operating revenues 341,000 319,000 (22,000)
RECEIPTSCapital contributions 2,557,000 1,140,000 (1,417,000) Total receipts 2,557,000 1,140,000 (1,417,000)
TOTAL REVENUES AND RECEIPTS 17,131,000 15,738,000 (1,393,000)
TOTAL AVAILABLE RESOURCES, REVENUES
AND RECEIPTS 38,697,000$ 33,703,000$ (4,994,000)$
29

CITY OF NAPLES AIRPORT AUTHORITYSCHEDULE OF AVAILABLE RESOURCES, REVENUES, RECEIPTS, EXPENSES AND EXPENDITURESNON-GAAP BUDGETARY BASIS AND ACTUAL (Continued)Year Ended September 30, 2016
Original and Final VarianceBudget Actual (Un)Favorable
TOTAL AVAILABLE RESOURCES, REVENUES AND RECEIPTS 38,697,000$ 33,703,000$ (4,994,000)$
EXPENSES AND EXPENDITURESOPERATING EXPENSESPersonnel 5,524,000 5,385,000 139,000Professional fees 971,000 783,000 188,000Communications 233,000 199,000 34,000 Insurance 499,000 461,000 38,000Utilities and environmental 306,000 265,000 41,000Office/postage/printing 120,000 116,000 4,000ATCT, ARFF and police service 817,000 715,000 102,000U. S. Customs and Border Protection 343,000 295,000 48,000Dues/subscriptions/fees 49,000 43,000 6,000Auto gas and diesel fuel 90,000 48,000 42,000Pilot services 60,000 64,000 (4,000)Maintenance and repair 788,000 1,097,000 (309,000) Operating expenses 9,800,000 9,471,000 329,000
CAPITAL EXPENDITURES 10,410,000 6,011,000 4,399,000
TOTAL EXPENSES AND EXPENDITURES 20,210,000 15,482,000 4,728,000
AVAILABLE RESOURCES AT YEAR END Restricted 1,112,000 1,381,000 269,000 Operating and capital reserves 4,000,000 5,000,000 1,000,000 Unrestricted 4,649,000 11,840,000 7,191,000 TOTAL AVAILABLE RESOURCES AT YEAR END 18,487,000 18,221,000 (266,000)
NET CHANGE IN AVAILABLE RESOURCES BALANCE (3,079,000)$ 256,000$ 3,335,000$
RECONCILIATION OF BUDGETARY BASIS TO GAAPCHANGE IN NET POSITION - BUDGETARY BASIS
256,000$ Add: Capital expenditures 6,011,000
Less: Depreciation and amortization (3,791,000)
Loss on disposal of capital assets (16,000)
CHANGE IN NET POSITION - GAAP 2,460,000$
30


BLANK PAGE

STATISTICAL SECTION
This part of the City of Naples Airport Authority’s comprehensive annual financial report presents detailed information as a context for understanding what the information in the financial statements, note disclosures, and required supplementary information says about the Authority’s overall financial health.
Contents Page
Financial Trends 33 These schedules contain trend information to help the reader understand how the Authority’s financial performance and health have changed over time.
Revenue Capacity 36 These schedules contain information to help the reader to assess the Authority’s most significant revenue source, aviation fuel sales.
Debt Capacity 39 This schedule presents information to help the reader assess the Authority’s ability to issue debt in the future.
Demographic and Economic Indicators 39 These schedules offer demographic and economic indicators to help the reader understand the environment within which the Authority’s financial activities take place.
Operating Information 41 These schedules contain information about the Authority’s operations and resources to help the reader understand how the Authority’s financial information relates to the services the Authority provides and the activities it performs.
Miscellaneous Information 45 This schedule provides the reader with information on the sources of the Authority’s contributed capital.
Sources: Unless otherwise noted, the information in these schedules is derived from the comprehensive annual financial reports for the relevant year.
31

PAGE INTENTIONALLY LEFT BLANK

NE
T P
OS
ITIO
N B
Y C
OM
PO
NE
NT
, LA
ST
TE
N F
ISC
AL
YE
AR
S
2007
2008
2009
2010
2011
2012
2013
2014
2015
2016
Inve
stm
ent i
n C
apit
al A
sset
s33
,779
,000
$
37,5
86,0
00$
45
,749
,000
$
48,5
33,0
00$
51
,583
,000
$
51,1
79,0
00$
52
,132
,000
$
55,3
23,0
00$
60
,372
,000
$
60,7
38,0
00$
R
estr
icte
d28
,000
18
,000
17
6,00
0
28
8,00
0
47
1,00
0
479,
000
61
2,00
0
928,
000
1,
173,
000
1,
381,
000
U
nres
tric
ted
9,82
1,00
0
12,0
91,0
00
11
,944
,000
12,9
67,0
00
12
,784
,000
14,1
03,0
00
15
,032
,000
17,7
63,0
00
17
,185
,000
19,0
71,0
00
Tot
al n
et p
osit
ion
43,6
28,0
00$
49
,695
,000
$
57,8
69,0
00$
61
,788
,000
$
64,9
65,0
00$
65
,761
,000
$
67,7
76,0
00$
74
,014
,000
$
78,7
30,0
00$
81
,190
,000
$
33

CITY OF NAPLES AIRPORT AUTHORITYNAPLES, FLORIDA
CHANGES IN NET POSITION, LAST TEN FISCAL YEARS
2007 2008 2009 2010 2011OPERATING REVENUES
Fuel sales (net) 7,103,000$ 7,351,000$ 5,813,000$ 5,860,000$ 6,441,000$ Concession fees 1,474,000 666,000 573,000 541,000 598,000 Hangar/T-shelter/tiedown 1,289,000 1,535,000 1,618,000 1,559,000 1,664,000 Building and land rent 951,000 977,000 989,000 958,000 958,000 Line services 221,000 408,000 301,000 379,000 419,000 U.S. Customs user fees - - - - 103,000 Other 86,000 36,000 8,000 35,000 17,000
Net operating revenues 11,124,000 10,973,000 9,302,000 9,332,000 10,200,000
OPERATING EXPENSESPersonnel 3,910,000 4,479,000 3,967,000 3,742,000 3,992,000 Professional fees 865,000 541,000 355,000 514,000 602,000 Communications 301,000 318,000 102,000 62,000 126,000 Insurance 736,000 598,000 512,000 443,000 443,000 Utilities and environmental 396,000 349,000 342,000 292,000 284,000 Office/postage/printing 45,000 40,000 32,000 38,000 37,000 ATCT, ARFF and police service 606,000 650,000 695,000 687,000 665,000 U.S. Customs and Boarder Patrol expense - - - - 342,000 Dues/subscriptions/fees 25,000 27,000 32,000 33,000 37,000 Auto gas and diesel fuel 71,000 82,000 67,000 44,000 53,000 Pilot services 33,000 41,000 27,000 47,000 51,000 Maintenance and repair 503,000 859,000 393,000 811,000 462,000 Hurricane recovery/repair - - 20,000 - - Depreciation and amortization 1,673,000 1,733,000 2,105,000 2,624,000 2,791,000
Total operating expenses 9,164,000 9,717,000 8,649,000 9,337,000 9,885,000
Operating income (loss) 1,960,000 1,256,000 653,000 (5,000) 315,000
NON-OPERATING REVENUES (EXPENSES)Customer facility charges 235,000 209,000 170,000 137,000 186,000 Passenger facility charges - - - - - Interest revenue 466,000 205,000 104,000 51,000 68,000 Unrealized gain (loss) on investments - (101,000) (85,000) 93,000 39,000 Realized gain (loss) on investment - - - - - Claims and Insurance Settlements -Liquidate - - - - - Grant revenue 511,000 226,000 - - - Insurance proceeds - 2,154,000 - - - Interest expense (33,000) (32,000) (31,000) (30,000) (29,000) Contribution of capital asset to government agency - (556,000) - - - Gain (Loss) on disposal of capital assets 731,000 10,000 9,000 7,000 3,000
Total non-operating revenues (expenses) 1,910,000 2,115,000 167,000 258,000 267,000
Income (loss) before capital contributions 3,870,000 3,371,000 820,000 253,000 582,000
Capital contributions 2,812,000 2,696,000 7,354,000 3,666,000 2,595,000
Change in net position 6,682,000$ 6,067,000$ 8,174,000$ 3,919,000$ 3,177,000$
34

2012 2013 2014 2015 2016
6,512,000$ 6,580,000$ 7,905,000$ 8,310,000$ 8,786,000$ 623,000 692,000 732,000 810,000 716,000
1,718,000 2,008,000 2,268,000 2,439,000 2,413,000 1,020,000 1,023,000 1,221,000 1,256,000 1,327,000
423,000 697,000 639,000 738,000 698,000 163,000 174,000 251,000 277,000 311,000 16,000 9,000 5,000 15,000 28,000
10,475,000 11,183,000 13,021,000 13,845,000 14,279,000
4,219,000 4,090,000 4,556,000 4,982,000 5,385,000 452,000 684,000 628,000 706,000 783,000 102,000 148,000 185,000 121,000 199,000 480,000 496,000 447,000 464,000 461,000 274,000 262,000 277,000 251,000 265,000 35,000 69,000 126,000 134,000 116,000
697,000 677,000 664,000 700,000 715,000 299,000 279,000 317,000 309,000 295,000 35,000 39,000 39,000 49,000 43,000 71,000 73,000 73,000 61,000 48,000 55,000 53,000 59,000 68,000 64,000
427,000 488,000 610,000 541,000 1,097,000 - - - -
3,164,000 3,241,000 3,432,000 3,619,000 3,791,000
10,310,000 10,599,000 11,413,000 12,005,000 13,262,000
165,000 584,000 1,608,000 1,840,000 1,017,000
207,000 231,000 237,000 246,000 204,000 - - -
64,000 71,000 68,000 59,000 109,000 51,000 23,000 -
- - (13,000) 21,000 - - - 26,000 75,000 6,000 - - - - - 3,000 - -
(28,000) (16,000) - -
(50,000) - - - 3,000 20,000 4,000 5,000 (16,000)
247,000 332,000 322,000 406,000 303,000
412,000 916,000 1,930,000 2,246,000 1,320,000
384,000 1,099,000 4,308,000 2,470,000 1,140,000
796,000$ 2,015,000$ 6,238,000$ 4,716,000$ 2,460,000$
35

CIT
Y O
F N
AP
LE
S A
IRP
OR
T A
UT
HO
RIT
YN
AP
LE
S, F
LO
RID
A
AV
ER
AG
E A
VIA
TIO
N F
UE
L M
AR
GIN
S (
PE
R G
AL
LO
N)
Pre
paid
Ann
ual
Prep
aid
Fis
cal
Ful
lF
ull
Vol
ume
Sch
edul
edF
ull
Ful
lP
ubli
cS
ched
uled
Yea
rFl
owag
eSe
rvic
eSe
rvic
eD
isco
unt
Air
line
Serv
ice
Serv
ice
Self
Fue
ling
Air
line
2007
0.31
$
1.70
$
1.12
$
1.04
$
0.
40$
1.04
$
0.
78$
0.79
$
0.
39$
20
080.
29$
1.
78$
1.
20$
1.
15$
0.53
$
1.
47$
1.26
$
1.
22$
0.86
$
2009
0.30
$
1.88
$
1.29
$
1.20
$
-
1.
09$
0.80
$
0.
78$
0.17
$
2010
0.30
$
1.97
$
1.34
$
1.25
$
-
0.
90$
0.75
$
0.
52$
-
2011
0.30
$
1.97
$
1.34
$
1.25
$
-
0.
94$
0.76
$
0.
55$
-
2012
0.30
$
2.02
$
1.30
$
1.18
$
-
0.
93$
0.75
$
0.
53$
-
2013
0.30
$
2.01
$
1.29
$
1.17
$
-
0.
91$
0.76
$
0.
53$
-
2014
0.30
$
2.01
$
1.30
$
1.18
$
-
0.
93$
0.75
$
0.
53$
-
2015
0.30
$
1.96
$
1.29
$
1.17
$
-
0.
91$
0.76
$
0.
53$
-
2016
0.30
$
1.93
$
1.34
$
0.87
$
0.
11$
0.73
$
0.
45$
0.65
$
-
AV
IAT
ION
FU
EL
SA
LE
S (
GA
LL
ON
S)
Pre
paid
Ann
ual
Prep
aid
Fis
cal
Ful
lF
ull
Vol
ume
Sch
edul
edF
ull
Ful
lP
ubli
cS
ched
uled
Yea
rFl
owag
eSe
rvic
eSe
rvic
eD
isco
unt
Air
line
Tot
alSe
rvic
eSe
rvic
eSe
lf F
ueli
ngA
irli
neT
otal
2007
689,
588
2,04
0,12
9
1,29
5,32
5
1,61
9,30
1
391,
694
6,
036,
037
198,
825
20
5,73
7
66,8
05
15
,656
48
7,02
3
2008
607,
642
2,01
7,53
0
1,22
8,95
6
1,62
2,48
4
483
5,
477,
095
137,
950
23
8,78
1
51,8
71
27
,489
45
6,09
1
2009
455,
104
1,38
1,58
6
1,12
9,92
2
1,25
1,95
8
- 4,
218,
570
122,
045
22
7,69
8
41,5
35
2,
540
393,
818
20
1041
7,74
9
1,
280,
427
1,
141,
723
1,
331,
142
-
4,17
1,04
1
12
2,53
1
154,
119
43
,342
-31
9,99
2
2011
464,
992
1,59
2,83
1
1,09
3,73
4
1,40
7,79
3
- 4,
559,
350
118,
531
13
6,55
9
71,0
32
-
326,
122
20
1247
7,52
1
1,
544,
348
1,
247,
745
1,
422,
233
-
4,69
1,84
7
12
8,03
5
129,
737
97
,103
-35
4,87
5
2013
396,
364
1,65
0,05
1
1,31
8,86
1
1,27
2,36
9
- 4,
637,
645
150,
996
12
2,40
2
114,
609
-
388,
006
20
1429
2,83
2
2,
062,
984
1,
609,
354
1,
774,
311
-
5,73
9,48
1
14
6,32
7
113,
920
11
7,72
1
-37
7,96
8
2015
248,
968
2,27
9,12
2
1,56
8,15
9
1,92
3,02
6
- 6,
019,
275
143,
677
11
7,43
7
130,
333
-
391,
447
20
1625
2,56
8
2,
458,
314
1,
535,
659
2,
086,
491
37
,509
6,
370,
541
158,
993
10
6,48
7
115,
206
-
380,
686
Jet
A
Jet
A
100
Low
Lea
d
100
Low
Lea
d
36

AV
IAT
ION
FU
EL
SA
LE
S (
NE
T R
EV
EN
UE
)
Pre
paid
Ann
ual
Prep
aid
Fis
cal
Ful
lF
ull
Vol
ume
Sch
edul
edF
ull
Ful
lP
ubli
cS
ched
uled
Yea
rFl
owag
eSe
rvic
eSe
rvic
eD
isco
unt
Air
line
Tot
alSe
rvic
eSe
rvic
eSe
lf F
ueli
ngA
irli
neT
otal
2007
210,
693
$
3,45
9,75
0$
1,45
5,75
1$
1,68
9,44
0$
157,
165
$
6,
972,
799
$
206,
990
$
16
0,57
0$
52,5
84$
6,
089
$
426,
233
$
2008
178,
725
$
3,58
3,48
7$
1,47
4,82
7$
1,87
1,70
8$
256
$
7,
109,
003
$
203,
231
$
30
0,41
7$
63,1
33$
23
,737
$
59
0,51
8$
20
0913
5,93
7$
2,
598,
651
$
1,
454,
081
$
1,
504,
865
$
-
5,69
3,53
4$
13
3,62
5$
181,
976
$
32
,486
$
421
$
34
8,50
8$
20
1012
5,32
3$
2,
519,
840
$
1,
532,
421
$
1,
667,
402
$
-
5,84
4,98
6$
11
0,23
2$
116,
228
$
22
,731
$
-24
9,19
1$
20
1113
8,30
8$
3,
137,
801
$
1,
461,
453
$
1,
760,
216
$
-
6,49
7,77
8$
11
1,20
2$
103,
734
$
38
,892
$
-25
3,82
8$
20
1214
1,77
0$
3,
112,
119
$
1,
620,
039
$
1,
685,
166
$
-
6,55
9,09
4$
11
8,66
2$
97,4
91$
51,9
29$
-
268,
082
$
2013
118,
909
$
3,31
4,62
6$
1,70
3,30
2$
1,49
1,47
8$
- 6,
628,
315
$
137,
658
$
92
,558
$
60
,698
$
-29
0,91
4$
20
1487
,850
$
4,
146,
860
$
2,
057,
286
$
1,
810,
718
$
-
8,10
2,71
4$
11
5,52
6$
47,6
80$
75,0
25$
-
238,
231
$
2015
74,6
90$
4,47
0,68
1$
1,94
8,10
8$
1,90
2,02
7$
- 8,
395,
506
$
116,
885
$
59
,284
$
76
,947
$
-25
3,11
6$
20
1675
,770
$
4,
752,
120
$
1,
885,
624
$
2,
094,
370
$
4,
281
$
8,81
2,16
5$
14
2,93
6$
53,9
79$
84,9
67$
-
281,
882
$
Sou
rce:
Aut
hori
ty's
Fin
ance
Dep
artm
ent r
ecor
ds
Not
es:
The
Exe
cuti
ve D
irec
tor
is a
utho
rize
d to
adj
ust f
uel c
harg
es a
t any
tim
e, w
ith
or w
itho
ut n
otic
e.T
he A
utho
rity
's fu
el c
harg
es to
cus
tom
ers
are
base
d on
a c
ost p
lus
form
ula
(cos
t of
fuel
+ m
argi
n).
The
Aut
hori
ty o
ffer
s va
riou
s fu
el p
rogr
ams
to m
eet A
irpo
rt c
usto
mer
s' ne
eds.
Avi
atio
n fu
el s
ales
(ne
t rev
enue
) do
es n
ot in
clud
e av
iati
on o
il s
ales
, non
-avi
atio
n fu
el s
ales
, fue
l tru
ck r
enta
l and
cre
dit c
ard
fees
,
whi
ch a
re in
clud
ed in
Fue
l sal
es (
net)
as
show
on
the
Stat
emen
t of
Rev
enue
s, E
xpen
ses
and
Cha
nges
in N
et P
osit
ion.
100
Low
Lea
dJe
t A
37

PRINCIPAL CUSTOMERS - BY GROSS SALESFor the Years Ended September 30,
Company Gross Sales% of Total Gross
Sales Gross Sales% of Total Gross Sales
Net Jets 4,016,670$ 28.1% 3,491,312$ 13.9%Naples Jet Center/Eagle Creek 2,767,026$ 19.4%Flexjet 1,358,406$ 9.5% 716,393$ 2.8%Hertz Corporation 992,144$ 6.9% 577,434$ 2.3%Cable Vision 805,111$ 6.9%Travel Management Company 503,605$ 3.5%Delta Private Jets 439,237$ 3.1%Sweet Aviation 329,030$ 2.3%Transjet 314,913$ 2.2%Avis Rent-a-Car 238,420$ 1.7% 493,087$ 2.0%Delta Airlines 1,060,511$ 4.2%Flight Options 671,707$ 2.7%Citation Shares 519,686$ 2.1%Enterprise Rent A Car 440,055$ 1.7%Dollar Rent A Car-Florida 426,399$ 1.7%Naples Air Center, Inc 335,142$ 1.3%
Source: Authority's accounting records
PRINCIPAL CUSTOMERS - BY AVIATION FUEL GALLONSFor the Years Ended September 30,
CompanyAviation Fuel
Gallons% of Total
Aviation GallonsAviation Fuel
Gallons
% of Total Aviation Gallons
Net Jets 1,371,127 20.4% 1,046,036 16.0%Flex Jets 457,814 6.8% 213,907 3.3%Naples Jet Center/Eagle creek 329,343 4.9%Travel Management 151,869 2.3%Delta Private Jet 136,994 2.0%Whitesell Corporation 67,162 1.0%XOJET 61,996 0.9%Wheels up /Gamma Aviation 56,955 0.8%Olympus Campus 52,210 0.8%Naples Air Inc 48,498 0.7%Delta Airlines 391,049 6.0%Health Management Associates 227,648 3.5%Flight Options 202,035 3.1%CitationShares 156,213 2.4%ST Aviation 102,816 1.6%ASG 98,876 1.5%Naples Airport Properties 86,914 1.3%Naples Air Center 84,267 1.3%
Source: Authority's accounting records
2016 2007
2016 2007
38
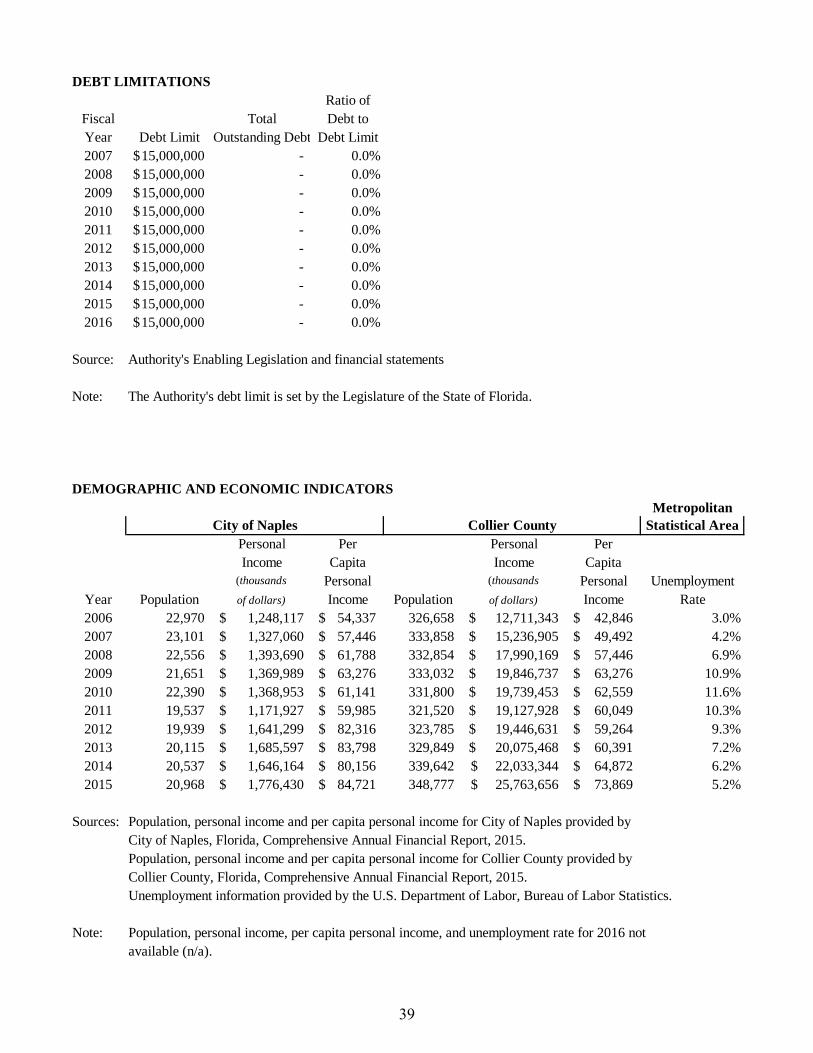
DEBT LIMITATIONSRatio of
Fiscal Total Debt toYear Debt Limit Outstanding Debt Debt Limit2007 15,000,000$ - 0.0%2008 15,000,000$ - 0.0%2009 15,000,000$ - 0.0%2010 15,000,000$ - 0.0%2011 15,000,000$ - 0.0%2012 15,000,000$ - 0.0%2013 15,000,000$ - 0.0%2014 15,000,000$ - 0.0%2015 15,000,000$ - 0.0%2016 15,000,000$ - 0.0%
Source: Authority's Enabling Legislation and financial statements
Note: The Authority's debt limit is set by the Legislature of the State of Florida.
DEMOGRAPHIC AND ECONOMIC INDICATORSMetropolitan
Statistical AreaPersonal Per Personal PerIncome Capita Income Capita
(thousands Personal (thousands Personal UnemploymentYear Population of dollars) Income Population of dollars) Income Rate2006 22,970 1,248,117$ 54,337$ 326,658 12,711,343$ 42,846$ 3.0%2007 23,101 1,327,060$ 57,446$ 333,858 15,236,905$ 49,492$ 4.2%2008 22,556 1,393,690$ 61,788$ 332,854 17,990,169$ 57,446$ 6.9%2009 21,651 1,369,989$ 63,276$ 333,032 19,846,737$ 63,276$ 10.9%2010 22,390 1,368,953$ 61,141$ 331,800 19,739,453$ 62,559$ 11.6%2011 19,537 1,171,927$ 59,985$ 321,520 19,127,928$ 60,049$ 10.3%2012 19,939 1,641,299$ 82,316$ 323,785 19,446,631$ 59,264$ 9.3%2013 20,115 1,685,597$ 83,798$ 329,849 20,075,468$ 60,391$ 7.2%2014 20,537 1,646,164$ 80,156$ 339,642 22,033,344$ 64,872$ 6.2%2015 20,968 1,776,430$ 84,721$ 348,777 25,763,656$ 73,869$ 5.2%
Sources: Population, personal income and per capita personal income for City of Naples provided byCity of Naples, Florida, Comprehensive Annual Financial Report, 2015.Population, personal income and per capita personal income for Collier County provided byCollier County, Florida, Comprehensive Annual Financial Report, 2015.Unemployment information provided by the U.S. Department of Labor, Bureau of Labor Statistics.
Note: Population, personal income, per capita personal income, and unemployment rate for 2016 notavailable (n/a).
City of Naples Collier County
39

PRINCIPAL EMPLOYERS
2015 2006
EmployerNumber of Employees Rank
Percent of Total County
EmploymentNumber of Employees Rank
Percent of Total County
EmploymentCollier County Public Schools 5,280 1 4.29% 5,000 1 4.62%NCH Healthcare System 4,000 2 3.25% 3,500 2 3.24%Publix Supermarkets 2,805 3 2.28% 2,221 5 2.05%Collier County Government (excl. Sheriff) 2,137 4 1.74% 2,364 4 2.19%Arthrex, Inc 1,709 5 1.39% - 0.00%Collier County Sheriff's Office 1,397 6 1.13% 1,100 7 1.02%Ritz Carlton Hotel 1,100 7 0.89% 1,500 6 1.39%Country Club of Naples 1,050 8 0.85% - 0.00%Seminole Casino Immokalee 875 9 0.70% - 0.00%Marriot Corporation 775 10 0.63% 843 8 0.78%Employee Professionals - 3,394 3 3.14%Naples Grande Beach Resort - 830 9 0.77%Cleveland Clinic - 790 10 0.73%Other Employers 102,054 82.85% 86,577 80.07%Totals 123,182 100.00% 108,119 100.00%
Source: Collier County, Florida, Comprehensive Annual Financial Report, 2015
Note: Data on Principal Employers for 2016 not yet available.
40

CITY OF NAPLES AIRPORT AUTHORITYNAPLES, FLORIDA
AVIATION FUEL AND AIRCRAFT OPERATIONS STATISTICS
FiscalYear 100LL Jet A Total Local Itinerant Total2007 487,023 6,036,037 6,523,060 31,263 101,476 132,739 2008 456,091 5,477,095 5,933,186 34,966 94,765 129,731 2009 393,819 4,218,570 4,612,389 32,885 80,018 112,903 2010 319,992 4,171,041 4,491,033 20,029 66,158 86,187 2011 326,122 4,563,303 4,889,425 18,323 66,016 84,339 2012 354,926 4,691,847 5,046,773 18,835 68,243 87,078 2013 388,006 4,637,645 5,025,651 19,537 70,242 89,779 2014 377,967 5,739,481 6,117,448 20,256 72,848 93,104 2015 391,446 6,019,275 6,410,721 19,798 79,771 99,569 2016 380,686 6,370,541 6,751,227 16,864 78,186 95,050
Source: Authority's Operations and Finance Department records
Aviation Fuel Gallons Aircraft Operations
-
20,000
40,000
60,000
80,000
100,000
120,000
140,000
-
1,000,000
2,000,000
3,000,000
4,000,000
5,000,000
6,000,000
7,000,000
8,000,000
2007 2008 2009 2010 2011 2012 2013 2014 2015 2016
Aircraft OperationsAviation Gallons
Aviation Fuel Gallons & Aircraft Operations Historical ComparisonFY 2007 - FY 2016
100LL Jet A Total Local Itinerant Total
41
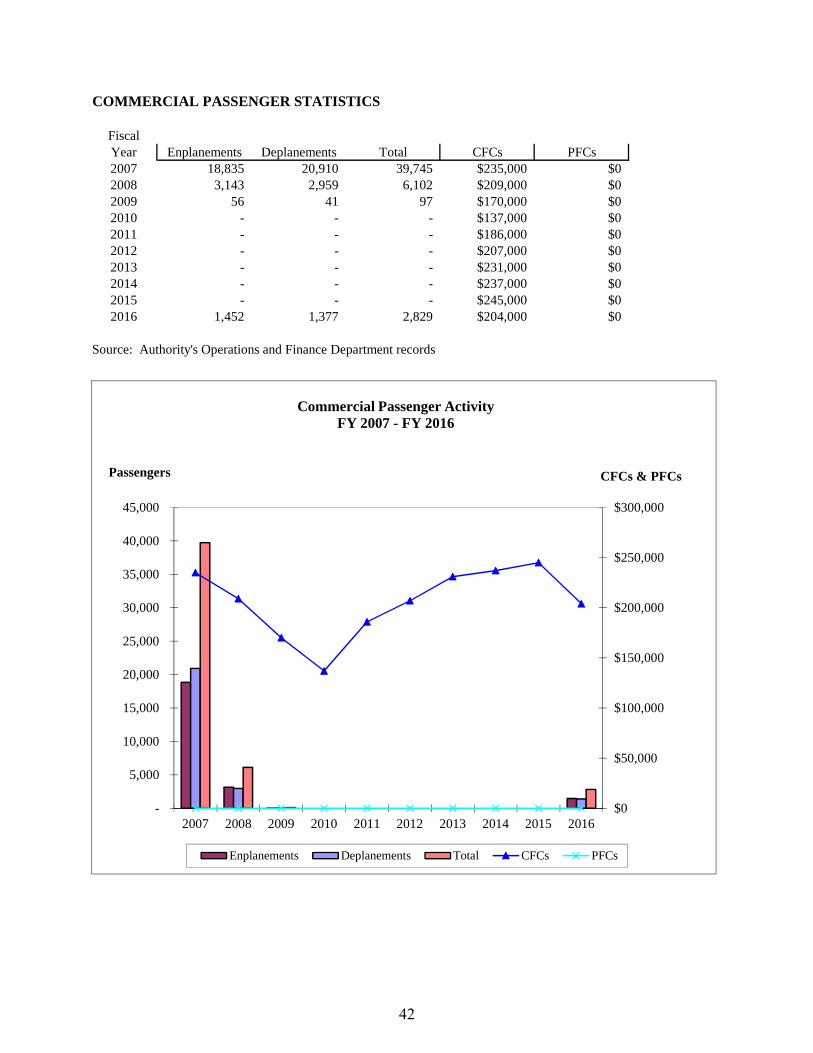
COMMERCIAL PASSENGER STATISTICS
FiscalYear Enplanements Deplanements Total CFCs PFCs2007 18,835 20,910 39,745 $235,000 $02008 3,143 2,959 6,102 $209,000 $02009 56 41 97 $170,000 $02010 - - - $137,000 $02011 - - - $186,000 $02012 - - - $207,000 $02013 - - - $231,000 $02014 - - - $237,000 $02015 - - - $245,000 $02016 1,452 1,377 2,829 $204,000 $0
Source: Authority's Operations and Finance Department records
$0
$50,000
$100,000
$150,000
$200,000
$250,000
$300,000
-
5,000
10,000
15,000
20,000
25,000
30,000
35,000
40,000
45,000
2007 2008 2009 2010 2011 2012 2013 2014 2015 2016
CFCs & PFCsPassengers
Commercial Passenger ActivityFY 2007 - FY 2016
Enplanements Deplanements Total CFCs PFCs
42

CIT
Y O
F N
AP
LE
S A
IRP
OR
T A
UT
HO
RIT
YN
AP
LE
S, F
LO
RID
A
FU
LL
-TIM
E E
QU
IVA
LE
NT
EM
PL
OY
EE
S B
Y F
UN
CT
ION
Las
t T
en F
isca
l Yea
rs
2007
2008
2009
2010
2011
2012
2013
2014
2015
2016
Cus
tom
er S
ervi
ce33
.3
37.8
30
.6
29.7
31
.0
30.7
30
.3
35.4
38
.6
39.4
O
pera
tion
s3.
2
3.
2
2.
4
2.
0
2.
0
2.
0
2.
0
2.
0
2.
0
2.
0
A
irpo
rt D
evel
opm
ent
2.0
2.0
1.9
2.0
2.0
2.0
2.0
2.0
2.0
2.0
Fac
ilit
ies
& C
usto
dial
18.0
19
.0
16.9
18
.0
16.9
16
.7
16.5
17
.0
17.2
18
.1
Sec
urit
y5.
0
5.
0
3.
7
2.
8
2.
8
3.
5
2.
9
2.
0
1.
8
2.
1
A
dmin
istr
atio
n9.
0
9.
0
6.
5
6.
6
6.
8
6.
1
6.
1
6.
2
7.
0
7.
3
E
xecu
tive
3.0
3.0
1.9
2.0
3.0
3.9
3.0
2.9
3.0
4.0
TO
TA
L E
MP
LO
YE
ES
73.5
79
.0
63.9
63
.1
64.5
64
.9
62.8
67
.5
71.6
74
.9
Sou
rce:
Aut
horit
y's
payr
oll r
ecor
ds
43
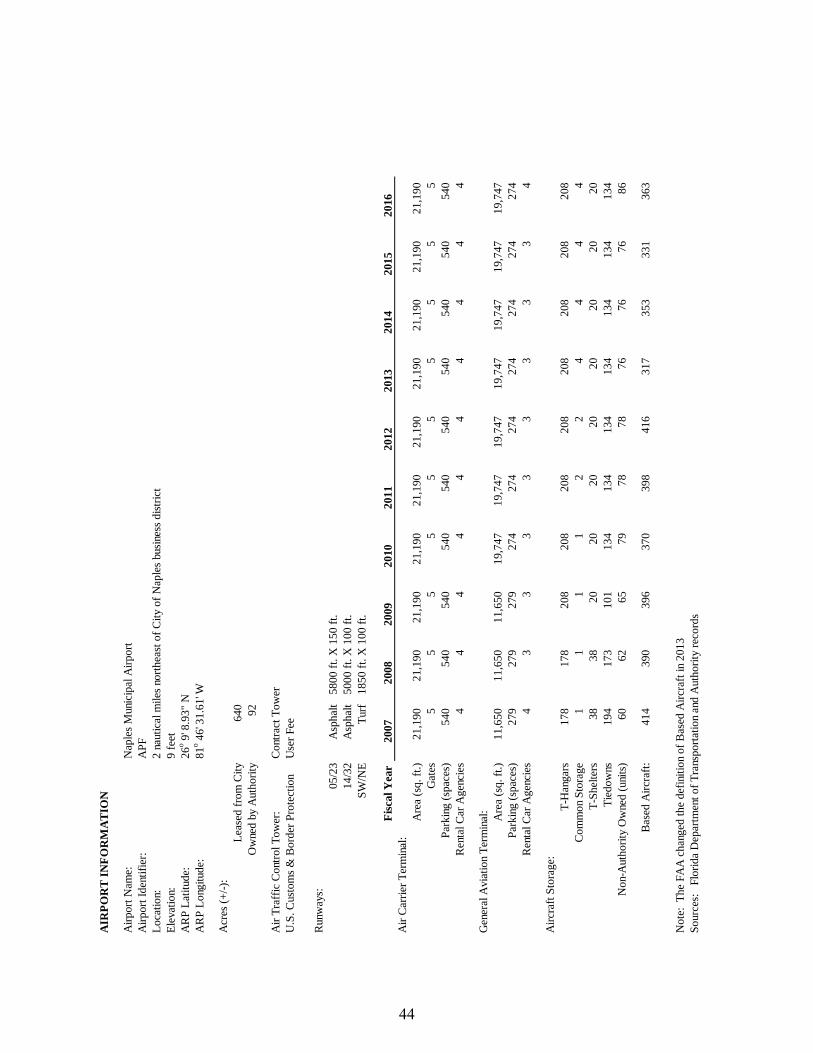
AIR
PO
RT
IN
FO
RM
AT
ION
Air
port
Nam
e:N
aple
s M
unic
ipal
Air
port
Air
port
Ide
ntif
ier:
AP
FL
ocat
ion:
2 na
utic
al m
iles
nort
heas
t of
City
of
Nap
les
busi
ness
dis
tric
tE
leva
tion:
9 fe
etA
RP
Lat
itude
:26
o 9' 8
.93"
NA
RP
Lon
gitu
de:
81o 4
6' 3
1.61
' W
Acr
es (
+/-
):L
ease
d fr
om C
ity64
0O
wne
d by
Aut
hori
ty92
Air
Tra
ffic
Con
trol
Tow
er:
Con
trac
t Tow
erU
.S. C
usto
ms
& B
orde
r P
rote
ctio
nU
ser
Fee
Run
way
s:05
/23
Asp
halt
580
0 ft
. X 1
50 f
t.14
/32
Asp
halt
500
0 ft
. X 1
00 f
t.S
W/N
ET
urf
185
0 ft
. X 1
00 f
t.
Fis
cal Y
ear
2007
2008
2009
2010
2011
2012
2013
2014
2015
2016
Air
Car
rier
Ter
min
al:
Are
a (s
q. f
t.)21
,190
21,1
90
21
,190
21,1
90
21
,190
21,1
90
21
,190
21,1
90
21
,190
21,1
90
G
ates
5
5
5
5
5
5
5
5
5
5
Par
king
(sp
aces
)54
0
54
0
54
0
54
0
54
0
54
0
54
0
54
0
54
0
54
0
R
enta
l Car
Age
ncie
s4
4
4
4
4
4
4
4
4
4
Gen
eral
Avi
atio
n T
erm
inal
:A
rea
(sq.
ft.)
11,6
50
11
,650
11,6
50
19
,747
19,7
47
19
,747
19,7
47
19
,747
19,7
47
19
,747
Par
king
(sp
aces
)27
9
27
9
27
9
27
4
27
4
27
4
27
4
27
4
27
4
27
4
R
enta
l Car
Age
ncie
s4
3
3
3
3
3
3
3
3
4
Air
craf
t Sto
rage
:T
-Han
gars
178
178
208
208
208
208
208
208
208
208
Com
mon
Sto
rage
1
1
1
1
2
2
4
4
4
4
T-S
helte
rs38
38
20
20
20
20
20
20
20
20
T
iedo
wns
194
173
101
134
134
134
134
134
134
134
Non
-Aut
hori
ty O
wne
d (u
nits
)60
62
65
79
78
78
76
76
76
86
Bas
ed A
ircr
aft:
414
390
396
370
398
416
317
353
331
363
Not
e: T
he F
AA
cha
nged
the
defi
nitio
n of
Bas
ed A
ircr
aft i
n 20
13S
ourc
es:
Flo
rida
Dep
artm
ent o
f T
rans
port
atio
n an
d A
utho
rity
rec
ords
44

CAPITAL CONTRIBUTIONS
Fiscal FAA FDOT Collier County City of Naples Other CumulativeYear Grants Grants Contributions Contributions Contributions Total
Prior to '73 -$ 15,827$ -$ 147,786$ -$ 163,613$ 1973 9,257 19,263 - - - 192,133$ 1974 4,493 26,124 - - 988 223,738$ 1975 127,287 7,336 - - 144 358,505$ 1976 74,901 34,328 - - - 467,734$ 1977 747,326 34,745 - - - 1,249,805$ 1978 647,159 42,890 - - - 1,939,854$ 1979 - - - - 2,600 1,942,454$ 1980 93,321 14,354 - - 350,376 2,400,505$ 1981 260,871 224,458 - - - 2,885,834$ 1982 34,124 439,785 - - - 3,359,743$ 1983 66,776 15,375 - - - 3,441,894$ 1984 1,175,584 152,469 - - - 4,769,947$ 1985 844,538 29,251 - - - 5,643,736$ 1986 258,173 38,923 - - - 5,940,832$ 1987 472,659 52,396 3,976 3,977 - 6,473,840$ 1988 291,391 12,701 6,336 - - 6,784,268$ 1989 826,111 280,884 2,664 - 9,826 7,903,753$ 1990 267,587 45,124 - - 677 8,217,141$ 1991 1,647,653 957,458 - - - 10,822,252$ 1992 77,348 477,897 - - - 11,377,497$ 1993 450,449 361,584 - - - 12,189,530$ 1994 426,795 105,326 - - - 12,721,651$ 1995 535,632 1,272,510 - - - 14,529,793$ 1996 514,109 43,953 - - - 15,087,855$ 1997 2,116,513 (1,032,265) - - - 16,172,103$ 1998 180,892 639,094 - - - 16,992,089$ 1999 515,784 876,626 - - - 18,384,499$ 2000 1,507,835 426,705 - - - 20,319,039$ 2001 1,256,599 1,333,664 - 50,000 78,000 23,037,302$ 2002 1,234,773 994,788 150,000 - 2,500 25,419,363$ 2003 659,193 292,038 - - - 26,370,594$ 2004 - 161,643 - - - 26,532,237$ 2005 1,075,963 656,212 - - - 28,264,412$ 2006 1,410,431 414,753 - - 2,777,709 32,867,305$ 2007 2,271,245 175,881 - - 364,706 35,679,137$ 2008 639,889 2,038,259 - - 17,579 38,374,864$ 2009 6,568,040 752,255 - - 34,247 45,729,406$ 2010 2,940,811 724,826 - - - 49,395,043$ 2011 1,723,983 - - - 642,079 51,761,105$ 2012 382,287 2,170 - - - 52,145,562$ 2013 1,040,966 57,803 - - - 53,244,331$ 2014 3,966,282 341,928 - - - 57,552,541$ 2015 436,737 1,902,645 - 130,512 60,022,435$ 2016 112,000 1,028,000 61,162,435$
Source: Authority's financial statements and accounting recordsNote: Other Contributions for 2006 include the acquisition of the NAA North Facility.
45

PAGE INTENTIONALLY LEFT BLANK


BLANK PAGE

CliftonLarsonAllen LLPCLAconnect.com
INDEPENDENT AUDITORS’ REPORT ON INTERNAL CONTROL OVER FINANCIAL REPORTING AND ON COMPLIANCE AND OTHER MATTERS BASED ON AN AUDIT OF FINANCIAL
STATEMENTS PERFORMED IN ACCORDANCE WITH GOVERNMENT AUDITING STANDARDS Board of Commissioners City of Naples Airport Authority Naples, Florida We have audited, in accordance with the auditing standards generally accepted in the United States of America and the standards applicable to financial audits contained in Government Auditing Standards issued by the Comptroller General of the United States, the statement of net position and the related statements of revenues, expenses, and changes in net position and cash flows of the City of Naples Airport Authority (Authority), as of and for the year ended September 30, 2016, and the related notes to the financial statements, which collectively comprise the Authority’s basic financial statements, and have issued our report thereon dated February 14, 2017. Internal Control Over Financial Reporting In planning and performing our audit of the financial statements, we considered the Authority's internal control over financial reporting (internal control) to determine the audit procedures that are appropriate in the circumstances for the purpose of expressing our opinion on the financial statements, but not for the purpose of expressing an opinion on the effectiveness of the Authority’s internal control. Accordingly, we do not express an opinion on the effectiveness of the Authority’s internal control. A deficiency in internal control exists when the design or operation of a control does not allow management or employees, in the normal course of performing their assigned functions, to prevent, or detect and correct, misstatements on a timely basis. A material weakness is a deficiency, or a combination of deficiencies, in internal control, such that there is a reasonable possibility that a material misstatement of the entity’s financial statements will not be prevented, or detected and corrected on a timely basis. A significant deficiency is a deficiency, or a combination of deficiencies, in internal control that is less severe than a material weakness, yet important enough to merit attention by those charged with governance. Our consideration of internal control was for the limited purpose described in the first paragraph of this section and was not designed to identify all deficiencies in internal control that might be material weaknesses or significant deficiencies. Given these limitations, during our audit we did not identify any deficiencies in internal control that we consider to be material weaknesses. However, material weaknesses may exist that have not been identified.
47

Board of Commissioners City of Naples Airport Authority
Compliance and Other Matters As part of obtaining reasonable assurance about whether the Authority's financial statements are free from material misstatement, we performed tests of its compliance with certain provisions of laws, regulations, contracts, and grant agreements, noncompliance with which could have a direct and material effect on the determination of financial statement amounts. However, providing an opinion on compliance with those provisions was not an objective of our audit, and accordingly, we do not express such an opinion. The results of our tests disclosed no instances of noncompliance or other matters that are required to be reported under Government Auditing Standards. Purpose of this Report The purpose of this report is solely to describe the scope of our testing of internal control and compliance and the result of that testing, and not to provide an opinion on the effectiveness of the entity’s internal control or on compliance. This report is an integral part of an audit performed in accordance with Government Auditing Standards in considering the entity’s internal control and compliance. Accordingly, this communication is not suitable for any other purpose.
CliftonLarsonAllen LLP
Fort Myers, Florida February 14, 2017
48


BLANK PAGE

CliftonLarsonAllen LLPCLAconnect.com
MANAGEMENT LETTER Board of Commissioners City of Naples Airport Authority Naples, Florida Report on the Financial Statements We have audited the financial statements of the City of Naples Airport Authority (Authority) as of and for the fiscal year ended September 30, 2016, and have issued our report thereon dated February 14, 2017. Auditors’ Responsibility We conducted our audit in accordance with auditing standards generally accepted in the United States of America; the standards applicable to financial audits contained in Government Auditing Standards, issued by the Comptroller General of the United States; and Chapter 10.550, Rules of the Auditor General. Other Reports We have issued our Independent Auditors’ Report on Internal Control over Financial Reporting and Compliance and Other Matters Based on an Audit of the Financial Statements Performed in Accordance with Government Auditing Standards; and Independent Accountants’ Report on an examination conducted in accordance with AICPA Professional Standards, Section 601, regarding compliance requirements in accordance with Chapter 10.550, Rules of the Auditor General. Disclosures in those reports, which are dated February 14, 2017, should be considered in conjunction with this management letter. Prior Audit Findings Section 10.554(1)(i)1., Rules of the Auditor General, requires that we determine whether or not corrective actions have been taken to address findings and recommendations made in the preceding annual financial audit report. There were no findings in the preceding annual financial audit. Official Title and Legal Authority Section 10.554(1)(i)4., Rules of the Auditor General, requires that the name or official title and legal authority for the primary government and each component unit of the reporting entity be disclosed in this management letter, unless disclosed in the notes to the financial statements. This information is disclosed in the notes to the financial statements.
49

Board of Commissioners City of Naples Airport Authority
Financial Condition Section 10.554(1)(i)5.a. and 10.556(7), Rules of the Auditor General, require that we apply appropriate procedures and report the results of our determination as to whether or not the Authority has met one or more of the conditions described in Section 218.503(1), Florida Statutes, and identification of the specific condition(s) met. In connection with our audit, we determined that the Authority did not meet any of the conditions described in Section 218.503(1), Florida Statutes. Pursuant to Sections 10.554(1)(i)5.c. and 10.556(8), Rules of the Auditor General, we applied financial condition assessment procedures. It is management’s responsibility to monitor the Authority’s financial condition, and our financial condition assessment was based in part on representations made by management and the review of financial information provided by same. Annual Financial Report Section 10.554(1)(i)5.b. and 10.556(7), Rules of the Auditor General, require that we apply appropriate procedures and report the results of our determination as to whether the annual financial report for the Authority for the fiscal year ended September 30, 2016, filed with the Florida Department of Financial Services pursuant to Section 218.32(1)(a), Florida Statutes, is in agreement with the annual financial audit report for the fiscal year ended September 30, 2016. In connection with our audit, we determined that these two reports were in agreement. Special District Component Units Section 10.554(1)(i)5.d., Rules of the Auditor General, requires that we determine whether or not a special district that is a component unit of a county, municipality, or special district, provided the financial information necessary for proper reporting of the component unit, within the audited financial statements of the county, municipality, or special district in accordance with Section 218.39(3)(b), Florida Statutes. The Authority does not have any special district component units. Other Matters Section 10.554(1)(i)2., Rules of the Auditor General, requires that we address in the management letter any recommendations to improve financial management. In connection with our audit, we did not have any such recommendations. Section 10.554(1)(i)3., Rules of the Auditor General, requires that we address noncompliance with provisions of contracts or grant agreements, or abuse, that have occurred, or are likely to have occurred, that have an effect on the financial statements that is less than material but which warrants the attention of those charged with governance. In connection with our audit, we did not have any such findings.
50

Board of Commissioners City of Naples Airport Authority
Purpose of this Letter Our management letter is intended solely for the information and use of the Legislative Auditing Committee, members of the Florida Senate and the Florida House of Representatives, the Florida Auditor General, Federal and other granting agencies, and applicable management, and is not intended to be and should not be used by anyone other than these specified parties.
CliftonLarsonAllen LLP
Fort Myers, Florida February 14, 2017
51

PAGE INTENTIONALLY LEFT BLANK

CliftonLarsonAllen LLPCLAconnect.com
INDEPENDENT ACCOUNTANTS’ REPORT Board of Commissioners City of Naples Airport Authority Naples, Florida We have examined the City of Naples Airport Authority's (Authority) compliance with Section 218.415, Florida Statutes, regarding the investment of public funds during the year ended September 30, 2016. Management is responsible for the Authority's compliance with those requirements. Our responsibility is to express an opinion on the Authority's compliance based on our examination. Our examination was conducted in accordance with attestation standards established by the American Institute of Certified Public Accountants and, accordingly, included examining, on a test basis, evidence about the Authority’s compliance with those requirements and performing such other procedures as we considered necessary in the circumstances. We believe that our examination provides a reasonable basis for our opinion. Our examination does not provide a legal determination on the Authority’s compliance with specified requirements. In our opinion, the Authority complied, in all material respects, with the aforementioned requirements for the year ended September 30, 2016. This report is intended solely for the information and use of the Authority and the Auditor General, State of Florida, and is not intended to be and should not be used by anyone other than these specified parties.
CliftonLarsonAllen LLP
Fort Myers, Florida February 14, 2017
53

PAGE INTENTIONALLY LEFT BLANK

55