Embed Size (px)
Citation preview

Component Tests User Manual
February 2009
EAZ0007E70C Rev. C

Trademarks AcknowledgementsSnap-on, Scanner, Fast-Track, and MODIS are trademarks of Snap-on Incorporated.
All other marks are trademarks or registered trademarks of their respective holders.
Copyright Information©2009 Snap-on Incorporated
All rights reserved.
DisclaimerThe information, specifications and illustrations in this manual are based on the latest information available at the time of printing.
Snap-on reserves the right to make changes at any time without notice.
Visit our website at:www.snapon.com/solus (North America)
snapondiag.com (Europe)
sun-diagnostics.com (Europe)
For Technical AssistanceCALL 1-800-424-7226 (North America)
CALL +44 (0) 845 601 4736 (United Kingdom)
E-mail [email protected] (United Kingdom)
For technical assistance in all other markets, contact your selling agent.

Safety Information
For your own safety and the safety of others, and to prevent damage to the equipment and vehicles upon which it is used, it is important that the accompanying Safety Information be read and understood by all persons operating, or coming into contact with, the equipment. We suggest you store a copy the book near the unit in sight of the operator.
This product is intended for use by properly trained and skilled professional automotive technicians. The safety messages presented throughout this manual are reminders to the operator to exercise extreme care when using this test instrument.
There are many variations in procedures, techniques, tools, and parts for servicing vehicles, as well as in the skill of the individual doing the work. Because of the vast number of test applications and variations in the products that can be tested with this instrument, we cannot possibly anticipate or provide advice or safety messages to cover every situation. It is the automotive technician’s responsibility to be knowledgeable of the system being tested. It is essential to use proper service methods and test procedures. It is important to perform tests in an appropriate and acceptable manner that does not endanger your safety, the safety of others in the work area, the equipment being used, or the vehicle being tested.
It is assumed that the operator has a thorough understanding of vehicle systems before using this product. Understanding of these system principles and operating theories is necessary for competent, safe and accurate use of this instrument.
Before using the equipment, always refer to and follow the safety messages and applicable test procedures provided by the manufacturer of the vehicle or equipment being tested. Use the equipment only as described in this manual.
Read, understand and follow all safety messages and instructions in this manual, the accompanying safety manual, and on the test equipment.
Safety Message ConventionsSafety messages are provided to help prevent personal injury and equipment damage. All safety messages are introduced by a signal word indicating the hazard level.
! DANGERIndicates an imminently hazardous situation which, if not avoided, will result in death or serious injury to the operator or to bystanders.
! WARNINGIndicates a potentially hazardous situation which, if not avoided, could result in death or serious injury to the operator or to bystanders.
iii

Safety Information Important Safety Instructions
! CAUTIONIndicates a potentially hazardous situation which, if not avoided, may result in moderate or minor injury to the operator or to bystanders.
Safety messages contain three different type styles.
• Normal type states the hazard.• Bold type states how to avoid the hazard.• Italic type states the possible consequences of not avoiding the hazard.
An icon, when present, gives a graphical description of the potential hazard.
Example:
! WARNINGRisk of unexpected vehicle movement.• Block drive wheels before performing a test with engine running.A moving vehicle can cause injury.
Important Safety InstructionsFor a complete list of safety messages, refer to the accompanying safety manual.
SAVE THESE INSTRUCTIONS
iv

Table of Contents
Safety Information ..................................................................................................................... iiiSafety Message Conventions....................................................................................................... iiiImportant Safety Instructions........................................................................................................iv
Table of Contents ....................................................................................................................... vConventions.................................................................................................................................. 1
Bold Text ................................................................................................................................ 1Symbols ................................................................................................................................. 1Terminology ........................................................................................................................... 2Note and Important Messages............................................................................................... 2Procedures............................................................................................................................. 2
Additional Manuals ....................................................................................................................... 3Tool Help ...................................................................................................................................... 3Screen Layout .............................................................................................................................. 5
Tests Screen.......................................................................................................................... 5Toolbars ................................................................................................................................. 6Main Body .............................................................................................................................. 9Status Bar .............................................................................................................................. 9
Making Selections ........................................................................................................................ 9Navigating Multi-Window Screens................................................................................................ 9Component Tests ....................................................................................................................... 12Identifying the Test Vehicle ........................................................................................................ 13
New Vehicle ID .................................................................................................................... 13Previous Vehicles ................................................................................................................ 14
Selecting a Component Test ...................................................................................................... 15Connecting to a Test Vehicle...................................................................................................... 17Performing Tests ........................................................................................................................ 17
Changing Views ................................................................................................................... 18Pausing Data ....................................................................................................................... 20Reviewing Data.................................................................................................................... 21Using Zoom.......................................................................................................................... 22Using Cursors ...................................................................................................................... 23Taking Snapshots ................................................................................................................ 24Resetting Gauges ................................................................................................................ 25Saving Data ......................................................................................................................... 26Printing................................................................................................................................. 27Using Setup ......................................................................................................................... 27Calibration LED.................................................................................................................... 30Adjusting Channel Settings.................................................................................................. 31Setting the Sweep Time....................................................................................................... 35Setting the Trigger ............................................................................................................... 35
Index .......................................................................................................................................... 39
v

Chapter 1 Using This Manual
This manual contains tool usage instructions.
Some of the illustrations shown in this manual may contain modules and optional equipment that are not included on your system. Contact a sales representative for availability of other modules and optional equipment.
The following conventions are used.
1.1 Conventions
1.1.1 Bold TextBold emphasis is used in procedures to highlight selectable items such as buttons and menu options.
Example:
• Press the Y/a button.
1.1.2 SymbolsThe following types of arrows are used.
The “greater than” arrow (>) indicates an abbreviated set of selection instructions.
Example:
• Select Utilities > Tool Setup > Date.
The above statement abbreviates the following procedure:
1. Navigate to the Utilities button.2. Use the Thumb Pad to navigate to and highlight the Tool Setup submenu.3. Use the Thumb Pad to navigate to and highlight the Date option from the submenu.4. Press Y/a to confirm the selection.
The solid arrows (e, c, d, b) are navigational instructions referring to the four directions of the Thumb Pad.
Example:
• Press the down d arrow.
1

Using This Manual Conventions
1.1.3 TerminologyThe term “select” means highlighting a button or menu item using the Thumb Pad and pressing the Y/a button to confirm the selection.
Example:
• Select Reset.
The above statement abbreviates the following procedure:
1. Navigate to and highlight the Reset button.2. Press the Y/a button.
1.1.4 Note and Important MessagesThe following messages are used.
NoteA NOTE provides helpful information such as additional explanations, tips, and comments.
Example:
NOTE:i For additional information refer to...
ImportantIMPORTANT indicates a situation which, if not avoided, may result in damage to the test equipment or vehicle.
Example:
IMPORTANT:Do not force the CompactFlash® card into the slot.
1.1.5 ProceduresAn arrow icon indicates a procedure.
Example:
z To change screen views:1. Select View.
The drop-down menu displays.2. Select an option from the menu.
The screen layout changes to the format you selected.
2

Using This Manual Additional Manuals
1.2 Additional ManualsTools that work in conjunction with various hardware and software modules have separate manuals available for each of the modules.
1.3 Tool HelpYour unit has Tool Help containing reference and procedural information found in this and other tool related user’s manuals. From the main menu, access Tool Help on the Utilities menu.
3

Chapter 2 Introduction
The MODIS™ Component Tests module combines the strength of your MODIS™ Lab Scope and Graphing Multimeter with a powerful diagnostic database. This software provides component tests and automatically configures the tool for a selected test.
Figure 2-1 MODIS™ display device with Lab Scope Plug-in
The Component Tests module operates from the Lab Scope Plug-in, which uses standard safety banana jacks and is compatible with commonly available accessories.
The following chapters of this manual will cover navigation through the software module, software operation, accessories, and replacement part.
4

Chapter 3 Navigation
This section provides MODIS™ Component Tests navigation information.
For information about navigating the MODIS™ unit, refer to the MODIS™ Display User Manual.
3.1 Screen LayoutThe Component Tests button on the main menu opens a Component Testing menu. Selecting from the menu opens a submenu (Figure 3-1).
Figure 3-1 Sample screen selection
3.1.1 Tests ScreenThe Tests screen (Figure 3-2) consists of the following sections:
• Upper toolbar• Main body• Lower toolbar• Status Bar
The main body of the Tests screen consists of three sections:
• Test Procedure window (upper-left) contains connection and testing procedures.• Support window (upper-right) contains support information, such as waveforms and
connector illustrations.• Test Meter window (bottom) functions either as a Graphing Meter, Digital Meter, or Lab Scope
depending on the test you choose. This window cannot be selected.
5

Navigation Screen Layout
Figure 3-2 Sample test screen
1— Test Procedure window2— Support window3— Test Meter window
3.1.2 ToolbarsUpper and lower toolbars contain test controls that vary depending on the stage of operations.
z To navigate toolbars:1. Press the left e and right c arrows to move between buttons.2. Press the up b and down d arrows or press the N/X button to move between the upper and
lower toolbars.When Easy Scroll is active, press the N/X button to move to the upper toolbar.
Upper ToolbarThe upper toolbar (Figure 3-3 and Figure 3-4) controls vary depending on your mode and stage of operation (Table 3-1).
Figure 3-3 Sample “live-screen” upper toolbar
Figure 3-4 Sample “frozen-screen” upper toolbar
6
Navigation Screen Layout
Data BufferThe Data Buffer (Figure 3-5) is located just below the upper toolbar buttons and indicates how much test data is stored.
Figure 3-5 Sample Data Buffer
1— Pause button2— Data Buffer
When the screen is frozen, the position indicator displays the current frame number (Figure 3-6).
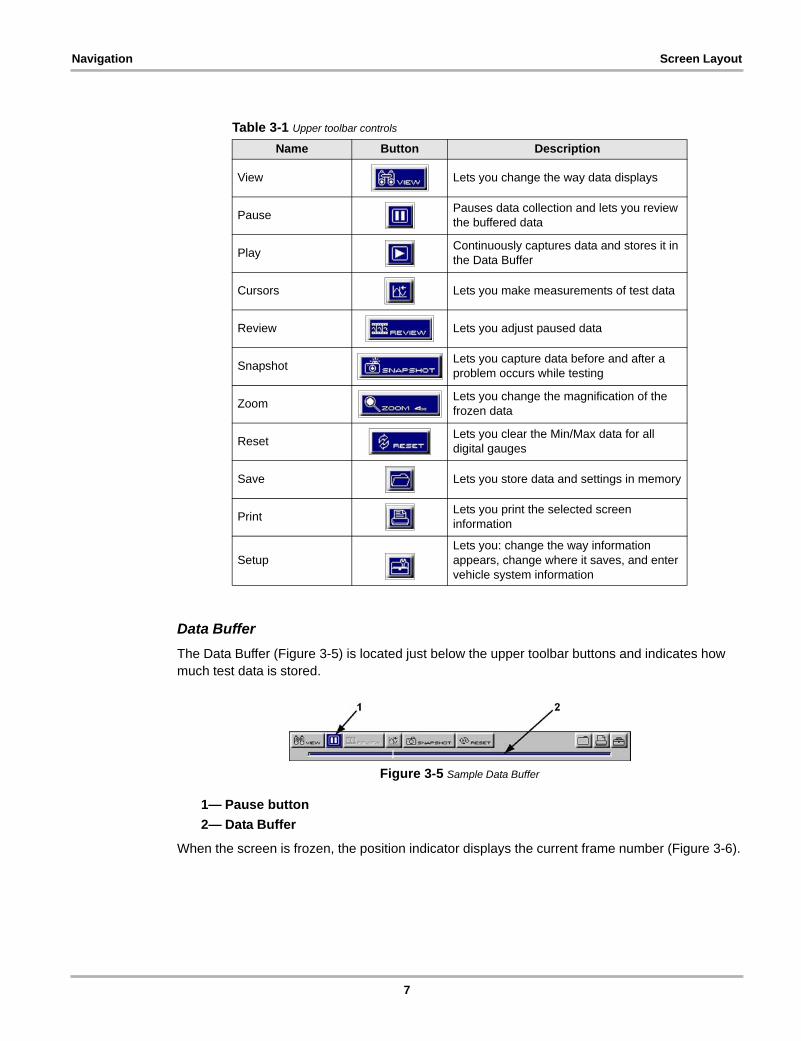
Table 3-1 Upper toolbar controls
Name Button Description
View Lets you change the way data displays
Pause Pauses data collection and lets you review the buffered data
Play Continuously captures data and stores it in the Data Buffer
Cursors Lets you make measurements of test data
Review Lets you adjust paused data
Snapshot Lets you capture data before and after a problem occurs while testing
Zoom Lets you change the magnification of the frozen data
Reset Lets you clear the Min/Max data for all digital gauges
Save Lets you store data and settings in memory
Print Lets you print the selected screen information
SetupLets you: change the way information appears, change where it saves, and enter vehicle system information
7

Navigation Screen Layout
Figure 3-6 Sample Scroll Control with Position Indicator
1— Play button2— Position Indicator
The Data Buffer cannot be highlighted or selected.
z To manually scroll through stored frames:1. When the screen is frozen, select REVIEW.2. Press the left e and right c arrows.
Lower ToolbarThe lower toolbar (Figure 3-7 and Table 3-2) controls vary depending on the active mode and stage of operation.
Figure 3-7 Sample lower toolbar
Table 3-2 Lower toolbar controls (sheet 1 of 2)
Name Button Description
Channel number Lets you select the channel to adjust
Probe Displays the current test connection for the channel
Scale Displays the current units of measurement for the channel
calibrate Indicates channel calibration
Signal Zero Offset Moves the selected channel zero (0) position up or down within the test area
Threshold Changes the reference point on the waveform when calculating measurements
Sweep Sets the amount of time displayed across the screen
Trigger TypeSets the criteria used to start the display of data–there are three types of Trigger settings: None, Channel, and Cyl
8

Navigation Making Selections
3.1.3 Main BodyThe main body of the screen generally contains the test meter and/or test information. Content will vary depending on the module you are using.
• Component Tests• Component Information• Multimeter and Scope
3.1.4 Status BarThe status bar is located at the bottom of the screen. This non-selectable display area contains the test vehicle identification, battery/power status, date and time.
3.2 Making SelectionsUse the following instructions to navigate the interface and make selections.
For related information, see “Toolbars” on page 6.
z To make selections:1. Highlight a button, menu option or window.2. Press Y/a to select.
z To navigate the main body of a screen:• Press the Thumb Pad arrows.
z To exit a selection• Press N/X.
3.3 Navigating Multi-Window ScreensThe main body of the screens for both Component Tests and Component Information are divided into multiple windows.
Slope Lets you change the Trigger edge for the specified channel from rising to falling
Trigger PositionMoves the trigger point for the specified channel–it can be moved up, down, left, or right
Table 3-2 Lower toolbar controls (sheet 2 of 2)
Name Button Description
9

Navigation Navigating Multi-Window Screens
Figure 3-8 Sample Component Tests Screen
1— Test Procedure window2— Support window3— Test Meter window
z To select a window:1. Use the down d arrow to move from the upper toolbar.2. Select a main body window.
When selected, the background and title text of the window change colors (Figure 3-9)
Figure 3-9 Sample selected test window
z To deselect a window:• Press N/X.
When deselected, the background and title text of the deselected window change colors.
z To view additional information:• Press the up b or down d arrow in the selected window (Figure 3-10) to display more
information.
10

Navigation Navigating Multi-Window Screens
Figure 3-10 Thumb Pad instruction indicating more information
NOTE:i When the arrow button displays in some windows, selecting it expands the window vertically
(Figure 3-11).
Figure 3-11 Sample Support window expanded
z To exit a screen:• Press N/X from any window until you return to the main menu.
11

Chapter 4 Operations
This section describes features that are accessible from the Component Tests button.
Figure 4-1 Sample main menu
The Component Testing menu (Figure 4-1) provides the following options:
• Previous Vehicles• Component Tests• New Vehicle ID
4.1 Component TestsThe following is an outline of basic component testing operations.
1. Identify the vehicle—Identify the test vehicle or select from a list of previously-identified vehicles. See “Identifying the Test Vehicle” on page 13.
2. Select a component test—Select a vehicle-specific component for testing. See “Selecting a Component Test” on page 15.
3. Connect to the vehicle—Follow the on-screen instructions to connect the MODIS™ unit to the vehicle See “Connecting to a Test Vehicle” on page 17.
4. Perform the test—Follow the on-screen instructions to set up, test, and evaluate test results. See “Performing Tests” on page 17.
12

Operations Identifying the Test Vehicle
Figure 4-2 Basic operations
4.2 Identifying the Test VehicleComponent tests vary according to vehicle and system. Before you can a list of available component tests, you must identify a specific vehicle system.
Two options are available for identifying a vehicle:
• New Vehicle ID• Previous Vehicles
4.2.1 New Vehicle IDThe New Vehicle ID option requires that you make selections from a series of menus to identify the vehicle to be tested.
z To identify a new test vehicle:1. From the main menu, select Component Tests > Component Testing > New Vehicle ID
(Figure 4-2).
Figure 4-3 Sample New Vehicle ID selected
The Region menu displays (Figure 4-3).
Identify the Vehicle
Select a Component
Connect to the Vehicle
Perform the Test
13

Operations Identifying the Test Vehicle
Figure 4-4 Sample Region menu
2. Select the region.3. Select a manufacturer.
The System Type menu displays (Figure 4-5).
Figure 4-5 Sample System menu
4. Select a system.5. Continue to select from the menus to complete the vehicle identification.
If you need to change a selection, press the left e arrow to go back one step at a time.
NOTE:i As you make selections, vehicle identification data displays in the Status bar (Figure 4-6) at the
bottom of the screen.
Figure 4-6 Sample Vehicle Identification data
When you have finished identifying the vehicle, a confirmation message displays (Figure 4-7).
Figure 4-7 Sample Vehicle ID confirmation message
6. Follow the on-screen instruction.
z To exit New Vehicle ID:• Press Y/a anytime during the ID process to return to the main menu.
4.2.2 Previous VehiclesWhen testing a vehicle that has already been identified, the Previous Vehicles menu option provides access to the Load Vehicle Identification screen.The MODIS™ unit automatically saves the last ten vehicle identifications and lists them on this screen.
14

Operations Selecting a Component Test
z To load a previously-identified vehicle:1. Select Component Tests > Component Testing> Previous Vehicles.
The Load Vehicle Identification screen displays (Figure 4-8).
Figure 4-8 Sample Load Vehicle Identification screen
2. Select an ID from the list.
z To exit the Load Vehicle Identification screen:• Press N/X to return to the main menu and keep the current vehicle identification setting.
4.3 Selecting a Component TestOnce a test vehicle is identified, you can select from the Component Tests menu.
The main body (Figure 4-11) of the test screen can contain the following sections:
• Test Procedure window—contains connection and testing procedures.• Support window—contains support information, such as connector illustrations.• Test Meter window—functions as a Graphing Meter, Digital Meter, or Lab Scope, depending
on the selected test.
z To select a component test:1. Select Component Tests > Component Testing> Component Tests.
The Component Tests menu displays the available components for the identified test vehicle (Figure 4-9).
15

Operations Selecting a Component Test
Figure 4-9 Sample Component Tests menu
2. Select a component.A Tests menu displays (Figure 4-10).
Figure 4-10 Sample TESTS menu
3. Select a test.The Test screen displays (Figure 4-11).
Figure 4-11 Sample Component Test screen
16

Operations Connecting to a Test Vehicle
z To exit Component Tests:• Press N/X anytime during the Components Test selection process to return to the main menu.
4.4 Connecting to a Test VehicleCertain component tests require the use of specific leads that connect your MODIS™ unit to a component on the test vehicle.
NOTE:i For additional leads and connection information refer to your Lab Scope Plug-in User Manual.
The initial test screen displays connection information.
z To connect to a test vehicle:• Follow the on-screen connection instructions (Figure 4-12).
Figure 4-12 Sample connection instructions
4.5 Performing TestsAfter connecting the MODIS™ unit to the test vehicle, proceed with component tests.
z To perform component tests:1. Select the Test Procedure window.2. Use the Thumb Pad to scroll through the setup instructions.
Instructions display in the Text Procedure window, accompanied by illustrations in the Support window (Figure 4-13).
Figure 4-13 Sample setup instructions
3. Press the down d arrow to advance to the next panel of instruction as needed.
17

Operations Performing Tests
4. Follow the on-screen procedures as needed.5. View and verify the test results as explained on-screen (Figure 4-14).
Figure 4-14 Sample test results
4.5.1 Changing ViewsThe VIEW button lets you change the way data displays. Available menu options depend on the selected test.
z To change screen views:1. Select VIEW.
A dropdown menu displays (Figure 4-15).
Figure 4-15 Sample VIEW menu
Menu selections vary by test and include either:– RPM, Digital, and Full Screen,
or– Full Digital, Full Graph, Split Screen, and Full Screen.
2. Select an option from the drop-down menu.The screen changes to reflect your selection (Figure 4-18 through Figure 4-21).
18

Operations Performing Tests
Figure 4-16 Sample RPM view
Figure 4-17 Sample Digital view
Figure 4-18 Sample Full Digital view
19

Operations Performing Tests
Figure 4-19 Sample Full Graph view
Figure 4-20 Sample Split Screen view
Figure 4-21 Sample Full Screen view
4.5.2 Pausing DataThe Pause button (Figure 4-22) stops data collection and lets you review data. The screen can be paused at any time.
20

Operations Performing Tests
Figure 4-22 Freeze button
z To pause test screen data:• Press the Pause button (Figure 4-22).
The data is paused on-screen for review, and the following three upper toolbar controls also change (Figure 4-23):– The Play button replaces the Pause button.– The REVIEW button is active.– The ZOOM button replaces the SNAPSHOT button.– The Position Indicator displays in the Data Buffer.
Figure 4-23 Sample “frozen” upper toolbar
1— Play button2— REVIEW button3— ZOOM button4— Position Indicator
z To release paused data:• Press the Play button.
Live data displays and the toolbar controls revert to their original state.
4.5.3 Reviewing DataThe REVIEW button is used with the Thumb Pad to review paused data.
The Position Indicator (Figure 4-23) displays the position of the current frame.
• Zero denotes the frame when the data was paused.• Frames captured before pausing are negative (–); frames captured after are positive (+).
There are two ways to review frozen data:
• Manually• Automatically
z To manually review data:1. Select the Pause button.2. Select the REVIEW button.3. Use the right c and left e arrows to review data one frame at a time.4. Use the up b and down d arrows to review data a fraction of a frame at a time when possible.
21

Operations Performing Tests
NOTE:i You can not review fractions of frames in the Ignition Scope.
z To automatically scroll paused data:1. With the REVIEW button selected, press Y/a again to display the menu of scroll options.
(Figure 4-24)
Figure 4-24 Sample scroll options
2. From the REVIEW menu, select an Auto option.– Auto Scroll Fast automatically scrolls the paused data at full-speed.– Auto Scroll Slow automatically scrolls the paused data at half-speed.
3. Press N/X to close the menu.
The Position Indicator (Figure 4-23) displays the position of the current frame. Zero (0) represents the frame when data collection was paused. Frames captured before pausing are negative (-); frames captured after pausing are positive (+).
4.5.4 Using ZoomThe ZOOM button (Figure 4-25) lets you change the magnification of frozen data and appears in place of the SNAPSHOT button when data collection is paused.
Figure 4-25 Sample zoom drop-down menu
z To zoom frozen test screens:1. Select ZOOM.
A dropdown menu displays (Figure 4-25).2. Select an option from the menu.
The screen changes to reflect your selection and the on-screen Zoom Cursor Line displays (Figure 4-26).
22

Operations Performing Tests
Figure 4-26 Zoom cursor line
3. To see a point of interest in detail:a. Select REVIEW.b. Use the left e and right c arrows move the Zoom Cursor Line to the point of interest.c. Select ZOOM > 1x.
4.5.5 Using CursorsThe Cursors button (Figure 4-27) lets you make digital amplitude, frequency, and time measurements of frozen waveforms. On live data, cursors can be used as reference points and to make frequency and time measurements.
Figure 4-27 CURSORS button
z To use the cursors:1. Select Cursors.
Two vertical cursor lines display on-screen (Figure 4-28).
Figure 4-28 Sample cursors
2. Press the right c and left e arrows to move the selected cursor line.3. Press Y/a to change the active cursor.
23
Operations Performing Tests
4. Press N/X when you are finished setting cursors.A confirmation message displays asking how you want to proceed using cursors.
5. Press Y/a or N/X as desired.
NOTE:i Digital amplitude measurements only display when the screen is in pause mode.
z To turn cursors off:1. Select Cursors.2. Press N/X twice.
The cursor lines disappear.
4.5.6 Taking SnapshotsThe SNAPSHOT button lets you capture data before and after a problem occurs while driving.
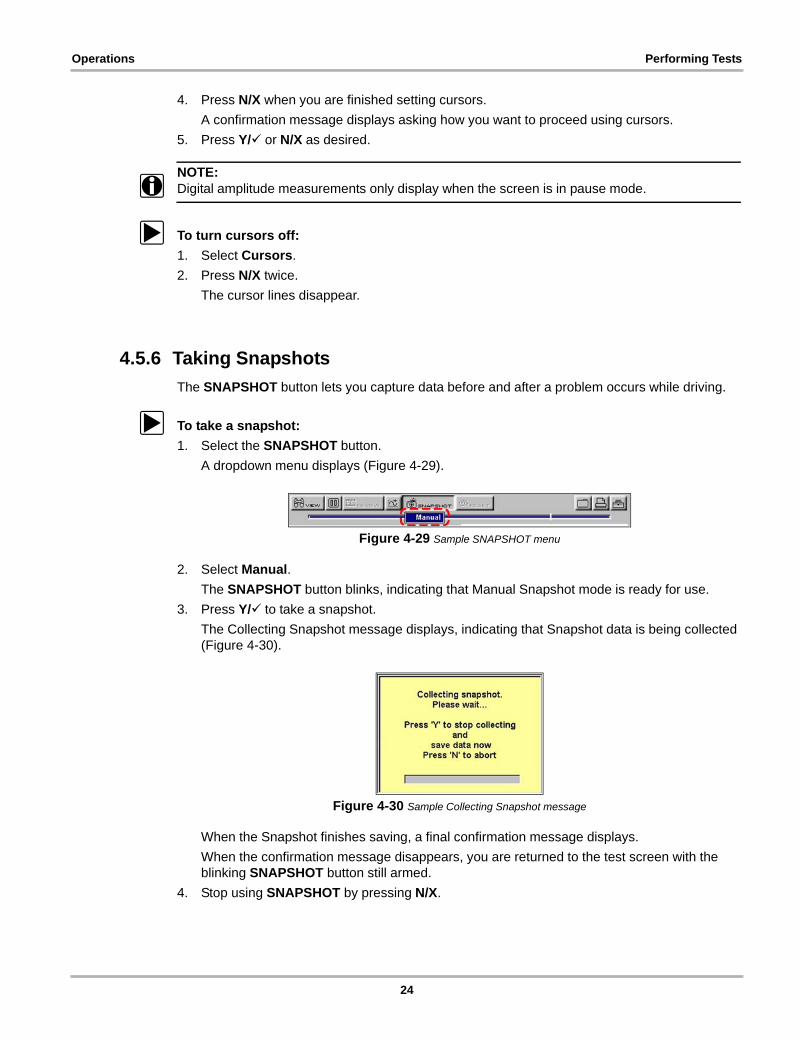
z To take a snapshot:1. Select the SNAPSHOT button.
A dropdown menu displays (Figure 4-29).
Figure 4-29 Sample SNAPSHOT menu
2. Select Manual.The SNAPSHOT button blinks, indicating that Manual Snapshot mode is ready for use.
3. Press Y/a to take a snapshot.The Collecting Snapshot message displays, indicating that Snapshot data is being collected (Figure 4-30).
Figure 4-30 Sample Collecting Snapshot message
When the Snapshot finishes saving, a final confirmation message displays.When the confirmation message disappears, you are returned to the test screen with the blinking SNAPSHOT button still armed.
4. Stop using SNAPSHOT by pressing N/X.
24

Operations Performing Tests
NOTE:i The saved snapshot can be retrieved from Saved Data. Refer to the MODIS™ Display User
Manual for Saved Data operating details.
Changing Snapshot SettingsYou can set up a snapshot in the following ways:
• Adjust the size—snapshots can store a lot of frames and use a lot of memory, or store fewer frames and use less memory.
• Adjust the percentage after trigger—snapshots can be between 10% and 90% data captured after triggering.
• Save to different locations—snapshots can be saved to the MODIS™ internal memory or to the CF card in the top slot.
z To change snapshot settings:1. From the main menu, select Utilities > Tool Setup > Save Data.
The Save Data dialog box displays (Figure 4-31).
Figure 4-31 Sample Save Data dialog box
2. Select the % After Trigger drop-down menu.The lower the percentage selected, the smaller the file size.
3. Open the My Data drop-down menu and select a location to save the file to.4. Open the File Type drop-down menu and select the format for saving image files.5. Press N/X to close the dialog box.
4.5.7 Resetting GaugesThe RESET button (Figure 4-32) returns the recorded digital gauge minimum and maximum values to zero.
Figure 4-32 Sample RESET button
Use the RESET button to do the following:
• Track the variation in a component or circuit under a certain condition. If the condition changes, RESET lets you start tracking again to see the change.
• Verify a connection problem is fixed by looking for a dropout or spike in the min/max values.
25

Operations Performing Tests
z To reset the min/max digital values:• Select RESET.
A confirmation message displays (Figure 4-33).
Figure 4-33 Sample Reset confirmation message
When the reset is complete, the confirmation message disappears.
4.5.8 Saving DataThe Save button lets you store data in memory.
z To save data:1. Select the Save button to open a dropdown menu (Figure 4-34).
Figure 4-34 Sample TESTS screen SAVE menu
2. Select an option:– Save Movie—saves all data in the buffer.– Save Frame—saves only the visible screen data.– Save Preset—saves only Scope tool screen configurations used for future testing.– Save Image—saves the visible screen as a graphic image.
The Setup Saved Data Notation dialog box displays (Figure 4-35).
Figure 4-35 Sample Setup Saved Data Notation dialog box
3. Select from the menus to set preferences as necessary.The Setup Saved Data Notation dialog box works the same as the Edit Saved Data Notation dialog box found in the Saved Data mode. Refer to the MODIS™ Display User Manual for operating details.
26

Operations Performing Tests
NOTE:i If you plan to save many screens from the same vehicle, select Yes for Keep Entries. This
preference retains your settings the next time you select Save.
4. When you are finished setting preferences, select the Save icon.A confirmation message displays with saved data retrieval instructions (Figure 4-36).
Figure 4-36 Sample Data saved confirmation message
5. Press Y/a to close the confirmation message.
4.5.9 PrintingThe Print button lets you print the displayed screen. Print menu options vary depending on your selected component and mode. You can print the full screen or individual sections in full screen format (Figure 4-37).
Figure 4-37 Sample test screen print menu
NOTE:i Selecting Inverse Colors from the Setup button menu before selecting a print option reduces the
amount of ink used by your printer.
z To print:1. Select the Print button (Figure 4-37).
A drop-down menu displays.2. Select a print option and press Y/a.
The screen prints according to your printer settings. Refer to the MODIS™ Display User Manual for printer setup details.
NOTE:i If you print using the infrared output on the top of the MODIS™ unit, make sure it is pointed at the
infrared input of the printer and that there is nothing in between them.
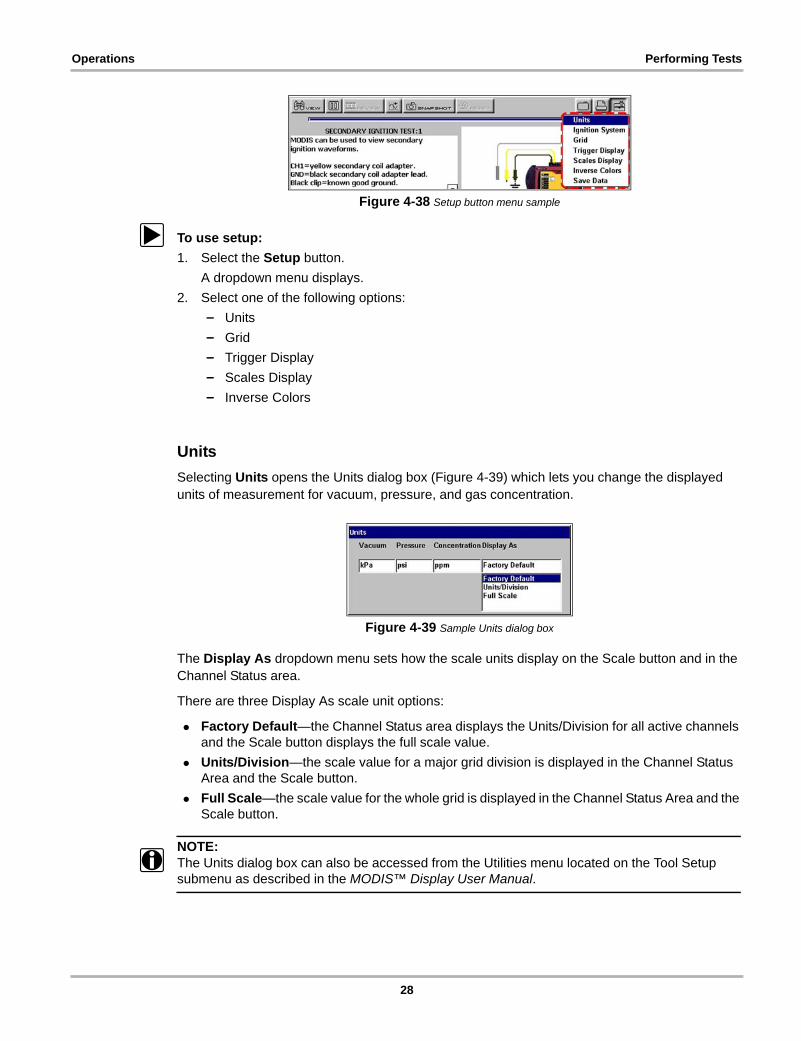
4.5.10 Using SetupThe Setup button (Figure 4-38) lets you change the way information displays.
27
Operations Performing Tests
Figure 4-38 Setup button menu sample
z To use setup:1. Select the Setup button.
A dropdown menu displays.2. Select one of the following options:
– Units– Grid– Trigger Display– Scales Display– Inverse Colors
UnitsSelecting Units opens the Units dialog box (Figure 4-39) which lets you change the displayed units of measurement for vacuum, pressure, and gas concentration.
Figure 4-39 Sample Units dialog box
The Display As dropdown menu sets how the scale units display on the Scale button and in the Channel Status area.
There are three Display As scale unit options:
• Factory Default—the Channel Status area displays the Units/Division for all active channels and the Scale button displays the full scale value.
• Units/Division—the scale value for a major grid division is displayed in the Channel Status Area and the Scale button.
• Full Scale—the scale value for the whole grid is displayed in the Channel Status Area and the Scale button.
NOTE:i The Units dialog box can also be accessed from the Utilities menu located on the Tool Setup
submenu as described in the MODIS™ Display User Manual.
28

Operations Performing Tests
z To change units:1. Select Setup > Units.
The Units dialog box displays.2. Change the unit values as needed.3. Press N/X to close the dialog box.
GridSelect Grid to displays the background grid pattern on all graphing test screens.
z To turn the grid on:• Select Setup > Grid.
A grid appears in the background of the test area (Figure 4-40).
Figure 4-40 Sample grid
Trigger DisplaySelect Trigger Display to turn on the Trigger position values located in the bottom right corner of the test area (Figure 4-41).
NOTE:i The Trigger Display option is not available in all tests.
Figure 4-41 Sample Trigger Display
When Trigger Display is not selected, trigger position values only display when the trigger position button is selected on the lower toolbar.
z To display trigger values:• Select Setup > Trigger Display.
29

Operations Performing Tests
The Trigger values display in the bottom right corner of the test area (Figure 4-41).
Scales DisplaySelect Scales Display to display the scale values on the graph.
z To turn Scales Display on:• Select Setup > Scales Display (Figure 4-42).
The scale values appear along the X (horizontal) and Y (vertical) axis of the graph (Figure 4-42).
Figure 4-42 Scales Display menu selection sample
Inverse ColorsSelecting Inverse Colors changes the color scheme. This feature is useful for reducing the amount of ink used when printing.
z To change the color scheme:• Select Setup > Inverse Colors.
The color scheme changes (Figure 4-43).
Figure 4-43 Inverse Colors menu selection sample
4.5.11 Calibration LEDWhen you select a Diode, Continuity, Ohms or Pressure transducers test, a message displays with calibration instructions (Figure 4-44).
30

Operations Performing Tests
Figure 4-44 Sample calibration procedure message
When the test screen displays, the LED (Figure 4-45) on the toolbar indicates the channel calibration status:
• Green—calibrated• Red—not calibrated (using previous calibration values)
Figure 4-45 Sample calibration LED
4.5.12 Adjusting Channel SettingsThe Channel control bar (Figure 4-46) lets you adjust channel settings and viewing characteristics for the selected trace.
Figure 4-46 Sample Channel control bar
1— Channel Number2— Probe3— Scale4— Signal Zero Offset5— Threshold
Channel NumberThe Channel Number button lets you select channel options.
• Channel One (1) is automatically displayed and cannot be turned off.• Channel Two through Four (2-4) can be manually selected for display.
The following channel options are available:
• Displayed makes a channel’s signal visible.• Inverted flips the selected waveform upside-down. This is typically used when testing
secondary ignition or displaying waveforms from the Low Amps Probe.
31

Operations Performing Tests
• Coupling AC subtracts the average value of a waveform to see small variations, which is ideal for viewing alternator ripple or fuel pump amps. This blocks the DC portions of an input signal in order to amplify the AC portions without driving them off the center of the screen.
• Peak Detect captures fast events, spikes and glitches for signals going in both positive and negative directions.
• Filter minimizes unwanted noise in the Graphing Meter.• Auto Find picks the best scale to fit the selected signal pattern on the screen. If run on the
same channel as the trigger, the trigger level is set halfway between the minimum and maximum values of the waveform.
Figure 4-47 Sample Channel Number menus
NOTE:i When testing with the Single Cylinder Ignition scope, the Channel 1 Peak Detect option cannot be
turned off.
z To display a different Channel:1. Select the Channel Number button from the Channel control bar.
The channel setup menu displays.2. Select Ch 2 (or Ch3, or Ch4) > Displayed.
The Channel Two (Channel Three, or Channel Four) trace displays on-screen and a check mark displays next to the Displayed option in the Channel attribute menu. The check mark indicates that channel is on.
3. Select additional channels and a corresponding Displayed attribute, when available.4. Press N/X to close the menu.
z To change channel setup:1. Press the Channel Number.
The channel setup menu displays.2. Select the channel you want to change (Ch 1–Ch 4).3. Select the Peak Detect or Filter channel setup option.
ProbeThe Probe button lets you select a different test (Figure 4-48).
32

Operations Performing Tests
Figure 4-48 Sample Probe menu
z To select a different test:1. Select the Probe button.
The Probe menu displays.2. Select an option.
The Probe button changes to indicate your selection.
ScaleThe Scale button displays the current units of measurement for the channel. Scales can be adjusted for each channel.
z To select a measurement scale:1. Select the Scale button.
The Scale menu displays (Figure 4-49).
Figure 4-49 Scale menu sample
2. Select an option.The Scale button and the waveforms on-screen change to reflect your selection.
Signal Zero OffsetThe Signal Zero Offset button moves the selected channel’s zero (0) position up or down within the test display area.
z To move a channel’s zero position:1. Select the Signal Zero Offset.
The button changes appearance to indicate that the function is selected (Figure 4-50).
33

Operations Performing Tests
Figure 4-50 Sample Signal Zero Offset selection
2. Press the up b or down d arrows as needed to move the zero point.If you have the Scales Display setting on, you see the scale move along the left side of the screen along with your selected channel waveform; otherwise, you only see your selected channel waveform move on-screen.
3. Press N/X to exit the Signal Zero Offset function.
ThresholdThe Threshold button changes the reference point on the waveform and is only used for calculating measurements like Frequency, Duty Cycle, MC Dwell and Pulse Width.
There are two threshold options:
• Auto Threshold Select (ATS)—automatically picks a threshold level in the middle of the range in which the waveform travels. ATS defaults to a falling edge.
• Manual Threshold Select (MTS)—lets you manually pick a signal level and direction (rising or falling) to be used as a reference point. This is typically used if ATS picks a level that does not give the desired result.
z To change the threshold level:1. Select Threshold.
The Threshold menu displays (Figure 4-51).
Figure 4-51 Threshold menu sample
2. Select an option.
z To use the Manual Threshold option:1. Select Threshold > Manual Threshold Select.
The Manual Threshold Select dialog box displays (Figure 4-52).
Figure 4-52 Sample Manual Threshold Select dialog box
The Signal Min and Max display to the left and right of the Threshold value for reference. Measuring the Min and Max may take a few seconds.
34
Operations Performing Tests
2. Change the Threshold value and the Slope, as needed.
NOTE:i Threshold can only be changed to a value that is between the Min and Max of the signal.
3. Press N/X to exit the dialog box.
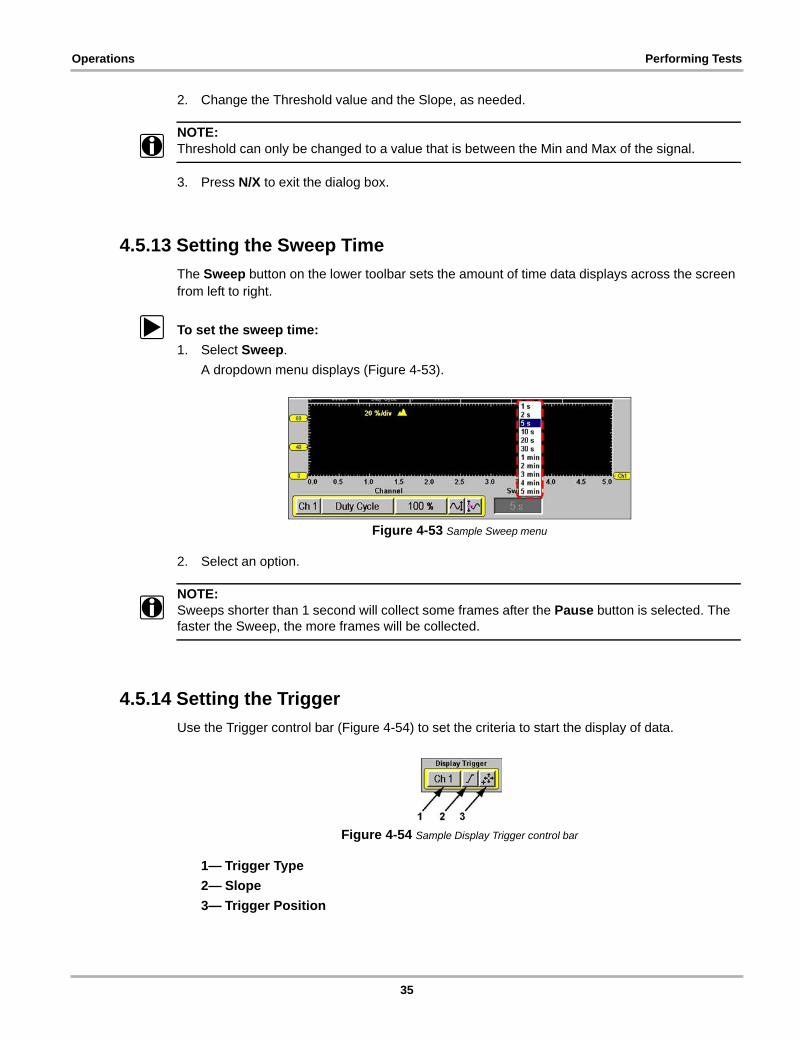
4.5.13 Setting the Sweep TimeThe Sweep button on the lower toolbar sets the amount of time data displays across the screen from left to right.
z To set the sweep time:1. Select Sweep.
A dropdown menu displays (Figure 4-53).
Figure 4-53 Sample Sweep menu
2. Select an option.
NOTE:i Sweeps shorter than 1 second will collect some frames after the Pause button is selected. The
faster the Sweep, the more frames will be collected.
4.5.14 Setting the TriggerUse the Trigger control bar (Figure 4-54) to set the criteria to start the display of data.
Figure 4-54 Sample Display Trigger control bar
1— Trigger Type2— Slope3— Trigger Position
35

Operations Performing Tests
Trigger TypeSelect Trigger Type to set the criteria used to start the display of data. Available Trigger Type menu options include the following:
• None displays data as it is collected.• Ch 1-4 triggers the display based on the signal from the selected channel. Available submenu
options include:• Ch 1-4 triggers the display based on the signal from the selected channel. Available submenu
options include:– Auto updates the screen when the signal crosses the trigger threshold in the selected
direction (rising or falling). Even if the signal does not cross the trigger threshold, the screen automatically updates after a short period so you can see the waveform, which lets you set a threshold to optimize viewing.
– Normal updates the screen when the signal crosses the trigger threshold in the selected direction (rising or falling). If the signal does not cross the trigger threshold, the screen does not update, which lets you capture intermittent events. The screen only updates when the signal meets your trigger selection.
– Cyl triggers the Lab Scope from the RPM lead signal. You can only adjust the time offset for this trigger type.
z To select a trigger type:1. Select the Trigger Type button.
A dropdown menu displays (Figure 4-55).
Figure 4-55 Sample Trigger Mode menu
2. Select an option.With the exception of None, a submenu displays.
3. Select Auto or Normal from the submenu.– If a Channel trigger (Ch1–4) is selected, a plus-sign (+) colored according to the channel
it represents displays in the graph area (Figure 4-56).
36

Operations Performing Tests
Figure 4-56 Sample channel trigger position marker
– If the Cyl trigger is selected, a white plus-sign (+) displays along the bottom of the graph area which represents the point in time and the level at which a cylinder will be triggered (Figure 4-57).
Figure 4-57 Sample Cyl Trigger Position marker
4. When you are finished setting the trigger modes, press N/X to close the menu.
NOTE:i If you want to save the triggered event displayed on-screen, do not press Pause because that will
show you data in the data buffer and the triggered event you are looking at may no longer be there if the buffer has wrapped.
z To save a triggered event:1. Make sure a Display Trigger is set.2. Wait for a triggered event to display.3. Select Save > Screen.
Trigger SlopeThe Trigger Slope button selects the direction the waveform must be going (rising or falling) when crossing the trigger point.
NOTE:i This button is only available when a Channel is the active trigger type.
37

Operations Performing Tests
Trigger PositionThe Trigger Position (Figure 4-58) button is used for moving the trigger point for a specified channel either along the X (horizontal) or Y (vertical) axis of the display.
z To move the trigger point:1. Select Trigger Position.
The trigger point marker becomes active (Figure 4-58).
Figure 4-58 Sample Trigger Position button
2. Use the Thumb Pad to move the on-screen marker and select a new Trigger point.3. When you are finished, press N/X to release the button
The button reverts to its original state to indicate that the button function is inactive.
38

Index
Bbattery pack
power status 9bold text 1
Cchanging views 18channel control bar 31component tests 12
identify test vehicle 13connecting to a test vehicle 17cursors 23
Ddisplay as 28display trigger 35–37display trigger control bar 35
Ggrid 29
Iidentifying the test vehicle 13INFO
component tests 12inverse colors 30
Mmaking selections 9manual conventions 1–3manuals, additional 3messages 2
important 2note 2
Nnew vehicle ID 13noise filter 32
Ppause 20, 21peak detect 32performing tests 17previous vehicles ID 14print
test screens 27
printing 27probe 32procedures 2
Rreview data 21
SSafety iii–ivsafety
information iiisave 26saving 26scale 33scales display 30selecting component tests 15setup 27
display as 28grid 29inverse colors 30scales display 30trigger display 29units 28
setup optionsgrid 29inverse colors 30scales display 30units 28
signal zero offset 33snapshot 7, 21, 22, 24
setup 25taking 24–25
sweep 35symbols 1
Tterminology 2Test screen 5threshold 34
Auto Threshold Select (ATS) 34Manual Threshold Select (MTS) 34
tool help 3toolbars 6–9trigger display 29
39

Index
Vview options
Digital 18Full Digital 18Full Graph 18RPM 18
Split Screen 18
40