Embed Size (px)
Citation preview

Complex Surveys
Tuesday, April 18, 2023

Assembling Design Components
• Building blocks– Probability sampling
• Simple random sampling (SRS)• Unequal probability sampling
– Stratification• Purpose: to increase the precision of estimates by grouping
similar items together
– Cluster sampling • Purpose: convenience.
– Ratio estimation

Simple Random Sampling(without replacement)
• There are (N choose n) possible samples
• Each with probability 1/(N choose n)
• Point estimate and C.I.
• Sample size (n) calculation
Si
iSi
i yn
NyNty
ny ˆ,
1
n
S
N
nNyVNtV
n
S
N
nyV
222
2
)1()ˆ()ˆ(,)1()ˆ(

Stratification (Ch 3)
• The estimate of the population total• It’s variance• Sample size allocation - proportional,
optimal• In general, stratified sampling with
proportional allocation is more efficient than SRS
• The more unequal the stratum means, the more benefits
H
hhtt
1
ˆˆ
H
hhtVtV
1
)ˆ()ˆ(

Ratio estimation (ch4)
• Biased
• May results in smaller MSE
• Useful when variables are linearly correlated
• Regression estimation
x
y
t
tB
ˆ
ˆˆ )ˆ,ˆ(voc
ˆ2)ˆ(ˆ1
)ˆ(ˆˆ
)ˆ(ˆ222
2
yxx
yx
xx
ttt
BtV
ttV
t
BBV

Cluster Sampling (ch 5&6)
• Usually less efficient than other methods• The relative efficiency of it and SRS depends on
intra-class correlation coefficient– The larger the correlation coefficient, the less efficient
• Can reduce cost and lead to administrative convenience
• One-stage, two-stage, with equal or unequal probs, point estimate, variance, c.i. – Allocation of m and n for two-stage cluster sampling

Cluster Sampling without Replacement
• Select a sample of n clusters with replacement based on
• Estimate cluster total and variance
• Estimate population total
• Variance can be estimated by formulas in ch5,6 or resampling methods
it
i
)ˆ(ˆitV
Si i
iHZ
tt
ˆ
ˆ

Cluster Sampling with Replacement
• Select a sample of n clusters with replacement based on
• Estimate cluster total
• Calculate
• Estimate population total and variance
i
it
iii tu /ˆ
nsun
u u
n
i i /,1 2
1

In practice
• Most of large surveys involves – several ideas of techniques– Different types of estimators

An example: background
• Malaria is a common public health problem in tropical and subtropical regions
• It is infectious. People get it by being bitten by a kind of female mosquito
• Without timely and proper treatment, the death rate can be very high
• Can be prevented by using mosquito nets• The prevention is only affective if the nets
are in widespread use

Summary
• Goal: To estimate the prevalence of bed net use in rural areas
• Sampling frame: all rural villages of <3,000 people in The Gambia

The survey in Gambia (1991) 3000 rural villages
Stage Sampling unit
eastern central western
1 district
Sampling method
•Stratified by region•Prob district size•5 districts per region
PHC Non-PHC
2 village
•Stratified by PHC•Prob village size•4 villages per district
3 compound•SRS•6 compounds / village
Top-down
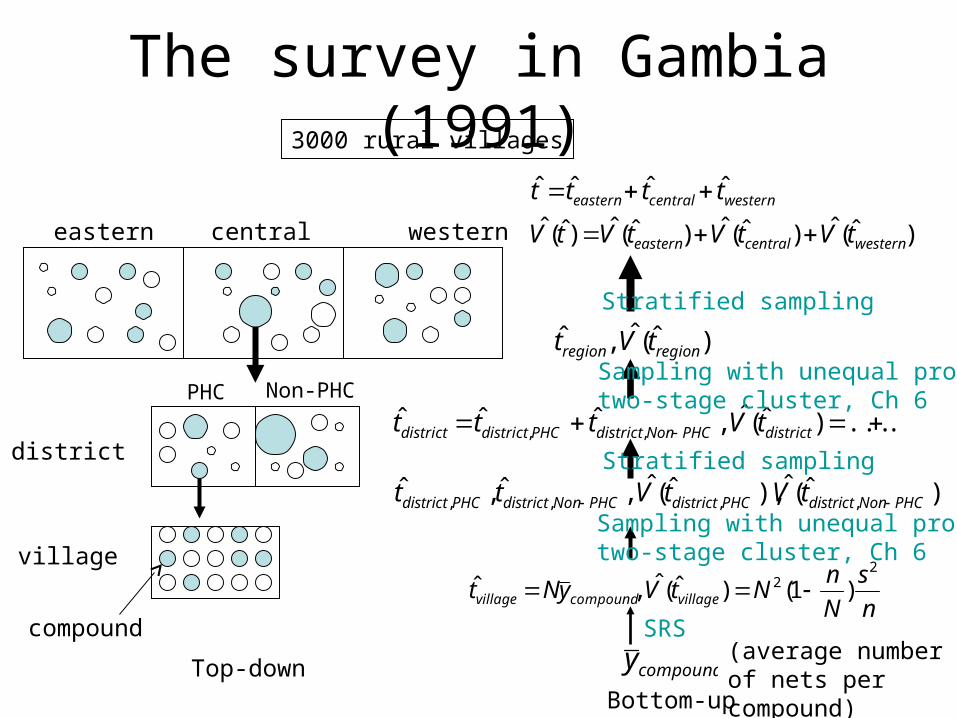
The survey in Gambia (1991)3000 rural villages
eastern central western
PHC Non-PHC
......)ˆ(ˆ,ˆˆˆ,, districtPHCNondistrictPHCdistrictdistrict tVttt
compoundy
)ˆ(ˆ,ˆregionregion tVt
Top-downBottom-up
n
s
N
nNtVyNt villagecompoundvillage
22 )1()ˆ(ˆ,ˆ
)ˆ(ˆ)ˆ(ˆ)ˆ(ˆ)ˆ(ˆ
ˆˆˆˆ
westerncentraleastern
westerncentraleastern
tVtVtVtV
tttt
SRS
Stratified sampling
district
village
compound
)ˆ(ˆ),ˆ(ˆ,ˆ,ˆ,,,, PHCNondistrictPHCdistrictPHCNondistrictPHCdistrict tVtVtt
Stratified sampling
Sampling with unequal probs,two-stage cluster, Ch 6
Sampling with unequal probs,two-stage cluster, Ch 6
(average number of nets per compound)

The survey in Gambia (1991)
• The way to calculate the estimated total and its variance seems to be complicated– It can be worse if we include ratio estimators
• In practice, we can – Use sampling weights to obtain point
estimates– Use computer intensive methods to obtain
standard error (ch9)• Such as jackknife, bootstrap

Sampling weights• The sampling weight is the reciprocal of
Pr(being selected)
• Each sampled unit “represents” certain number of units in the population
• The whole sample “represents” the whole population

Sampling weights• Weights are used to deal with the effects of
stratification and clustering on point estimate
• Stratified sampling
NNwH
hh
H
h
n
jhj
h
11 1

Sampling weights• Cluster sampling with equal probabilities
Si
iSi Sj
ij MNMn
Nw
i
ijiij
ijiij
www |
|

Sampling weights
pstpsp wwww ,|| p: primarys: secondary t: tertiary
• For three-stage sampling
• Very large weights are often truncated– Biases results– Reduces the mean squared error

Sampling weights• Weights contain the information needed to
construct point estimates • Weights do not contain enough information for
computing variance– Weights can be used to find point estimates
because calculating variance requires prob(pairs of units are selected)
– Computer-intensive methods can be used to find variances

Sampling weights: the malaria example
Pr(a compound in central region PHC villages is selected)=

Self-weighting and Non-self-weighting
• Self-weighting: sampling weights for all observation units are equal
• A self-weighing sampling is representative of the population if nonsampling errors are ignored
• Most large self-weighting samples are not SRS• Standard software with the usual assumption of
iid leads to correct estimate of mean, proportion, percentiles; but erroneous estimation for variance

Ratio Estimation in Complex Surveys
• Ratio estimation is part of the analysis, not the design
• Can be used at any level. Usually used near the top

Ratio Estimation in the Malaria example
• Region level:
• Above the region level

Ratio Estimation in Complex Surveys
• The bias of ratio estimation can be large when sample sizes are small
• Separate ratio estimator for a population total
– Improves efficiency when ratios vary from stratum to stratum; works poorly for small strata sample sizes
• Combined ratio estimator for a population total
– Has less bias when strata sizes are small; works poorly when ratios vary from stratum to stratum
XYX ttt ˆ/ˆ
Estimating a Distribution Function
• Historically, sampling theory was developed to find population means, totals, and ratios.
• Other quantities, such ass,– Pr(Statistics > means or totals)– Median? 95th percentile? Probability mass
function?
• Sampling weights can be used in constructing an empirical distribution of the population

Population quantities and functions
• Probability mass function (pmf)
• Distribution functionN
yyf
is value whoseunits ofnumber )(
yx
xfN
yyF )(
value whoseunits ofnumber )(
)()( yYPyf
}{)( yYPyF
1)()( Fyf
)(yyfyU
]))(()([1
))()((1
)(1
1
22
2
1
22
yy
y xi
N
iUi
yyfyfyN
N
xxfyyfN
N
yyN
S

Empirical Functions
• Empirical probability mass function
• Empirical distribution function
• Empirical functions can be used to estimate population quantities such as mean, median, percentiles, variance, ect.
yyi
yySii
i
i
w
w
yf :)(ˆ
yx
xfyF )(ˆ)(ˆ
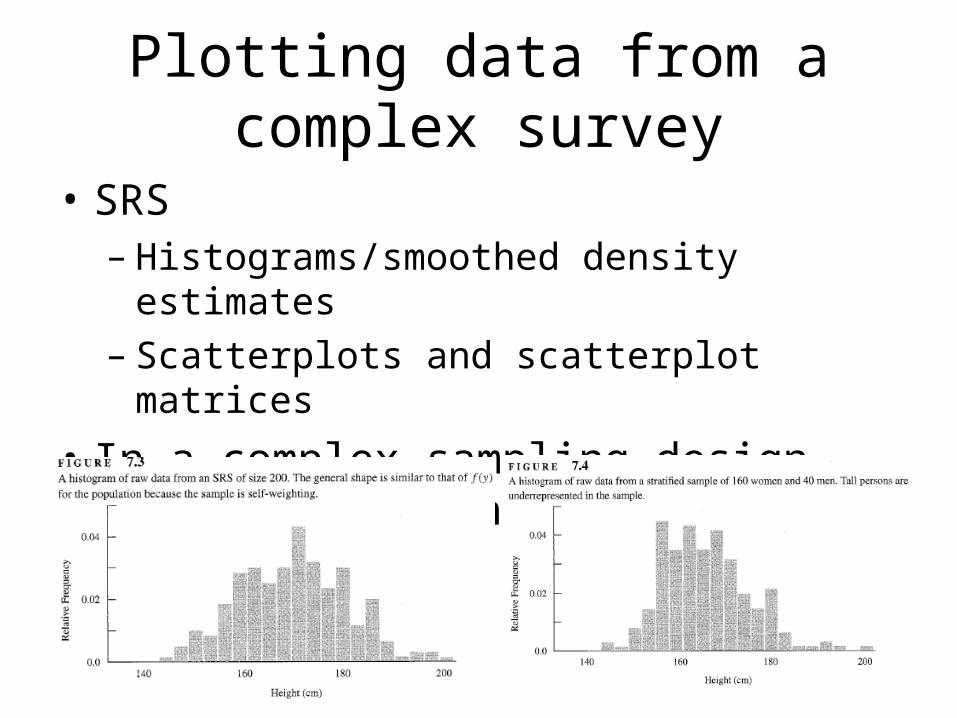
Plotting data from a complex survey
• SRS– Histograms/smoothed density estimates– Scatterplots and scatterplot matrices
• In a complex sampling design, simple plots can be missleading
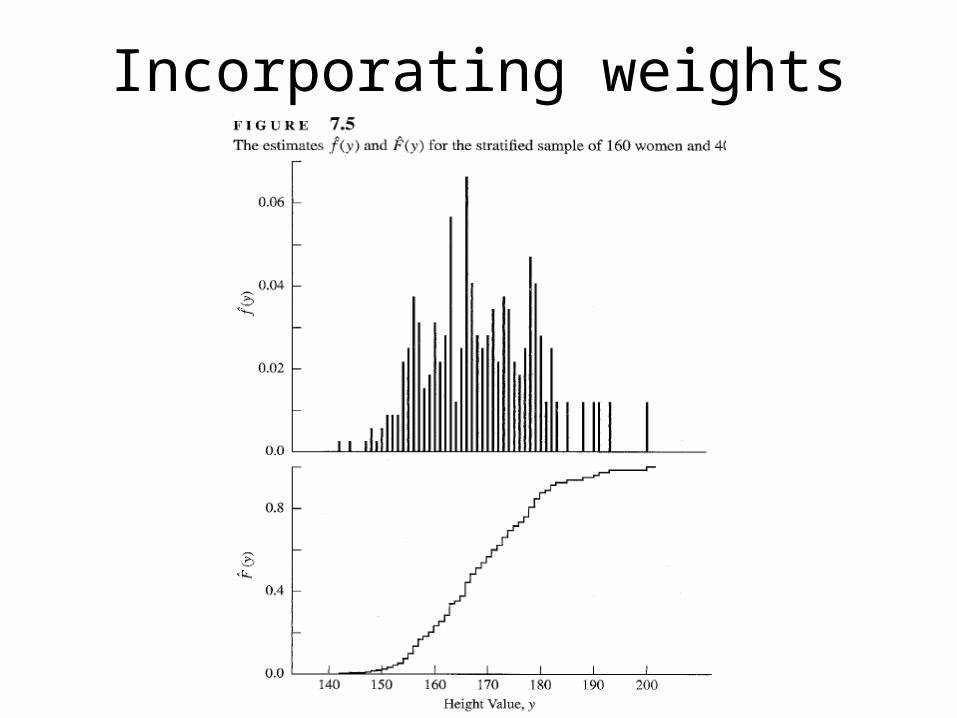
Incorporating weights

Incorporating weights

Plotting data from a complex survey
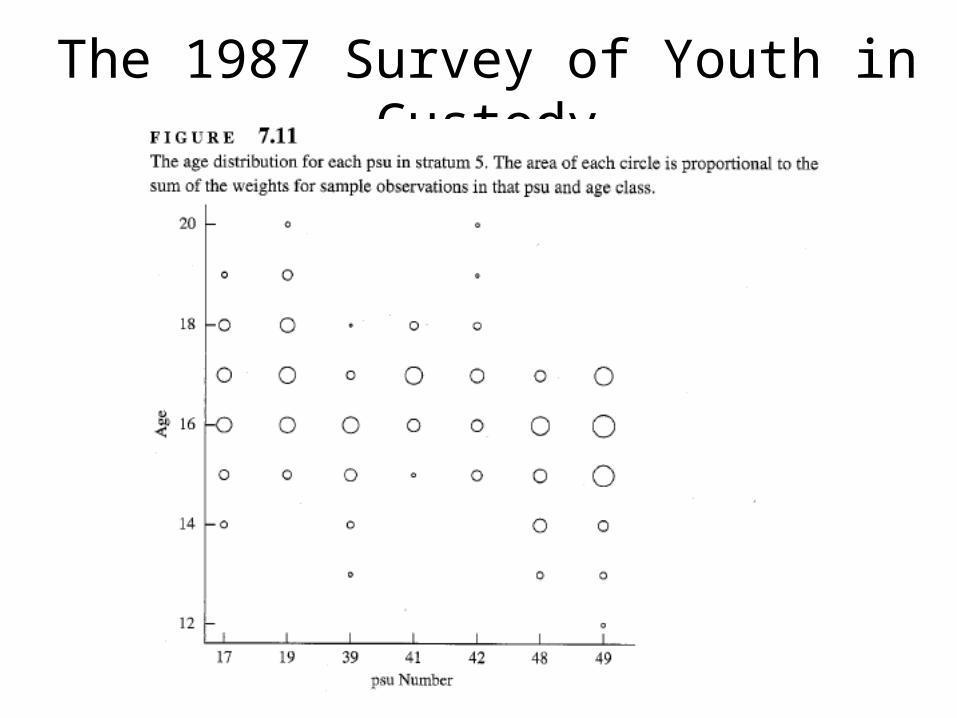
• The 1987 Survey of Youth in Custody– Family background, previous criminal history, drug
and alcohol use– 206 PSU’s (facilities) were divided by 16 strata– SSUs were the 1985 Children in Custody (CIC)

The 1987 Survey of Youth in Custody
•The two figures are very similar because the survey was aimed to be self-weighting•Youths aged 15 were undersampled due to unequal selection prob and nonresponse•Youths aged 17 were oversampled

The 1987 Survey of Youth in Custody

The 1987 Survey of Youth in Custody

The 1987 Survey of Youth in Custody
The 1987 Survey of Youth in Custody

Design effects
• Cornfield’s ratio (1951) – Measure the efficiency of a sampling plan by
the ratio of the variance that would be obtained from an SRS of k observation units to the variance obtained from the complex sampling plan with k observation units
• The design effect (deff, Kish 1965)– The reciprocal of Cornfield’s ratio

The design effects
• The design effect provides a measure of the precision gained/lost by use of the more complex design instead of SRS
• For estimating a mean

The design effects
• Stratified
• Cluster