Embed Size (px)
Citation preview

FIW, a collaboration of WIFO (www.wifo.ac.at), wiiw (www.wiiw.ac.at) and WSR (www.wsr.ac.at).
FIW – Working Paper
Competitiveness and Specialisation of the Austrian Export Sector -
A Constant-Market-Shares Analysis
Edith Skriner
This constant-market-shares (CMS) analysis shows the development of competitiveness, market and product structure of the Austrian merchandise exports from 1990 to 2006. The traditional CMS application was transformed to a dynamic model, such that the static indicators have been replaced by time series. This dynamic consideration of the CMS analysis helps to track all changes in the trade structure and competitiveness over time. The long-term trend of the indicators suggests that the Austrian foreign trade sector was able to maintain its market share in the global environment. While the Austrian foreign trade performance only slightly deviates from the pattern of the traditional industrialised countries, a strong structural change is observable in the external sector of the emerging markets. The disadvantages in competitiveness of the Austrian foreign sector have vanished, however, the market and product structure effects show negative trends after 2000, pointing to vulnerability in the Austrian export sector. JEL classification: F1, F14, C22, C43; Keywords: Welfare International economics, trade, countries and
industry studies of trade, index numbers and aggregation, time series models;
Edith Skriner works as an economist at the Vienna Institute of Advanced Studies. E-Mail: [email protected]
Abstract
The author/s
FIW Working Paper N°32 April 2009


Contact: Edith Skriner Department of Economics and Finance Institute for Advanced Studies Stumpergasse 56 1060 Vienna, Austria
: +43/1/599 91-228 email: [email protected]
Founded in 1963 by two prominent Austrians living in exile – the sociologist Paul F. Lazarsfeld and the economist Oskar Morgenstern – with the financial support from the Ford Foundation, the Austrian Federal Ministry of Education and the City of Vienna, the Institute for Advanced Studies (IHS) is the firstinstitution for postgraduate education and research in economics and the social sciences in Austria.The Economics Series presents research done at the Department of Economics and Finance andaims to share “work in progress” in a timely way before formal publication. As usual, authors bear fullresponsibility for the content of their contributions. Das Institut für Höhere Studien (IHS) wurde im Jahr 1963 von zwei prominenten Exilösterreichern –dem Soziologen Paul F. Lazarsfeld und dem Ökonomen Oskar Morgenstern – mit Hilfe der Ford-Stiftung, des Österreichischen Bundesministeriums für Unterricht und der Stadt Wien gegründet und ist somit die erste nachuniversitäre Lehr- und Forschungsstätte für die Sozial- und Wirtschafts-wissenschaften in Österreich. Die Reihe Ökonomie bietet Einblick in die Forschungsarbeit der Abteilung für Ökonomie und Finanzwirtschaft und verfolgt das Ziel, abteilungsinterne Diskussionsbei-träge einer breiteren fachinternen Öffentlichkeit zugänglich zu machen. Die inhaltliche Verantwortungfür die veröffentlichten Beiträge liegt bei den Autoren und Autorinnen.

Contents
1 Introduction 1
2 Theoretical background 2
3 Method 5
4 Data 8
5 Results 10 5.1 Austria vs. the aggregate of all reference countries .................................................. 10 5.2 Austria vs. country groups ........................................................................................ 12
6 Conclusion 15
References 17
Tables 19


IHS—/CMS Analysis—1
1 Introduction
This analysis provides some insights into the development of the competitivenessand the structure of the Austrian merchandise exports. In the last decade, theAustrian foreign trade sector benefited from its location and from its specialisa-tion. The opening of the borders in Eastern Europe in 1990 and the Austrianaccession to the EU in 1995 had been the most important events. In these years,the Austrian foreign trade sector successfully specialised into product groups witha strongly growing demand. However, since 2001 the global economy has beenchanging. The world economy has to cope with rising raw material prices, in-cluding oil and agricultural products. As a consequence, shifts in income anddemand changed the pattern of the global trade flows.
Austria’s geographical distribution of exports reflects its high degree of eco-nomic integration with the other industrial countries, especially the neighbour-ing EU members and the close geographic distance to other emerging marketsin Eastern Europe. Austria’s product specialisation reflects the importance ofone commodity group only, namely the group of machinery and vehicle prod-ucts. However, the high geographical concentration and product specialisationof trade can be a source of vulnerability due to the sensitivity to cyclical fluc-tuations in the neighbouring countries. In this context, an interesting questionis whether Austria’s geographical position and pattern of specialisation remainsadvantageous in the medium-term future.
The constant-market-shares (CMS) analysis is used to quantify the exportperformance of a country compared to the rest of the world or single foreign mar-kets. It has the nature of ex-post analyses, like the structural analyses carried outon national macroeconomic accounts or input-output tables. It is an accountingmethod for decomposing a country’s growth of aggregated export shares into acompetitiveness effect and a structural change effect. The technique reveals that,even if a country maintains its share of every product in every market, it stillcan have a decrease in its aggregate market share if it exports to markets thatgrow more slowly than the world average and/or if it exports products for whichdemand is growing more slowly than average. The competitiveness effect is thecapacity of a country to increase its market share due to competitiveness factorsonly, independently of structural developments in the market or in the producttrade pattern. If a country only exports certain traditional products for which in-ternational demand is growing slowly compared to other products, then its totalexport market share of world trade will decline even if this country succeeds inmaintaining its market share in these traditional products. A similar reasoningholds for the geographical distribution of export markets. Therefore a better ex-port performance is achieved through a pattern of exports oriented towards themost dynamic markets and products in world trade.
In CMS analyses there has been no uniform way to solve the continuous-

2—/CMS Analysis—IHS
time problem and in the treatment of the interaction term. The methodologyof Milana [1988] proposes satisfactory solutions as the decomposition is appliedto discrete observations at the beginning and the end of the period. In thisstudy the Milana [1988] model has been extended by a dynamic development,with the decomposition method applied to each observation of the time horizon.Therefore, the results of the CMS analysis are time series. In order to get a betterimpression on the long-term development of the indicators, the time series havebeen smoothed with the Hodrick Prescott (HP) filter. The data source for theCMS analysis is the OECD, International Commodity Trade Statistics. The dataset consists of the Austrian merchandise exports and the merchandise imports ofselected industrialised countries at a disaggregated level. The trade flow of eachcountry is divided into product groups on a one-digit SITC level.
The paper is organised as follows: Section 2 focuses on the theoretical back-ground. Section 3 presents the methodology. Section 4 describes the data. Theconclusions are drawn in Section 6.
2 Theoretical background
The constant-market-shares (CMS) analysis became popular in applied interna-tional economics with the pioneering work of Tyszynski [1951]. It is a methodthat disaggregates the trade data of a focus country and compares it with thetrade flows of the rest of the world. The CMS analysis is based on the assumptionthat a country’s share in world markets should remain constant over time. Thebasic identity of the CMS analysis is:
qt ≡ ∑p
qtp =
∑p
stpQ
tp (1)
or alternatively:
st =∑p
stpS
tp (2)
where
qt = aggregate exports of the focus country
qtp = exports of the p-th commodity of the focus country
Qtp = world exports of the p-th commodity
st = aggregate exports share of the focus country in total world exports
stp =
qtp
Qtp
, share of the p-th commodity of the focus country
in the p-th commodity of world exports

IHS—/CMS Analysis—3
Stp =
Qtp∑
p Qtp
, share of the p-th commodity of world exports
in total world exports
t = time.
The simplest formulation of CMS analyses can be obtained by differentiatingIdentity 2 with respect to time:
dst
dt=
∑p
stp
dStp
dt+
∑p
Stp
dst
dt(3)
In Identity 3 the growth of the aggregate export share of the focus country(dst
dt) is decomposed into two elements: a structural effect due to changes in
commodity shares in the word trade (∑
p stp
dStp
dt), and the competitiveness effect
(∑
p Stp
dst
dt), which measures the changes of the focus country’s exports due only
to export share changes in each commodity.
Since Identity 3 refers to continuous-time changes, in cannot be directly ap-plied to discrete-time observations. In the literature there is no uniform wayof translating the continuous-time into a discrete-time formulation, because thechoice of the weights influences the values and sign of the various elements of thedecomposition. Tyszynski [1951] suggested to use year 0 weights to measure thestructural effect at constant market shares and year 1 weights to compute thecompetitiveness component:
Δs =∑p
s0pΔSp +
∑p
ΔspS1p (4)
Baldwin [1958] employed year 0 weights to compute both the competitive andthe structural effect which leaves a residual1 interacting between the structuraland the competitive term:
Δs =∑p
s0pΔSp +
∑p
ΔspS0p +
∑p
ΔspΔSp (5)
Richardson [1971a] combined Laspeyres- and Paasche-type systems of weights inorder to assure consistency in the accounting for changes in the total exports.Focusing on Identity 1, the following alternative decompositions are proposed:
Δq =∑p
s0pΔQp +
∑p
Q1pΔsp (6)
1Richardson [1971a] interpreted the residual term (∑
p ΔspΔSp) as a second measurementof competitiveness, since it would indicate whether the country was increasing its export sharesin rapidly growing commodities and markets.

4—/CMS Analysis—IHS
Δq =∑p
s1pΔQp +
∑p
Q0pΔsp (7)
Δq =∑p
[αs0p + (1 − α)s1
p]ΔQp +
∑p
[(1 − α)Q0p + αQ1
p]Δsp, for 0 < α < 1 (8)
Δq =∑p
ΔQ0p +
∑p
Q0pΔsp +
∑p
ΔspΔQp (9)
Δq =∑p
ΔQ1p +
∑p
Q1pΔsp +
∑p
ΔspΔQp (10)
Identities 6 through 10 differ in the weights applied to each component. Identity 8is a combination of 6 and 7 or of 9 and 10 and uses symmetric weights. Richardson[1971a] finds that no particular one of the identities 6 to 10 has an a priorisuperiority and suggests to use them jointly because CMS calculations which useonly one of the available identities is a waste of resources. In fact, Richardson[1971a] contention is opposite to Milana [1988], who considers Identity 8 superiorto the others and demonstrates that the formulation of the CMS analysis definedby this equation, where α = 0.5, is the most accurate discrete-time approximationto the total export change between period 0 and period 1.
Richardson [1971a,b] raised another important issue of the CMS analysis. Heproposed a decomposition of the structural effect taking into account the marketdistribution of the focus country’s exports of each commodity. Hence, Identity 1becomes:
qt =∑m
∑p
stm,pQ
tm,p (11)
where stm,p ≡ qt
m,p
Qtm,p
and m denotes the m-th market.
In the case where the CMS analysis is expressed in terms of absolute changesof the country’s exports Milana [1988] applies the discrete-time decomposition.The system of weights in this version is calculated using an average of the weightsof the initial and final year. This choice reflects the fact that a country’s exportstructure and total world trade are changing over time, but that there is noreason to believe that either the structure at the beginning- or end-of-period wasdominant throughout the period. The model is determined as follows:
IHS—/CMS Analysis—5
Δq = 12[s0 + s1]ΔQ+
world growth effect
∑p
12[s0
p + s1p]ΔQp − 1
2[s0 + s1]ΔQ+
commodity composition effect
∑m
∑p
12[s0
m,p + s1m,p]ΔQm,p − ∑
p12[s0
p + s1p]ΔQp+
market distribution effect
∑m
∑p
12[Q0
m,p + Q1m,p]Δsm,p
competitiveness effect
(12)
The competitiveness term of the CMS analysis has been formally interpretedby Leamer and Stern [1970] and Richardson [1971b] as demand reaction to givenprice changes. Implicit in this interpretation is the assumption that price changesare not demand, but supply determined. The structural term of the CMS analysishas been formally interpreted by Merkies and van der Meer [1988]. The authorshave illustrated how such an interpretation can be formalised and/or modifiedby relating CMS analysis to economic theory using a two-stage CES demandfunction. The world and market terms may be supply determined if total importchanges are primarily determined by supply changes. Similarly, the commodityand competitiveness term may be demand determined if allocation changes areprimarily determined by demand shifts.
In empirical applications the continuous-time problem of the CMS analysishas been treated in different ways. E.g.: Simonis [2000] analyses the Belgiumforeign trade sector. He compares the country’s competitiveness and structuralpattern with its main trading partners, where Identity 8 provides the basis forthe analysis. Fagerberg and Sollie [2002] considered a sample of 20 industrialisedcountries between 1961 and 1983. The analysis is based on Identity 9, however,the residual term was split into a commodity adoption effect and a market adop-tion effect. Also the study of Holst and Weiss [2004], which focuses on the exportrivalry of the ASEAN members and China, is based on Identity 9.
3 Method
The subsequent analysis is based on the CMS formulation proposed by Milana[1988]. As already mentioned in the previous section, this method considers theinformation at the beginning and at the end of the observation period only. How-ever, in the time horizon under consideration, both, a country’s export structureand world exports are continuously changing. In general, such structural changes

6—/CMS Analysis—IHS
are a source of error in the analysis. Hence, one would like to know the changes inthe export shares at every observation during the period under consideration. Inthe past twenty years, the software applications advanced remarkable, the hard-ware capacity increased strongly and the quality and the availability of statisticsimproved. These progresses make the application of CMS analysis much easiertoday.
In this study the Milana [1988] model was extended by a dynamic proce-dure. The decomposition method has been applied to every available observationof the time horizon, where the initial observation is denoted as t − 1 and thefinal observation is the subsequent year (t), with t = 1, . . . , n. The big advan-tage of this method is that the interval between initial and final observation arevery small. The method helps to avoid disturbances stemming from structuralchanges in particular when there are many years between the initial and the finalperiod. While Equation 12 generates static results, one obtains time series withthis dynamic method for each of the indicators: the total effect, the competi-tiveness effect, the market distribution effect and the product composition effect.Another advantage of the proposed method is that it shows the time-dependentdevelopment of each indicator. These time series may be also used for furtherresearch.
In the underlying analysis Equation 12 has been reformulated explaining Δsinstead of Δq. The total effect (Δs) is the composite of the competitivenesseffect, the two structural effects and the residual effect. The indicator measuresthe yearly change of the focus country’s aggregate export share in world trade.A positive value suggests that the exports of the focus country expand fastercompared to the rest of the world; a negative value indicates the opposite.
Total effect:
tet = cet + met + pet + ret (13)
where
te = total effect
ce = competitiveness effect
me = market distribution effect
pe = product composition effect
re = residual effect
and
tet =
[ ∑m
∑p qt
m,p∑m
∑p Qt
m,p
−∑
m
∑p qt−1
m,p∑m
∑p Qt−1
m,p
]∗ 100 (14)

IHS—/CMS Analysis—7
with
qtm,p = element(m, p) of the reporting country’s exports
Qtm,p = element(m, p) of the world exports at time t
m = market index
p = product index
t = time
Competitiveness effect:
cet =∑m
∑p
0.5 ∗[
qtm,p
Qtm,p
− qt−1m,p
Qt−1m,p
]∗
[Qt−1
m,p∑m
∑p Qt−1
m,p
+Qt
m,p∑m
∑p Qt
m,p
]∗ 100 (15)
Market distribution effect:
met =∑m
∑p
0.5 ∗[
qt−1m,p∑
p Qt−1m,p
+qtm,p∑
p Qtm,p
]∗
[ ∑p Qt
m,p∑m
∑p Qt
m,p
−∑
p Qt−1m,p∑
m
∑p Qt−1
m,p
]∗ 100 (16)
Product structure effect:
pet =∑m
∑p
0.5 ∗[
qt−1m,p∑
m Qt−1m,p
+qtm,p∑
m Qtm,p
]∗
[ ∑m Qt
m,p∑m
∑p Qt
m,p
−∑
m Qt−1m,p∑
m
∑p Qt−1
m,p
]∗ 100 (17)
Residual effect:
ret = tet − cet − met − pet (18)
The competitiveness effect (Equation 15) summarises the influence of changesin price competitiveness (assessed by the real effective exchange rate) and changesin non-price competitiveness (expressed by qualitative factors reflecting productdifferentiation) on export performance. The competitiveness effect reveals thecapacity of a country to increase its market share due to competitiveness factorsonly, independently of structural developments in the market or in the producttrade pattern. A positive value indicates a competitive advantage of the exportsof the focus country compared to the rest of the world; a negative value indicatesa disadvantage.

8—/CMS Analysis—IHS
The market distribution effect (Equation 16) measures the effect stemmingfrom the geographical breakdown of a country’s exports. If a country’s foreigntrade is directed to markets, where the demand is strongly growing, the value ofthe market distribution effect will be positive. A negative value shows that theexports of the focus country are directed to markets in which demand is growingslower then in the rest of the world. The resulting loss in market share will stemfrom the market distribution of the country’s exports only.
The product composition effect (Equation 17) defines the influence of theproduct specialisation of a country’s exports. Small, open economies usuallyconcentrate their industrial production on a few products only, which they alsowant to export. The success of specialisation depends on the development ofthe demand in the foreign markets. If a country specialises into products with astrongly growing foreign demand, than the product composition effect will havea positive pattern. The gain in the market share will be due to the productspecialisation only.
The residual effect (Equation 18) embodies all unexplained factors of Equa-tion 13.
4 Data
The data source for the CMS analysis (Equation 14-18) is the OECD, Interna-tional Commodity Trade Statistics. The data set consists of the Austrian mer-chandise exports and the merchandise imports of selected industrialised coun-tries at a disaggregated level. The imports of all selected industrialised countrieshave been aggregated to an overall aggregate and to country groups (Table 1).Group 1 consists of the USA, Japan and South Korea. These three countriesshall represent the markets overseas. Their common characteristics are: (1) Thelong geographic distance from the Austrian market; (2) they do not belong theEuropean Monetary Union; (3) they have close economic relations to the othercountries in North -, South America and in Asia. Group 2 consists of Germany,France and Italy and is representative for the market in Continental Europe. Thegroup’s characteristics are: (1) the close geographical distance to the Austrianeconomy; the countries belong to the European Monetary Union; (3) they haveclose trade linkages with the neighbouring countries. The countries of Group 2are the major trading partners of Austria. Group 3 consists of the United King-dom and Switzerland. Both countries belong to the major trading partners ofAustria. They are located in Europe, but they are not members of the EuropeanMonetary Union. The economic structure of both countries is very similar as theyhave a strongly developed financial sector. Group 4 consists of Hungary, Poland,the Czech Republic, Slovakia and Turkey. This group of countries belongs tothe emerging economies and are representative for the markets in Eastern - and
IHS—/CMS Analysis—9
South Eastern Europe. All countries of Group 4 can be characterised by a strongeconomic growth.
Table 1: Reference countries
Group 1: USA, Japan, South KoreaGroup 2: Germany, France, ItalyGroup 3: United Kingdom, SwitzerlandGroup 4: Hungary, Poland, Czech Republic, Slovakia, Turkey
The merchandise exports and all the merchandise imports of the referencecountries have been considered by commodity groups on a one-digit SITC level(Table 2).
Table 2: Commodity groups (one-digit SITC level, 3rd Revision)
0 Food and livestock1 Beverages and tobacco2 Primary commodities (excluding crude oil)3 Combustibles and energy4 Oils and fates5 Chemical products6 Manufactured goods7 Machinery and vehicle products8 Other finished products
The CMS-analysis has been carried out for the time horizon 1990 to 2006.The dollar values of exports and imports have been converted into euro. Onlythe flows greater than one million euro entered into the analysis. Hence, 300,000observations have been considered.
To get an impression on the long-term development of the output of Equa-tions 14-17, the time series have been smoothed with the Hodrick Prescott (HP)filter. This method is particularly used to obtain a smoothed non-linear repre-sentation of a time series, that is more sensitive to long-term than to short-termfluctuations. The filtering is optimal when there exists an I(2) trend in the dataand when the noise of the data is normally distributed with N ∼ (0, σ2).
The method decomposes the original series (xt) into a trend component (gt)and a cyclical component (ct).
xt = gt + ct (19)
Then the HP filter isolates the cycle component by the following minimisation

10—/CMS Analysis—IHS
problem:
minT∑
t=1
(xt − gt)2 + λ
T−1∑t=2
[(gt+1 − gt) − (gt − gt−1)]2 (20)
The first term of Equation 20 is a measure of fitness of the time series while thesecond term is a measure of smoothness. The penalty parameter λ controls thesmoothness of the series gt. If λ equals 0 the trend component becomes equivalentto the observed time series. The larger the λ, the smoother the gt. As λ → ∞,gt approaches a linear trend. In the underlying analysis the integer value for thesmoothing parameter λ is set to 100.
5 Results
The total effect (te), the competitiveness effect (ce), the market distributioneffect (me) and the product composition effect (pe), are the deviations from theassumption that the share of the Austrian merchandise exports as measured byimports of the reference countries remains unchanged. Hence, a zero value pointsto a synchronous development of both markets. A reading above zero indicates again in the market share of the Austrian exports compared to the foreign sectorof the reference countries and a reading below indicates a loss. The results of theEquations 14-17 are displayed in Table 3 and in the Tables 4-7 of the Annex. Thelong-term development of the four effects, derived from Equation 19 and 20, areshown in the Figures 1-5. In the figures, the zero line reflects the synchronous(break even) development in the long-term. A plot above the zero line indicatesa long-term gain in market share and a plot below the zero line indicates a loss.
5.1 Austria vs. the aggregate of all reference countries
From 1990 to 2006 the Austrian foreign trade sector was able to maintain itsmarket share in the global environment. The variations from break-even of thefour effects are very small. The long-term view (Figure 1) suggests, that theAustrian gain in market share during the 1990s was attributed to improvementsin the country’s competitiveness and product composition, while the orientationto strongly growing markets shows some weakness. From 2002 onwards, all foureffects show a downward sloping trend.
As reported in the first column of Table 3, the total effect was positive from1990 to 1993 and from 1997 to 2002. The Austrian exports could slightly gainmarket share during the global economic slowdown at the beginning of the 1990s,during the Asian crisis and in the recession years 2001/2002. In contrast to thisdevelopment, the Austrian foreign trade sector lost market share in the years
IHS—/CMS Analysis—11
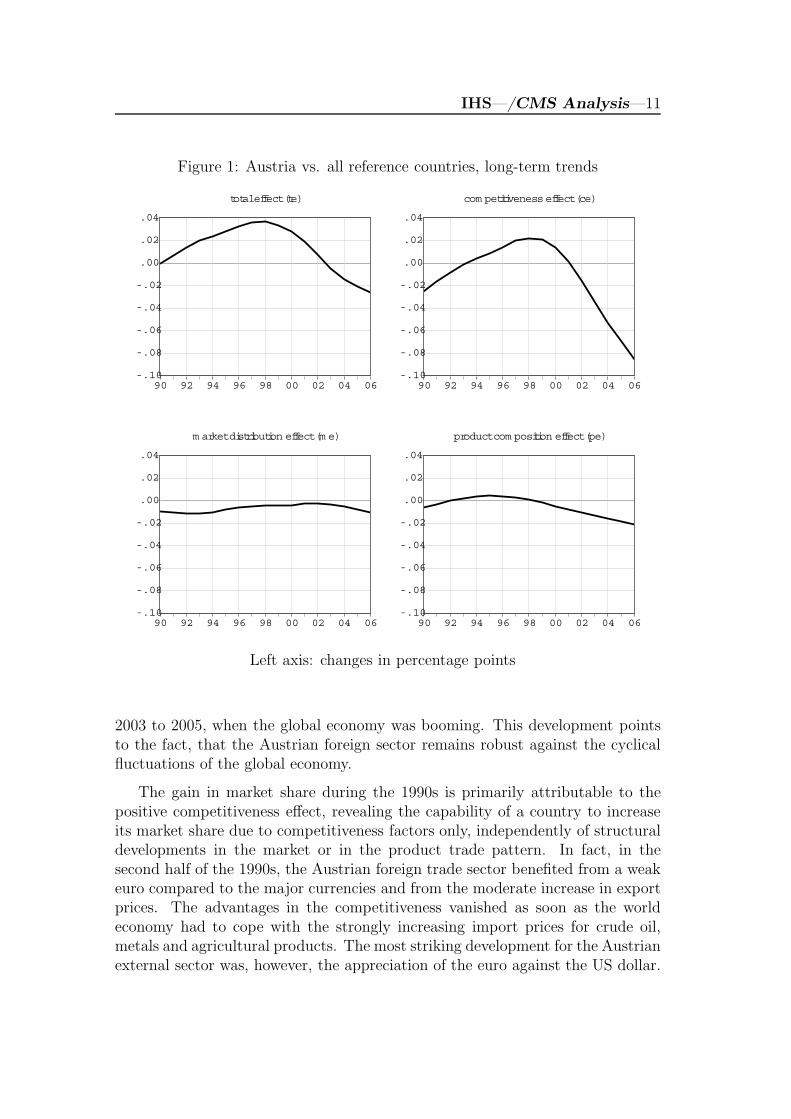
Figure 1: Austria vs. all reference countries, long-term trends
-.10
-.08
-.06
-.04
-.02
.00
.02
.04
90 92 94 96 98 00 02 04 06
total effect (te)
-.10
-.08
-.06
-.04
-.02
.00
.02
.04
90 92 94 96 98 00 02 04 06
com petitiveness effect (ce)
-.10
-.08
-.06
-.04
-.02
.00
.02
.04
90 92 94 96 98 00 02 04 06
m arket distribution effect (m e)
-.10
-.08
-.06
-.04
-.02
.00
.02
.04
90 92 94 96 98 00 02 04 06
product com position effect (pe)
Left axis: changes in percentage points
2003 to 2005, when the global economy was booming. This development pointsto the fact, that the Austrian foreign sector remains robust against the cyclicalfluctuations of the global economy.
The gain in market share during the 1990s is primarily attributable to thepositive competitiveness effect, revealing the capability of a country to increaseits market share due to competitiveness factors only, independently of structuraldevelopments in the market or in the product trade pattern. In fact, in thesecond half of the 1990s, the Austrian foreign trade sector benefited from a weakeuro compared to the major currencies and from the moderate increase in exportprices. The advantages in the competitiveness vanished as soon as the worldeconomy had to cope with the strongly increasing import prices for crude oil,metals and agricultural products. The most striking development for the Austrianexternal sector was, however, the appreciation of the euro against the US dollar.

12—/CMS Analysis—IHS
The direction change in the development of the currency implied for the Austrianforeign sector an immediate loss in the competitiveness as one can see in the top-right of Figure 1 and in the second column of Table 3.
In Figure 1, bottom-left, it’s shown that the market distribution effect movesslightly below break-even. Since the market distribution effect measures the im-pact stemming from the geographical breakdown of the Austrian exports, Aus-tria’s geographical trade pattern reflects its high degree of economic integrationwith the other industrial countries, especially the neighbouring EU members andthe close geographic distance to other emerging markets in Eastern Europe. Morethan two-thirds of the Austrian exports are shipped to the other member coun-tries of the European Union. The Austrian exports to Germany alone accountfor 30 percent in the total exports, 13 percent of the exports are directed to theneighbouring Eastern European economies. However, in Table 3, third column,some fluctuations of the indicator are traceable. From 1995 to 2003 the effect ofthe Austrian market structure was positive. In these years, the goods exportingindustries of Austria succeeded to take full advantage of the strongly growingdemand in the neighbouring countries. Since 2004, however, the development ofthe market structure effect reveals, that the Austrian foreign sector has no longerbeen able to exhaust the potential of the foreign markets.
Figure 1, bottom-right and Table 3, fourth column shows the Austrian productstructure effect. The indicator defines the influence of the product specialisationof a country’s exports. The Austrian product structure effect has slightly im-proved during the second half of the 1990s, however, from 1999 onwards, theAustrian export oriented industries have lost market share attributable to theproduct specialisation. The recent decline of the product structure effect alsosuggests that the current pattern of specialisation could be a source of vulner-ability for the Austrian foreign sector in the coming years, as Austrian exportoriented industries have particularly specialised in machinery and vehicles, whichhave a share of 40 percent in the total Austrian exports. The exports of manufac-tured goods account for 20 percent in total exports and the exports of chemicalproducts account for 9 percent.
5.2 Austria vs. country groups
In the previous section it was found that the Austrian trade pattern, compared tothe aggregate of the reference countries, shows only slight deviations from breakeven. The comparison of the Austrian trade with the pattern of the Groups 1-3shows similar results. The smoothed effects move in an interval between -0.6 to 1percentage points. In contrast to this, the comparison with Group 4 shows thatthe effects move between -50 to 25 percentage points. These differences in theresults point out that, within the years observed, the trade structures of Group4 have been changing strongly during 1990 to 2006.

IHS—/CMS Analysis—13
Table 3: CMS — Austria vs. all reference countrieschanges in percentage points
te ce me pe re1990 -0.07 -0.12 0.05 -0.03 0.041991 0.03 0.06 -0.05 -0.00 0.031992 0.00 -0.03 0.01 0.00 0.021993 0.21 0.16 -0.07 -0.00 0.131994 -0.10 0.01 -0.11 0.02 -0.021995 -0.09 -0.20 0.06 0.03 0.021996 -0.10 -0.19 0.07 -0.02 0.041997 0.21 0.20 -0.01 0.00 0.021998 0.16 0.01 0.10 0.06 -0.011999 -0.01 0.10 -0.12 -0.02 0.032000 0.01 0.18 -0.15 -0.06 0.042001 0.25 0.15 0.09 0.00 0.012002 0.04 -0.01 0.05 0.01 -0.012003 -0.24 -0.31 0.06 -0.02 0.032004 -0.11 -0.10 -0.01 -0.01 0.012005 -0.15 -0.08 -0.07 -0.05 0.052006 0.17 -0.03 -0.01 -0.00 0.21
Figure 2 shows the total effect in the long-run. Despite the long geographicdistance and the existent currency risk, the Austrian foreign trade sector wasable to maintain its export market share in Group 1. During the 1990s, theAustrian foreign sector could increase its market share compared to the importdevelopment of Group 2. From 2002 onwards the Austrian export sector expandsslower than the import development of Group 2. The Austrian market share inGroup 3 shows a positive development, however, the effect performs a graduallydeclining trend, though from a high level. Since 2004 the percentage change ofthe total effect stagnates slightly above zero. From 1990 to 2000 the Austrianforeign sector was able to conquer the emerging markets (Group 4). From 2001onwards, an almost synchronous development with the Group 4 is observable.
Figure 3 compares the competitiveness effect of the groups. It shows thatuntil 2002, the Austrian foreign sector was able to maintain its competitivenesscompared to the markets overseas. Compared to Group 2, the Austrian foreignsector has scored an advantage in the competitiveness, attributable to moderateexport price increases and strong productivity gains. In the subsequent years,the Austrian foreign sector lost its comparative advantage compared to Group 1and 2. Since the second half of the 1990s, disadvantages in the competitivenessemerged in the Austrian foreign trade sector compared to Group 3. In Group

14—/CMS Analysis—IHS
Figure 2: Total effect, long-term trends
-.2
.0
.2
.4
.6
.8
1990 1992 1994 1996 1998 2000 2002 2004 2006
1-USA,JPN,KOR 2-DEU,FRA,ITA 3-UK,CH
-35
-30
-25
-20
-15
-10
-5
0
5
1990 1992 1994 1996 1998 2000 2002 2004 2006
4-HUN,POL,CZE,SVK,TUR
Left axis: changes in percentage points
4 the big disadvantages, which were observable at the beginning of the 1990s,declined in the following years and they have disappeared after 2002. Due to theincreasing income, the economies of Group 4 lost their comparative advantagevis-a-vis Austria.
As shown in Figure 4 the market structure effect of Group 1 and 2 deviatesonly slightly from break even. However, after 2002, both country groups couldintensify their trade links to markets, which exhibit a stronger dynamic in de-mand than the Austrian trading partners. The Austrian market structure effect,compared to group 3, was positive between 1992 and 2006. This result empha-sises the advantage of location of the Austrian market compared to this group ofcountries, as they are located in a greater geographic distance to the strong grow-ing markets in Eastern Europe. Compared to Group 4, the advantage of locationof the Austrian foreign trade sector has been turning into a disadvantage after2000, as the emerging markets intensified their trade links to strongly growingeconomies like Russia, China and India.
During the 1990s, the product specialisation of the Austrian foreign tradesector which concentrates primarily on one commodity group only turned out tobe an advantage. Figure 5 suggests that in those years the Austrian foreign sectorgained market share due to its product specialisation compared to Group 1, 2and 3. However, after the middle of the 1990s the attractiveness of the Austrianproduct supply faded. As of 2000, the specialisation effect adversely affected thetrade performance in Group 1 and 2. The product specialisation effect, whichcompares Austria with Group 3 contracted the strongest. Compared to Group4, the big advantage of the Austrian product specialisation, which was obtainedduring the 1990s also vanished. A slight adverse development has been observed

IHS—/CMS Analysis—15
Figure 3: Competitiveness effect, long-term trends
-0.6
-0.4
-0.2
0.0
0.2
0.4
0.6
0.8
1.0
1990 1992 1994 1996 1998 2000 2002 2004 2006
1-USA,JPN,KOR 2-DEU,FRA,ITA 3-UK,CH
-50
-40
-30
-20
-10
0
10
1990 1992 1994 1996 1998 2000 2002 2004 2006
4-HUN,POL,CZE,SVK,TUR
Left axis: changes in percentage points
since that time.
6 Conclusion
In the 1990s, the Austrian foreign trade sector benefited from its location andspecialisation. The opening of the borders in Eastern Europe in 1990 and theaccession to the EU in 1995 had been the most striking events for the Austrianforeign trade sector. In these years, the Austrian foreign trade sector expandedrapidly as it successfully specialised into product groups with a strongly growingforeign demand. However, since 2001 the global economy has been changing.The world economy has to cope with rising raw material prices, including oil andagricultural products. As a consequence, shifts in income and demand changedthe pattern of the global trade flows. Therefore, in particular the export driveneconomies have to adjust swiftly to the change in foreign demand. A stronggeographical concentration and product specialisation of trade can be a sourceof vulnerability due to the sensitivity to cyclical fluctuations in the neighbouringcountries. Hence, this analysis provides some insights into the development ofthe competitiveness and the structure of the Austrian merchandise exports from1990 to 2006.
For the analysis of the Austrian trade performance a constant-market-shares(CMS) analysis was applied. The methodology suggested by Milana [1988] hasbeen transformed to a dynamic model, such that all variables of the CMS modelare now time series. They have been smoothed with the Hodrick Prescott (HP)filter which gives a better overview of the long-term development of each indi-
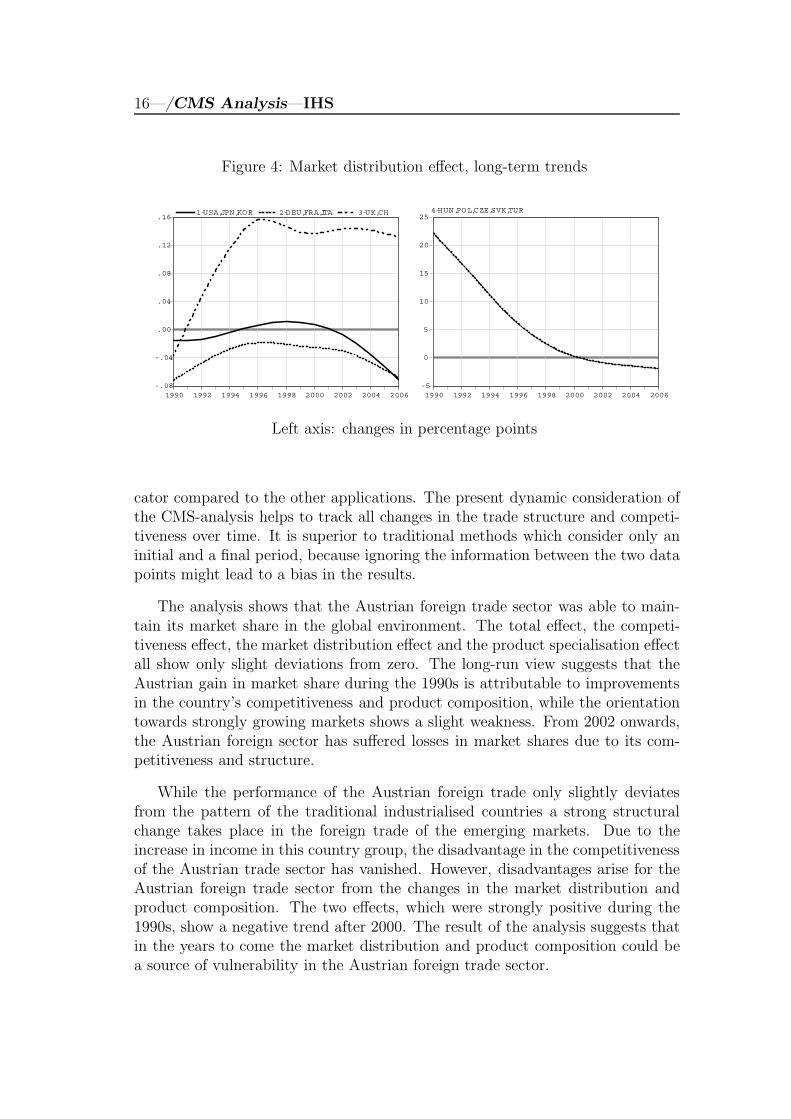
16—/CMS Analysis—IHS
Figure 4: Market distribution effect, long-term trends
-.08
-.04
.00
.04
.08
.12
.16
1990 1992 1994 1996 1998 2000 2002 2004 2006
1-USA,JPN,KOR 2-DEU,FRA,ITA 3-UK,CH
-5
0
5
10
15
20
25
1990 1992 1994 1996 1998 2000 2002 2004 2006
4-HUN,POL,CZE,SVK,TUR
Left axis: changes in percentage points
cator compared to the other applications. The present dynamic consideration ofthe CMS-analysis helps to track all changes in the trade structure and competi-tiveness over time. It is superior to traditional methods which consider only aninitial and a final period, because ignoring the information between the two datapoints might lead to a bias in the results.
The analysis shows that the Austrian foreign trade sector was able to main-tain its market share in the global environment. The total effect, the competi-tiveness effect, the market distribution effect and the product specialisation effectall show only slight deviations from zero. The long-run view suggests that theAustrian gain in market share during the 1990s is attributable to improvementsin the country’s competitiveness and product composition, while the orientationtowards strongly growing markets shows a slight weakness. From 2002 onwards,the Austrian foreign sector has suffered losses in market shares due to its com-petitiveness and structure.
While the performance of the Austrian foreign trade only slightly deviatesfrom the pattern of the traditional industrialised countries a strong structuralchange takes place in the foreign trade of the emerging markets. Due to theincrease in income in this country group, the disadvantage in the competitivenessof the Austrian trade sector has vanished. However, disadvantages arise for theAustrian foreign trade sector from the changes in the market distribution andproduct composition. The two effects, which were strongly positive during the1990s, show a negative trend after 2000. The result of the analysis suggests thatin the years to come the market distribution and product composition could bea source of vulnerability in the Austrian foreign trade sector.

IHS—/CMS Analysis—17
Figure 5: Product composition effect, long-term trends
-.16
-.12
-.08
-.04
.00
.04
1990 1992 1994 1996 1998 2000 2002 2004 2006
1-USA,JPN,KOR 2-DEU,FRA,ITA 3-UK,CH
-1
0
1
2
3
4
5
6
7
1990 1992 1994 1996 1998 2000 2002 2004 2006
4-HUN,POL,CZE,SVK,TUR
Left axis: changes in percentage points
References
R. E. Baldwin. The commodity composition of trade: Selected industrializedcountries, 1900-1954. Review of Economics and Statistics, (40):50–71, 1958.
J. Fagerberg and G. Sollie. The method of constant market shares analysis re-considered. Applied Economics, 19(12):1571–1583, 2002.
D. R. Holst and J. Weiss. ASEAN and China: Export rivals or partners inregional growth. World Economy, 27(8):1255–1274, 2004.
E. E. Leamer and R. M. Stern. Quantitative international economics. Allyn andBacon, Inc., 1970.
A. H. Q. M. Merkies and T. van der Meer. A theoretical foundation for constantmarket shares ananlysis. Empirical Economics, 13(2):65–80, 1988.
C. Milana. Constant-market-shares analysis and index number theory. EuropeanJournal of Political Economy, 4(4):453–478, 1988.
J. D. Richardson. A constant market shares analysis for export growth. Journalof International Economics, (1):227–239, 1971a.
J. D. Richardson. Some sensitivity tests for a constant market shares analysis ofexport growth. Review of Economics and Statistics, (53):300–304, 1971b.
D. Simonis. Belgium’s export performance: A constant market shares analysis.Working paper 2, Ferderal Planning Bureau, 2000.

18—/CMS Analysis—IHS
H. Tyszynski. World trade in manufactured commodities, 1899-1950. The Manch-ester School of Economic and Social Studies, (19):222–304, 1951.

IHS—/CMS Analysis—19
A Tables
Table 4: CMS — Austria vs. Group 1changes in percentage points
te ce me pe re1990 0.14 0.15 0.18 -0.15 -0.041991 0.15 0.30 -0.23 0.05 0.031992 0.06 -0.02 -0.02 -0.01 0.111993 0.09 -0.29 -0.11 0.07 0.431994 -0.63 -0.65 0.04 0.11 -0.141995 -0.10 -0.16 -0.00 0.05 0.011996 -0.15 -0.15 0.01 -0.06 0.061997 0.38 0.40 0.00 -0.00 -0.021998 0.55 0.30 0.24 0.13 -0.121999 -0.16 -0.04 -0.13 -0.04 0.052000 -0.24 -0.06 -0.19 -0.15 0.162001 0.62 0.43 0.18 -0.01 0.022002 0.12 0.20 0.07 0.05 -0.192003 -0.34 -0.37 0.08 -0.09 0.032004 -0.18 -0.11 -0.05 -0.01 -0.012005 -0.45 -0.38 -0.13 -0.12 0.182006 0.40 -0.03 -0.12 -0.03 0.58

20—/CMS Analysis—IHS
Table 5: CMS — Austria vs. Group 2changes in percentage points
te ce me pe re1990 -0.56 -0.47 -0.08 -0.02 0.031991 -0.10 0.03 -0.15 -0.03 0.041992 0.06 -0.09 0.00 0.01 0.141993 1.18 1.05 -0.09 -0.06 0.281994 -0.14 -0.20 0.02 0.10 -0.051995 -0.28 -0.49 0.13 0.09 0.011996 0.11 0.11 -0.01 -0.09 0.091997 0.96 0.99 -0.04 0.03 -0.021998 0.10 -0.24 0.14 0.15 0.051999 0.09 0.34 -0.33 -0.03 0.112000 0.55 0.78 -0.21 -0.14 0.122001 0.57 0.41 0.15 0.00 0.012002 0.20 0.15 0.09 -0.01 -0.032003 -0.99 -1.11 0.07 -0.03 0.082004 -0.34 -0.33 -0.07 -0.02 0.092005 -0.29 -0.16 -0.13 -0.11 0.112006 0.30 -0.21 -0.11 0.01 0.61

IHS—/CMS Analysis—21
Table 6: CMS — Austria vs. Group 3changes in percentage points
te ce me pe re1990 -0.37 1.85 -0.12 -0.17 -1.941991 0.99 -0.81 -0.26 -0.13 2.191992 0.32 -0.25 0.11 -0.03 0.491993 2.18 -0.77 0.85 -0.02 2.131994 4.58 12.33 -1.46 -0.69 -5.601995 -1.49 -7.16 0.91 0.32 4.441996 -4.81 -10.04 1.57 0.77 2.901997 1.12 1.26 -0.31 0.02 0.151998 0.79 0.63 0.17 0.07 -0.081999 0.45 0.84 -0.63 -0.10 0.352000 1.11 1.41 -0.16 -0.10 -0.042001 1.45 1.34 0.19 -0.10 0.022002 0.10 0.35 0.52 -0.19 -0.572003 -1.70 -1.70 0.28 -0.10 -0.182004 -0.65 -0.87 0.12 -0.09 0.182005 -0.68 -0.70 0.12 -0.27 0.172006 1.75 -0.04 0.04 0.01 1.75

22—/CMS Analysis—IHS
Table 7: CMS — Austria vs. Group 4changes in percentage points
te ce me pe re1990 -38.31 -56.58 19.78 7.80 -9.311991 12.20 7.03 -10.73 6.02 9.881992 -82.13 -123.65 35.56 8.76 -2.801993 -21.40 -23.08 29.60 2.56 -30.481994 6.05 6.79 1.99 -0.42 -2.311995 -9.58 -10.93 0.60 0.68 0.071996 -9.47 -12.78 1.73 0.84 0.731997 -1.38 -3.40 0.50 0.56 0.971998 0.48 -1.36 0.97 1.26 -0.391999 4.82 4.86 -0.59 -0.25 0.802000 -1.06 -0.15 -1.22 -1.48 1.792001 3.77 -11.75 0.11 0.66 14.752002 -3.78 -3.70 0.37 0.26 -0.702003 -7.74 -7.67 0.01 -0.03 -0.052004 -4.30 -4.30 0.47 -0.19 -0.292005 -1.52 -0.79 -1.13 -0.22 0.612006 3.24 0.87 -0.10 0.35 2.12

Author: Edith Skriner Title: Competitiveness and Specialisation of the Austrian Export Sector. – A Constant-Market- Shares Analysis Reihe Ökonomie / Economics Series 235 Editor: Robert M. Kunst (Econometrics) Associate Editors: Walter Fisher (Macroeconomics), Klaus Ritzberger (Microeconomics) ISSN: 1605-7996 © 2009 by the Department of Economics and Finance, Institute for Advanced Studies (IHS), Stumpergasse 56, A-1060 Vienna • +43 1 59991-0 • Fax +43 1 59991-555 • http://www.ihs.ac.at

ISSN: 1605-7996