Embed Size (px)
Citation preview
World Maritime University World Maritime University
The Maritime Commons: Digital Repository of the World Maritime The Maritime Commons: Digital Repository of the World Maritime
University University
World Maritime University Dissertations Dissertations
1999
Competitive strategies for container ports : analysis of Competitive strategies for container ports : analysis of
competition and competitors in the Hamburg-Le Havre range? competition and competitors in the Hamburg-Le Havre range?
Bernardo Flores Herrera World Maritime University
Follow this and additional works at: https://commons.wmu.se/all_dissertations
Digital
Commons
Network
Logo
Part of the Strategic Management Policy Commons
Recommended Citation Recommended Citation Flores Herrera, Bernardo, "Competitive strategies for container ports : analysis of competition and competitors in the Hamburg-Le Havre range?" (1999). World Maritime University Dissertations. 265. https://commons.wmu.se/all_dissertations/265
This Dissertation is brought to you courtesy of Maritime Commons. Open Access items may be downloaded for non-commercial, fair use academic purposes. No items may be hosted on another server or web site without express written permission from the World Maritime University. For more information, please contact [email protected].

WORLD MARITIME UNIVERSITYMalmö, Sweden
COMPETITIVE STRATEGIESFOR CONTAINER PORTS
Analysis of competition and competitors in the Hamburg-Le Havre range
By
BERNARDO FLORES HERRERAMexico
A dissertation submitted to the World Maritime University in partialfulfillment of the requirements for the award of the degree of
MASTER OF SCIENCE
in
PORT MANAGEMENT
1999
© Copyright Bernardo Flores, 1999
ii
DECLARATION
I certify that all the material in this dissertation that is not may own work has been
identified, and that no material is included for which a degree has previously been
conferred on me.
The contents of this dissertation reflect my own personal views, and are not
necessarily endorsed by the University.
………………………………………………..
………………………………………………..
Supervised by:
Dr. Bernard FrancouAssociated Professor, Port Management
World Maritime University
Assessor:
Dr. Ma ShuoCourse Professor, Port and Shipping Management
World Maritime University
Co-assessor:
Mr. Jacques SubletSecretary General
U.P.A.C.C.I.M. – A.D.P.F.Les Ports Francais

iii
ACKNOWLEDGMENTS
I am taking this space to express my sincere gratitude to all the organizations and
individuals who made this part of my carrier development an entire success.
First of all, I would like to thank to the Global Foundation for Research and
Scholarship for investing in my development and to let you know that wherever I go
I will remember this invaluable opportunity that people from Japan have given me.
Next, I want to show my appreciation to the World Maritime University staff and my
professors for their contribution to my academic experience. Special thanks go to Dr.
Bernardo Francou for his guidance and for his belief in this project since the
beginning. Moreover, to Dr. Ma Shuo for his effort to expand this Masters with his
knowledge and expertise.
I want to express all my love to my parents and my entire family in Mexico.
“Gracias Papa y Mama por ensenarme que la base de todo exito es el esfuerzo
constante y gracias por hacer de mi un hombre de bien. A mis hermanas y cunados
gracias por su incondicional apoyo y para mis queridos sobrinos Fernando, Armin,
Noe y Abraham quienes son parte de mi motivacion y espero que en un futuro no
muy lejano ustedes saboreen esta satisfaccion indescriptible.”
Finally, I would like to thank my wife Kathy for being the source of my inspiration
and the motivation of my life, as well as for her tolerance of all the inconveniences
during this time. However, you may be sure that in the future wherever we go will
be the best because we will be together.

iv
ABSTRACT
Dissertation Title: “Competitive Strategies for Container Ports”. Analysis ofcompetition and competitors in the Hamburg-Le Havre range.
Degree: MSc.
The dissertation points out the relevance of Competitive Strategies as a tool for Port
Managers to succeed in the market through the use of economic concepts, analytical
techniques for the industry, and competitors analysis. Furthermore, this paper
proposes a specific process to show how the analysis of the industry and competitors
in the container port industry must be carried on. The process is shown in a practical
way using the Hamburg Le Havre range as the market to be analyzed.
The EU integration process and its legal implications on competition are analyzed as
an introduction to the market. The development of the intra and extra EU trade is a
catalyst to the container port competition because it points out the need for reliable
distribution channels. Moreover, this development of trade and the EU GDP are
analyzed together with container traffic growth. The results show a strong
correlation and provide the foundation for forecasting traffic for this area in the next
ten years.
Two innovative tools are suggested for the analysis of competitors. The Flower of
Competition analyzes the competitiveness of the port in the range using seven factors
for competition showing a clear view of these competitors in the market. The
Questionnaire on Competition gives an overview of competitor point of view about
their particular markets. The questionnaire was sent to different players in the range.
This paper concludes by processing the results of the industry and competitors
analysis as well as the market trends and customer requirements. It proposes a more
suitable Competitive Strategy that considers also the classification of ports proposed
in this paper, and the competitiveness and specific characteristics of each port.
KEYWORDS : Analysis, Competitive, Competitors, Market, Port, Strategy, Tools.

v
TABLE OF CONTENTS
Declaration ii
Acknowledgments iii
Abstract iv
Table of Contents v
List of Tables viii
List of Figures ix
List of Abbreviations x
1. INTRODUCTION 1
2. COMPETITION. Theoretical Framework
2.1 Economic Concepts of Competition 4
2.1.1 Competitive Supply 4
2.1.2 Perfect competition 5
2.1.3 Imperfect competition 5
2.2 Structural Analysis of Industries 6
2.2.1 Threat of entry 7
2.2.2 Threat of substitution 10
2.2.3 Bargaining power of customers 11
2.2.4 Bargaining power of suppliers 11
2.2.5 Rivalry between competitors 11
2.3 Generic Competitive Strategies 12
2.3.1 Overall cost leadership 12
2.3.2 Differentiation 13
2.3.3 Focus 13
2.4 Analysis of competitors 14
2.5 Port Industry Signals 14
2.6 Competitive Moves 15

vi
2.6.1 Types of competitive moves 15
2.6.2 Threatening moves 16
2.6.3 Defensive moves 16
3. THE IMPORTANCE OF PORTS IN THE EUROPEAN UNION
3.1 The European Union (EU) 18
3.2 Economic growth of the E U in the International Framework 19
3.2.1 External and Internal trade of the EU 21
3.3 European Port Policy 23
3.3.1 The four axes of the EU Port Policy 24
3.4 European Ports Overview 25
3.4.1 Similarities and differences in the HLHr 25
3.5 The EC Competition Law 28
3.6 The Green Paper 29
4. CONTAINER COMPETITION IN EUROPE
4.1 Container Development in Europe 33
4.2 Containerization traffic growth and forecasting 35
4.3 The competition in the Hamburg–Le Havre range 36
4.3.1 Type of port competition in the range 38
4.4 Competitors Analysis 39
4.5 The Competitors Feelings about the Competition in the Market 43
4.5.1 Feeling about the competition 44
4.5.2 Factors for competition and customers requirements 47
4.5.3 Competitive Strategies and market sensibility 50
4.5.4 Competitors assumptions and capabilities 51
4.6 Impact of the International Containerization Trend 53
4.7 Customers Requirements for European Ports 54

vii
5. BUILDING COMPETITIVE STRATEGY
5.1 Port Classification 58
5.1.1 Port classification in the Hamburg-Le Havre range 59
5.1.2 Defining Competitive Strategy 60
5.2 Building the Competitive Strategy for the port of Hamburg 61
5.2.1 The Competitive Strategy for Hamburg 61
5.2.1.1 The Focus Strategy 61
5.2.1.2 The Overall Cost Strategy 62
5.3 Building the Competitive Strategy for the Bremerhaven 63
5.3.1 The Competitive Strategy for Bremerhaven 63
5.3.1.1 The Differentiation Strategy 63
5.4 Building the Competitive Strategy for the port of Rotterdam 65
5.4.1 The Competitive Strategy for Rotterdam 65
5.5 Building the Competitive Strategy for the port of Antwerp 66
5.5.1 The Competitive Strategy for Antwerp 67
5.6 Building the Competitive Strategy for the port of Zeebrugge 68
5.6.1 The Competitive Strategy for Zeebrugge 68
5.7 Building the Competitive Strategy for the port of Le Havre 69
5.7.1 The Competitive Strategy for Le Havre 70
6. CONCLUSIONS 72
Bibliography 76
Appendices
Appendix I Traffic forecast for Europe and the Hamburg-Le Havre range 79
Appendix II Factors for Competition 81
Appendix III Questionnaire on Competition 84

viii
LIST OF TABLES
Table 1. Container handling equipment cost 8
Table 2. Comparison of GDP growth rate 19
Table 3. Comparison of GDP market prices 20
Table 4. Participation in GDP by Member State 20
Table 5. Trade participation in the world 21
Table 6. Growth in trade in volume 21
Table 7. EU exports 1997 21
Table 8. EU imports 1997 21
Table 9. Extra-EU trade by State 22
Table 10. Participation in Extra-EU trade 22
Table 11. Intra-EU trade in value 22
Table 12. State participation in Intra-EU 22
Table 13. Total EU trade participation by State 23
Table 14. Participation in value 90-97 23
Table 15. World Container Traffic 34
Table 16. Europe in World Container Traffic 34
Table 17. Container Traffic growth in % 34
Table 18. Historical and projected throughput for Europe 35
Table 19. Forecasted growth and throughput 35
Table 20. Participation of the Hamburg-Le Havre range in Europe 37
Table 21. Historical and projected participation in percentage on the HLHr 37
Table 22. Historical and projected participation in throughput on the HLHr 37
Table 23. Concentration measured by total traffic (TEU’s) 38
Table 24. “The Flower of Competition” in the Hamburg-Le Havre range 41
Table 25. Competitive ranking 42
Table 26. Intra Competition (1000 TEU’s) 46
Table 27. Main Container Operators 46
Table 28. Level of the Quality of Service to Ships/Cargo provided by ports 59
ix
LIST OF FIGURES
Figure 1. Demand under perfect and imperfect competition 5
Figure 2. Different market forms 6
Figure 3. Forces driving industrial competition 7
Figure 4. Barriers and profitability 10
Figure 5. The three Generic Strategies 12
Figure 6. Components of competitors analysis 14
Figure 7. EU Port Policy axes 24
Figure 8. Diversity of European Ports 25
Figure 9. Similarities and differences in the Hamburg-Le Havre Range 27
Figure 10. Hamburg-Le Havre range 36
Figure 11. New generation of container vessels 53
Figure 12. Port classification according to the quality of services provided 58
Figure 13. Classification of ports in the Hamburg-Le Havre range 59
Figure 14. Competitive Strategy for the ports in the HLHr 60

x
LIST OF ABBREVIATIONS
BLG Bremen Lagerhus-Gesellschaft
DAE Developing Asian Economies
EC European Commission
ECSC European Coal and Steel Community
ECT Europe Combined Terminals
EEA European Economic Area
EFTA European Free Trade Area
EPP European Port Policy
ESPO European Sea Port Association
EU European Union
FCL Full Container Load
HHLA Hamburger Hafen-und Lagerhus-AG
HLHr Hamburg – Le Havre range
HPH Hutchinson Port Holdings
IT Information Technology
LCL Less than Container Load
MSC Mediterranean Shipping Company
NAFTA North America Free Trade Association
PIS Pilot Intelligent Systems
R&D Research and Development
SSS Short Sea Shipping
T-ETN Trans-European Transport Network
USA United States of America
VTS Vessel Traffic System

1
CHAPTER 1
1. INTRODUCTION
“COMPETITIVE STRATEGY provide managers with the raw material for
thinking about how to change the rules of the marketplace in their favor”1.
Competition is not a new word for most of the industries around the world;
moreover, competition gives to the industry capacity for expansion, technological
improvements, innovation, and increases the quality of products and services.
Thus, it benefits customers since they will have the opportunity to choose between
more than one supplier or product, to pressure suppliers to increase quality and to
reduce prices. Similarly, suppliers benefit from competition since it makes the
market more active, which requires more innovative management, marketing
techniques as well as more strategic thinking. Also, suppliers can benchmark their
products, staff and more important they can show to customers how good they are.
Therefore, every company competing in an industry has a competitive strategy,
which may have been developed by a very well elaborated strategic process or by an
emotional reaction to the competitive moves of others. Indeed, the success of both
competitive strategies can not be discussed, but the risk involved in each gives an
argument for study. Risk can be reduced if the strategy is built based on a structural
analysis of the market and competitors in order to understand market forces and
anticipate developments and competitive moves from competitors.
The port industry is not exempt of competition nowadays. With the constant
increase in containerization the industry has been exposed to a very high
competition. For instance, each Port Manager wants his own port to become the hub
1 Gluck, F. (Mc Kinsey & Company, Inc) “comments about Competitive Strategy”, Porter, M. (1980)

2
port for its region. However, the problem arises because the port manager in the
neighboring port is thinking the same way. Therefore, competitive strategies give
the opportunity to port managers and terminal operators the possibility to achieve
their goals with the best certainty level, the most effective moves and investing only
in the necessary resources2. Moreover, it provides mangers with the perfect tool to
understand the nature of the business, the environment where they are competing, the
competitive capacities of their competitors and mainly gives them the capacity to
lead the competition and change the market environment in their benefit.
This paper proposes a comprehensive structural analysis that copes with the aspects
of the market analysis and suggests tools that give a very good perspective of the
market evolution, competitors and its own position. This analysis goes in parallel
with a practical study of the container port competition in the Hamburg-Le Havre
range (HLHr) selected as the ideal market for this study. Thus, the goals are:
Ø To describe step-by-step in a practical way how to collect and analyze the factors
that must be considered by decision-makers to choose competitive strategy.
Ø To suggest the methodology to decide the best strategy for the port based on the
analysis of the factors for competition, and competitor position and possible
competitive strategies.
The paper is organized in three sections covered over four chapters. The first section
covers the theoretical framework, the second covers the industry and competitor
analysis and the third section select the competitive strategies for each port.
First, the theoretical framework is established for analysis of the states of
competition and the structure of the industry and competitors. So, the aim is to know
the economic concepts applicable to determine the state of the market, the techniques
for industry and competitor analysis, the forces driving the competition and their
strategic implication in the industry, and finally, the techniques for understanding
market signals and anticipation or response to competitive moves.
2 Porter, M. (1980). p. 3 - 33

3
The second section is divided into two parts. Chapter 3 is the first part of the
process; it introduces the market subject to be studied throughout the analysis of the
development of EU from the political, legal and economic perspectives. Therefore, it
is crucial to point out the importance of the port industry for the European economy,
the legal measures taken for the EC to promote and regulate the port competition,
and the magnitude of the trade in the region and where this trade is generated.
Chapter 4, as the second part of the section, points out the importance of European
container traffic in the world, its development and at the same time the participation
of the HLHr in this market. Moreover, this chapter tries to find out the relation of
container traffic growth and some macro economic indicators such as GDP and trade
in value, and the size of the market for the next five and ten years in order to set the
targets for the strategy. Also, it tries to find out the type of competition that is
actually taking place in the HLHr and the types of the future along with the tools that
can be used to analyze competitors. Finally, the factors for competition that are
driving the market in this particular region, and the market trends and customer
requirements for this particular market are discussed.
Finally, section three (Chapter 5) is the conclusion of the process where the
competitive strategy has to be chosen and built according to the result of the
research. According to the analysis of the market and competitors the last step is to
categorize the ports according to quality of services and to apply the most suitable
competitive strategy for each port.
Indeed, success in any industry requires the use of tools that provides the clear
information needed to take the right decision. The competitive strategy process gives
not only the information but suggests the best competitive strategy for each particular
situation. Despite the limitations in time, information and resources, this paper
proposes innovative tools and techniques that can be easily adapted to any port
around the world to build its own competitive strategy.
4
CHAPTER 2
2. COMPETITION. Theoretical Framework
The present chapter’s aim is to introduce the economic concepts and different states
of competition in order to have the base for standardizing this study and the
framework for analyzing the structure of the industry and competitors.
First, the economic concepts determine if the market is in perfect, imperfect or in a
state of monopoly. Next, industry and competitor analysis can be done through the
study of the five competitive forces and their strategic implications in the industry.
Moreover, the techniques for the study of competitors and customers can be applied
to the construction of competitive strategies. Finally, this theoretical framework will
establish techniques for the understanding of the market signal and the anticipation
or response to the competitive moves.
2.1 Economic Concepts of Competition
Before starting the study of the theoretical framework for analysis of industries, the
container terminal industry competition, the analysis of competitors and competitive
strategies, and the performance of competitive strategies it is necessary to understand
the economic concepts of competition and to take it as the pillars of this study.
2.1.1 Competitive Supply
The theory of the inter-relation between price and competitive supply comes from
the general assumption that companies maximize their profits. Although, imperfect
competition is a deviation of perfect competition, the first one is only a theoretical
possibility and the second is not, and can be divided into monopolistic competition,
oligopoly and duopoly to pure monopoly where there is no competition at all1.
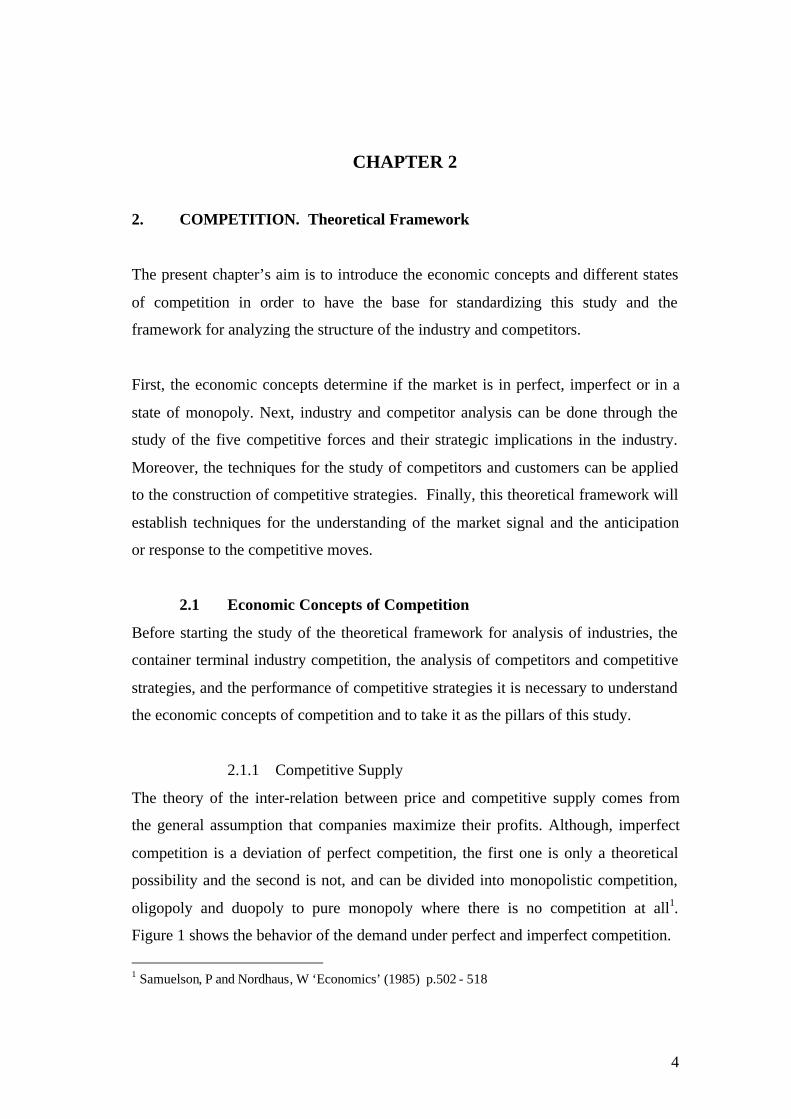
Figure 1 shows the behavior of the demand under perfect and imperfect competition.
1 Samuelson, P and Nordhaus, W ‘Economics’ (1985) p.502 - 518

5
Figure 1. Demand under perfect and imperfect competition. (Paul Samuelson 1985)
2.1.2 Perfect competition
Perfect competition occurs when no producer can affect the market price. Industries
under perfect competition must have four main characteristics2:
a) Large number of buyers and suppliers that a single one can not affect the market.
b) Homogeneous or standardize products that can differentiate the industry.
c) Customers and suppliers well inform about product quality required and offered.
d) Freedom for customers and suppliers to entry or exit from/to the market.
Indeed, the container terminal industry in the HLHr can be near to this concept
because it reasonably satisfies these four conditions. Finally, an important
characteristic of perfect competition is that the market will tend to drive down prices
and turn the competition in another direction such as quality of services or new
technology, which means that the industry is arriving at a new stage.
2.1.3 Imperfect competition
All markets to a certain extent are imperfect. Markets, contrarily to perfect
competition, can be affected by a single supplier who affects the market price by
altering the supply3. Besides, the number of suppliers, behavior and influence in the
three market types can be distinguished: duopoly, oligopoly and monopolistic
competition. The main sources of imperfect industries are cost conditions and
barriers of competition. Such sources arise when there is a small number of
2 Samuelson, P. and Nordhaus, W. ‘Economics’ (1985). p.516 - 5173 Craven, J. ‘Introduction to Economics’ (1990). p. 325

6
suppliers, when there are significant economies of large-scale production, when a
product has patent protection, or when regulatory barriers preclude competition4.
Figure 2 describe the characteristics of each types of competition.
Figure 2. Different market forms. John Beardshaw (1984).
These three cases of imperfect competition are clearly identified in the port industry
and will be a matter of study in this paper in order to identify the state of competition
at the local, regional and international level. After, depending on the state identified
the question, “where is the competition focusing on?” must be answered. The next
step is to analyze the competitors, and the final step is to construct the competitive
strategy supported by the economic, theoretical analysis and data research.
2.2 Structural Analysis of Industries
The first problem faced during the analysis of competition is to establish the intensity
that it has in a specific industry. This state of competition is the result of five basic
competitive forces, which all together are essential for the strategy formulation. The
competitive forces are threat of entry, threat of substitution, bargaining power of
buyers, bargaining power of suppliers and rivalry among current competitors5. Their
interrelation is shown in the figure below.
4 Beardshaw J. ‘Economics: a student’s guide’ (1984)5 Porter, M. ‘Competitive Strategy’ (1980). p. 3 - 33

7
Figure 3. Forces driving industrial competition (M. Porter 1980)
2.2.1 Threat of entry
New competitors in the market bring new capacity, desires to gain market share and
sometimes new resources. However, the entry depends on the barriers to entry and
the reaction of the actual competitors. The HLHr where 13,7 million containers were
handled in 19966 is not exempt of such entry barriers. The entry barriers listed below
are factors that will determine the competitive environment that new competitors will
face in the market.
Economy of scale is a barrier of entry for the container operators, in the sense that it
forces the new competitor to face the entrance in a large scale. As a consequence
new competitors have to star at the in small-scale level and fight against the cost
disadvantage. For instance, Hessenatie handled 1,190,893 cont. (1996) and Marine
Terminals only 91,548 cont. in the same period7. This means that Hessenatie can
take advantage of the economy of scale because of a big flow of cargo.
Product differentiation is related to the customer loyalty and prestige that was built
by past or actual competitive strategies such as being the first in the industry. It can
build a barrier for entry because the new players have to spend a lot in marketing,
technology and other factors. Moreover, they have to be aware of possible loses in
the beginning of the business. This threat could be avoided through the introduction
6 Containerization International Yearbook 1998. p. 8 - 127 Containerization International Yearbook 1998. p. 28 - 57
8
in a specific sector of the industry “niche”. For example, ports like Zeebrugge,
where the local cargo flow is relative low, can expand their activities to
transshipment taking advantage of the geographical location, draught and new
terminal developments.
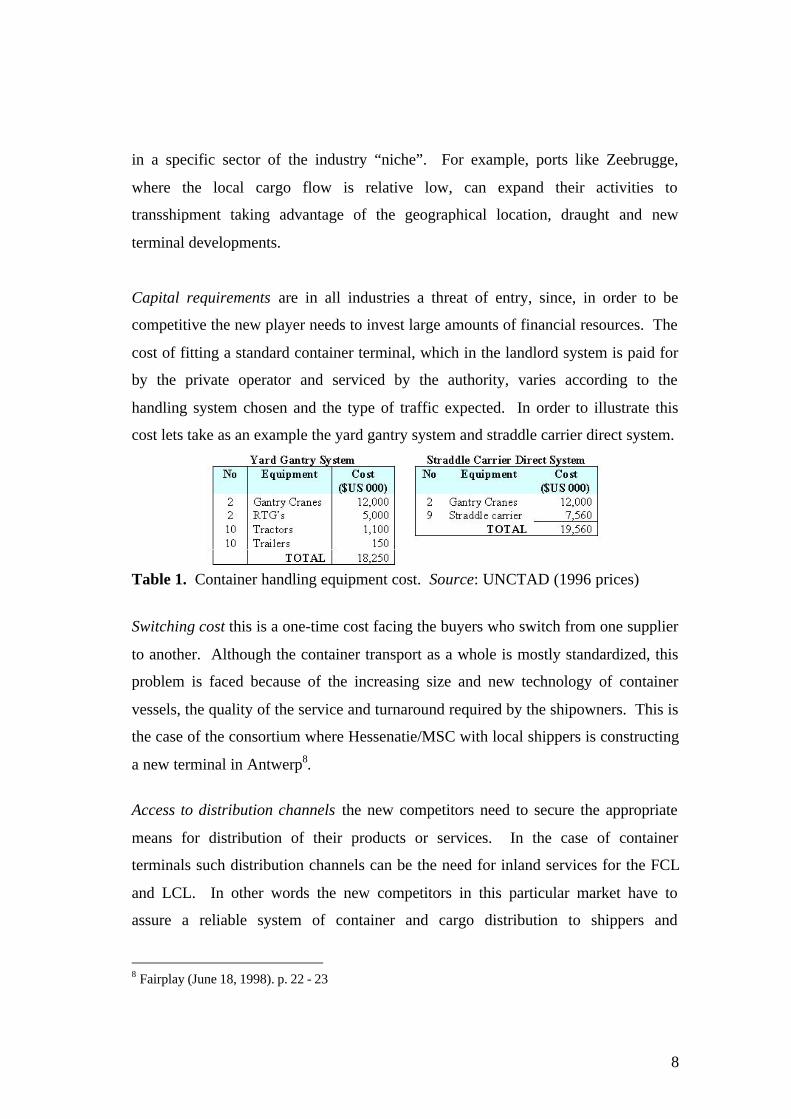
Capital requirements are in all industries a threat of entry, since, in order to be
competitive the new player needs to invest large amounts of financial resources. The
cost of fitting a standard container terminal, which in the landlord system is paid for
by the private operator and serviced by the authority, varies according to the
handling system chosen and the type of traffic expected. In order to illustrate this
cost lets take as an example the yard gantry system and straddle carrier direct system.
Table 1. Container handling equipment cost. Source: UNCTAD (1996 prices)
Switching cost this is a one-time cost facing the buyers who switch from one supplier
to another. Although the container transport as a whole is mostly standardized, this
problem is faced because of the increasing size and new technology of container
vessels, the quality of the service and turnaround required by the shipowners. This is
the case of the consortium where Hessenatie/MSC with local shippers is constructing
a new terminal in Antwerp8.
Access to distribution channels the new competitors need to secure the appropriate
means for distribution of their products or services. In the case of container
terminals such distribution channels can be the need for inland services for the FCL
and LCL. In other words the new competitors in this particular market have to
assure a reliable system of container and cargo distribution to shippers and
8 Fairplay (June 18, 1998). p. 22 - 23

9
shipowners such as by road, rail, inland waterways and sometimes air transport. For
example, the HLHr has projects such as, block trains between Sweden and Germany
/Benelux and a combined transport service between Belgium and France. Another
projects in process are inland waterway between Dorpen-Rotterdam and Lille-
Antwerp, and development of satellite information for the service Hamburg-Prague 9.
Cost disadvantage independent of scale this entry barrier is reflected in several
factors as a proprietary product technology, favorable location, government subsidies
and experience curve. For this paper, the factors that can create barriers to entry are
first favorable location that is the situation of the berth in the port, the accessibility to
inland connection from the yard and for transshipment.
The second, reflects more the advantage of the experience and leader market share
which are more profitable because of their low operational cost and can support the
acquisition of new technology, the reduction of tariffs and even to withstand a profit
reduction period. For example, the draught problems in Hamburg or the transit time
and locks in Antwerp are a cost disadvantage for operators and port authorities. On
the other hand, Zeebrugge has a cost disadvantage over Rotterdam because even
though Zeebrugge is growing very fast it has a lack share compared with Rotterdam.
Government policies is the last barrier and probably the most important barrier of
entry into the market. Governments can create regulations that make it difficult for
new competitors to enter through the imposition of labor policies and environmental
issues. This particular barrier in the EU is not applicable, because its main task is to
promote fair competition and give incentives to new players to enter the market10.
An example for exit barriers in this industry is that if an operator decides to leave the
market it can create a destabilization of the local, and perhaps regional, economy.
So, the government will try to persuade the operator to stay in the market.
9 International Shipper (Nov. 1998). p. 10 - 1210 EC “Green Paper” (1997). p. 2 - 5

10
Although, the entry barriers are
significantly important for the analysis
of the competition, the exit barriers
play a very important role since, if
both entry and exit barriers are studied
together with industry profit it will be
easy to differentiate whether the
industry is attractive for competitors. Figure 4. Barriers and profitability (M. Porter 1980)
• Scenario 1, when both barriers are low it is practically unexciting.
• Scenario 2, is the case when the port is in the process of expansion or
privatization because the port authority will give to the operator all the facilities
for entry into the market but they will impose certain conditions such as
employment conditions.
• Scenario 3, here the competition is at a good level and the risk is low, the
unsuccessful competitors can leave the market without restriction. Another
characteristic is that the market share is quite stable.
• Scenario 4, this is the most competitive one because even if unsuccessful
competitors face problems they will remain in the market fighting for an increase
in their market share.
The identification of barriers can give an idea of the situation as a whole but certainly
a more accurate analysis must be carried out for the construction of competitive
strategies. Substitution could be made for one of the most important forces in the
container terminal industry, mostly in markets like Europe.
2.2.2 Threat of substitution
Senior managers of both terminal and ports know this concept very well. For
instance, “The Banana Zone, located between London and Milan, generates more
than the half of the European sea-born trade. Moreover, all the ports in the HLHr are

11
located at only 24 hours from this area”11. So, shippers and shipowners can choose
to call any of these ports without almost no geographical advantage over the others.
2.2.3 Bargaining power of customers
Some years ago the port authorities and terminal operators were not worried at all
about this concept. However, in 1997 the port of Hamburg was threatened by this
concept when Hapag-Lloyds and members of the Grand Alliance announced to the
port authority that if they did not dredge the river they would stop calling at this port.
Moreover, in the case of the port of Gothenburg the supplier’s power was noted
when Maersk asked them to buy post-panamax gantry cranes with the promise to call
at this port12. Finally, both ports made the investment in order to satisfy the demands
of their customers which shows that the pressure imposed by liner operators over the
ports and terminals is very high and a determinant for competition.
2.2.4 Bargaining power of suppliers
Terminal operators around Europe are aware of the danger that relatively new
concepts like transhipment, hub or mother vessels can have on their market shares
since, small ports without a hinterland, with no strong harbor history and with a
comparatively small investment, are catching big shares in the container industry just
like transhipment ports. On the other hand, suppliers can start a court action against
the liners that try to leave the terminal and thus break the contract.
2.2.5 Rivalry between competitors
Rivalry is high at the local level but at the regional level it is higher in all ports in the
HLHr. At the local level in a few ports, terminal operators are trying to join forces to
be attractive, just like Le Havre is doing with their “Port Alliance”. On the other
hand, ports like Rotterdam are investing in new facilities for leasing to new terminal
operators in order to increase the internal competition, creating as a result, an
increase in the quality of services and tariff reduction. All the port authorities,
11 Francou, B. ‘Competition and complementarity in the European ports’ 1998. p. 1 - 812 PdI October 1997. p. 25 - 31

12
together with private and governmental investors, are trying to develop, expand and
attract more hinterland to their ports through Strategic Development Plans. For
instance, a recent report points out the rivalry between two German ports, where the
Bremen city government is subsidizing a restructuration of BLG. As a consequence
some businesses will move from Hamburg to Bremerhaven13.
In short, these barriers of entry in this particular area show that competition between
terminal operators is extremely high because of the easy access to substitution, the
high bargaining power of customers, the high rivalry and the decreasing bargaining
power of suppliers. So, the need for competitive strategies is becoming a rule for
playing in this market.
2.3 Generic Competitive Strategies
Following the analysis of competitors it is essential to have a clear understanding of
the generic competitive strategies that competitors can perform as their company
policy or status.
Figure 5. The three Generic Strategies. Source: Porter, M.
2.3.1 Overall cost leadership
This strategy requires aggressive construction of efficient-scale facilities, vigorous
pursuit of cost reduction from experience, tight cost and overhead control, avoiding
of marginal customers accounts, and cost minimization in areas such as research and
development, sales force and advertising. Management control and low cost
compared to other competitors are key factors for achieving overall cost leadership14.
However, quality of service, safety and other factors must not be forgotten. The
13 Fairplay. April 22, 1999. p. 29
Industrywide
ParticularSegment only
DIFFERENTIATION OVERALL COST LEADERSHIP
FOCUS
STR
ATE
GIC
TA
RG
ET
STRATEGIC ADVANTAGEUniqueness persived Low Cost Position
by the customer

13
main advantage of this strategy is that lower costs protect companies against the
bargaining power of customers. They can take advantage of economy of scale and
the lower cost gives a certain security against the threat of substitutes. On the other
hand, this strategy has some disadvantages such as, incapacity to invest in state of the
art equipment, low marketing and research and development, and difficulties to react
to high inflation rate.
2.3.2 Differentiation
The basic point of this strategy is to create something unique that will establish a
clear difference with other competitors. It can be achieved through customer service,
technology, prestige, quality, etc. Obviously this strategy does not ignore cost but it
is a secondary factor. Also, differentiation creates a great positioning in the market
opening a big difference between their competitors, creates a customer loyalty and
lower sensitivity to price, and in the same way it creates a defense against threats of
substitutes. But, the main disadvantages are the actual necessity of customers to
sacrifice loyalty by low cost, the imitation of other competitors, which is a fact in a
mature industry, and the reduced distance between competitors due to the
globalization process15.
2.3.3 Focus
Focus is a relatively new strategy in the port industry that can be exemplified by the
action of create niches or to serve a specific shipping line or a group of them. The
main advantages are that through specialization the level of improvements in this
particular traffic is bigger, the operating cost can be minimized, they will have a
certain number of captive customers and they can have better operational planning.
However, this strategy can suffer if loyalty is not assured and can be threatened by
seasonal fluctuations or and other competitors specializing in this market16.
14 UNTACD ‘Strategic Port Pricing’ April 1999. p. 16 - 1815 UNCTAD ‘Strategic Port Pricing” April 1999. p. 16 - 1816 Porter, M. ‘Competitive Strategy’ 1980. p. 38 - 39

14
In short, during a competitor analysis the company must first of all identify its own
generic strategy and the generic strategies of its competitors. They must be treated in
different way according to their strategy. The next step is to analyze the competitors
in order to understand their behavior and anticipate their moves.
2.4 Analysis of competitors
Although competition in the container terminals industry is very high, the attention to
have a system for competitor analysis is not in practice at all. To assume what the
competitors are doing? Or what will they do? Can be done through the research and a
study of their future goals, current strategy, assumptions and capabilities.
Figure 6. Components of competitors analysis (M. Porter 1980)
Actually it can be seen that most of the players in every industry are aware of the
current strategies and capabilities. However, few of them are putting attention to
future goals and assumptions that can be more important for the analysis of
competitors.
2.5 Port Industry Signals
Competition in the container terminal industry is influenced as are all markets by the
actions of competitors that announce their intentions or goals. These actions are
market signals that can be truthfully done by competitors in order to announce their
real intentions or projects or can be bluffs that are real intentions to create a little
instability or to test the retaliation capability of other players. Whether moves are in
one direction or in the other is very important for competitive analysis to understand
and be aware of the impact that such moves can have on the industry.

15
Prior announcement of moves are those made before their realization that will reflect
the intention of the competitor to initiate a new strategy even though this action
remains on paper. Prior announcements could be those that are trying to catch the
attention of other local competitors in order to create a new competitive environment
in the region. For instance, “Now Bremerhaven is in the process to guaranteeing
14m of water depth under chart datum in the navigational channel”17.
Other kinds of announcements can be those that are the result or actions after the
fact, public discussion of the industry by competitors, competitors discussion and
explanation of their own moves, competitors’ tactics relative to what they could have
done, manner in which strategic changes are initially implemented18.
In short, the knowledge and interpretation of these signals are a powerful tool for
managers because they will develop a very good feeling about the industry and the
way of playing of their competitors. However, if they put too much attention on
these signals it can cause a distraction and can damage the development of their
goals.
2.6 Competitive Moves
Competition in the port industry is particular. It has their own patterns, its own
behavior because their differences such as funding, management and labor. So,
competitive moves can be addressed to satisfy the demand, create demand, position
in the market or other motives.
2.6.1 Types of competitive moves
Following the same approach can differentiate these moves into three main types,
which at the same time can interact between them, be the consequence or result.
Firstly cooperative or nonthreatening moves are those that do not attempt against
other competitors but the contrarily, these moves have as main goal to increase or
17 Schiffer, E. (BLG), ‘Containerization International 1998’. p. 4518 Porter, M. ‘Competitive Strategy’ 1980. p. 80 - 82
16
improve the position of a particular company. However, these moves bring indirect
benefits to the local community and sometimes also to the region. They can also be
categorized into three categories19:
• Such moves that improve the company position and at the same time the position
of competitors. This is the case when a particular container terminal makes
pressures its respective Port Authority to dredge the entrance in order to receive
bigger vessels. These moves will improve the terminal competitiveness and at
the same time the whole port community will benefit from this proposal.
• Other types of moves are those that improve the company position and have an
impact only on some competitors. For instance, when a specific company
promotes the arrival of post-panamax vessels it will cause competitors to take it
into consideration but the ones in barge business will not.
• The third ones are those that only have improvements in the company such as,
offer a better productivity or new information systems for its customers.
2.6.2 Threatening moves
In a competitive environment the more common strategies are full of moves that
have the purpose to improve the position and share of a particular company through
diminishing that of the competitors. The problem that can rise from this move is the
retaliation of competitors. Such retaliation can be weak, so the move will have more
probabilities to succeed, or can be strong so that it will make it difficult to reach its
goals. The level of retaliation depends mainly on the type of management, finance
capability and company goals. These threatening moves will have as a consequence
the appearance of defensive moves that can be projected in the short or long term.
2.6.3 Defensive moves
Companies in certain stages have to defend themselves against moves made by their
competitors; the port industry is not and exception. Defensive moves are related to
retaliation but can be differentiated by way of action, timing and purpose.
19 Porter, M. ‘Competitive Strategy’ 1980. p. 91 - 100
17
Depending on the company policy in terms of competition, they have, as a rule, to
respond to each competitive move made by competitors in order to let them know
that if they are making something to improve their position as for sure a defensive
move will begin.
In brief, the framework for analysis of competitors is a key issue to assure a
successful competitive strategy. The forces that drive the competition establish the
level and the environment where the industry is competing, so is important to know
and understand in order to find the way to fight and take advantage of the forces.
Moreover, this framework proposes that it is necessary to pigeonhole each
competitor into the three generic competitive strategies: overall cost leadership,
differentiation or focus, which describes the characteristics, the approach and goals
of each competitor. Furthermore, the identification of market signals and
competitive moves, which are essential for this analysis, are based on recognizing
when a competitive strategy must begin and how to behave in a specific industry.
Finally, success in the port industry like any other business, is not only a matter of
luck or is just covering the customer’s needs. It is in the strict sense a matter of
planning, project, research, innovation and the developing of strategies. Especially
in a highly competitive environment such as the container terminal industry, the need
for a competitors intelligence system, systems for analysis of competitors and
techniques for strategy formulation, are essential needs to assure the market position.
The next chapter is an introduction to the environment where the terminal
competition is taking place, as well as how this economic area has been evolving
from the political and economic perspectives. Furthermore, it copes with the
different policies that have arisen to promote, regulate and assure the port
competition at the local, regional and international level.
18
CHAPTER 3
3 THE IMPORTANCE OF PORTS IN THE EUROPEAN UNION
The main objective of this chapter is to draw a clear picture of the importance of the
port industry in the EU and the measures taken by the EC in order to improve and
promote port competition. In the first place, the EU integration process will be
mentioned as an introduction to the environment followed by the Intra and Extra EU
trade analysis where the importance of this market is pointed out as well as the
countries where the major trade is generated. Next, the importance of ports in the
European context has been analyzed through the study of the different management
characteristics and the difficulties to develop an EPP, and the measures taken by the
EC to improve the competition in this industry. Finally, the Green Paper as a measure
to improve competitiveness is mentioned and its main points analyzed.
3.1 The European Union (EU)
The relatively new EU, which is formed by 15 sovereign countries, has an area of about
3,240,000 sq. km. where 373,220 inhabitants in19961 with a growth population rate of
0.3% from 95-96. The beginning of the process was the ECSC treaty signed in 1951
between Belgium, France, Germany, Italy, Luxembourg, and the Netherlands. The
Treaty of Rome followed in 1957, which enlarged the union to all economic activities.
After, Denmark, Ireland, and the United Kingdom joint to the union in 1972. The
accession of Greece was signed in 1979 and for Spain and Portugal in 19862.
The EU was set as the European supranational organization dedicated to increasing
economic integration and strengthening cooperation among its member states. The EU
1 OECD http//www.OECD.org. 19982 Fontaine, P. ‘Europe in ten points’, 1995. p. 4 - 6

19
was set up on November 1, 1993, when the “Maastricht Treaty”, was ratified by the
actual 12 members of the EC. In 1994 the Austria, Finland, and Sweden were admitted
to the EU. The Court of Justice serves as the final arbiter in legal matters or disputes
among EU institutions or between EU institutions and member states3.
Most recently in 1997 other countries sought EU membership including Turkey,
Cyprus, Malta, Switzerland, Latvia, Estonia, Lithuania, Bulgaria, Czech Republic,
Hungary, Poland, Romania, and Slovakia. Other potential EU applicants include
members of the EFTA. In 1991 the EC and EFTA completed an agreement to
establish the EEA, which provides a single market for goods, services, and capital.
Indeed, the integration process has been carried out with the purpose of creating a
single market in the sense that competition must be exploited by the quality of
products and services rather than currency differences, protectionism or monopolies4.
3.2 Economic growth of the E U in the International Framework
The objective of this subchapter is to point out the importance of this economy and the
implications that this growth has in the international and regional trade, and as a result
in the increase of cargo handled in ports, mainly containers. The economy of the EU
is growing and becoming more important, as well as the trade with other important
economies. Table 2 compares the development Europe with the main economies in the
world.
Table 2. Comparison of GDP growth rate. Source: EUROESTAT
3 Fontaine, P. ‘Europe in ten points’, 1995. p. 6 - 114 Fontaine, P. ‘Europe in ten points’, 1995. p. 42 - 46
-0.50.5
1.52.53.5
4.55.5
1990 1991 1992 1993 1994 1995 1996 1997 1998
gro
wth
rat
e EU
OECD
NAFTA
Japan
Oceania

20
The EU rise in growth rates has been positive since 1993 when the EU got the lowest
growth rate –0.5. However, 1995 was characterized by a drop in growth rate, the EU
achieved the major rate of 2.4 in this period which was followed by 2.6 in 1997 and
3.0 (estimated from the first three quarters) in 1998. On the other hand, if a
comparison is made with the two major countries, Japan and USA, in terms of value
the result will show the economic capacity of the EU.
Table 3. Comparison of GDP market prices. Source: EUROESTAT
Table 3 shows the trend of GDP in these countries and its positive development until
1998. However, the question now is, which member states of the EU are the ones
providing or supporting the value terms and percentages of GDP?
Table 4. Participation in GDP by Member State. Source: EUROSTAT
Germany is by far the main contributor to the EU; its contribution has been 22.8% of
the total since 1990 to 27.3% in 1998. Other main contributors are France 17.9%,
Italy 148% and the UK 13.5% in 1998. It also reflects the level of industrialization
and as a result the amount of cargo moving from/to these countries, as is analyzed
later.
0%
20%
40%
60%
80%
100%
1990 1991 1992 1993 1994 1995 1996 1997 1998
D B F I NL UK Others
0
500
1000
1500
2000
1990 1991 1992 1993 1994 1995 1996 1997 1998
1000
mill
ion
EC
U
D B F I NL UK Other (11)
2000
4000
6000
8000
1990 1991 1992 1993 1994 1995 1996 1997 1998
1000
mill
ion
EC
U EU
USA
Japan

21
3.2.1 External and Internal trade of the EU
Although, the above tables give a good idea of the economic stability of the EU, the
purpose of this paper is to have a look into the international and regional trade which
have a direct impact on ports competing to catch the cargo flow generated by
intra/extra EU. The tables below analyze the importance of the EU in world trade.
Table 5. Trade participation in the world. Table 6. Growth in trade in volume. (Source: WTO) (Source: WTO)
The EU produced in 1997 38% of merchandised trade in value; export activities total
value was USD 825.6 billion 19.7% (rank 1) and import USD 787.0 billion 18.1%
(rank 2). The major partners in the total trade (Impo-Expo) as is shown in table below
were: NAFTA, EFTA and DAE.
Table 7. EU exports 1997. Table 8. EU imports 1997.
Tables 7 and 8 are very important since the main purpose of this paper is to analyze
the importance of ports in the economy and to point out the huge market that can be
achieved by the port authorities or operators and from which the competition is rising.
12.8
9.99.1
8.5
8.6
9.1
5.2
4.5
10.3
22.0
NAFTAEFTADAEO.A.Med C.CEECJapanL.A.CISOthers
20.9
11.6
11.2
11.611.6
11.3
5.7
5.7
4.0 6.4
38%
19%
7%
30%
6%
EUNAFTA
Japan Others
Latin America

22
From the main partners NAFTA, DAE, OA, MC, Japan and LA are the most important
because they create seaborne trade and cargo traffic from/to European ports. Next, the
table below shows the participation by EU Member States in Extra-EU trade.
Table 9. Extra-EU trade by State. Eurostat. Table 10. Participation in Extra-EU trade.
Such participation is important because it points out the area where traffic is generated,
competition for its distribution is taking place and port authorities are targeting its
strategies. The tables show clearly the great importance of countries like Germany,
UK, France Italy and Benelux countries that from 1990 to 1997 contributed to the
Extra-EU trade 82%. Also, Intra-EU trade plays a decisive role in ports throughput.
Table 11. Intra-EU trade in value. Table 12. State participation in Intra-EU.(Source: Eurostat) (Source: Eurostat)
The intra-EU trade has in Germany as the main trader with 26% participation followed
by France and the Benelux countries. It contributes to point out the importance of this
region. Furthermore, the combination of both Intra and Extra trade by Member State
and its participation points out the importance of ports in this region for assuring the
distribution of the merchandises for the intra and extra EU trade.
20000
120000
220000
320000
1990 1991 1992 1993 1994 1995 1996 1997
billi
on E
CU
B/L D E F I NL UK O7
0%
20%
40%
60%
80%
100%
1990 1991 1992 1993 1994 1995 1996 1997
B/L D E F I NL UK O7
0%
20%
40%
60%
80%
100%
1990 1991 1992 1993 1994 1995 1996 1997
B/L D E F I NL UK O7
20000
120000
220000
320000
420000
1990 1991 1992 1993 1994 1995 1996 1997
mill
ion
EC
U
B/L D E F I NL UK O-7
23
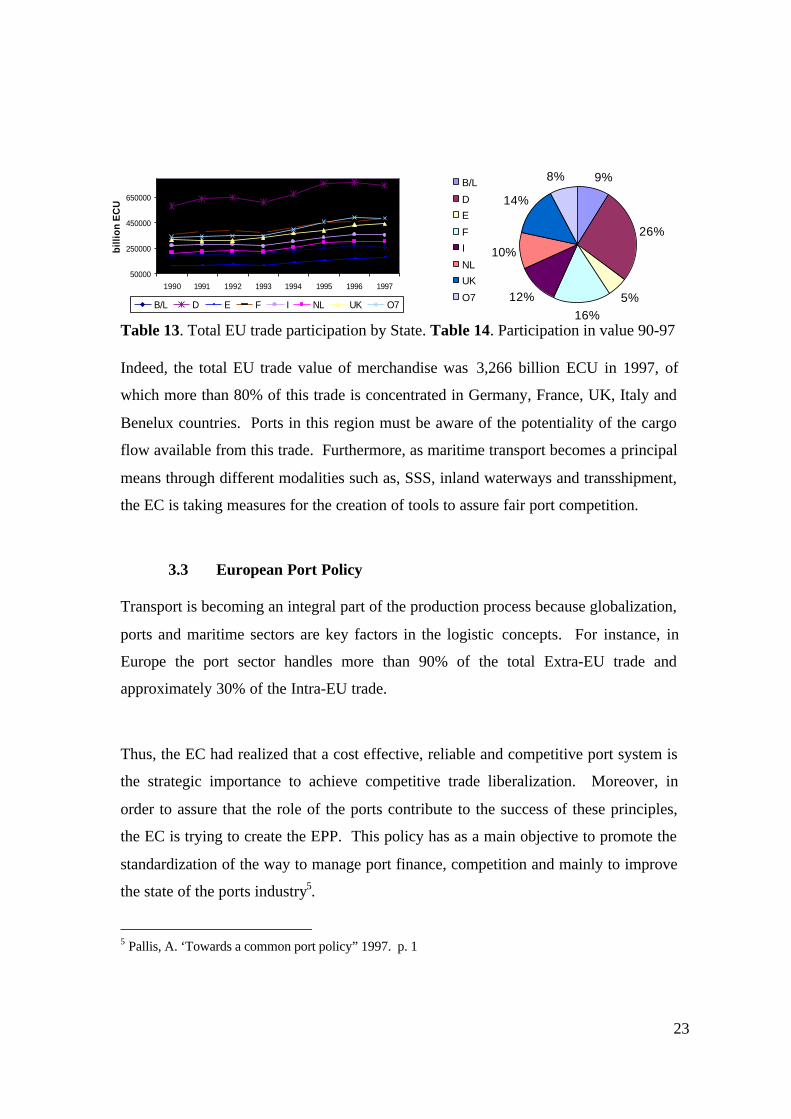
Table 13. Total EU trade participation by State. Table 14. Participation in value 90-97
Indeed, the total EU trade value of merchandise was 3,266 billion ECU in 1997, of
which more than 80% of this trade is concentrated in Germany, France, UK, Italy and
Benelux countries. Ports in this region must be aware of the potentiality of the cargo
flow available from this trade. Furthermore, as maritime transport becomes a principal
means through different modalities such as, SSS, inland waterways and transshipment,
the EC is taking measures for the creation of tools to assure fair port competition.
3.3 European Port Policy
Transport is becoming an integral part of the production process because globalization,
ports and maritime sectors are key factors in the logistic concepts. For instance, in
Europe the port sector handles more than 90% of the total Extra-EU trade and
approximately 30% of the Intra-EU trade.
Thus, the EC had realized that a cost effective, reliable and competitive port system is
the strategic importance to achieve competitive trade liberalization. Moreover, in
order to assure that the role of the ports contribute to the success of these principles,
the EC is trying to create the EPP. This policy has as a main objective to promote the
standardization of the way to manage port finance, competition and mainly to improve
the state of the ports industry5.
5 Pallis, A. ‘Towards a common port policy” 1997. p. 1
50000
250000
450000
650000
1990 1991 1992 1993 1994 1995 1996 1997
billi
on E
CU
B/L D E F I NL UK O7
9%
26%
5%16%
12%
10%
14%
8%B/L
D
E
F
I
NL
UK
O7

24
3.3.1 The four axes of the EU Port Policy
The EU proposal can be condensed into four main axes. First, improvement and
modernization of ports’ infrastructure and their inclusion in the Trans-European
transport network. Next, creation of a competitive playing field. Then, advance of
research and development (R&D) for ports, and four, support of setting up an
enhanced dialogue between all partners, to address relevant problems. The axes are
represented in the figure below.
Figure 7. EU Port Policy axes. Source MARIT. POL. MGMT. (1998)
The most successful of the axes is R&D, where the EU has worked extensively. Its
main projects are the optimization in procedures of berthing/unberthing and
loading/discharging, and development of port equipment and IT. In other words, R&D
is trying to reduce turn around times and improve logistic systems. Formalizing co-
operation is the axe where port authorities, port users and service providers have
agreed to set a panel such as ESPO where they can discuss problems related to port
activities. Furthermore, the regional level panel also provide experts who will identify
problems and proposing solutions.
Finally, in the case of competitiveness and finance of infrastructure its bases are
contained in the scope of the “Green Paper” which is discussed below. However, one
of the first difficulties that the EU is facing in order to establish the EPP is the port
difference in size, geographical location, management, operation and employment.
25
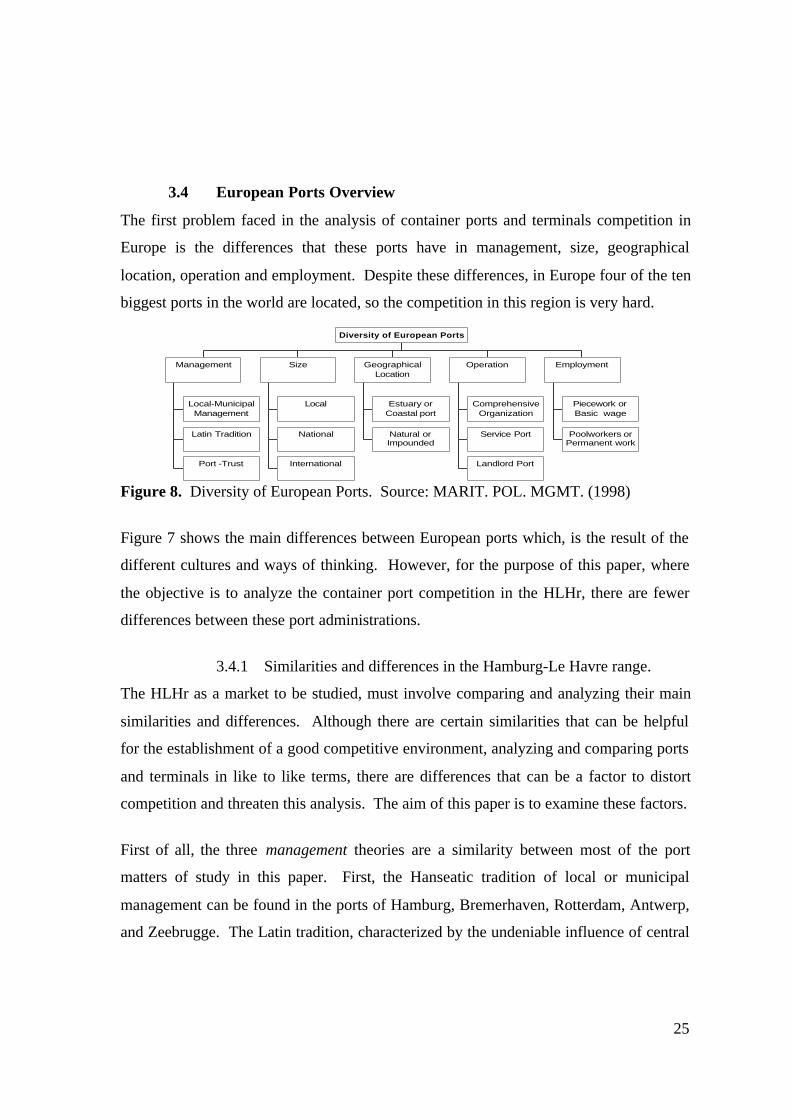
3.4 European Ports Overview
The first problem faced in the analysis of container ports and terminals competition in
Europe is the differences that these ports have in management, size, geographical
location, operation and employment. Despite these differences, in Europe four of the ten
biggest ports in the world are located, so the competition in this region is very hard.
Figure 8. Diversity of European Ports. Source: MARIT. POL. MGMT. (1998)
Figure 7 shows the main differences between European ports which, is the result of the
different cultures and ways of thinking. However, for the purpose of this paper, where
the objective is to analyze the container port competition in the HLHr, there are fewer
differences between these port administrations.
3.4.1 Similarities and differences in the Hamburg-Le Havre range.
The HLHr as a market to be studied, must involve comparing and analyzing their main
similarities and differences. Although there are certain similarities that can be helpful
for the establishment of a good competitive environment, analyzing and comparing ports
and terminals in like to like terms, there are differences that can be a factor to distort
competition and threaten this analysis. The aim of this paper is to examine these factors.
First of all, the three management theories are a similarity between most of the port
matters of study in this paper. First, the Hanseatic tradition of local or municipal
management can be found in the ports of Hamburg, Bremerhaven, Rotterdam, Antwerp,
and Zeebrugge. The Latin tradition, characterized by the undeniable influence of central
Local-MunicipalManagement
Latin Tradition
Port -Trust
Management
Local
National
International
Size
Estuary orCoastal port
Natural orImpounded
GeographicalLocation
ComprehensiveOrganization
Service Port
Landlord Port
Operation
Piecework orBasic wage
Poolworkers orPermanent work
Employment
Diversity of European Ports

26
government, can be found in Le Havre Port. The relevance of this difference is that in
the first one the management is done by a completely autonomous body with a pure
commercial objective creating internal competition and a customer oriented vision.
However, in the second the management is done by the Port Authority, which is part of
the central government creating a source of monopoly and employment base oriented.
So, the competition can be distorted when two ports with difference management
traditions are to be compared. However, Le Havre is starting to change their
management, looking to increase their competitiveness locally and internationally.
Next, the size of the port can be local, national or international. There is a very
important similarity between these ports because all of them are international; they are
serving the same big hinterland and are the gate to Europe including Scandinavia, the
Baltic States and some Arabic countries. All ports in this range receive cargo from all
over the world and serve, more or less the same hinterland.
Finally, employment is a important factor because in Europe two dock labor practices
can be found, piecework or basic wage and pool worker or permanent employment.
There is a similarity between these ports because all of them are working in terms of
pool worker or permanent employment. They have chosen this practice because they
realize that is better in the long run to have very well trained and skilled people even if
they are more expensive in the short run.
On the other hand, the main differences that can be found are the way to operate and
geographical location. First, in Europe there are three ways to operate ports; landlord,
service and tool. Only one of the ports subject to study is a formal service port the rest
are working in the modality of landlord port. This difference is one of the more
controversial topics to study when competition is discussed because the sources of
finance projects, mainly superstructure, are quite different and polemic.

27
Basically, landlord ports do not invest in superstructure but service ports do. However,
recent events are changing this concept, for instance the port of Rotterdam has been for
years a very well established landlord port. Nevertheless, Royal Nedlloyds, Internatio
Muller, Royal Pakhoed and NS Group, invited at the end of 1998 to HPH to participate
in a consortium of new owners for ECT. This action threatened the European pride so
the final news is that HPH will allocate only 50% of the shares, the Port of Rotterdam
will keep 30% and the rest 20% other local investors6. In short, the participation of the
Landlord on superstructure investment is a new way of management.
Finally, geographical location. In other words, if the port is estuary or coastal, a natural
harbor or impounded dock system. This factor carries one of the main differences
between ports because it gives a comparative advantage in terms of maneuvering time to
ports like Rotterdam, Zeebrugge and Le Havre. It is a disadvantage to ports like
Hamburg, Bremrhaven and Antwerp where the maneuvering time is higher because they
are relatively far from sea. Moreover, Antwerp has locks at the entrance, thus in order to
increase competitiveness, they are developing container terminals out of the lock side.
Port Management Size Employment Operation LocationHamburg Hanseatic International Permanent Landlord RiverBremerhaven Hanseatic International Permanent Landlord RiverRotterdam Hanseatic International Permanent Landlord CoastalAntwerp Hanseatic International Permanent Landlord River (locks)Zeebrugge Hanseatic International Permanent Landlord CoastalLe Havre Latin Tradition International Poolworker Service Coastal
Figure 9. Similarities and differences in the Hamburg-Le Havre Range.
In short, the similarities and differences together with industrialization, hinterland
connections, and environment policies, are the main factors that will be the base of the
success of some ports and a threat for others. These diversities are in fact one of
motives why the EC has launched the initiative that the EC Law should apply to ports.
Through this law, the commission intends to assure fair competition and at the same
time improve the quality of this competition in the port sector.
6 Containerization International ‘Global Players’ March 1999. p. 97 - 101
28
3.5 The EC Competition Law
Many port operators have seen the opportunity to join forces to take advantage of
pooled resources, others are applying competitive strategies to protect their position in
the market. The EC supports the increase of competition as a catalyst to strengthen the
European industry. However, competition must be controlled to ensure the health of
the market and mainly the improvement of the level of the players. In this sense, there
are two basic rules for competition, which are laid out in the Treaty of Rome.
Article 85:
“Prohibits agreements and activities between two or more enterprises that could lead
to a prevention, restriction or distortion of competition affecting trade between
member states. This is deemed to be incompatible with the goals of the Common
Market. Examples of this are price-fixing and agreements on market shares”7.
Article 86:
“Is aimed at the activities of monopolies and other powerful entities and prohibits
them from abusing their dominant position in the market. The combination of an
already dominant enterprise with another in order to eliminate competition in a
particular market in itself could constitute abusive exploitation of dominance.
Examples of these types of behavior include the charging of unfair prices (to high or to
low) and refusal to sell to a distributor for no objective reasons”8.
Under certain circumstances stated in Article 85-3i of the Treaty of Rome the EC is
authorized not to apply these rules. These exemptions are, “block exemptions” or
“group exemptions” which are those agreements that contribute to improve the
distribution of goods and as a result the final consumers gets fair benefits.
7 Korah, V. ‘EC Competiton Law and Practice’ 1994. p. 588 Korah, V. ‘EC Competiton Law and Practice’ 1994. p. 59

29
A recent example show how competitors in the port market can, under the umbrella of
this new EC Law, complains to assure fair competition. The scenario is the port of
Antwerp where Katoen Natie filed complaints before the EC and the Belgium court
against the consortium MSC/Hessenatie that won the concession for the construction
of a third container terminal in Antwerp. Katoen Natie said that it would bring unfair
competition within the port because Hessenatie is already the biggest container
operator in the port and MSC is the major container line that calls at the port9.
However despite the results of the trial the importance is that there is a policy which
regulate the competition and where a competitor can based its claims.
The application of the Competition Law (Articles 85, 86), is complementary to the
Green Paper where the improvement of port competition, as well as the way to
increase the quality of this competition, is also focused in the sources of port finance.
3.6 The Green Paper
Europe's trade competitiveness in the global economy depends in many ways on a cost
effective maritime transport system. In this sense, the EU port sector is essential to the
economy since they handle 90% of the extra-EU trade. Thus, the “Green Paper” on
seaports and maritime infrastructure was simply inevitable. However, this paper, in fact,
was the consequence of two main developments that were well under way.
Firstly, in recent years the Commission’s transport policy has increasingly moved from
focusing on individual modes of transport to a strategy which emphasizes the need to
develop a more balanced and integrated transport system that can provide sustainable
mobility in the changing conditions of the next decades. Secondly, the completion of
the internal market, as well as the ongoing development of the inland transport networks
9 Nigel, T. ‘Lloyds List’ May 5, 1999. p. 2 - 3

30
across Europe, has significantly intensified competition between ports 10. As a result,
ports in different Member States are now competing for the same trade, more than ever
before, while an increasing trend of commercialization and participation of the private
sector in port operations and investments has become evident in the Union.
This evolution has raised the question of the relevance and the desirability of a more
coordinated approach to port development at the European level to properly emphasize
the crucial role of ports in the efficiency of the TETN to foster conditions in which ports
compete on sound commercial grounds.
The Green Paper covers three big areas which have the aim to develop a set of coherent
policies on individual port issues in order to help to maximize the potential of ports and
the ports contribution to European and worldwide transport systems 11.
Ø Firstly, the need for various initiatives to improve port efficiency including better
procedures, implementation of new technology, and fostering further co-operation in
and between ports.
Ø Secondly, actions to improve infrastructure within and around ports in order to
integrate ports into multimodal networks and provide adequate accessibility to
peripheral areas.
Ø Finally, the need to ensure that the Community’s responsibilities under the Treaty for
providing free and fair competition is being met in the port sector.
The EC considers waterborne transport to be the central effort to promote free
movement, competitiveness and “sustainable mobility” both within the EU single market
and, more widely, in our relationships with the rest of the world. In this sense, the Green
Paper has, as is mentioned above, the need to establish equitable competitive conditions,
the so-called "level playing field", between and within European ports.
10 EC ‘Green Paper’ 1997. p. 8 - 2211 EC ‘Green Paper’ 1997.

31
The principle of free and fair competition clearly poses particular challenges in the case
of the financing and charging of port and maritime infrastructure. Different levels of
government and municipal involvement mean that sometimes it is not clear enough
whether the cost of investments in port and maritime infrastructure is in practice, passed
on to the users through port charges.
Therefore, the Green Paper in considerations of equity suggests that “there might be a
case for introducing a community framework to ensure that port infrastructure is priced
in such a way that in the future, users bear the real costs of the port services and facilities
where their services are being carried out” 12.
In short, the basic principles of the Green Paper is to provide fair competition between
and within ports, ensure no discrimination between users and secure transparency of port
accounts. However, the issue of distortion of competition should be addressed by the
development of a flexible framework for port charging, not by some major and general
revision of State Aid rules on infrastructure investment. Another area where fair
competition has to be promoted is in port services such as cargo handling, pilotage,
towing and mooring, which make essential contributions to port safety and efficiency.
Indeed, the European Union has found that ports are an essential in the logistic
transport chain. Furthermore, the EU has realized that extra and intra trade cannot be
completely successful without a completely reliable, efficient, economic and
competitive port system. So, increased competition between ports and intra port
competition through motivation of cooperation, research and development, a policy to
regulate port finance as well as to balance the use of subsidies from local, national or
cohesion funds is the real milestone.
12 Port Conference (Barcelona, May 7, 1998)

32
However, there must be parameters and regulations that clarify the rules of the game,
to drive the competitors behavior and make the consumers aware of the measures and
regulations in this industry.
This is the case of the HLHr where the competition, as is analyzed in the following
chapter, is improving the quality of the services, the efficiency of the operators, the
reliability of the ports, and other economic and commercial factors. In addition,
shipowners and shippers’ requirements are increasing, such requirements are changing
the concept of the port itself. Indeed, port authorities and port operators have to start
to implement competitive strategies covering the customer’s requirements and the new
concepts that the market is demanding.

33
CHAPTER 4
4 CONTAINER COMPETITION IN EUROPE
The importance of containerization in the world is growing very fast because of the
different characteristics that help this modality improve and promote world trade.
Containerization is straight linked to intermodal transport, both concepts add to
international trade reliability, speed and commercial feasibility.
Container terminals are of crucial importance in this phenomenon, because here is
the shackle that makes work or fail the logistic chain. Moreover, the efficiency,
reliability and economy of this part of the logistic chain brings comparative
advantages to shipping lines and shippers who can offer a better service to their
customers.
The present chapter analyzes first, the container development in Europe and the size
of the container market where the analysis is taking place. Next, the traffic growth
and its relation with other macro economic indicators as well as a forecast of the
traffic for the next 10 years. Third, a study of competition in the HLHr is carried out
using the economic concepts, and the competitive analysis is applied as was
described in chapter 2. Finally, the international trends in this industry and the
customer requirements are investigated.
4.1 Container Development in Europe
The economic boom of Europe has had a strong repercussion since the beginnings of
containerization. Furthermore, the geographical location, the river system that serves
the central part of Europe and the state as island of the UK have served as a catalyst
to develop the shipping industry. However, with the establishment of commercial
agreements with North America and Asian countries, mainly Japan, the traffic by sea
has grown very fast in the last decade.

34
Europe has developed multimodal transport better than any other economic region.
Here advantage is being taken of the inland waterway system, the efficient rail
system and the high road standards. In addition, Europe is promoting the use of
containers as a transport modality to improve its economy.
Table 15. World Container Traffic. Source: Container International YearBook 1998
Even though containerization is very high in Asia, the increase was only 53% from
1990 to 1997. In the same period North America and Europe achieved a growth
higher than the mean, North America 79% and Europe 72%.
Table 16. Europe in World Container Traffic. Source: Container. International
Europe container traffic has been always nearly a quarter of the total traffic.
Although, Asian countries are the most developed in containerization, Europe has
achieved a higher growth, especially in the last four years, as Table 17 show.
Container Traffic Growth (in percentage)
1991 1992 1993 1994 1995 1996 1997Europe 5.5 6.1 6.3 8.9 7.5 7.0 11.7World 9.4 9.9 10.0 13.3 5.2 9.1 8.6Rest 10.8 11.1 11.2 14.7 4.6 9.8 7.7
Table 17. Container Traffic growth in %. (Source: Containerization International)
Containerization in Europe has had a constant growth following the tendency of the
world container traffic until 1994. As a result of the Asian crisis the growth had a
drop of 8.1 points from 13.3% to 5.2%. However, the drop in containerization in
1991 1992 1993 1994 1995 1996 19974.0
7.0
10.0
13.0
0
50,000
100,000
150,000
Th
ou
san
d T
EU
's
1990 1991 1992 1993 1994 1995 1996 1997
Europe
Rest of the world
25% 24% 23%23%
22% 23%22% 23%
0
20,000
40,000
60,000
80,000
1990 1991 1992 1993 1994 1995 1996 1997
Thou
sand
TE
U's
AMERICA
ASIA
EUROPA
Africa/Oceania
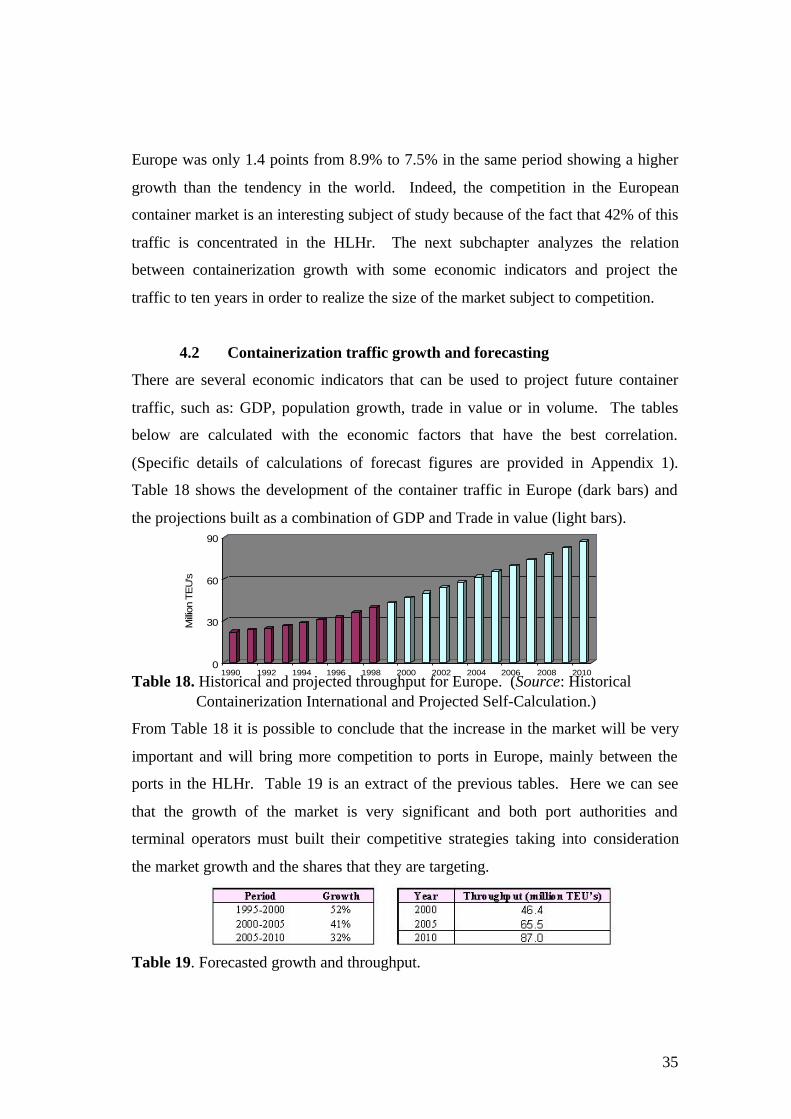
35
Europe was only 1.4 points from 8.9% to 7.5% in the same period showing a higher
growth than the tendency in the world. Indeed, the competition in the European
container market is an interesting subject of study because of the fact that 42% of this
traffic is concentrated in the HLHr. The next subchapter analyzes the relation
between containerization growth with some economic indicators and project the
traffic to ten years in order to realize the size of the market subject to competition.
4.2 Containerization traffic growth and forecasting
There are several economic indicators that can be used to project future container
traffic, such as: GDP, population growth, trade in value or in volume. The tables
below are calculated with the economic factors that have the best correlation.
(Specific details of calculations of forecast figures are provided in Appendix 1).
Table 18 shows the development of the container traffic in Europe (dark bars) and
the projections built as a combination of GDP and Trade in value (light bars).
Table 18. Historical and projected throughput for Europe. (Source: Historical Containerization International and Projected Self-Calculation.)
From Table 18 it is possible to conclude that the increase in the market will be very
important and will bring more competition to ports in Europe, mainly between the
ports in the HLHr. Table 19 is an extract of the previous tables. Here we can see
that the growth of the market is very significant and both port authorities and
terminal operators must built their competitive strategies taking into consideration
the market growth and the shares that they are targeting.
Table 19. Forecasted growth and throughput.
0
30
60
90
Milli
on T
EU
's
1990 1992 1994 1996 1998 2000 2002 2004 2006 2008 2010

36
4.3 The competition in the Hamburg – Le Havre range
Figure 10. Hamburg-Le Havre range
This range is very important in the
container industry for the big amount of
containers handled here; however, it is
important to know: which ports are
located in such range? why are they so
important? and what is the Hamburg-Le
Havre participation in the European
container market?
The ports of Hamburg, Bremerhaven, Rotterdam, Antwerp, Zeebrugge and Le Havre
form the range, are all located in North Europe near the English Channel and the
North Sea. The importance of these ports comes from the hinterland that they are
serving and for which they are competing. This hinterland is composed of the
industrial zones known as “the banana shape” and Central Europe. These economic
regions produce more than three-quarters of the total European sea-born trade1. The
main cities included in these industrial and economic zones are:
1 Francou, B. ‘Competition and complementarity in the European ports’ 1998. p. 1 - 8
a) Berlin
b) London
c) Brussels
d) Prague
e) Leipzig
f) Amsterdam
g) Dusseldorf
h) Paris
i) Frankfurt
j) Zurich
k) Munich
l) Milan
m) Liens
n) Vienna
o) Budapest
p) Others
However, the participation of these ports in the total throughput of Europe is one of
the most relevant issues for its consideration. The Table 20 shows the development
of container traffic in the range compare with the European traffic and the
forecasting of this participation in the next 10 years. Moreover, it is important to
mention that in Europe there are more or less 300 ports in total and the HLHr for the
purpose of this paper is formed by six ports.

37
Table 20. Participation of the HLH range in Europe. Source: Containerization International (Historical data) and projections (Self-Calculated).
Therefore, in 2005 the participation will be 25.4 million TEU’s and in 2010 the
projection shows an increase to 33.0 million TEU’s. The increase of throughput will
bring a fear of competition into the range. Predicting the future is in fact impossible.
However, the purpose of this paper is to create a possible scenario where competitive
strategy can be built upon. Furthermore, it would be an interesting project to
calculate the position of the ports in relation with the traffic in the future.
Table 21. Historical and projectedport participation in percentage on theHamburg-Le Havre range.
Table 22. Historical and projectedport participation in throughput on theHamburg-Le Havre range.
The tendency projected, taken as a base over the last ten years, produces as a result
that Rotterdam and Antwerp will grow by 6%, based on their transshipments and
hinterland capabilities. Although Hamburg has a steady participation in percentage,
maybe because of its draft problems, its traffic will have a substantial increase as
table 9 shows because of recent developments in port capacity.
On the other hand, Le Havre and Zeebrugge will have a constant percentage of
participation in the range despite its smooth increase in traffic. This can be explained
as the result of their hinterland interdependence and lack of inland connections.
0.0
20.0
40.0
60.0
80.0
100.0
1991 1992 1993 1994 1995 1996 1997 1998 1999 2000 2001 2002 2003 2004 2005 2006 2007 2008 2009 2010
Mill
ion
TE
U's
Hamburg-Le Havre
Europe
0
10,000,000
20,000,000
30,000,000
40,000,000
1991 1995 2000 2005 20100%
50%
100%
1991 1995 2000 2005 2010
Hamburg Bremen Rotterdam Antwerp Zeebrugee Le Havre

38
Finally, Bremerhaven presents a loss of participation in the range but they have a
small increase in throughput. Indeed, this participation in percentage and throughput
are based on the tendency. The next subchapters will deal with recent developments
and the competitor assumptions and capabilities.
4.3.1 Type of port competition in the range
Competitive strategies must be built according the type of market competition.
Strategies tend to differ if there is monopoly, oligopoly, monopolistic competition or
perfect competition in the sense that the mission, objectives, tasks and market
approach will be completely different. The type of competition that is being carried
out in the HLHr is graphed in the tables below, as well as projected in following the
growth traffic trend.
Table 23. Concentration measured by total traffic (TEU’s).
The tables above represent the distribution of the total traffic between the six
container ports in the range. The “y” axis is the throughput and the “x” axis
represents the ports. From these graphs we can conclude that, even though there
were few competitors in 1991 two ports had control of 59% of the container traffic,
Rotterdam (1) and Hamburg (2). Antwerp (3), Bremen (4) and Le Havre (5) were
sharing almost the same percentage except Zeebrugge (6), which only had 2%. So,
at that time the market imperfections draw a kind of duopoly.
However, competition in 1995 starts to smoothly change because other competitors
start to increase their market participation, getting closer to the second and as a result
Competition 90
0
1,000
2,000
3,000
4,000
1 2 3 4 5 6
Competition 95
0
1,000
2,000
3,000
4,000
5,000
1 2 3 4 5 6
Competition 00
0
2,000
4,000
6,000
1 2 3 4 5 6
Competition 05
0
2,500
5,000
7,500
10,000
1 2 3 4 5 6
Competition 10
0
3,000
6,000
9,000
12,000
1 2 3 4 5 6

39
the competition rises and 50% of the competitors had 77% of the total traffic. This
new market distribution, where Rotterdam, Hamburg and Antwerp have 80% of the
total traffic, remains in 1998 and will continue until 2000. After the projected traffic
for 2005, Antwerp will overtake Hamburg and the distance will be bigger in favor of
Antwerp. Therefore, the market is working in imperfect competition that can fit into
the definition of “Oligopolistic Competition” (Chapter 2).
Indeed, to have an idea of the market development and behavior it is as essential to
know the type of market competition in which the players are competing. However,
the scenario is incomplete if an analysis of strengths and weaknesses of the
competitor is not carried out.
4.4 Competitors Analysis
Competitive strategy, as well as strategic planning, must be built according to the
strengths of the port or terminal that can be used as comparative advantages in the
race to overtake the competition. Moreover, the strategy must take into conside-
ration the weaknesses, which can mean high comparative disadvantages over some
competitors but a small disadvantage over others. Indeed, competitive strategy has
to develop thinking in the whole market and in the individual competitors.
Therefore, in order to figure out the sources of competitive advantage or
disadvantage of different ports in the market subject of the study, this paper suggests
the use of seven factors. These seven factors2 listed below, are critical for port and
terminal customers at the time of choosing port of call.
Location; this factor is related to the geographical location of the ports in relation to
main sailing routes and to main industrial zones. So, in this case the distance to
sailing routes was measured from the fairway to the breakwater. In the case of
distance to industrial zones the average distance to 15 cities was taken (Appendix II)
located in the “The Banana Shape” and Central Europe.
2 Shuo, M. ‘Port Comparison’ 1999.

40
Nautical Constraints; for this factor draft, number of pilots and locks are considered.
Draft is mainly a constraint on ship maneuverability and speed, and vessels with
draught bigger than the lower draft will have to wait in some cases for the tide.
Number of pilots used is an economic and nautical constraint because vessels have to
reduce speed despite new techniques when pilots are boarding. Locks are important
to take into consideration because they consume considerable maneuvering time.
Ship Facilities; here the number of container gantry cranes available (panamax and
post-panamax), and the total of dedicated container berth length considered. Both,
the number of panamax or post-panamax will determine the size and quantity of
vessels that can be served at the same time, as well determine the level of investment
needed to retaliate to further competitive moves.
Cargo Services; The main feature taken into consideration for this factor is the total
area designated for warehousing where cargo can be stuffed, stripped or processed.
The importance of this factor comes from the fact that shippers will prefer to have
different logistic alternatives for their cargo flows.
Value Added; this concept points out the contribution of port activities to the value
per tonne to the goods handled. The bigger the value added per tonne the more
attractive the port is for shippers and cargo owners.
Distribution Cost; this factor is related to the transport cost from the port to the final
destination. In this case a study carried out by P&O Nedlloyds was taken as an
example. This study reflects the cost of distribution to 8 different cities in North,
Central and South Europe.
Port Cost; this item is the result of the combination of ship cost and average
container cost. The ship cost per call was made for a model vessel of 4500 TEU’s
and the port cost includes pilotage, mooring, towage and port dues. The case of the
average cost per container was also extracted from P&O Nedlloyds where they
combined the ship cost per call and the number of containers deployed in each port.
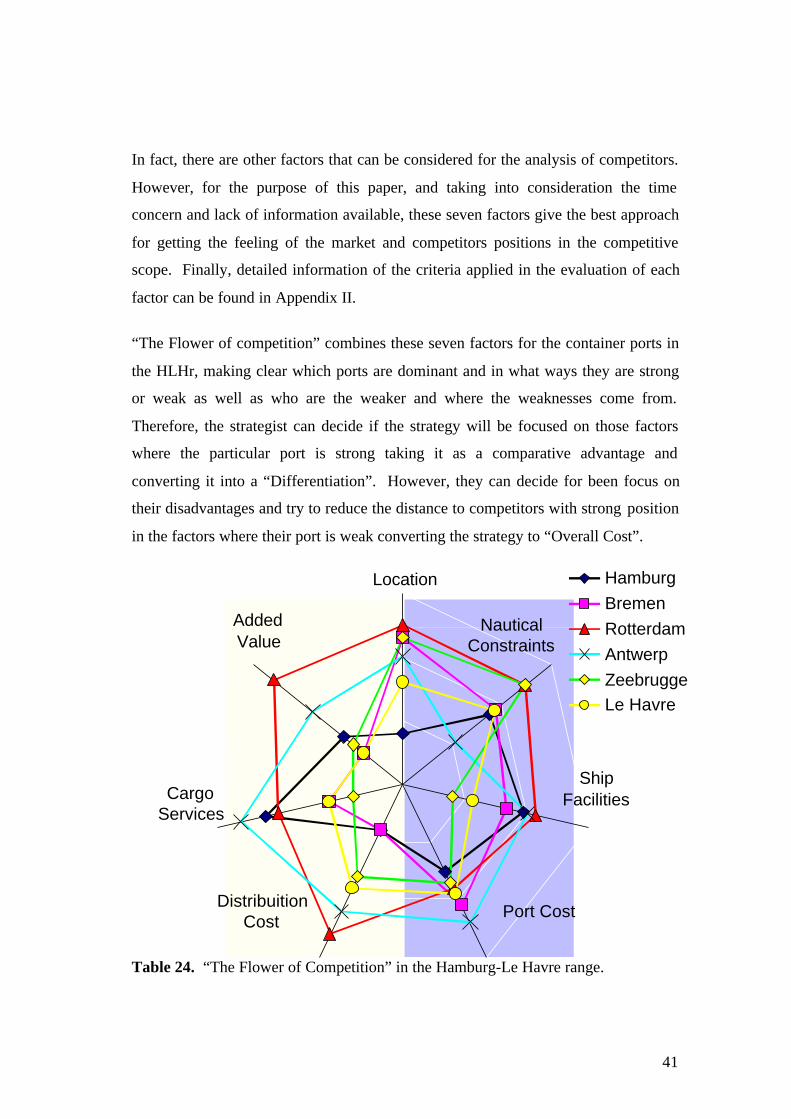
41
In fact, there are other factors that can be considered for the analysis of competitors.
However, for the purpose of this paper, and taking into consideration the time
concern and lack of information available, these seven factors give the best approach
for getting the feeling of the market and competitors positions in the competitive
scope. Finally, detailed information of the criteria applied in the evaluation of each
factor can be found in Appendix II.
“The Flower of competition” combines these seven factors for the container ports in
the HLHr, making clear which ports are dominant and in what ways they are strong
or weak as well as who are the weaker and where the weaknesses come from.
Therefore, the strategist can decide if the strategy will be focused on those factors
where the particular port is strong taking it as a comparative advantage and
converting it into a “Differentiation”. However, they can decide for been focus on
their disadvantages and try to reduce the distance to competitors with strong position
in the factors where their port is weak converting the strategy to “Overall Cost”.
Table 24. “The Flower of Competition” in the Hamburg-Le Havre range.
HamburgBremenRotterdamAntwerpZeebruggeLe Havre
Location
NauticalConstraints
ShipFacilities
Port CostDistribuitionCost
CargoServices
AddedValue

42
If the “Flower” is divided into two parts where the “right” part is the factors related
to quality of services to ships and the left is related to quality of services to cargo, it
is possible to see that the distance between port in each factor is smaller on the right
than on the left. Thus, this means that the competition for service to ships is higher
than cargo and the tendency in the range is more ship rather than cargo oriented.
The graph shows a clear supremacy in the container market of Rotterdam over the
other competitors. Rotterdam gets 8.5 points on average and is the leader in five of
the seven factors analyzed. Antwerp is just 1.5 points behind Rotterdam in the total
average and has the leadership in the two factors remaining.
On the other hand the ports with the least comparative advantages were Hamburg
and Le Havre, getting 4.3 and 4.4 respectively. Although the difference between
Hamburg and Le Havre with Zeebrugge and Bremerhaven is not too big, the
difference with the two leaders is quite worrying because it can create a kind of
duopolistic competition and because, in order to compete with the two leaders, the
other four have to invest a lot in technology or other elements as discussed later.
This assumption is reinforced by Table 23 and the conclusions drawn from it.
Table 25. Competitive ranking.
Indeed, both tables (10 and 11) give a
main conclusion that the tendency of
the market is to have only two or three
ports as a hub for this region and the
reminded will be focused on specific
container traffics.
Furthermore, the same analysis can be carried out in each port for the local
competition. However, this intra-port study requires a more local assessment in
terms of customer loyalty and relationship, marketing tools used and the sales force,
and mainly internal agreements or contracts. This market becomes the subject of a
more in-depth study which because of the time concern and lack of information
available will not be a matter of study in this paper. However, some examples and
special situations can be mentioned to clarify certain concepts.
4.3 4.7
8.5
7.0
4.6 4.4
Hamburg Bremen Rotterdam Antwerp Zeebrugge Le Havre

43
In brief, the use of tools for comparison between ports when a Competitive Strategy
is going to be built becomes an indispensable element in the process of analyzing the
industry and the competitors. In this sense, the graphic way to compare the
competitors proposed above gives a very good feeling of:
Ø What the industry and competitors are focusing on.
Ø What the factors are that can be used as comparative advantage, and
Ø What strategy can be used according to their own mission and expectations.
In addition, other elements need to be investigated to give a more solid base from
where to build the strategy. The next sub-chapter deals with the feelings of the
players about the competition, the strategies used, the customers’ requirements, and
the market as a whole. Although, the methodology used in this paper is merely
academic, the results are not far away from the reality of the market.
4.5 The Competitors Feelings about the Competition in the Market
Although, the graphical approach is a very good tool when analysis of industries and
competitors is done, the feeling of the players about their competitive environment,
competitors and about themselves in the market plays a decisive role. However, the
interrelation of the elements of the chain makes the analysis stronger. So,
“The stronger the analysis of the industry and market the bigger the certainty of
choosing the correct and right competitive strategy will be”.
Based on these facts this paper proposes a research based on a questionnaire that was
sent to managers of port authorities, container terminal operators and other people
involved in the container business. Moreover, interviews to shippers and shipowners
during field trips and conferences are also part of the conclusions presented below.
The Questionnaire on Competition
The research, as stated above, was carried out through a questionnaire, which tries to
get information such as the players’ point of view about the environment in which
they are competing, the level of the competition and the rivalry between competitors

44
(Appendix III). The questions are divided into four modules mentioned below,
which provide the information in detail about the players’ point of view:
Ø Feeling about the competition.
Ø Factor for competition and customer needs.
Ø Competitive Strategies used or actually used.
Ø Assumptions about competitors.
Besides, this questionnaire was sent to the six port authorities and to 15 container
operators in the six ports. Although, the reply from port authorities was very good,
the container operators reply was only fair because only 40% of them support this
research. However, the information collected is quite substantial and gives a very
good overview of the competitors’ feelings, factors of competition and customers
needs, competitive strategies and competitors’ assumptions.
4.5.1 Feeling about the competition
The competitors’ feelings about the competition in the market in which they are
competing is one of the more important indicators to consider when the competition
is analyzed. However, they have, most of the time, a different perception of the
competition depending on what place they have in the race, their own assumption,
capabilities, goals and aspirations. This particular module was assessed using seven
questions for the terminal operators’ questionnaire and eight for the port authorities.
First of all, the total of the competitors assure that there is competition in the local,
regional and even that they experiment certain competition in the international scope.
Moreover, the level of the competition was qualified as “Very high” (50%) and
“High” (50%) surprisingly the three ports that got the bigger competitive ranking
(Table. 25) feel that the competition is high and the other three feel that is very high.
The last perception comes from the fact that they have few comparative advantages
or because of the pressure imposed in the market by other ports in the range.

45
Besides the high or very high level of competition most of the competitors express
that the quality of it is “Fair” which means that, despite the difference between the
best and the least ports, the competitive environment is good.
Next, the competition is more or less clear in the sense that the three leaders are
identified by the competitor. All agree that the more competitive port is Rotterdam,
83% point out Antwerp as second and the third place is shared by Hamburg and
Bremerhaven. Something that is important to note is that the two bigger ports see in
Hamburg a strong competitor in transshipment traffic, mainly in the Baltic Sea.
In addition to these statements all of them think that Rotterdam and Antwerp are
satisfied with their position in the market, but that, Hamburg and Bremerhaven are
not; so, from them can be expected more aggressive competitive strategies. This
does not mean that the other ports will not make competitive moves to attract cargo.
Thirdly, the intra port competition draws a completely different picture than the
competition between ports. The feeling about the existence of competition in the
market is the same, everybody thinks that there is competition but the level and
quality varies in the local market. This is because, just in two ports the level was
qualified as “Very High” (Hamburg and Antwerp), the other two ports described the
competition as “High” (Rotterdam and Zeebrugge) and the remaining two ports
categorized the competition as “Low”. In the case of quality, 66% said that the
competition is “Fair” and in Bremerhaven and Antwerp it is qualified as “Imperfect”.
The situation of the level and quality described by the players is by far clearly
explained by the fact that the ones who feel a Very High level of competition have
each one four operators with more than 250,000 TEUs throughput in 1997.
Moreover, the major operator in Hamburg gets only 43% and its equivalent in
Antwerp gets 39% of the market, which seems to be fairly balanced.
On the other hand, Rotterdam and Zeebrugge, which describe the level as High have
a different picture because in the first there is one operator that gets 70% of the total
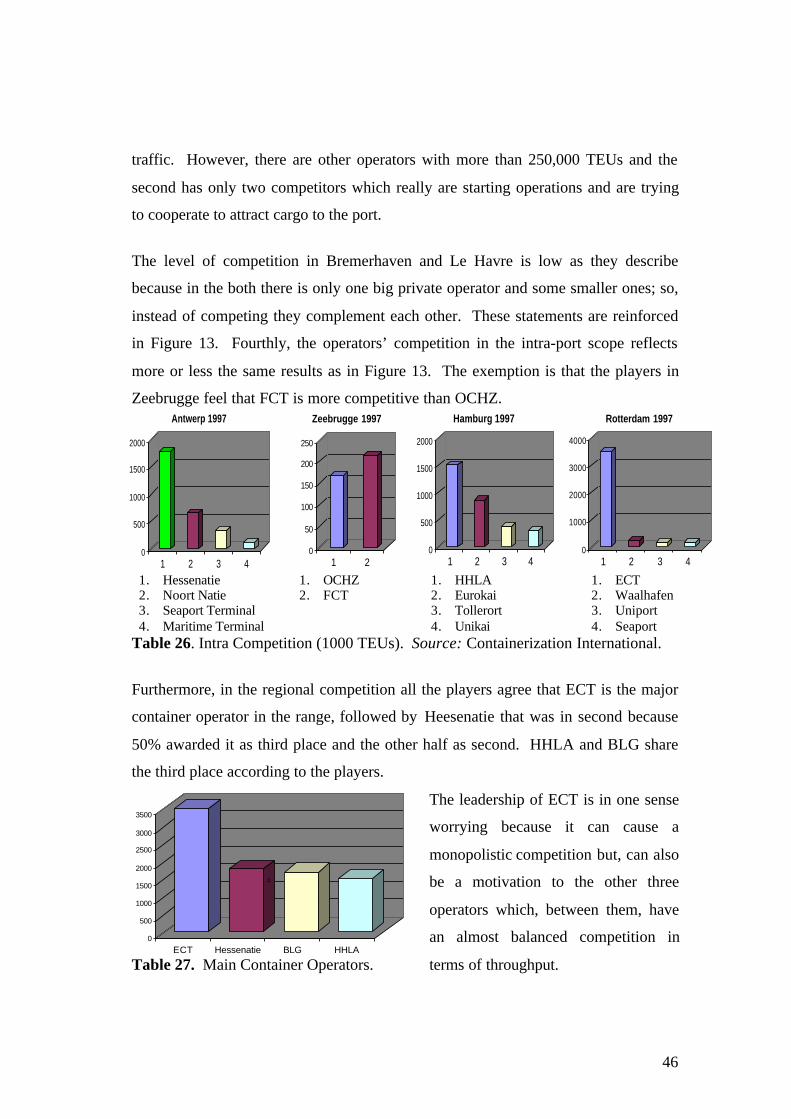
46
traffic. However, there are other operators with more than 250,000 TEUs and the
second has only two competitors which really are starting operations and are trying
to cooperate to attract cargo to the port.
The level of competition in Bremerhaven and Le Havre is low as they describe
because in the both there is only one big private operator and some smaller ones; so,
instead of competing they complement each other. These statements are reinforced
in Figure 13. Fourthly, the operators’ competition in the intra-port scope reflects
more or less the same results as in Figure 13. The exemption is that the players in
Zeebrugge feel that FCT is more competitive than OCHZ.
1. Hessenatie 1. OCHZ 1. HHLA 1. ECT2. Noort Natie 2. FCT 2. Eurokai 2. Waalhafen3. Seaport Terminal 3. Tollerort 3. Uniport4. Maritime Terminal 4. Unikai 4. Seaport
Table 26. Intra Competition (1000 TEUs). Source: Containerization International.
Furthermore, in the regional competition all the players agree that ECT is the major
container operator in the range, followed by Heesenatie that was in second because
50% awarded it as third place and the other half as second. HHLA and BLG share
the third place according to the players.
Table 27. Main Container Operators.
The leadership of ECT is in one sense
worrying because it can cause a
monopolistic competition but, can also
be a motivation to the other three
operators which, between them, have
an almost balanced competition in
terms of throughput.
0
500
1000
1500
2000
1 2 3 4
Antwerp 1997
0
50
100
150
200
250
1 2
Zeebrugge 1997
0
500
1000
1500
2000
1 2 3 4
Hamburg 1997
0
1000
2000
3000
4000
1 2 3 4
Rotterdam 1997
0
500
1000
1500
2000
2500
3000
3500
ECT Hessenatie BLG HHLA
c
47
In short, the players’ feelings about the competition reveal how the market is
working in the day-to-day and how they perceive such competition. Another
important matter is that knowing the reality of the market and being objective with
the competitors assumptions gives a more realistic situation and achievable goals can
be set for the competitive strategy.
4.5.2 Factors for competition and customer requirements
The second module of information is related first to factors that are differentiating
competitors, that are creating new competition or moving it in another direction or
that are creating comparative advantages or disadvantages. Secondly, to the
customers (shippers and shipowners) requirements from the point of view of the
suppliers and their thoughts about the customers needs or preferences.
First of all, the competition, as can be extracted from this research, is basically
focused on seven factors, which differ from port to port according to their
capabilities, circumstances and targets. The factor mentioned most was the “quality
of services to ships” which means that operators are more and more interested in
reducing time in port, increasing productivity, using as many gangs as possible and,
as consequence, reducing the “turn around time”.
Following this factor are “quality of services to cargo” and “price” which were
mentioned by 66% of the players. Quality of services to cargo is a factor that creates
added value to the cargo and also creates a certain close relationship between port
operator and shipper because the port creates a substantial participation in the value
chain of the goods. Price is the easiest factor for competition to practice; however, it
is not a sustainable factor and can give a short comparative advantage.
The next factors mentioned are “transshipment services” and “inland connections”
which are part of the same logistic system. The importance of them is especially
strategic in Europe because of the geographical configuration and economic
development. In fact, “inland connections” is so decisive because it will assure a

48
better distribution system which means less transit time, more transport options and
consequently a lower transport cost.
Last but no means least are “cargo handling technology” and “information
technology” which together are successful factors for competition because they
increase the level of the customers services. However, it is understandable that this
is placed below the other factors because this technology is available for all the
players in this market, but at the same time only a few can afford to invest in R&D.
In brief, the competitive factors that are used in this market strengthen the
assumption that the industry is in the “transition to maturity” stage; thus, the
competition is more focused on the “quality” of the service provided. However, this
quality must be:
“Efficiently economic as economically efficient”
The transition to maturity of the industry and the actual development are proposing
that the competition in the near future must turn in a new direction.
Next, to compete and succeed in the race is always a challenge. The keys to face this
challenge are to know by heart the customer’s reasons to prefer our services rather
than our competitors and the reason of the potential clients for staying with our
competitors.
In the sense of why they are preferred over other competitors all of them have the
same reasons because 100% realize that their customers are happy with their “quality
of services” and the “price” paid for these services. Thus, if all are preferred by the
same factors there must be an element that creates the differentiation, this is also the
reason why the competition in this range is high or very high. The other factor that is
making the difference between competitors is “inland connections”. This factor, as
discussed before, is important for distribution but most of the competitors claim that
their clients are with them because of this factor. Finally, “contract flexibility” can
be a good strategy for competitors with a lack of distribution channels.

49
On the other hand, the answer to the second question was “prestige” 50% and the
other half did not answer which is quite sensitive and understandable. Although,
they answered “prestige” in their appreciation of the market, this does not reflects the
type of customers and their requirements. The customers (shippers and shipowners)
are very well informed. They know their bargaining power. Customer loyalty is not
based on names or branches but on commercial needs and win-win principles.
In short, the similarity of factors that are making the difference between competitors
demonstrates the importance to create competitive strategies and to invest in R&D in
order to create an element that can assure customer preference, or at least to add
another reason for the customers to stay at home.
The final part of this module asks the competitors, “which are the pillars or the base
of their success?” “equipment and facilities” and “price policy” were the elements
most commonly used as catalysts for success, which is a consequence of market
forces and customer requirements. This is because, operators must have enough
equipment and facilities to perform the operations with the level of quality promised,
despite the level of the demand. In addition to this, customers are always expecting a
simplified, effective and attractive price policy. Moreover, “technology available”,
which was the next factor after the above mentioned, is the pillar for 66% of the
competitors because of recent ship developments. So, operators need to acquire new
cargo handling technology, which can gives them a comparative advantage.
On the other hand, there were other pillars mentioned such as “management style”,
“labor skills” and “marketing forces”. However, the nature of these elements is not
sustainable as they are not too often used as a basis of success they are used as
complementary resources.
In brief, competitors must recognize the customer requirements, make a clear
analysis of the market forces and recognize their strengths as well as the strengths of
their competitors in order to have a clear picture of the competitive environment.
Recognizing all these factors it is easier to decide which strategy to follow.

50
4.5.3 Competitive Strategies and market sensibility
Competitive markets keep the competitors busy trying to realize what are the next
moves that the competition will make in order to take some shares from other
competitors. This module looks for the market sensibility about the use of
competitive strategies.
First, the players in the range are aware that most of the container operators are
involved in certain types of competitive strategies, some of whom are trying to
attract more traffic and others who are trying to construct a solid base. In port
competition all answers are involved in competitive strategy, which is not a surprise
because this particular market is well known for its competitive environment.
However, the interesting thing is: what are the particular strategies and what are they
focused on? The main strategies in use are “expansion of inland connection
capacity”, “expanding equipment and facilities capacity” and “increasing quality of
services’. These three are customer-oriented strategies that fit very well into the
market needs in the range. But, the first strategy mentioned asks the question of who
is paying for this expansion? This can carry some thoughts about whether the
investment will increase the competition or will create a market imperfection.
Second, the confidence of the players in the market can be a very important factor
that can be the catalyst of new strategies. Although, confidence can create a good
image that can be used to attract customers, over confidence can cause an
underestimation of competitors or late retaliation moves. 17% of the competitors
affirm that in the regional competition “none of them” are prepared to retaliate their
competitive moves, 33% affirm that only “few of them” are prepare to retaliate and
50% are aware that if they make a competitive move “most of them” will react and
are prepared for that. Logically, the ones who think that the market is not prepared
are the leaders. This is because, they are strong enough to invest in R&D, new
technology and even to invest in the state of the art technology with financial loses.

51
On the other hand, all of them assure that they are prepared to retaliate the strategic
moves of the other competitors in the market.
Finally, the totality of the players assumes that anyone is capable to initiate a
competitive strategy, which can be addressed in four main aspects. “Price” is the
most expected strategy because 83% of the players feel that any competitor can
restructure their price policy to attract the attention of customers. This strategy
seems to be the most common and easiest way to initiate a move. Contrary to this
66% think that the strategy can be based in the introduction of new “cargo handling
technology” which requires as high investment as risk involved.
The other two strategies that they can expect to take place are “quality of services”
and “transshipment services”. The first one has the main aim to secure the
preference of the actual customers and at the same time to attract some traffic. The
second one can be to target a different kind of traffic or to increase the actual traffic.
This strategy is more complicated but has very high pay off as risk involved.
However, most of the ports in the range are highly interested to become a hub port.
In short, competitive strategies are a good tool for succeeding in the market,
however, first of all it is necessary to know the retaliation capacity of the competitors
as well as what kind of move they will initiate. The knowledge of these features will
avoid over investment and loss of shares.
4.5.4 Competitors assumptions and capabilities
The last module of questions makes reference to the assumptions that the players
make about their competitors when they are developing any strategy that will affect
the stability of the market. The first part reviews the past experiences about how the
competitors had reacted to competitive moves. In this sense all agree that their
competitors react “rationally” to the moves, but this reaction is 50% quickly and 50%
slowly. Rationality of reaction gives to the market the need for very well planned
moves or strategies. The speed of reaction is not as important as the reaction itself.
52
Next, the assumptions of what the attitudes are that drive the goals of the competitors
and what is the overall importance of the container business for their whole
organization gives another view of how the competitors will react to any event that
threats their organization.
The attitudes are “profitability” for 50% of the competitors, which is according to the
importance stated below. “Market position” is the attitude of 33% and the rest
“added value”. This is mainly due to the fact that ports looking for “market position”
are the newest players and the ports that go for “added value” are using this business
to support their logistic chain. The overall importance for 50% of the players
assumes that this industry is their “core business” so this part of the market is very
sensitive to changes and puts more attention on to the market. The other 50%
assume that the industry is treated as “part of the logistic services” and as an
instrument to produce “added value”. This suggests that they are not more
competitive than the first ones; however, they can be more effective because they do
not depend totally of this industry; so, they will be less emotional when they need to
act or react to competitive moves.
Finally, the last part of this module tries to find out the players’ assumption about the
vulnerability, adaptability and impact of exogenous events on their competitors. The
vulnerability expressed by the players about their competitors varies and includes
location, price, physical constrains, quality of services, information technology,
inland connections, cargo handling technology, and storage facilities. This
assumption has its origin in their strengths and the competitors’ weaknesses.
The assumptions of players about the adaptability of their competitors to different
factors is a good indicator that can drive the strategy. They assume that only 33%
are not capable to compete in “cost”, “adding new equipment” and “adding new
services”. If the assumptions are in that sense a strategy with these characteristics
will have few chances to succeed. On the other hand, the assumption is that only
33% are capable to compete in “introduction of new technology” and “competing in

53
services”. Competing in these functional areas is very risky and requires huge
investments that few players can afford.
The impact of exogenous events on the market can affect some competitor
capabilities. However, the assumption of the players of the impact of events such as;
a sustained rate of inflation, technological changes that make the existing cargo
handling equipment obsolete, increase in wage rates or new governmental reforms
that will affect this industry, is that all the competitors are capable of handling them.
In the end, assuming what will be the reaction of competitors to different scenarios is
a good exercise. However, it must be rationally created and as real as possible
because wrong assumptions can cost millions. The research tries to draw a picture of
the scenario of the players’ assumptions of the market, competitors and themselves.
4.6 Impact of the International Containerization Trend
Container operators have to be aware of the tendencies in the global market.
Concepts like vertical or horizontal integration, network or hub ports are totally
changing the environment and mainly the state of competition. However, the main
factor that is revolutionizing the market is the new technology used on ships trying to
get the best possible advantage of economies of scale.
This technology will leave some ports out of competition because the new generation
of vessels like “Regina Maersk” and “Southampton Class”, described in Figure 11,
require deeper channels, bigger and faster gantry cranes with an outreach of at least
18 containers, stronger quays and higher logistics standards supported by IT and
qualified personnel.
Figure 11. New generation of container vessels.
54
Furthermore, shipping companies are actually talking about container vessel capacity
of 8000 TEU’s and for the North Sea Terminal (Bremerhaven) under construction
the tenders are planning to construct gantry cranes for handling vessels 22 boxes
wide3. Therefore, these developments suggest that in the very near future there will
be only a few ports that will handle these vessels and these will be the hub ports for
very large regions. These ports must comply at least with five characteristics4:
Ø Must ensure a draft at least of 18m. without tide restrictions.
Ø Must be in the border of the main trade routes with the shortest maneuvering time
Ø Must deploy efficient, reliable and adequate handling equipment with and storage
capacity avoiding any idle time or queue
Ø Must have reliable inland transport with sufficient capacity to transport the
container in/out with an adequate IT.
Ø Must have a high hinterland with centers of production and consumption to
generate substantial local traffic to provide captive capacity.
Indeed, “few big vessels with 8,000 or 10,000 or more will call at few hub ports with
the characteristics mentioned above”5 is the tendency for the near future. Although,
these factors have to be taken into consideration for the creation of competitive
strategies, there are still some factors that must have further priority such as the
customer requirements.
4.7 Customers Requirements for European Ports
The main requirements from shipowners and shippers are close related to the
characteristics of hub ports but from a different perspective. From this perspective,
seven main requirements from shipowners for choosing port of call can be
identified6.
3 Fairplay (April 22, 1999). p. 294.Framcou, B. ‘Competition and complementarity in the European ports’ 1998.5 Shuo, M. Lectures ‘Strategic Port Planning; WMU, 1999.6 Lodder, O. lecture ‘How to select a port’ Rotterdam, 1999

55
a) Commercial viability. The port itself must have the characteristic to have the
economic capacity to generate cargo flow to use the vessel capacity.
b) Nautical approach. No draft restrictions, easy accessibility, no locks, short transit
time from sea to berth.
c) Inland connections. Distribution channels well designed with no congestion and
accessibility to other transport means such as rail, road, inland waterways or air.
d) Shortsea Feeder connections. The port has to ensure the logistic distribution in
terms of frequency, volumes of traffic and feeder coordination.
e) Hub facilities. Transshipment between various main lines, over berth, storage
and equipment capacity.
f) Operational performance. High productivity is important but Turn Around Time
is the most important factor for shipowners. This involves a precise coordination
between traffic control, pilots, tugs, mooring and stevedores. Moreover, port and
terminal facilities, authorities flexibility, EDI, labor skills and social climate are
part of the total performance.
g) Port and terminal charges. The tariff system must be clear and simple with
reasonable tariffs and integrated bills.
In brief, having clear what are the tendencies of the industry and what are the
customers demanding, the construction of competitive strategies is more realistic and
will be the basis for planning and developing. Indeed, container traffic in Europe is
very important for the world because it represents 25% of total traffic since 1990.
The growth has been 8.6% in the last five years and was the major growth in the
world. This tendency projected in relation to GDP and trade in value gives an
impressive traffic growth of 120% for 2010. The HLHr growth projected with the
same trend, and taking into consideration that the participation is the same, gives an
increase to 36.2 million TEU’s for the same year. So, the competition in the range
will undoubtedly increase, whatever the factors or the type the competition takes.
56
However, the state of competition for this traffic will be “Oligopolistic Competition”
because the analysis projected for the next ten years suggests that 50% of the
competitors will have 70% of the total traffic in the range. Furthermore, the “flower
of competition” shows that the leader of the competition is also the best in five of the
seven factors analyzed, which then supports the tendency mentioned above.
Antwerp is the number two close to Rotterdam, the rest are very close to each other
which makes the market more competitive. In addition, the flower suggests that the
competition is higher in services to ships because the distance between competitors
in the factors related to these segments is very small. This assumption means that the
competitors have as a main target the shipowners or shipping lines.
The “questionnaire on competition” reflects a market where competitors are aware of
the competitive environment and also reflects that the main factors for competition
are services for ship and transshipment services are their main tasks. The market in
the range according to players assumptions is in “transition to maturity”, explaining
that the players think that customers demand first quality and second price.
Finally, the international trends and customer requirements for European port
combined with the results of this research have a main conclusion which is that the
competition is going to be segmented into two main parts: competition for shippers
and competition for shipowners. Also, this competition will focus in two main
factors where the most important is “quality of services” and second “price”.
The analysis of the industry is finished and the next step is the creation of the
competitive strategy. The next chapter will deal with the suggestion of the most
suitable strategy for each port based on the forecasted traffic, assumptions and
capabilities of each competitor, and the three Generic Competitive Strategies.

57
CHAPTER 5
5 BUILDING COMPETITIVE STRATEGY
The present chapter represents the final part of the process to build the competitive
strategy for the ports subject to study. The information collected from the research
made in chapters 3 and 4 will be processed in order to find the best possible
competitive strategy for each container port in the range.
The chapter describes the competitive strategy for each port according to the
elements considered in the “Flower and Competition”. However, here the elements
will be divided into two main blocks that cover the necessities and main
requirements for the customers. The blocks are divided into:
Ø Quality of Services to Ships Shipowners
v Location (with respect to Fairways)
v Nautical Constrains
v Port Costs
v Ship Facilities
Ø Quality of Services to Cargo Shippers
v Location (with respect to the main industrial zones Chapter 4. p 36)
v Distribution Costs
v Cargo Services
v Value Added
Each element is clearly defined in the competitor analysis (4.4) and the criteria for
the evaluation of each element is shown in Appendix II.
Finally, the strategy will be built according to the Generic Competitive Strategies
(2.3) discussed in Chapter 2, the tendency of the port according to the matrix
proposed where the ports are categorized and the level of the “quality of services for
ships and cargo” proportionate by the each port.

58
5.1 Port Classification
The actual port classification can be done taking into consideration the quality of
services to ships and cargo. The figure below expresses the relationship between
these two parameters and the classification, which reflects the strategies applicable.
Figure 12. Port classification according to the quality of services provided
The classification of each type of port in this matrix emphasizes the characteristics of
the traffic attracted by these ports which must be linked to the strategy followed.
Ø Network Port: provide high quality to ships and cargo. Consequently, they
generate traffic from/to the port and hinterland which makes them commercially
attractive and in addition have the ship facilities, channels of distribution, low
cost per ship to give an incentive transshipment traffic.
Ø Transshipment Port: provide high quality services to ships but low to cargo.
Thus, they are dedicated to ship-shore operations and are economically attractive
for cargo concentration and distribution. They assure the fastest turn around.
Ø Direct Call Port: provide low quality of services to ships but high to cargo. They
are commercially attractive for liner shipping to call but due to their ship service
disadvantages are not economically suitable for transshipment.
Ø Feeder Port: Ports that provide low quality of services to ships and cargo. As a
result, they are not economically suitable for direct call so the network or
transshipment ports feed them.
These definitions are used below to classify the port in the HLHr according to their
characteristics, which are the output of the “flower of competition”. Consequently,
the competitive strategy can be build according to the result of the comparison.
High
LowHigh Low
Qua
lity
of S
ervi
ces
to S
hips
NETWORK PORT TRANSSHIPMENT PORT
DIRECT CALL PORT FEEDER PORT
Quality of Services to Cargo

59
5.1.1 Port classification in the Hamburg-Le Havre range
The result of the port competition gives a picture of the market where the fourth type
of ports are present in the range, which points out the level of the competition but at
the same time turns the environment to a complementary stage.
The table on the left represents the level of competitiveness from 1 to 10 (Appendix
III) of each port in the two blocks of services. The criteria for the results in the table
on the right were that all the values above or equal to 5 are awarded with high and
under 5 with low.
Table 28. Level of the Quality of Service to Ships and Cargo provided by ports
According to figure 12 and the result of the competitors analysis of the ports in the
range it can be concluded that in the HLHr currently there are the four types of ports
represented which suggests that either the competition will increase or they will
complement each other which will decrease the competition.
Figure 13. Classification of ports in the Hamburg-Le Havre range
Therefore, the classification of each port according to the parameter chosen gives a
clear idea of the strategy that can be applied to each case. Moreover, this
0
5
10
Hamburg Bremen Rotterdam Antwerp Zeebrugge Le Havre
Services to Ships Services to Cargo
Port Ships CargoHamburg L LBremen H LRotterdam H HAntwerp L HZeebrugge H LLe Havre H L
Quality of Services to
High Network Port Transshipment Port
Direct call Port Feeder Port
LowHigh Low
Quality of Services to Cargo
ROTTERDAM
ANTWERP HAMBURG
Qua
lity
of S
ervi
ces
to S
hips
BREMERHAVENZEEBGUGGE
LE HAVRE

60
classification in Figure 13 can be combined with Figure 5, Chapter 2 in order to
know the best competitive strategy for each port.
5.1.2 Defining Competitive Strategy
Combining the theory of the generic competitive strategies1 with the classification of
the ports in the HLHr proposed in this paper, it is possible to see in a graphical way
which strategy is more suitable to each port considering their particular
characteristics. Figure 14 merges both theories in order to have in one graph the type
of ports, the ports themselves and the generic strategy.
Figure 14. Competitive Strategy for the ports in the Hamburg-Le Havre range
Merging the theories gives a clear vision of what strategy must be applied by each
port in the range. Furthermore, any port that can identify in which port classification
it fits can easily know which strategy can be applied according to its own situation.
Indeed, from here it is also possible to determine, according to the port aspirations,
whether to move from one classification to another, the kind of investment (capital or
resources) to be made and the market that must be targeted. Therefore, the
competitive strategy for each port will be built from the results of Figure 14, the
“flower of competition, the “traffic forecasted”, “the questionnaire on competition”,
assumptions, development and trends.
1 Portler, M. ‘Competitive Strategy” 1980. p. 35 - 40
High Network Port Trnsshipment Port
Industrywide
Direct call Port Feeder PortParticular
Segment only
LowHigh Low
Quality of Services to Cargo
STRATEGIC ADVANTAGEUniqueness persivedLow Cost Position
by the ustomer
HAMBURG
STR
ATE
GIC
TA
RG
ET
BREMERHAVENROTTERDAM ZEEBRUGGE
LE HAVRE
Qua
lity
of S
ervi
ces
to S
hips
F O C U S
OVERALL COST LEADERSHIP DIFFERENTIATION
ANTWERP

61
5.2 Building the Competitive Strategy for the port of Hamburg
Hamburg was number seven in the world and number two in the range in 1998. Its
main competitor (Antwerp) can almost reach it by the year 2000 and overtake it by
almost 200 thousand TEU’s in 2005 according to the forecast traffic as shown in
Table 25, Chapter 4. Moreover, the most recent developments in the ports are:
Ø The dredging of the Elbe to enable vessels of 13.8m to enter despite the tide.
Ø The creation of Eurogate which is the merging of BLG and Eurokai.
In short, the current situation of the port of Hamburg in this particular business is
entering a phase that requires the creation of competitive strategy trying to anticipate
the movement of Bremerhaven and the other competitors.
5.2.1 The Competitive Strategy for Hamburg
The competitive strategy must be based on the “focus” strategy but specific elements
can be used for the overall cost. However, applying the differentiation theory can be
very time and capital consuming without no sustainable advantages.
5.2.1.1 The Focus Strategy
Hamburg can focus its effort to become the “Gate to the Scandinavia and Baltic
Region” taking advantage of its geographical position with respect to the North Sea,
Scandinavia and Baltic Region. The target here is that all cargo coming from North
America, Asia and Africa to Scandinavia and Baltic States must be transported via
Hamburg. The success of this strategy can be achieve if:
Ø The market is clearly identified, the cost benefit analysis to each traffic is clearly
assessed and “special tariffs” are set for transshipment cargo or traffic targeted.
Ø Partnership is created with the port of Lubeck in order to develop a “land bridge”
between these ports and together distribute the cargo to this region.
Ø A strategic alliance is made with the ports in these regions that can give us the
possibility to create a “net of container traffic”. For instance, Aarhus, Helsingor,
Helsinborg, Stockholm, Helsinki, Klaipeda, and others in the region.

62
Ø Rail and road transport is promoted to Scandinavia taking advantage of the
excellent distribution channels and opening of the Oresund Bridge the next year.
5.2.1.2 The Overall Cost Strategy
This strategy can be achieved by attacking the port costs and the distribution costs.
First of all, reductions of port cost by redesigning the actual price policy applying the
“cost based” tariff system. The redesigning must allow shipping lines to have
substantial “rebates” for calling frequency and number of container handled in the
port. Of course, this policy must consider the capacity of the ship and the relation
with the percentage of cargo loaded and discharged in the port. In the same way a
commitment from the pilot, mooring and towing companies to apply similar price
policies for container ships must be achieved.
Then, the distribution cost strategy is first to divide the traffic into two segments.
a) Distribution to industrial zones in a radius of 300km mainly served by trucking
companies or at least in bigger proportions and getting a commitment from them.
b) Distribution to industrial zones in a radius greater than 300km mainly served by
railway or at least in a bigger proportion and getting a commitment from them.
The second strategy is to enter into a Joint-Venture or Merge with a rail company
without attempting to the rail competition and invest in better road distribution.
Consequently, part of the shadow of the expensiveness of port cost will disappear
and the apparent input reduction will be compensated with the increase in calls.
The final recommendations are first to open the port policy giving the opportunity to
shipping liners to achieve their vertical integration allowing them to run their
dedicated terminals handled by local operators. Next to launch marketing campaigns
promoting these new strategies helping the customer to forget the past shadows.
Indeed, the strategies proposed can be put into practice independently but the
combination of focus, overall cost strategies and the final recommendations will give
to the port of Hamburg the possibility to substantially increase the distance with
Antwerp. But, mainly it will bring new perspectives, new traffic and consequently
the new image that this port needs to compete in the range and the world.
63
5.3 Building the Competitive Strategy for Bremerhaven
Bremerhaven was, in 1998 twenty-second in the world and fourth in the range. Its
main competitor is Hamburg because they are looking at almost the same traffic.
However, the difference between them is 1.7 million TEU’s in favor of Hamburg.
Also, Le Havre is making pressure with a difference of 500 thousand TEU’s in favor
of Bremerhaven.
In addition, Bremerhaven is involved in a chain of developments that are changing
the face of the port such as:
Ø BLG new organizational structure and new jointventures.
Ø Eurogate (BLG + Eurokai) possible investment by Hutchinson Ports.
Ø Construction of the North Sea Terminal Bremerhaven as dedicated terminal for
Maersk-Sea Land handled by BLG (Eurogate)
In short, Bremerhaven is aware of the level of competition and the risks of not
having the adequate structure to satisfy customer and industry requirements and
trends. Thus, the strategy for Bremerhaven is clear and is according to Figure 14.
5.3.1 The Competitive Strategy for Bremerhaven
Downloading the competitive strategy for Bremerhaven the best alternative is to
apply the “differentiation” strategy to exploit its comparative advantages that makes
Bremerhaven an ideal candidate to become a transshipment port (Figure 13).
5.3.1.1 The Differentiation Strategy
The strategy must be addressed to create the best operational and economic
environment for shipping lines with vessels of more than 5000 TEU; thus, the target
is to attract them to create here their transshipment center and have Bremerhaven as
the transshipment port for Northern Europe. Three points are proposed to achieve
this strategy.
Ø Reduction of time in ports: since the objective is to differentiate the port to the
rest, crane productivity must be higher than 35 movements per hour and
guarantee at least 5 cranes per ship without exemptions. The operations

64
department must be totally committed to achieve this task, the ship shore, yard
and planning operations must be very well coordinated and investments in yard
equipment and new hardware if this is necessary must be deployed to guarantee
success.
Ø Reduction of ship cost: Reduction of maneuvering time is the first step that can
be achieved by perfecting the VTS, mainly by speeding up vessel transit in the
channel and reducing the number of pilots onboard. Another solution is to
implement a PIS from where the traffic center can control the arrivals without the
necessity of pilots and a reduction in speed. Also, to apply a tariff policy as
suggested above for Hamburg.
Ø Cargo Handling Technology: Gantry crane availability is a key element in
achieving the productivity proposed; so, the number of cranes must be calculated
taking into consideration the picks. However, the main point here is that
Bremerhaven must invest in high-speed gantry cranes with outreach able to
handle vessels 22 boxes wide and available for any customers.
Supporting this strategy a new price policy that promotes the transshipment traffic
must be put into operation. The price strategy can be “predatory” for starting the
process or based on marginal costs combined with substantial throughput “rebates”
for shipping lines. Furthermore, transshipment by nature is not very stable traffic;
consequently the relationship with shipowners, liners and alliances is definitely an
element that the marketing department must take care of and make the relation strong
and as stable as possible.
In short, combining the actual developments and the strategy proposed gives a very
good position to Bremerhaven for confronting the competition in the range. Despite
the fact that from the three ports that fit the classification to run for being a
transshipment port Bremerhaven is the best in ship services. Therefore, the
“differentiation” strategy is the best alternative to increase the throughput and take a
bigger piece of the 27 million TEU’s in 2005 and 36 million TEU’s in 2010
forecasted for the range.

65
5.4 Building the Competitive Strategy for the port of Rotterdam
Rotterdam has been by far the number one in the range and was the number fourth in
the world in 1998. Its position in the range is to certain extent comfortable because
the difference to the nearest competitor is 2.5 million TEU’s (Hamburg). However,
the “Flower of Competition” points out Antwerp as Rotterdam’s main competitor
based on the fact that they are very close to each other and both are cargo oriented.
The last developments in the port of Rotterdam can be summarized as follows:
Ø The sale of ECT to Hutchinson ports and other investors including Rotterdam
Municipality Port Management.
Ø The initiative of ECT about future expansion of the port to the North Sea where
the investment they say must be shared by the government and private investors.
Ø ECT and RMPM are going global, investing in terminals around the world.
The situation of Rotterdam gives the stability to continue growing and they must
follow the example of Hong Kong and Singapore in the sense that Rotterdam has to
create their own container terminal net.
5.4.1 The Competitive Strategy for Rotterdam
Rotterdam is the leader in service for ships and cargo in the range and probably in
the world. The strategy is “overall cost leadership” because it has the commercial
availability for shippers and shipowners. Moreover, because of its hinterland, cargo
services, value added and channels of distribution, the cost per unit handled in the
port is cheaper. On the other hand, the frequency of calls and the big diversity of
shipping lines and destinations makes the economic and commercial availability very
attractive for logistic providers, industries and big global enterprises to choose this
port as the center of distribution.
The strategy for Rotterdam is clear; they have to continue creating and attracting
more industries to generate more cargo. However, they also have to take care of
some elements like port costs and to anticipate problems of saturation or increase of
66
berth occupancy because this can damage the image of the port and suddenly they
can lose some transshipment traffic. So, the recommendations are to:
Ø Reduce port costs mainly to lines that are using Rotterdam as a transshipment and
promote this reduction to encourage other liners to make transshipments here.
Ø Continue developing new areas for expansion taking into consideration that for
2010 it is forecasted that they will handle 13 million TEU’s.
Indeed, Rotterdam as the leader in any industry must command the competition and
spend in R&D, not lose the focus and always be aware that because of its big weight
it can be very difficult to recuperate from an injury.
5.5 Building the Competitive Strategy for the port of Antwerp
Antwerp is the most central port in the range, being the number nine in the world and
three in the range in 1998. Its main competitor in throughput is Hamburg, but the
pressure for Antwerp comes from Rotterdam because it is very closely located and
they are serves exactly the same hinterland.
The latest developments for Antwerp show the tendency of trying to reduce the turn
around time and make the port more attractive for shipowners. However, the port
has a strong reputation as being very cargo oriented. This means that it has a strong
cargo service network, which is attractive for shippers.
Ø Moving the container terminals to the outer part (before locks) that was the main
disadvantage for the container operators.
Ø Construction of quay wall of 1,100 m. with a capacity for 800,000 teu that will be
operating next year2.
In short, the current situation of Antwerp gives the feeling that they want to compete
face to face with Rotterdam and move up in port classification. However, they have
to be more rational and chose a better strategy that can give to the port a sustainable
development and better resources allocation.
2 Fairplay (June 18, 1999). p. 23
67
5.5.1 The Competitive Strategy for Antwerp
The competitive strategy for Antwerp, as well as Hamburg is the “focus” strategy.
However, in this case the objective or traffic target is internally produced. Antwerp
has to concentrate its efforts on the creation of more cargo from/to its hinterland and
assure that main liners will call at the port. This means that according to the port
classification proposed in this paper Antwerp is clearly a “direct port”.
Ø The strategy must be addressed to create more added value, to process more
primary products, to be more attractive for shippers but mainly to increase the
port importance and become indispensable in the logistic and value chain of
customers. The objective is to keep the cargo availability high enough to require
direct calls from the main liners.
Ø Since the main target is the shippers a very close partnership has to be built trying
to cope with all their requirements to support their activities. Furthermore, to
establish a commitment and assure that they will ask for direct calls and good
frequency to shipping liners.
Ø Promotion of competition between trucking companies and a reliable railway
system in order to guarantee a high level of channel of distribution. Inland
waterways must be improved.
Ø Moreover, it is indispensable not to forget to keep an acceptable level of service
to ships and assure berth availability to avoid shipowners madness.
In short, Antwerp must focus most of its effort on creating an environment of
maximum attractiveness for shippers (they have the cargo, they have the power to
bring direct calls to the port). However, they have to realize the possibility that it can
be an attractive alternative for shipping lines in the sense that Antwerp can be a
distribution center. Thus, effective channels of distribution to central Europe
together with shippers power will make Antwerp suitable to handle the cargo
generated in-house plus the cargo with a final destination inside Europe.
68
5.6 Building the Competitive Strategy for the port of Zeebrugge
Zeebrugge represents the new kid on the block and its participation since its arrival
has been very good with the highest growth registered in the range in the past two
years (19%)3. Zeebrugge was number sixty-six in the world and the last in the range.
Despite this data Zeebrugge presents a very fast development and its characteristics
point to it being a very good candidate to become a transshipment port.
The more recent developments in Zeebrugge show the tendency for a high emphasis
in increasing the ship service.
Ø Ocean Container Terminal overtaken by Hessenatie creating Ocean Container
Terminal Hessenatie Zeebrugge (OCHZ).
Ø Expansion program of OCHZ quay length to 1000m and staking area capacity to
4,400 TEU. Acquisition of other post-panamax gantry cranes4.
Ø Investment in R&D where the most ambition plan is to construct a container
gantry crane with two trolleys in the same boom, each with a different driver.
The situation of Zeebrugge is ideal to start the implementation of competitive
strategies emphasizing their main natural advantages and the technology available.
5.6.1 The Competitive Strategy for Zeebrugge
The best alternative for Zeebrugge to compete in the range is according to Figure 3 is
to apply the “differentiation” strategy taking advantage of its comparative advantages
such as location, nautical constraints and low port costs which make Zeebrugge the
ideal candidate to become a transshipment port and compete for transshipment
traffic.
The strategy must be ship services oriented, and all efforts must be directed to build a
strong reputation in container handling; moreover, the traffic has to be segmented in
order to clearly identify the requirements of each traffic. The success of the strategy
depends on the following points.
3 Port of Zeebrugge ‘httw//www.portofZeebrugge.com’ 1999.4 Fairplay (June 18, 1999). p. 23 -24

69
Ø Marketing promotions must be intensified pointing out the natural advantages,
operational achievements, economic advantages and logistic benefits of choosing
Zeebrugge as transshipment port. Traffic from North America and mainly Asia
must be targeted.
Ø The operations department must assure that productivity over 35 movements per
hour is provided. Coordination between ship-shore and yard operation must be
efficient.
Ø Berth, crane and yard occupancy rations must be kept as low as possible to avoid
any queue, ship waiting time and idle times.
Ø Promote the creation of dedicated terminals for main shipping liners.
Ø The price policy must be performed with the aim to attract transshipment traffic,
and must be based on marginal costs at the beginning of the strategy. Moreover,
substantial “rebates” must be provided to shipping liners for the volumes of
traffic handled.
In brief, the differentiation must come from the high productivity, low cost and ship
facilities available. This strategy will allow Zeebrugge to become a transshipment
port and start to climb up in the world rankings.
5.7 Building the Competitive Strategy for the port of Le Havre
The port of Le Havre is one of the ports in the range that has the most central
position in the competitor analyses. Le Havre was number thirty-three in the world
and fifth in the range in 1998. Its main competitor is Zeebrugge because they are in
fact competing for the same type of traffic.
The main developments related to Le Havre are taking the initiative to make the port
more efficient as well as more attractive for ships and cargo.
Ø The Ministry of Transport has launched a proposal with the purpose of
modernizing the port system in France.
Ø The Plan 2000 has been carried out with success in its first phase.
70
Le Havre has to work very hard if it wants to continue developing its traffic. The
work must be done in several aspects but must mainly focus on making customers
forget past problems.
5.7.1 The Competitive Strategy for Le Havre
The research carried out expresses the necessity of Le Havre to start working on the
strategy of “differentiation” using its natural advantages in the first place and
secondly the ship facilities available.
The strategy must be similar the strategy for Zeebrugge since both are classified as
suitable transshipment ports. In addition to the five points suggested for Zeebrugge,
four points are suggested for reconstructing the image of the port and starting the
development needed to become a real protagonist in the competition.
Ø To open the policy of the port by inviting global container operators like
Hutchinson, PSA, ICTSI to operate the terminals. This will bring the know how
needed and the competitive environment indispensable for Le Havre.
Ø To target mainly the Asia-Europe traffic taking advantage of the fact that they are
the first port on this route.
Ø To develop new terminals outside the locks with the participation of global
operators or encourage shipping lines to establish their dedicated terminals.
Ø To carry out an extensive promotion of the port pointing out the developments,
the new era of the port and the interest of the global players in the port. The
organization in charge of this promotion must be something other than the “Port
Alliance”.
Le Havre has to make a huge effort if it wants to really take a piece of the traffic
from the competition. The industry is demanding competition in the physical,
operational, economical, technological and management aspects. Le Havre has the
tools, so it only needs to switch on the engine and take the best piece of the traffic.
71
In the end, the strategies suggested for each port are based on the research carried out
through this paper and reflect the best suitable Competitive Strategy in each case.
This Generic Competitive strategies try to take advantage of the sustainable
competitive advantage and magnify it to get the maximum benefits changing the
rules of the market on their favor.
Table 14 which is the combination of “the classification of ports” suggested by this
paper with the table of the three “generic competitive strategies” and the results of
the analysis of the “flower of competition” is a very good tool for the purpose of
identifying the best suitable strategy for ports in any range in the world.
The present chapter was the final part of the process of the analysis of the container
port competition and the methodologies for identifying the competitive strategy.
Therefore, the tasks of this paper have been reached and the next pages give the
conclusion of the whole research.

72
CHAPTER 6
6 CONCLUSIONS
Competitive Strategies are the vehicle for managers to take control of the market and
to build a stronger reputation in their environment. The analysis of markets behavior
and competitors is a fascinating subject that requires the analyst to apply economic
concepts, analytical techniques and adapt them to their particular situation.
Therefore, for the purposes of this paper the more useful economic concepts were
those that described the type of competition and the firm’s demand in perfect and
imperfect competition. Furthermore, “Competitive Strategy” 1 was an exceptional
tool for industry and competitor analysis.
This paper described the process of building a competitive strategy for container
ports from the theoretical aspects to the decision of the competitive strategy. The
HLHr was selected as the market to study because it is geographically near, fighting
to serve the same hinterland, but mainly because of the high competitiveness of its
ports. The process was divided into three main parts:
Ø Analysis of the EU market from the political, economic and legal perspectives.
Ø Analysis of the industry and competitor, trends and customer requirements.
Ø Building the competitive strategy for each port in the range.
First of all, the EU had since its creation, made a commitment to create and promote
competition as a source to improve service and product quality. The EU process
suggests that this competitive boom had its beginning in the Treaty of Rome in 1957
when the Union was enlarged to the economic activities which imposed the free
trading of goods, capital and persons which enlarged the hinterland and consequently
the competition between ports.
1 Portler, M. ‘Competitive Strategy’ 1980
73
Moreover, the economic power of the EU is manifested with a stable growth of 2,5%
during the last five years and the biggest GDP in value in the last ten years. Since
container traffic is the industry analyzed the research shows that 82% of the traffic is
generated from/to Germany, the UK, France, Italy and Benelux, which is the
hinterland targeted. The external trade goes from/to NAFTA and DAE which points
out the importance of the ports as catalysts of commercial activities.
Then, the legal implication for the regulation of competition is stated in articles 85
and 86 of the EC competition law and the main efforts to promote competition in the
port industry are contemplated in the “Green Paper”. This covers the necessities to
improve port efficiency and infrastructure, and promotes free and fair port
competition. However, the big issue is the matter of dissatisfaction of competitors in
the sources of port finance that creates distortion in the port industry competition.
Second, the analysis proposed was divided in the development of the container traffic
in Europe, and the competition in the HLHr. In the first place, Europe an
participation in world container traffic has been 23% since 1990 and has had a stable
growth over other economic regions. Also, it was interesting to find out that GDP
and trade in value have a strong correlation (0.99 and 0.98) with container traffic
growth. Furthermore, the forecast built on these economic indicators showing an
impressive growth of 40% for 2005 increasing the market to 65.5 million TEU’s for
Europe and 27.3 million TEU’s for the range. Moreover, the traffic will increase
121%reaching to 87 million TEU’s for Europe and 36.2 million TEU’s for the range.
This market increase requires the starting of competitive moves by the players in
order to get the biggest possible piece of traffic in the most effective way.
The competition in the range was analyzed in three main steps. First, the analysis
reflects that the actual competition in the range is working in ”Oligopolistic
Competition” because 50% of the competitors will keep 70% of the container traffic
and this will continue at least for the next ten years.

74
Next, the “Flower of Competition”
points out that Rotterdam is by far the
leader of the competition followed by
Antwerp. The other four ports show
an equilibrium in competition terms
among them but the distance with the
two biggest is worrying because it is
causing an imperfect competition.
Furthermore, the right side of the graph that represent the “services to ships” shows a
closer distance between competitors which means that high competition is taking
place in this sector of the business mainly because of the transshipment traffic war.
The “questionnaire on competition” shows that the container port industry is in
“transition to maturity”. This is because, players categorized the factors for
competition as most relevant “quality of services” and second “price”. So, according
to customer demands the rule is to provide “the best quality at the lower price”.
The last part of the analysis suggests the best competitive strategy for each port.
Furthermore, considering “quality of services to ships” (shipowners related) and the
“quality of services to cargo” (shippers related), the ports were classified in four
categories which were linked to the competitive strategy (Figure 14 p.60).
Moreover, the assessed according to
the two main factors shows that the
tendency is that Rotterdam has the
characteristics to become the network
port without to much competition.
However, the competition to become the transshipment port is very high because
Bremerhaven, Zeebrugge and Le Havre are qualified to run for this classification.
Antwerp has the characteristics to be a direct call and Hamburg is running the danger
of becoming a feeder port according to its characteristics, which are relative to the
other players in the range.

75
Therefore, the best suitable competitive strategy for Rotterdam is “overall cost
leadership”, so it has to try to attack those factors where they are weak and continue
to grow based on innovation and anticipation of customer requirements. For
Bremerhaven, Le Havre and Zeebrugge the strategy is “differentiation”, so they have
to create the best environment possible for shipping lines in order to be recognized as
the best ship oriented. Finally, the strategy for Antwerp and Hamburg is “focus”,
however, Antwerp must be oriented to produce their own cargo and be attractive for
shippers and Hamburg must be oriented in a different segment of the traffic such as
fur Scandinavia and the Baltic States.
All in all, the picture of the future in the Hamburg-Le Havre range is quite clear with
high throughputs, “oligopolistic competition”, container port industry in “transition
to maturity”, “few shipping liners calling few ports”, and customers requiring
commercial availability, no physical constraints, high productivity, and mainly
effective “inland transport networks”.
Undoubtedly the competition will be very tough. However, this competition will be
divided into two segments, the first being the competition for shippers and the
second for shipowners. Rotterdam will be competing in both segments, Antwerp and
Hamburg will be competing for shippers and Zeebrugge and Bremerhaven will be
fighting for transshipment cargo. If, Le Havre does not make radical changes in its
management style it will be entirely out of the competition in the range.
The trend and customer requirements will turn the balance in favor of ship oriented
ports; therefore, there will be in the future one transshipment port in the north of the
range (Bremerhaven), one in the south (Zeebrugge) and one in the center
(Rotterdam). However, the success key for Bremerhaven and Zeebrugge is to deploy
an efficient inland transport network, to get cooperation agreements with Hamburg
and Antwerp respectively, and to perform their “competitive strategy” based on
systematic industrial and competitor analysis.

76
BIBLIOGRAPHY
Alderton, P M (1995). Sea Transport, (5th ed.). UK: Thomas reed Publications.
Anderson, D, Sweeney, D and Williams, T (1993). Statistics for Business and
economics, (5th ed.). USA: West Publishing Company.
Beardshaw, J (1984). Economics: a student´s guide. London: Pitman.
Begg, D, Fisher, S and Dornbusch, R (1991). Economics, (3rd ed.). London:
McGraw-Hill Book Company.
Besanko, D, Dranove, D and Shanley, M (1996). Economics of Strategy. USA: John
Wiley & Sons, Inc.
Chen, T (1989). 'Land utilization in the container terminal'. Maritime policy and
management, Vol. 25, No 4, pp 286 - 303.
Cowell, D W (1984). The Marketing of Services. Oxford: Heinemann Professional
Publishing Ltd.
Craven, J (1990). Introduction to Economics, (2nd ed.). USA: Basil Blackwell.
European Commission (1998). EC Economic Data Pocket Book. (European
Communities Report No 5). Luxembourg: Office for Official Publications of the EC.
European Commission (1997). Eurostat Yearbook ´97, A statistical eye on Europe
1986-1996. (3rd ed. Theme 1. General Statistics, Series A: Yearbooks and yearly
statistics). Luxembourg: Office for Official Publications of the EC.
77
European Commission (1997). External and intra-European Union Trade,
Statistical yearbook 1958-1996. (Theme 6: Foreign trade, Series A: Yearbooks and
yearly statistics). Luxembourg: Office for Official Publications of the EC.
European Commission (1997). The economic accounts of the European Union-1996.
(Eurostat and the Statistical Institutes of the Member States Single Volume).
Luxembourg: Office for Official Publications of the EC.
Fleming, D K (1997). 'World container port rankings'. Maritime policy and
management, Vol. 24, No 2, pp 175 - 181.
Fontaine, P (1995). Europe in Ten Points. (European Documentation series, 2nd
ed.). Luxembourg: Office for Official Publications of the EC.
Francou, B (1998). 'Competition and complementary in the European Ports'.
Reading material. Cret-Log, France and WMU, Sweden.
Haezendonck, E, Coeck, C and Verbeke, A (1999). 'Value Added Analysis as a tool
for strategic Port planning'. PIANC bulletin, No 100, pp 60 - 67.
Information Guide (1994). Doing business in the European Community.
(Information Guide Series). USA: Price Waterhouse.
ISL (1998). Shipping Statistics Yearbook 1998. Bremen: Institute of Shipping
Economics and Logistics.
Korah, V (1994). EC Competition Law and Practice, (5th ed.). London: Sweet &
Maxwell.

78
Lambert, M (1998). 'World container port traffic league'. Containerisation
International Yearbook. pp 8 – 12
Marrus, S K (1984). Building the Strategic Plan. USA: John Wiley & Sons, Inc.
McDonald, M (1989). Marketing Plans, (2nd ed.). Oxford: Heinemann Professional
Publishing Ltd.
Pallis, A A (91997). 'Towards a common ports policy?'. Maritime policy and
management, Vol. 24, No 4, pp 365 - 380.
Porter, M E (1980). Competitive Strategy. New York: Macmillan Publishing, Inc.
Samuelson, P and Nordhaus, W (1985). Economics, (12th ed.). Singapore:
MacGraw-Hill, Inc.
Stopford, M (1997). Maritime Economics, (2nd ed.). London and New York:
Routledge.
Suykens, F and Van de Voorde, E (1989). 'A quarter of century of port management
in Europe'. Maritime policy and management, Vol. 25, No 3, pp 251 - 261.
World Trade Organisation. World imports of commercial services by selected region
and economy, 1985, 1990, 1995, 1996 and 1997. http://WTOservicee.xls imports
(20.04.99), 1999.
World Trade Organisation. World trade Growth accelerated in 1997, despite turmoil
in some Asian Financial markets. http://www.wto.org/wto/intltrad/internat.htm
(4.20.99), 1999.

79
APPENDIX I
Traffic forecast for Europe and the Hamburg-Le Havre range
1. Traffic forecast for Europe
The forecast was done taken into consideration the GDP in million ECU and the
projections of annual growth of 2.5% made by WEFA and the trade in value with
figures and projections of annual growth 3.5% made of by EUROSTAT for the next
ten years
Strong correlation was founded between these two economic indicators and the
increase of container traffic in Europe.
Correlation = 0.99 EU GDP Vs. Container Traffic
Correlation = 0.97 EU Trade in Value Vs. Container Traffic
The figures of the economic indicators were projected using the growth forecasted by
WEFA and EUROSTAT respectively and for the projections of traffic was done
using the TIME SERIES analysis. Finally, from the results of the projections of both
economic indicators an average was calculated which is the best approach to the
forecast of the container traffic.
Year EU GDP Growth EU trade in value Growth Througput of TEU Growth Througput of TEU Growth Througput of TEU Growthmill ECU % mill ECU % Europe GDP % Europe Trade % GDP + Trade %
1991 5,645,100 2,517,454,000 23,063,000 23,063,000 23,063,0001992 5,884,500 4.2 2,547,265,000 1.2 24,477,000 6.1 24,477,000 6.1 24,477,000 6.1
1993 5,902,700 0.3 2,507,166,000 -1.6 26,012,000 6.3 26,012,000 6.3 26,012,000 6.3
1994 6,192,100 4.9 2,801,106,000 11.7 28,333,000 8.9 28,333,000 8.9 28,333,000 8.9
1995 6,434,300 3.9 3,105,431,000 10.9 30,451,000 7.5 30,451,000 7.5 30,451,000 7.5
1996 6,764,900 5.1 3,273,517,000 5.4 32,582,570 7.0 32,582,570 7.0 32,582,570 7.0
1997 6,940,780 2.6 3,444,540,551 5.2 36,000,000 10.5 36,000,000 10.5 36,000,000 10.5
1998 7,114,300 2.5 3,565,099,471 3.5 39,371,564 9.4 39,371,564 9.4 39,371,564 9.4
1999 7,292,157 2.5 3,689,877,952 3.5 42,827,418 8.8 42,030,643 6.8 42,429,030 7.8
2000 7,474,461 2.5 3,819,023,681 3.5 46,369,668 8.3 45,336,395 7.9 45,853,031 8.1
2001 7,661,322 2.5 3,952,689,509 3.5 50,000,474 7.8 48,388,814 6.7 49,194,644 7.3
2002 7,852,855 2.5 4,091,033,642 3.5 53,722,050 7.4 51,794,066 7.0 52,758,058 7.2
2003 8,049,177 2.5 4,234,219,820 3.5 57,536,666 7.1 55,154,519 6.5 56,345,593 6.8
2004 8,250,406 2.5 4,382,417,513 3.5 61,446,647 6.8 58,741,900 6.5 60,094,273 6.7
2005 8,456,666 2.5 4,535,802,126 3.5 65,454,377 6.5 62,381,972 6.2 63,918,174 6.4
2006 8,668,083 2.5 4,694,555,201 3.5 69,562,301 6.3 66,198,019 6.1 67,880,160 6.2
2007 8,884,785 2.5 4,858,864,633 3.5 73,772,923 6.1 70,115,249 5.9 71,944,086 6.0
2008 9,106,905 2.5 5,028,924,895 3.5 78,088,810 5.9 74,191,166 5.8 76,139,988 5.8
2009 9,334,577 2.5 5,204,937,266 3.5 82,512,595 5.7 78,395,352 5.7 80,453,974 5.7
2010 9,567,942 2.5 5,387,110,071 3.5 87,046,974 5.5 82,756,276 5.6 84,901,625 5.5
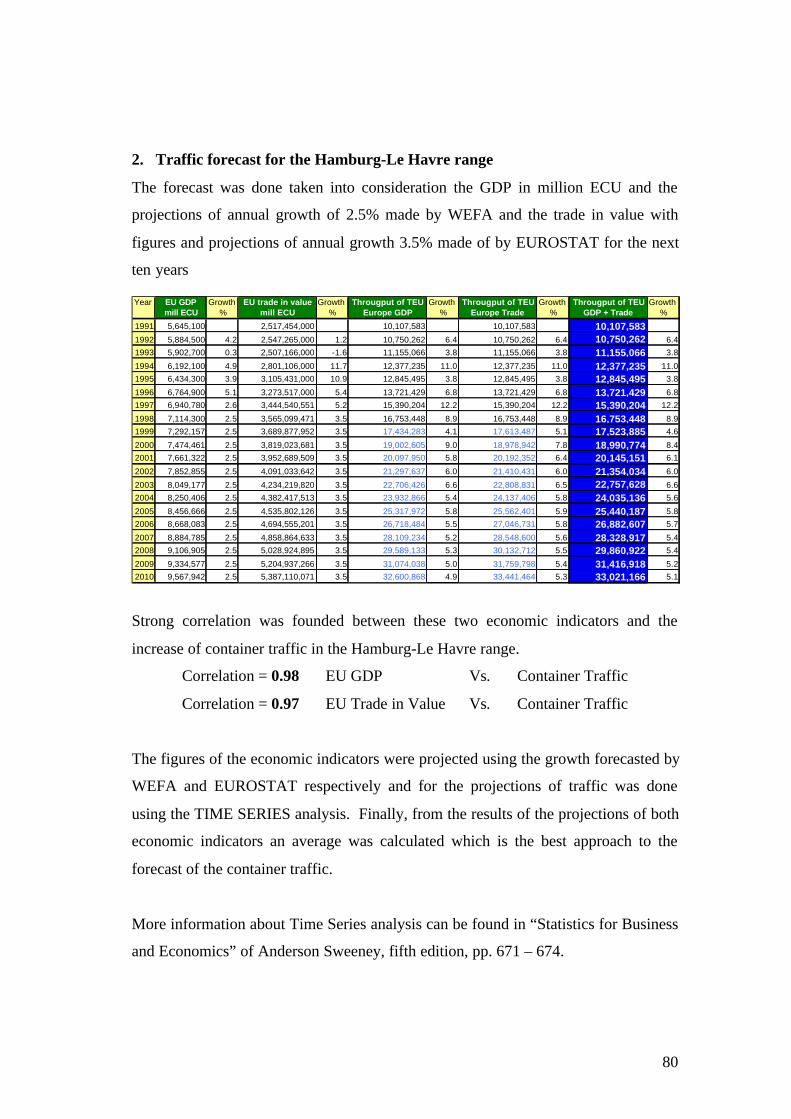
80
2. Traffic forecast for the Hamburg-Le Havre range
The forecast was done taken into consideration the GDP in million ECU and the
projections of annual growth of 2.5% made by WEFA and the trade in value with
figures and projections of annual growth 3.5% made of by EUROSTAT for the next
ten years
Strong correlation was founded between these two economic indicators and the
increase of container traffic in the Hamburg-Le Havre range.
Correlation = 0.98 EU GDP Vs. Container Traffic
Correlation = 0.97 EU Trade in Value Vs. Container Traffic
The figures of the economic indicators were projected using the growth forecasted by
WEFA and EUROSTAT respectively and for the projections of traffic was done
using the TIME SERIES analysis. Finally, from the results of the projections of both
economic indicators an average was calculated which is the best approach to the
forecast of the container traffic.
More information about Time Series analysis can be found in “Statistics for Business
and Economics” of Anderson Sweeney, fifth edition, pp. 671 – 674.
Year EU GDP Growth EU trade in value Growth Througput of TEU Growth Througput of TEU Growth Througput of TEU Growthmill ECU % mill ECU % Europe GDP % Europe Trade % GDP + Trade %
1991 5,645,100 2,517,454,000 10,107,583 10,107,583 10,107,5831992 5,884,500 4.2 2,547,265,000 1.2 10,750,262 6.4 10,750,262 6.4 10,750,262 6.4
1993 5,902,700 0.3 2,507,166,000 -1.6 11,155,066 3.8 11,155,066 3.8 11,155,066 3.8
1994 6,192,100 4.9 2,801,106,000 11.7 12,377,235 11.0 12,377,235 11.0 12,377,235 11.0
1995 6,434,300 3.9 3,105,431,000 10.9 12,845,495 3.8 12,845,495 3.8 12,845,495 3.8
1996 6,764,900 5.1 3,273,517,000 5.4 13,721,429 6.8 13,721,429 6.8 13,721,429 6.8
1997 6,940,780 2.6 3,444,540,551 5.2 15,390,204 12.2 15,390,204 12.2 15,390,204 12.2
1998 7,114,300 2.5 3,565,099,471 3.5 16,753,448 8.9 16,753,448 8.9 16,753,448 8.9
1999 7,292,157 2.5 3,689,877,952 3.5 17,434,283 4.1 17,613,487 5.1 17,523,885 4.6
2000 7,474,461 2.5 3,819,023,681 3.5 19,002,605 9.0 18,978,942 7.8 18,990,774 8.4
2001 7,661,322 2.5 3,952,689,509 3.5 20,097,950 5.8 20,192,352 6.4 20,145,151 6.1
2002 7,852,855 2.5 4,091,033,642 3.5 21,297,637 6.0 21,410,431 6.0 21,354,034 6.0
2003 8,049,177 2.5 4,234,219,820 3.5 22,706,426 6.6 22,808,831 6.5 22,757,628 6.6
2004 8,250,406 2.5 4,382,417,513 3.5 23,932,866 5.4 24,137,406 5.8 24,035,136 5.6
2005 8,456,666 2.5 4,535,802,126 3.5 25,317,972 5.8 25,562,401 5.9 25,440,187 5.8
2006 8,668,083 2.5 4,694,555,201 3.5 26,718,484 5.5 27,046,731 5.8 26,882,607 5.7
2007 8,884,785 2.5 4,858,864,633 3.5 28,109,234 5.2 28,548,600 5.6 28,328,917 5.4
2008 9,106,905 2.5 5,028,924,895 3.5 29,589,133 5.3 30,132,712 5.5 29,860,922 5.4
2009 9,334,577 2.5 5,204,937,266 3.5 31,074,038 5.0 31,759,798 5.4 31,416,918 5.2
2010 9,567,942 2.5 5,387,110,071 3.5 32,600,868 4.9 33,441,464 5.3 33,021,166 5.1

81
APPENDIX II
Factors for Competition
The “Flower of Competition” was build with seven factors that are very important
for the competition in the Hamburg-Le Havre range.
Each factor was ranked using a scale
from 1 to 10. For instance, the
distance to main industrial zones the
minor average was awarded with 10
points and the biggest one with 1 the
rest was distributed according to the
frequency as is shown in the figure.
1. LOCATION. In this case two elements where taken into consideration:
Ø Distance from ports to main Industrial Zones
Ø Distance from the main routes (fairways) to the entrance of the port.
526 to 548 10548 to 570 9570 to 592 8592 to 614 7614 to 636 6636 to 658 5658 to 680 4680 to 702 3702 to 724 2724 to 746 1
Distribution of point for average distance
Cities Hamburg Bremen Rotterdam Antwerp Zeebrugge Le HavreBerlin 289 312 610 632 759 948London 990 631 319 316 190 221Brussels 600 391 119 41 130 337Prague 630 511 729 720 848 1031Amsterdam 440 276 56 130 210 459Dusseldorf 338 241 174 164 294 511Paris 920 651 373 302 254 178Frankfurt 490 336 357 323 443 611Zurich 932 632 586 523 604 667Munich 782 581 662 621 732 855Milan 1200 842 796 730 798 817Linz 661 657 808 779 899 1041Vien 950 758 946 924 1047 1199Budapest 1211 971 1176 1156 1279 1430AVERAGE 745 556 551 526 606 736
Distance in Km to main industrial zones in Europe
Ports Dist to IZ Points Dist to FW Points TOTAL
Hamburg 745 1 100 1 1
Bremen 556 9 25 8 8.5
Rotterdam 551 9 0 10 9.5
Antwerp 526 10 70 4 7
Zeebrugge 606 7 0 10 8.5
Le Havre 736 1 12 9 5
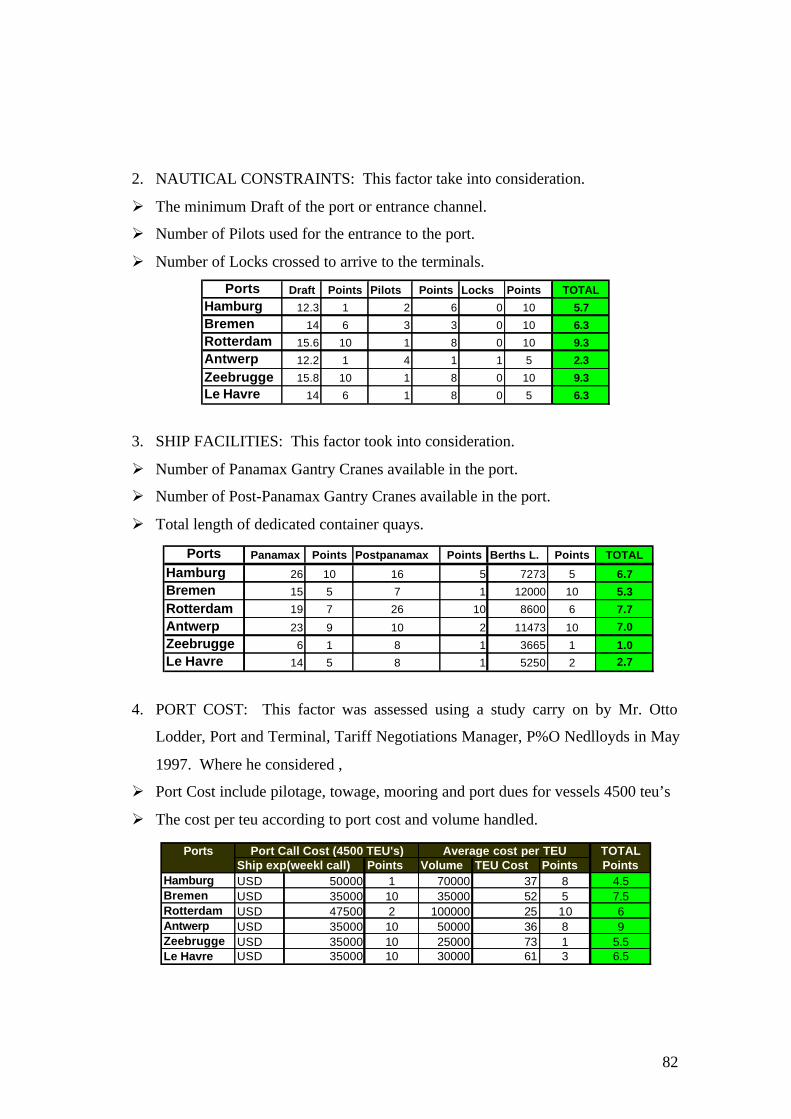
82
2. NAUTICAL CONSTRAINTS: This factor take into consideration.
Ø The minimum Draft of the port or entrance channel.
Ø Number of Pilots used for the entrance to the port.
Ø Number of Locks crossed to arrive to the terminals.
3. SHIP FACILITIES: This factor took into consideration.
Ø Number of Panamax Gantry Cranes available in the port.
Ø Number of Post-Panamax Gantry Cranes available in the port.
Ø Total length of dedicated container quays.
4. PORT COST: This factor was assessed using a study carry on by Mr. Otto
Lodder, Port and Terminal, Tariff Negotiations Manager, P%O Nedlloyds in May
1997. Where he considered ,
Ø Port Cost include pilotage, towage, mooring and port dues for vessels 4500 teu’s
Ø The cost per teu according to port cost and volume handled.
Ports Draft Points Pilots Points Locks Points TOTALHamburg 12.3 1 2 6 0 10 5.7Bremen 14 6 3 3 0 10 6.3Rotterdam 15.6 10 1 8 0 10 9.3Antwerp 12.2 1 4 1 1 5 2.3
Zeebrugge 15.8 10 1 8 0 10 9.3Le Havre 14 6 1 8 0 5 6.3
Ports Panamax Points Postpanamax Points Berths L. * Points TOTAL
Hamburg 26 10 16 5 7273 5 6.7Bremen 15 5 7 1 12000 10 5.3
Rotterdam 19 7 26 10 8600 6 7.7
Antwerp 23 9 10 2 11473 10 7.0
Zeebrugge 6 1 8 1 3665 1 1.0Le Havre 14 5 8 1 5250 2 2.7
Ports TOTALShip exp(weekl call) Points Volume TEU Cost Points Points
Hamburg USD 50000 1 70000 37 8 4.5Bremen USD 35000 10 35000 52 5 7.5Rotterdam USD 47500 2 100000 25 10 6Antwerp USD 35000 10 50000 36 8 9Zeebrugge USD 35000 10 25000 73 1 5.5Le Havre USD 35000 10 30000 61 3 6.5
Average cost per TEUPort Call Cost (4500 TEU's)

83
5. DISTRIBUTION COST: This factor was also assessed using the same study
made by Mr. Otto Lodder. Here was analyzed the cost of distribution to eight
industrial zones. The prices are in USD.
6. CARGO SERVICES: This factor took into consideration the square meters of
warehouse available in the port for logistics purposes.
7. ADDED VALUE: The assessment of this factor was according to “Value Added
Analysis (VAA) as a tool for Strategic Planning” from the University of
Antwerp.
Zones Hamburg Bremerhaven Rotterdam Antwerp Zeebrugge Le HavreParis 900 900 655 550 550 330 Ports Cost USD PointsDuisburg 300 300 250 263 400 400 Hamburg 509 1Milan 750 650 250 425 450 625 Bremen 509 1Vienna 450 550 550 500 500 500 Rotterdam 382 10Riga 350 350 225 400 400 450 Antwerp 417 8Gotemb 425 425 500 450 470 470 Zeebrugge 446 5Belfast 450 450 250 325 450 275 Le Havre 441 6Lisbon 450 450 375 425 350 475Average 509 509 382 417 446 441
Distribution cost
Ports Space Points
Hamburg 3350 8
Bremen 1500 3
Rotterdam 3000 7
Antwerp 4500 10
Zeebrugge 250 1
Le Havre 1000 3
Warehouses in sqm
Ports Index PointsHamburg 0.54 3Bremen 0.30 1Rotterdam 1.54 10
Antwerp 1.00 6Zeebrugge 0.44 2Le Havre 0.27 1
Value Added meassure in tonnes value
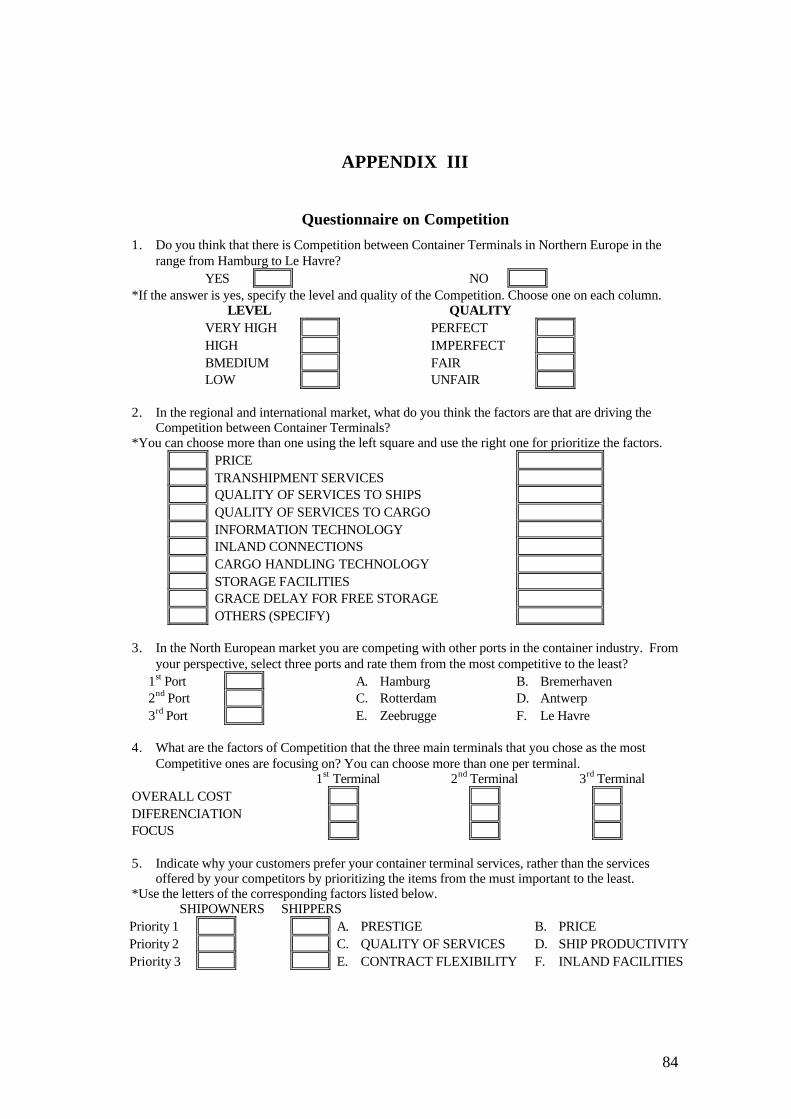
84
APPENDIX III
Questionnaire on Competition
1. Do you think that there is Competition between Container Terminals in Northern Europe in therange from Hamburg to Le Havre?
YES NO*If the answer is yes, specify the level and quality of the Competition. Choose one on each column.
LEVEL QUALITYVERY HIGH PERFECTHIGH IMPERFECTBMEDIUM FAIRLOW UNFAIR
2. In the regional and international market, what do you think the factors are that are driving theCompetition between Container Terminals?
*You can choose more than one using the left square and use the right one for prioritize the factors.PRICETRANSHIPMENT SERVICESQUALITY OF SERVICES TO SHIPSQUALITY OF SERVICES TO CARGOINFORMATION TECHNOLOGYINLAND CONNECTIONSCARGO HANDLING TECHNOLOGYSTORAGE FACILITIESGRACE DELAY FOR FREE STORAGEOTHERS (SPECIFY)
3. In the North European market you are competing with other ports in the container industry. Fromyour perspective, select three ports and rate them from the most competitive to the least?
1st Port A. Hamburg B. Bremerhaven2nd Port C. Rotterdam D. Antwerp3rd Port E. Zeebrugge F. Le Havre
4. What are the factors of Competition that the three main terminals that you chose as the mostCompetitive ones are focusing on? You can choose more than one per terminal.
1st Terminal 2nd Terminal 3rd TerminalOVERALL COSTDIFERENCIATIONFOCUS
5. Indicate why your customers prefer your container terminal services, rather than the servicesoffered by your competitors by prioritizing the items from the must important to the least.
*Use the letters of the corresponding factors listed below.SHIPOWNERS SHIPPERS
Priority 1 A. PRESTIGE B. PRICEPriority 2 C. QUALITY OF SERVICES D. SHIP PRODUCTIVITYPriority 3 E. CONTRACT FLEXIBILITY F. INLAND FACILITIES

85
6. In your perspective, why do the competitor’s customers prefer their services instead of becomingyour customers? *Use the letters of the corresponding factors listed below.
SHIPOWNERS SHIPPERSPriority 1 A. PRESTIGE B. PRICEPriority 2 C. QUALITY OF SERVICES D. SHIP PRODUCTIVITYPriority 3 E. CONTRACT FLEXIBILITY F. INLAND FACILITIES
7. Which are the pillars of your success or the base that has placed you in the place that you actuallyhave in the market?
*Use the letters of the corresponding factors listed below.Priority 1 A. EQUIPMENT AND FACILITIES B. MARKETING FORCEPriority 2 C. LAVOUR SKILLS D. PRICE POLICYPriority 3 E. MANAGEMENT STYLE F. TECHNOLOGY AVAILABLE
8. In which areas are your competitors vulnerable?1st Terminal 2nd Terminal 3rd Terminal
PRICEPHYSICAL CONSTRAINQUALITY OF SERVICESINFORMATION TECHNOLOGYINLAND CONNECTIONSCARGO HANDLING TECHNOLOGYSTORAGE FACILITIESGRACE DELAY FOR FREE STORAGE
9. What is you and your competitors' ability to adapt to changed conditions in each functional area?.In particular can you and your competitors adapt to:
Own Terminal 1st Terminal 2nd Terminal 3rd TerminalCOMPETING ON COSTINTRODUCTION OF NEWTECHNOLOGYADDING NEW SERVICESCOMPETING IN SERVICESINTRODUCTION OF NEW COMPETITORSADDING NEW EQUIPMENT
10. Can you and your competitors respond to possible exogenous events such as:Own Terminal 1st Terminal 2nd Terminal 3rd Terminal
A SUSTAINED RATE OF INFLATIONTECHNOLOGICAL CHANGES THATMAKE THE EXISTING CARGO HANDLINGEQUIPMENT OBSOLETEINCREASE OF WAGE RATENEW GOVERNMENTAL REFORMS THATWILL AFFECT THIS BUSINESS
11. Are your competitors satisfied with their current position?1st Terminal 2nd Terminal 3rd Terminal
YESNO

86
12. Taking into consideration the competitors' current position in the market and their goals, are theylikely to attempt to initiate Competitive Strategic moves?
1st Terminal 2nd Terminal 3rd TerminalYESNO
13. Based on the competitors' goals, assumptions and capabilities relative to their existing position,what are the three most probable Competitive Strategic moves that the competitors will make?
*You can choose more than one.1st Terminal 2nd Terminal 3rd Terminal
PRICETRANSHIPMENT SERVICESQUALITY OF SERVICESINFORMATION TECHNOLOGYINLAND CONNECTIONSCARGO HANDLING TECHNOLOGYSTORAGE FACILITIESGRACE DELAY FOR FREE STORAGECREATION OF ADDED VALUEINVEST IN OTHER ACTIVITIESJOINT STOCK HOLDING IN OTHER TERM
14. Do you think that there is Competition between Container Terminals in your port?YES NO
*If the answer is yes, specify the level and quality of the Competition. Choose one on each column.LEVEL QUALITY
VERY HIGH PERFECTHIGH IMPERFECTBMEDIUM FAIRLOW UNFAIR
15. In the local market you are competing with other Container Terminals. From your perspective,select the best three terminals and rate them from the most Competitive to the least?
1st Terminal A. ANTWERP COMBINED TERMINAL B. HESSENATIE2nd Terminal C. MARITIME TERMINALS D. MEXICO NATIE3rd Terminal E. NOORD NATIE TERMINALS F. NOORDZEE TERMINAL
G. SEAPORT TERMINALS H. WESTERLUND
16. What are the attitudes that are driving the goals of the three main Container Terminals in yourport? *You can choose more than one.
1st Terminal 2nd Terminal 3rd TerminalPROFITABILITYMARKET POSITIONRATE OF GROWTHDESIRED LEVEL OF RISKCREATION OF ADDED VALUEOTHERS (SPECIFY)

87
17. What kind of managers comprises the leadership, particularly the Chief Executive officers (CEO),in your terminal and those of the competitors? Use "Own Terminal" only if your terminal is notamong the three main competitors in your port.
Own Terminal 1st Terminal 2nd Terminal 3rd TerminalEXPERIENCEDEXPERIENCED AND TRAINEDTRAINED YOUNG MANAGERS
18. What is the overall importance of your Container Terminal for your company and what is theimportance of your competitors' Container Terminals for their companies?
Own Terminal 1st Terminal 2nd Terminal 3rd TerminalCORE BUSINESSUSED AS ADDED VALUEPART OF THE LOGISTIC SERV.
19. In which areas have you and your competitors starred or succeeded as a company?
Own Terminal 1st Terminal 2nd Terminal 3rd TerminalINTRODUCTION OF NEW TECHNOINNOVATIVE MARKETING TECHNIQREDUCTION OF COSTSINNOVATIVE MANAGEMENTEXPANDING EQUIP AND FACILITIESCAPACITYENLARGE SCOPE OF ACTIVITIESINVEST IN OTHER COMP TERMINAL
20. Are you satisfied with the position that your Container Terminal has in the markets?YES NO
LOCAL MARKETREGIONAL MARKETINTERNATIONAL MARKET
21. Is your company involved in any Competitive Strategy in order to increase your market share?YES NO
*If the answer is yes, select the factors that are part of your Strategy by checking the appropriateboxes on the left, and classify them according to how important they are on the right.
REDUCTION OF OVERALL COSTINCREASING SHIP PRODUCTIVITYINCREASING QUALITY OF SERVICESOFFERING LOGISTIC SERVICESAUTOMATION TECHNOLOGYEXPANDING INLAND CONNECTIONS CAPACITYEXPANDING EQUIPMENT AND FACILITIES CAPACITY
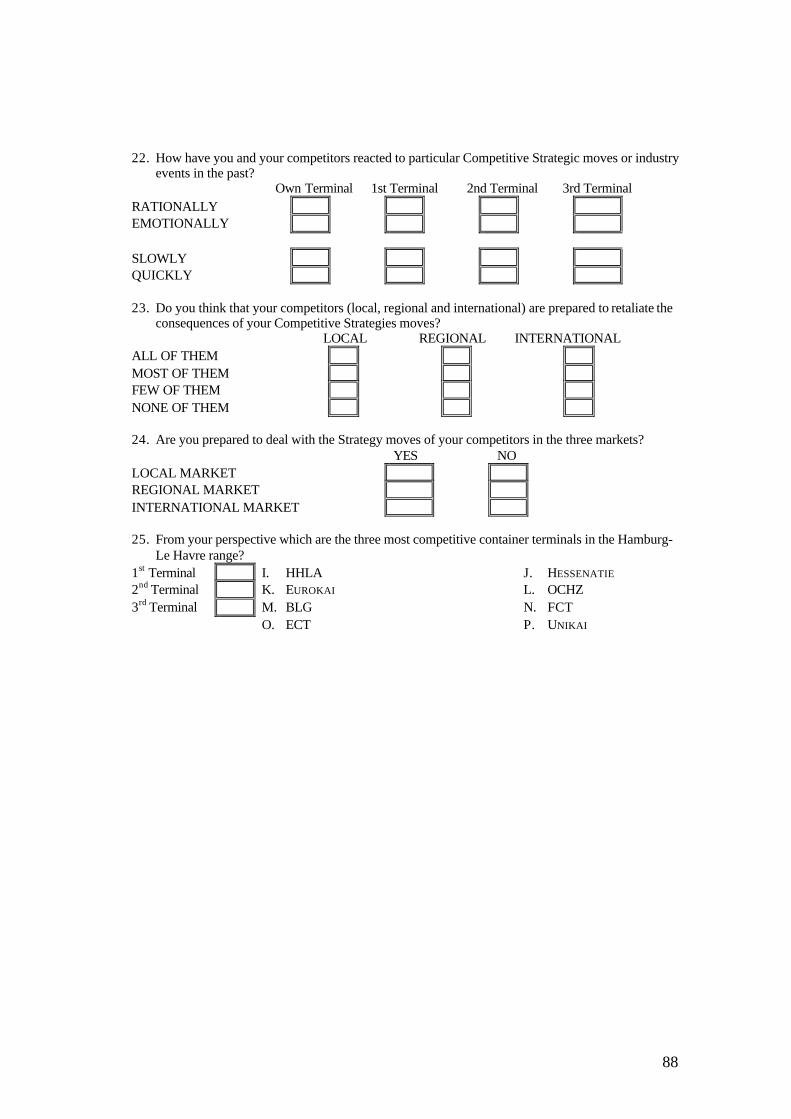
88
22. How have you and your competitors reacted to particular Competitive Strategic moves or industryevents in the past?
Own Terminal 1st Terminal 2nd Terminal 3rd TerminalRATIONALLYEMOTIONALLY
SLOWLYQUICKLY
23. Do you think that your competitors (local, regional and international) are prepared to retaliate theconsequences of your Competitive Strategies moves?
LOCAL REGIONAL INTERNATIONALALL OF THEMMOST OF THEMFEW OF THEMNONE OF THEM
24. Are you prepared to deal with the Strategy moves of your competitors in the three markets?YES NO
LOCAL MARKETREGIONAL MARKETINTERNATIONAL MARKET
25. From your perspective which are the three most competitive container terminals in the Hamburg-Le Havre range?
1st Terminal I. HHLA J. HESSENATIE
2nd Terminal K. EUROKAI L. OCHZ3rd Terminal M. BLG N. FCT
O. ECT P. UNIKAI