Embed Size (px)
Citation preview

TP 14710E
Container Capacity Expansion Plans at Pacific Coast Ports
Prepared for: Policy Research Branch
Strategic Policy Directorate Policy Group
Transport Canada
By: Hanam Canada Corporation
Victoria, BC
January 2007

TP 14710E
Container Capacity Expansion Plans at Pacific Coast Ports
By: Hanam Canada Corporation
1165 Burdett Avenue Victoria, BC, V8V 3H3
250-381-6768 Web: www.hanamcanada.com
Helmut G. Burke, P.Eng., MBA [email protected]
January 2007
Container Capacity Expansion Plans at Pacific Coast Ports Hanam Canada Corporation January 2007
ii
The Directory of Pacific Coast Container Ports, Terminals, and Services (TP 14711E) has been published as a companion document to this report. This report reflects the views of Hanam Canada Corporation only and does not necessarily reflect the official views or policies of Transport Canada. Neither Transport Canada, nor its employees, makes any warranty, express or implied, or assumes any legal liability or responsibility for the accuracy or completeness of any information contained in this report, or process described herein, and assumes no responsibility for anyone's use of the information. Transport Canada is not responsible for errors or omissions in this report and makes no representations as to the accuracy or completeness of the information. Transport Canada does not endorse products or companies. Reference in this report to any specific commercial products, process, or service by trade name, trademark, manufacturer, or otherwise, does not constitute or imply its endorsement, recommendation, or favoring by Transport Canada and shall not be used for advertising or service endorsement purposes. Trade or company names appear in this report only because they are essential to the objectives of the report. References and hyperlinks to external web sites do not constitute endorsement by Transport Canada of the linked web sites, or the information, products or services contained therein. Transport Canada does not exercise any editorial control over the information you may find at these locations. U.S. dollars are used throughout this report except as noted. Une traduction de ce document est également disponible en français : «Plans d’expansion de la capacité en conteneurs des ports de la côte du Pacifique», TP 14710F. © 2007 Transport Canada

Transport Canada
Transports Canada PUBLICATION DATA FORM
1. Transport Canada Publication No.
TP 14710E 2. Project No.
3. Recipient’s Catalogue No.
4. Title and Subtitle
5. Publication Date
January 2007
6. Performing Organization Document No.
7. Author(s)
Helmut G. Burke 8. Transport Canada File No.
9. Performing Organization Name and Address 10. PWGSC File No.
11. PWGSC or Transport Canada Contract No.
T8080-06-0263
12. Sponsoring Agency Name and Address 13. Type of Publication and Period Covered
Final
14. Project Officer
Nick Strizzi
15. Supplementary Notes (Funding programs, titles of related publications, etc.)
Companion document: TP 14711E, Directory of Pacific Coast Container Ports, Terminals, and Services
16. Abstract
17. Key Words
North American Pacific Coast ports, expansion plans, container terminal, shipping
18. Distribution Statement
Available online at www.tc.gc.ca/pol/en/menu.htm
19. Security Classification (of this publication)
Unclassified
20. Security Classification (of this page)
Unclassified
21. Declassification (date)
—
22. No. of Pages
viii, 62
23. Price
Shipping/ Handling
CDT/TDC 79-005 Rev. 96 iii
Container Capacity Expansion Plans at Pacific Coast Ports
Hanam Canada Corporation 1165 Burdett Avenue Victoria, B.C. Canada V8V 3H3
Policy Research Branch Strategic Policy Directorate (Policy Group) Transport Canada, Tower C, Place de Ville 330 Sparks Street, 28th Floor Ottawa, Ontario K1A 0N5
This report provides an overview of expansion plans and issues at all the major container terminals along thePacific Coast of North America. It includes a review of the major trends, forecasts of container trade and capacityto the year 2020, and a competitive analysis. It was prepared over the period November-December 2006 and is based on interviews with representatives of the major shipping companies, railways, container port authorities,terminal operators and other stakeholders.
Key findings include the following:
• Planning is under way for a 53 percent increase in capacity. • Increased trade and larger ships will create attractive expansion opportunities at Delta (BC) and inland. • Containerized imports and exports for Canadian Pacific ports are forecast to grow conservatively to 5.6
million TEUs per year by the year 2020. • Terminals in Delta, Los Angeles (CA) and Long Beach (CA) are the current container market leaders. • Overall the Pacific Coast ports’ plans match forecast growth in container traffic.

Transports Canada
Transport Canada FORMULE DE DONNÉES POUR PUBLICATION
1. No de la publication de Transports Canada
TP 14710E 2. No de l’étude
3. No de catalogue du destinataire
4. Titre et sous-titre
5. Date de la publication
Janvier 2007
6. No de document de l’organisme exécutant
7. Auteur(s)
Helmut G. Burke 8. No de dossier - Transports Canada
9. Nom et adresse de l’organisme exécutant 10. No de dossier - TPSGC
11. No de contrat - TPSGC ou Transports Canada
T8080-06-0263
12. Nom et adresse de l’organisme parrain 13. Genre de publication et période visée
Final
14. Agent de projet
Nick Strizzi
15. Remarques additionnelles (programmes de financement, titres de publications connexes, etc.)
Document d’accompagnement : TP 14711E, Directory of Pacific Coast Container Ports, Terminals, and Services
16. Résumé
17. Mots clés
Ports de la côte du Pacifique de l’Amérique du Nord, plans d’expansion, terminal à conteneurs, transports maritimes
18. Diffusion
Disponible en ligne à www.tc.gc.ca/pol/en/menu.htm
19. Classification de sécurité (de cette publication)
Non classifiée
20. Classification de sécurité (de cette page)
Non classifiée
21. Déclassification (date)
—
22. Nombre de pages
viii, 62
23. Prix
Port et manutention
CDT/TDC 79-005 Rev. 96 iv
Container Capacity Expansion Plans at Pacific Coast Ports
Hanam Canada Corporation 1165 Burdett Avenue Victoria, B.C. Canada V8V 3H3
Direction de la recherche sur les politiques Direction générale des politiques stratégiques (Groupe des politiques) Transports Canada, Tour C, Place de Ville 330, rue Sparks, 28e étage Ottawa (Ontario) K1A 0N5
Ce rapport donne une vue d’ensemble des plans d’expansion et des problèmes qui se posent dans tous les principaux terminaux à conteneurs situés le long de la côte du Pacifique de l’Amérique du Nord. On y trouve un examen des principales tendances, prévisions ainsi que du commerce et de la capacité en conteneurs jusqu’en l’an 2020, et une analyse concurrentielle. Ce rapport a été préparé entre novembre et décembre 2006 et il repose sur des entretiens avec des représentants des principales compagnies maritimes, des chemins de fer, des administrations des ports à conteneurs, des exploitants des terminaux et d’autres intervenants.
Nos principales constatations sont les suivantes :
• On prévoit d’augmenter de 53 pour cent la capacité de ces ports. • Une augmentation des échanges et des navires de plus grandes dimensions présenteront d’intéressantes
possibilités d’agrandissement à Delta (C-B) et dans l’arrière-pays. • On prévoit que les importations et les exportations conteneurisées dans les ports canadiens du Pacifique
augmenteront à 5,6 millions d’EVP par an d’ici à l’an 2020. • Les terminaux de Delta, Los Angeles (CA) et Long Beach (CA) sont actuellement les chefs de file du marché
des conteneurs. • Dans l’ensemble, les plans des ports de la côte du Pacifique cadrent avec la croissance prévue du trafic des
conteneurs.

Container Capacity Expansion Plans at Pacific Coast Ports Hanam Canada Corporation January 2007
v
Contents 1. INTRODUCTION .................................................................................................. 1
1.1 Objectives ................................................................................................... 1 1.2 Scope of report............................................................................................ 1
2. ASIA-PACIFIC CONTAINER TRADE ................................................................ 2
2.1 Asia-Pacific import growth ........................................................................ 2 2.2 Canada’s containerized exports .................................................................. 7 2.3 Shipping company consolidation................................................................ 8 2.4 Larger and more productive terminals...................................................... 12 2.5 Port related wetland restoration ................................................................ 15 2.6 Implications of trends for British Columbia ............................................. 17
3. PACIFIC CONTAINER TERMINAL PLANS & ISSUES ................................. 18
3.1 Vancouver ................................................................................................. 21 3.2 Delta and Surrey ....................................................................................... 26 3.3 Prince Rupert ............................................................................................ 31 3.4 Seattle, Tacoma and Portland ................................................................... 33 3.5 Oakland ..................................................................................................... 36 3.6 Long Beach and Los Angeles ................................................................... 38 3.7 Manzanillo, Lazaro Cardenas, and Ensenada ........................................... 40 3.8 Balboa (Panama)....................................................................................... 42
4. ASSESSMENT OF COMBINED EXPANSION PLANS ................................... 44
4.1 Container growth forecast......................................................................... 44 4.2 Demand-capacity analysis ........................................................................ 47 4.3 Container market share analysis ............................................................... 48 4.4 Employment impacts of port expansion ................................................... 50 4.5 Container terminal management ............................................................... 51 4.6 Container terminal competitiveness.......................................................... 53
5. FINANCING PORT EXPANSION PLANS........................................................ 56
5.1 Financial performance .............................................................................. 56 5.2 Sources of port investments ...................................................................... 57
6. CONCLUSIONS................................................................................................... 61

Container Capacity Expansion Plans at Pacific Coast Ports Hanam Canada Corporation January 2007
vi
List of Exhibits Exhibit 1 Value of North American container trade 2006.......................................... 2 Exhibit 2 Top 15 container ports in Asia Pacific region 2005 ................................... 3 Exhibit 3 Containerized imports in North America 2006........................................... 5 Exhibit 4 Principal destinations of containers in 2005 ............................................... 6 Exhibit 5 Inbound, outbound and empty containers in North America..................... 7 Exhibit 6 Containerized exports from North America 2006 ...................................... 8 Exhibit 7 Shipping companies served by Pacific Coast ports .................................... 9 Exhibit 8 Shipping services or routes to BC ports in 2006 ...................................... 10 Exhibit 9 Trends in container ship sizes in 2006...................................................... 11 Exhibit 10 Productivity comparisons 2006................................................................. 13 Exhibit 11 Container storage capacity 2006............................................................... 15 Exhibit 12 Implications of Asia-Pacific container trends for BC............................... 17 Exhibit 13 Terminal operators and ports .................................................................... 19 Exhibit 14 Pacific coast container port expansion plans ............................................ 20 Exhibit 15 Map of Vancouver container terminals and railroads............................... 22 Exhibit 16 CP, CN and BNSF Rail Yards .................................................................. 22 Exhibit 17 CP Rail N Yard and nearby BNSF Barge Slip ........................................ 23 Exhibit 18 Map of Delta and Surrey terminals and railways...................................... 26 Exhibit 19 Deltaport 3rd Berth Project 2009 ............................................................... 28 Exhibit 20 Roberts Bank Terminal 2 .......................................................................... 29 Exhibit 21 Aerial photo of Seattle container terminals .............................................. 33 Exhibit 22 Port of Oakland Berth 21 Project.............................................................. 37 Exhibit 23 Graph of container freight growth by region ............................................ 44 Exhibit 24 Container freight volume and growth forecasts........................................ 46 Exhibit 25 Planned capacity and growth of container business ................................. 48 Exhibit 26 World and Pacific Coast container market size and share........................ 49 Exhibit 27 Port related employment 2005 .................................................................. 51 Exhibit 28 Terminal business dominance- % market share 2006............................... 52 Exhibit 29 Shipping prices per forty foot imported container.................................... 54 Exhibit 30 Financial results for Pacific coast ports in 2005 ....................................... 56 Exhibit 31 Sources of port investments ...................................................................... 58
Container Capacity Expansion Plans at Pacific Coast Ports Hanam Canada Corporation January 2007
vii
Executive Summary This report provides an overview of expansion plans and issues at all the major container terminals along the Pacific Coast of North America. It includes a review of the major trends, forecasts of container trade and capacity to the year 2020, and a competitive analysis. It was prepared over the period November to December 2006 based upon interviews with representatives of the major shipping companies, railways, container port authorities, terminal operators and other stakeholders. Our key findings are: 1. Planning is underway for a 53% increase in capacity.
The 12 ports and 14 operators of 37 container terminals in the study area plan 55 expansion projects to handle 22 million twenty foot equivalent units per year with an investment of $6.8 billion.
2. Increased trade, larger ships will create attractive expansion opportunities at
Delta and inland • Increasing Asia Pacific imports • Increased containerization of Canada’s bulk exports • Shipping companies are consolidating and using larger ships • Terminals are becoming larger, more productive • Leading ports are restoring wetlands • Expansions at Roberts Bank will be fully utilized • Increased opportunities for forest and agricultural products shipped in containers. • Greater water depth, increased dock storage, and larger rail yards are needed. • Rail overpasses near Deltaport would be useful. • Small terminals face competitive challenges. • There may be similar opportunities in Delta.
3. Containerized imports and exports for Canadian Pacific ports are forecast to
grow conservatively to 5.6 million TEUs per year by the year 2020
Canada’s Pacific Coast container terminals 1000 TEUs per year IMPORTS EXPORTS EMPTIES TOTAL Furniture & bedding 380 Pulp, paper & waste paper 290 Machinery & parts 180 Lumber & wood products 160 Toys, games & sports equip. 120 Agricultural crops 90 Home & building products 100 Metals & metal scrap 80 Electronic & electrical equip. 60 Pet & animal feed 70 Other 260 Other 180 Total 2006 1,100 870 330 2,300 2010 1,500 1,200 400 3,100 2020 2,700 2,300 600 5,600
Container Capacity Expansion Plans at Pacific Coast Ports Hanam Canada Corporation January 2007
viii
4. Terminals in Delta, Los Angeles and Long Beach are the current container market leaders. • Highest productivity per terminal, berth and crane. • California ports creating new wetlands, parks, and public waterfront access. • Most efficient rail and truck access. • Congestion mitigation policies- Reduced gate fees and bonuses in Los Angeles
and Long Beach encourage container transport and receiving during off-peak hours.
• About 5 % lower local delivered costs- about $2,100 per 40-foot container. • Information suggestions that Delta has the lowest delivered costs from Shanghai
to Chicago or Toronto- $3,600 per 40-foot container. • Container export costs are competitive with traditional bulk shipments due to low
back-rates. • Most competition between CN, CP, BNSF and UP Railways.
5. Overall the Pacific Coast ports’ plans match forecast growth in container traffic.
OVERALL PLANS 22 Million TEUs/year $6.8 Billion CANADA PLANS Deltaport Berth 3 0.6 Million TEUs/year $0.3 Billion Roberts Bank Terminal 2 1.9 Million TEUs/year $0.9 Billion Rail corridor Grade separations To be determined
6. Large new terminal expansions can be financed and likely will be constructed
• High lease rates are achievable from major shipping companies. • Rail overpasses have been financed in the US with federal loan guarantees and
user fees of $30 per 40-foot container.
Container Capacity Expansion Plans at Pacific Coast Ports Hanam Canada Corporation January 2007
1
1. INTRODUCTION
1.1 Objectives
This report was prepared for the Policy Research Branch of Transport Canada in Ottawa. The objectives of this study were to:
• Determine the size and scale of planned expansion (in twenty foot equivalent
units or TEUs) at major Pacific container ports in Canada, the United States, Mexico and Panama and to identify significant development issues.
• Provide detailed data and analysis of container ports for research, competitive
analysis, and monitoring to assist Transport Canada’s understanding of market, infrastructure, port expansion, gateway and trade corridor issues.
1.2 Scope of report
We compiled a list of stakeholder groups and have included them in a separate Directory of Pacific Coast Container Ports, Terminals and Services (TP 14711E). The Directory includes contacts, detailed descriptions and pictures of each port and terminal. We gathered information on overall container trade and economic trends from published reports, port and company websites. We interviewed representatives of 21 container shipping lines calling on the Pacific coast and many of the terminal, railway and Port representatives. We also obtained information from shippers, trans-load facilities, container yard operators, trucking companies, freight forwarders, and major labour unions.
We prepared a forecast of container shipments by port and by terminal to 2010 and 2020. We used data from our directory and an MS Excel model to compare productivity, competitiveness, and analyze the corporate relationships at all Pacific coast ports. We also compiled the public financial statements of the US and Canadian ports and compared how container port and infrastructure expansions are financed by jurisdiction.
Some of the market intelligence was provided by Clarkson Research Services Ltd., London England. Founded in 1852, Clarkson is one of the world’s largest shipping services groups through its network of 14 offices throughout the world. Following the international norm, all values reported in this study are in US dollars unless otherwise noted.
We gratefully acknowledge information and assistance received from Nick Strizzi, Senior Economist, Strategic Policy, Policy Branch, Transport Canada, Ottawa, who was the Project Manager and our primary contact for this project.

Container Capacity Expansion Plans at Pacific Coast Ports Hanam Canada Corporation January 2007
2
2. ASIA-PACIFIC CONTAINER TRADE
2.1 Asia-Pacific import growth
A dramatic increase in trade is shifting economic dominance to the Asia-Pacific Region. Container shipping worldwide increased on average 10.4% per year between 1995 and 2005 double the 5.4% rate of growth for the world economy as a whole.1 The total value of container trade is about $ US 413 billion for the US, $US 45 billion for Canada and $US 19 billion for Mexico as shown in Exhibit 1. Containerized imports are growing at 9.4% per year and containerized exports are growing at a rate of 7.0% per year for these three countries.
Exhibit 1 Value of North American container trade 2006 United States Canada Mexico Overall Growth
5 Year Trend $ Billion $ Billion $ Billion % Total exports 1,008 347 189 8.8 Container exports 161 20 5 7.0 % 16 6 3 Total imports 1,931 301 247 8.6 Container imports 252 25 14 9.4 % 13 8 6 Total Trade 2,929 648 436 Container Trade 413 45 11 % 14 7 3
Source: Clarkson Research Ltd. Note: US dollars are used throughout this report except as noted.
The US, Canada and Mexico each import about five times more in dollar value from China as they export. In 2004, the US imported $245 billion worth of goods from China but sold China goods worth only $ 41 billion in return.2 In 2005, Canada imported $30 billion worth of goods but exported only $7 billion to China.3 The trade deficit is similar in Mexico, where imports in 2004 were $9.1 billion but exports were only $1.9 billion.
World port traffic is made up of 45% liquid bulk (oil, petroleum products, chemicals), 23% dry bulk (coal, iron ore, grain, phosphate) and 32% general cargo most of which is containerized.4 Global container traffic is distributed as follows: Far East 45%, Europe 23%, North America 16%, Middle East 6%, Central and South America 4%, and Africa, 3%. Containerization of trade goods has progressed steadily over the past 20 years and is expected to continue.
1 Clarkson Research Ltd., Container Intelligence Quarterly, 4th Quarter 2006, London, UK. 2 William Hawkins, American Economic Alert, July 18, 2006 www.americaneconomicalert.org 3 CBC News, April, 3, 2006. www.cbc.ca 4 The World Bank Group, Ports & Logistics Overview, 2002.
www.worldbank.org/html/fpd/transport/ports_ss.htm

Container Capacity Expansion Plans at Pacific Coast Ports Hanam Canada Corporation January 2007
3
Worldwide 80% of general cargo is shipped in containers. In developed countries, containerization of cargo approaches 100%. In the US about 13% of imports are containerized, in Canada 8% and Mexico 6%.
Most of the recent growth in container traffic volume has been from Shanghai and Shenzhen, China, as shown in Exhibit 2. Trade from more established suppliers including Busan, Korea, Kaohsiung, Taiwan, and Tokyo, Japan also continues to expand in both volume and value.
Exhibit 2 Top 15 container ports in Asia Pacific region 2005
Port Throughput Million TEUs/year
5 Year Growth Trend %
1 Singapore 23.2 6 2 Hong Kong, China 22.4 4 3 Shanghai, China 18.1 26 4 Shenzhen, China 16.2 32 5 Busan, Korea 11.8 9 6 Kaohsiung, Taiwan 9.5 7 7 Qingdao, China 6.3 24 8 Klang, Malaysia 5.5 11 9 Ningbo, China 5.2 42
10 Tianjin, Korea 4.8 23 11 Pelepas, Malaysia 4.2 58 12 Laem Chebang, Thailand 3.8 12 13 Tokyo, Japan 3.6 4 14 Priok, Malaysia 3.2 7 15 Yokohama, Japan 2.9 4
Source: Clarkson Research Ltd.
The largest source of imports is the Asia-Pacific region, accounting for about a third of all goods imported to the Pacific Coast. Five years ago, the main source of imports was Japan but China now accounts for almost half of the imports and Japan has declined to about one quarter. Of the 26 million TEUs handled on the Pacific Coast in 2006, about two thirds originated from Hong Kong, Taiwan and Mainland China.5 Most of the growth in container traffic has been from China. Container shipments from Chinese ports are growing at a rate of 29% per year. Four of China’s major ports Hong Kong, Shanghai, Shenzhen, and Qingdao now each handle more than 20 million TEUs per year.6
Hong Kong and Shanghai are expanding to a capacity of over 30 million TEUs per year. Shanghai is investing $12 billion and this expansion in China is one of the major drivers for the Prince Rupert and Roberts Bank Terminal 2 container expansion projects in BC. Phase One of the Yangshan deep-water port project in Shanghai, completed last December, opened five berths adding 2.2 million TEUs per year of container handling capacity.
Chinese containerized exports of manufactured goods are moving up the value chain by absorbing foreign expertise and technology. For example, China is
5 Norman Stark, President, TSI Terminal Systems Inc., Port Days, Halifax, Sept. 27, 2005. 6 Chris Jones, Railway Association of Canada, Policy Options, Jan. 2006.

Container Capacity Expansion Plans at Pacific Coast Ports Hanam Canada Corporation January 2007
4
expected to gain Canadian and US market share especially in the auto parts market. China has become an integral part of manufacturers’ global supply chains. With the appreciation of the Canadian dollar, Canadian manufacturers with high labor content in their products have experienced lower prices, sales, and profit margins in their domestic markets and are struggling to remain competitive.
Ford Motor Co. recently announced it has doubled its purchases of Chinese made auto components to $2.8 billion for 2007.7 Ford buys about $9 billion in parts in the entire Asia-Pacific region about 10% of its total global parts purchases. Daimler Chrysler expects to increase its Chinese parts imports from $0.1 billion in 2006 to $0.8 billion in 2008. Average manufacturing jobs in China pay about 10% of an equivalent unionized manufacturing job in the US and so Chinese auto parts are helping to reduce US auto manufacturing company losses. Most automobiles imported from Asia are shipped in roll-on roll-off vessels but more automobiles are now being shipped in containers, especially in Europe.
Other Asian cities are also contributing to growth in container shipments. Incheon and Pusan, South Korea, are investing $8.8 billion in port capacity. Singapore is building four new berths capable of an additional 2.0 million TEUs per year. A similar expansion project is underway in Malaysia. Ho Chi Minh City began work this year on a $250 million, 1.5 million TEUs per year terminal to begin operating in 2008.8 India’s economy is also growing strongly and could double its container trade to 10 million TEUs per year by 2010. Asia-Pacific container terminals are being expanded more quickly and at much larger scale increments than North American receiving terminals.
More than half of Canadian retail imports originate from the Asia-Pacific region. Roughly 70,000 – half of Canada’s small merchants – import the majority of their products from Asia.9 A breakdown of the principal commodities imported is provided in Exhibit 3. Furniture and bedding account for more than one third of containerized imports by volume. Machinery and parts including motorcycles account for 16%, toys, games and sports equipment 11% and home & building products, 9%.
7 Eugene Tang, San Francisco Chronicle, Oct. 27, 2006. 8 Wendy Leung, Vancouver Sun, June, 20, 2006. 9 Markus Gaertner, South China Morning Post, 29 July 2005.
http://www.skyscrapercity.com/printthread.php?t=145456
Container Capacity Expansion Plans at Pacific Coast Ports Hanam Canada Corporation January 2007
5
Exhibit 3 Containerized imports in North America 2006 Commodity China’s Import
Penetration10 Canada %
Value11 $/TEU
% By Value
% By Volume
LA & Long
Beach
Oak-land
Seatle & Tacoma
Van-couver
Man-zanillo Lazaro
1995 2005 1000 TEUs/year Furniture & bedding 2 8 10,600 14 34 2,600 410 540 380 200 Machinery and parts NA NA 25,800 16 16 1,200 200 250 180 100 Toys, games & sports eq. 9 21 21,200 6 11 800 130 170 120 70 Home & building products - - 16,900 6 9 700 110 150 100 60 Electronic & electrical eq. 3 15 47,900 10 5 400 70 80 60 30 Textiles & clothing 8 31 46,100 7 4 300 50 60 40 20 Ceramic goods - - 10,700 2 4 300 40 60 40 20 Footwear - - 31,200 4 3 300 40 50 40 20 Food & beverage - - 30,000 3 3 200 30 40 30 20 Other - - 26,000 29 10 700 120 160 110 60 Total 100 100 7,500 1,200 1,560 1,100 600
Source: Calculated from port and Clarkson Research data
Canadian imports from China have more than doubled in the past 10 years and import penetration measured as the value of imports from China divided by the value of the domestic market is likely to grow. About three quarters of machinery and parts used in Canada are imported and more of these are now containerized and coming from Asia. China’s participation in some of the fastest growing areas auto parts and home building products is relatively new. The products imported at each port are fairly similar and consist mainly of consumer goods.
Furniture and bedding have a relatively low value per unit of container volume. Electronic equipment, textiles and clothing tend to have the highest value. The average value of a container of goods imported from China is about $26,000.12 Imports from Korea, Hong Kong and Singapore tend to be higher in value, about $30,000 per container. Imports from Malaysia, the Phillipines, Indonesia, and Thailand are mainly higher value clothing and specialty foods.
Some of the destinations of containerized goods are shown in Exhibit 4. About 60% of the imported containers handled in the Port of Vancouver are for destinations outside of British Columbia.13 Walmart and Home Depot are the two largest container importers in the US and Canada. More US importers are cargo owners and some have master agreements that cover entire import regions. Their high volume purchases allow them to reduce their overall shipping costs. The Bay and Canadian Tire have direct contracts with shipping companies but most of the smaller Canadian companies contract shipping through 6 major Canadian freight forwarders including Schenker Logistics and Panelpina. More research is needed to provide a clearer picture of the container importers and destinations.
10 Canada’s House of Commons Standing Committee on Industry, Science & Technology,
“Challenges Facing the Canadian Manufacturing Industry”, Ottawa, 2006. 11 Robert Leachman, University of California at Berkeley, “Port and Modal Elasticity Study”, 2005. 12 Clarkson Research Services, London, UK, Container Intelligence, Fourth Quarter 2006. 13 Lynne Olver, July 13, 2005. http://www.skyscrapercity.com/printthread.php?t=145456
Container Capacity Expansion Plans at Pacific Coast Ports Hanam Canada Corporation January 2007
6
Exhibit 4 Principal destinations of containers in 2005 United States
1000TEUs Canada
1000 TEUs Estimate
Wal-Mart 695 70 Target 371 0 The Bay, Zellers, Home Outfitters 0 60 Home Depot 335 34 Sears & K-Mart 240 - Canadian Tire 0 20 Lowes 163 0 Costco 160 16 LG Group 127 13 Ikea 100 10 Ashley Furniture 70 0 Sony 50 5 Payless Shoes 54 5 Samsung 53 5 Matsushita 52 5 Toyota 52 5 KB Toys includes Mattel 50 5 Nike 48 5 Can Retail Shippers, Sears, Sony Others 0 800 Schenker- The Brick, others 0 500 Panelpina 0 - - indicates no data Sources: Forbes, July 1, 2006,14 University of California Study, and shipping company estimates
Large centralized ports with rail yards at the container terminals, more efficient intermodal yards and large distribution warehouses throughout the US have made rail shipping more efficient. In the past two years 4.5 million square meters of warehouse space was added in the Los Angeles area, 3.2 million square meters in Chicago, and 2.0 million square meters in Atlanta.15 With all six Class-One railroads connecting to the region, Chicago is the United States’ busiest rail hub. Other fast growing intermodal centers are Central, NJ, Houston and Dallas, TX, Memphis, TN, Seattle, WA. and Miami, FL. CN Rail has invested $100 million to establish a large new intermodal center in Memphis. Washington State’s Kent Valley between the Ports of Seattle and Tacoma is experiencing rapid growth of large new multi-functional facilities with cross docks for quick turnaround of full containers as well as storage space for longer term inventory.
About half of the imports at Vancouver, Los Angeles and Oakland are for distant markets and leave the ports by rail. In Seattle and Tacoma 70% of the containers move by rail to Midwest US cities mainly Chicago and only about 30% of the imports are for local markets. At Deltaport 55% of the containers leave by rail
14 Forbes, www.forbes.com/logistics/2006/07/01 quoting data from US Department of
Commerce Port Import and Export Reporting Service www.piers.com/maritime/maritime_globalcontainerreport_purchase.asp
15 Cushman & Wakefield, “New Age of Trade”, New York, June 2006. www.cushmanwakefield.com

Container Capacity Expansion Plans at Pacific Coast Ports Hanam Canada Corporation January 2007
7
whereas at Vanterm and Centerm only 43% leave by rail. In Mexico and Panama almost all of the containers leave by rail to larger population centers.
2.2 Canada’s containerized exports
Canada’s western provinces have taken advantage of empty containers and low return shipping rates by increasing the containerization of forest and agricultural products. For example, CN recently opened a $4 million plant in Edmonton to load specialty grains and other crops such as lentils, beans, peas, malt, and alfalfa pellets into containers.16 Fewer containers from Canada return empty as compared to the US as shown in Exhibit 5. Only 14% of the containers passing through Vancouver are empty compared with 29% for the Pacific Coast as a whole.
Exhibit 5 Inbound, outbound and empty containers in
North America Inbound Outbound Empty Total Delta, Vancouver & Surrey % 48 38 14 100 Seattle & Tacoma 48 26 26 100 Portland 58 22 20 100 Los Angeles & Long Beach 49 20 31 100 Ensenada 59 21 20 100 Manzanillo & Lazaro 47 33 20 100 Pacific Coast 49 22 29 100 Source: Port Websites 2006
The principal containerized exports from Pacific Coast ports are pulp, paper and waste paper, agricultural products, metals and metal scrap as shown in Exhibit 6. These three categories make up more than 80% of the export volume. Paper products including waste paper are the leading containerized exports from the Port of Los Angeles. In Vancouver, pulp and paper are also the leading containerized exports followed by lumber and other wood products. A growth area for Canada is specialty grains. Increasingly customers prefer to know the origin of their food grains rather than buying them in bulk. The shipping time from the farm to the customer for Canadian wheat is about 21 days in containers compared with the average of 97 days for bulk shipments.17 Crops such as sunflower seeds, hops, beans, peas and lentils are almost all containerized whereas they used to be shipped in bulk.
16 CN Rail, News Release, Nov. 16, 2006. www.cn.ca 17 Kimberly Vachal, North Dakota State University & Heidi Reichert, US Department of Agriculture, “Identity Preserved Grain, Logistical Overview” Jan 27, 2003. www.farmfoundation.org

Container Capacity Expansion Plans at Pacific Coast Ports Hanam Canada Corporation January 2007
8
Exhibit 6 Containerized exports from North America 2006 Commodity Value
$/TEU % By Value
% By Volume
LA & LB
Oakland Seattle & Tacoma
Van- couver
Manzanillo & Lazaro
1000 TEUs/year Pulp, paper & waste paper 20,800 24 35 700 120 240 290 0 Agricultural crops 30,000 21 22 580 90 150 90 300 Metals & metal scrap 18,000 15 25 520 90 150 80 0 Pet & animal feed 20,000 11 16 370 60 100 70 0 Machinery & equipment 25,800 4 5 160 30 30 40 0 Food, drinks, meat & fish 40,000 6 5 150 30 30 50 100 Lumber & wood products 30,000 5 5 50 20 34 160 0 Textiles, fabric & yarn 46,100 4 2 200 10 0 0 0 Electronic & science eq. 47,900 1 0 0 0 30 0 0 Other 26,000 10 11 340 40 60 90 20 Total 100 100 3,070 490 840 870 420
Source: Calculated from port data
Another trend is the trans-loading of bulk grains such as wheat and barley into containers. For example, WestNav Container Services, near Fraser Surrey Docks, unloads bulk grain rail cars into containers. The back haul container shipping rates are competitive with bulk shipping rates because shipping companies need to bring the containers back to their origin. About 26 tonnes of wheat or peas, and 23 tonnes of barley fit in a 40 foot long container. Importers increasingly prefer the convenience of container deliveries.
Columbia Containers and Coastal Containers near Vanterm, receive malt by hopper cars and load it into containers for export to Japan. Similarly lumber is stuffed into shipping containers by companies such as Coast 2000, Westrans, and Lynnterm for shipments to Asia. Coast 2000, Richmond, one of the largest container handling and stuffing companies stuffed 25,000 40 foot containers this year and is budgeting for a 60% increase next year. Smelter products such as nickel are also stuffed into containers in Richmond for export to Asia.
2.3 Shipping company consolidation
Representatives of the 21 major container ship operators serving the Pacific Coast listed in Exhibit 7 were interviewed to determine trends and priorities. There are 96 service routes, 621 vessels, and 2.6 million TEUs of capacity now serving the Transpacific container trade. All of the companies are international in scope and almost all operate in both Canada and the US. The main lines serving the Pacific Coast are based in Denmark, China, Japan, Taiwan, Korea and Singapore.
Container Capacity Expansion Plans at Pacific Coast Ports Hanam Canada Corporation January 2007
9
Exhibit 7 Shipping companies served by Pacific Coast ports Alliances Head Office World
Ships 1000
TEUs 2006
Ship Size Average
TEUs
2006
1000sTEUs Post
Panamax Capacity
2011
Trans Pacific
1000 TEUs 2006
CKYH Cosco China 384 2,006 165 K-Line Japan 264 3,919 165 Hanjin Korea 353 3,604 89 Yang Ming China 221 3,172 128 Subtotal 8,200 New World APL (NOL Group) Singapore 337 3,448 92 Mitsui OSK Japan 283 3,819 151 Hyundai MM Korea 165 148 Subtotal 5,800 Grand Nippon Kusen (NYK) Japan 320 3,094 202 Orient Overseas (OOCL) Hong Kong 278 4,990 147 Hapag-Lloyd Germany 446 3,749 96 Subtotal 5,600 Maersk Maersk (Denmark) Denmark 1,761 4,111 797 4,200 CPN Evergreen (incl. Hatsu) Taiwan 536 3,275 208 3,100 CMA CGM France 650 3,590 149 2,000 China Shipping China 381 3,283 134 2,000 Zim Israel 233 3,366 600 Mediteranean Shipping Switzerland 947 3,300 241 560 Hamburg Sud Germany 203 3,307 89 360 Wan Hai Taiwan 115 1,817 280 CSAV-Norasia Chile 200 Pacific Int’l Lines (PIL) Singapore 137 1,261 200 Maruba Argentina 100 Other 1,596 1,100 Total 4,583 Total all sizes 11,200 12,386 34,300
Source: Clarkson Research Services, 2006
In late 2006, most shipping companies were losing money. Shipping rates have declined whereas costs for fuel, security and labor have gone up. Except for K-Line and Hanjin, whose share price stayed level, 19 other major public shipping companies have seen a decline in their share prices in 2006.18 Share prices for most shipping companies quadrupled from 2002 to 2005 but for the first three quarters of 2006 fell by an average 23%. However some companies have seen improved share prices during the last quarter of 2006.
Time charter rates declined this year by 7.4% to $31,500 per day for a 4,400 TEU ship but now seem stable. Worldwide, some shipping companies are willing to expand service routes and their representatives continue to hold a positive view of demand growth. Average revenues per container shipped increased by 18% from 2001 to 2005 but fell 7.5% in 2006. The most dramatic declines were in the European service routes out of China. The Trans-Pacific service routes did not decline as quickly but are on a gradual downward price trend.
18 Clarkson Research Services, London, UK Container Intelligence Quarterly, 4th Quarter, 2006.

Container Capacity Expansion Plans at Pacific Coast Ports Hanam Canada Corporation January 2007
10
Most company representatives said their container shipping growth in Canada is limited mainly by rail space allocations. Their annual growth estimates for the next three years ranged from a 4% decline to 12% growth. The biggest companies expect the highest growth. Companies serving Europe and Latin America forecast the least growth. The forecast average growth for the next three years weighted by the volume of business is 7.9% and 6% beyond 2010.
Container ship operators said their two most important service priorities are: schedule reliability and freight rate.19 To maintain reliable frequent schedules shipping companies have organized their services into routes between the various ports. Different ships within the various shipping alliances can meet the trade requirements on a particular route. Some route names are indicated by the letters in the left column of Exhibit 8. The main services or routes provide regular shipments of goods for the major suppliers and customers. Each shipping service calls at the same ports at a predictable date and time. Service routes are changed only with input from all Alliance partners, freight forwarders and major customers
For example at Deltaport, Evergreen Shipping provides 3 regular service routes. The New Grand Alliance and the CKHY alliance provide 4 regular service routes to Vanterm. This use of regular routes is one reason why small ports have not succeeded in attracting container ships. There is not enough business at a small port to get all members to agree to a new stop.
Exhibit 8 Shipping services or routes to BC ports in 2006 Service or Route Name Alliance Shipping Company Deltaport WAE - Evergreen, Maersk CPN - Evergreen, CMA-CGM, TPS - Evergreen - - ZIM - - CMA-CGM, CSAV-Norasia Vanterm JCX New Grand NYK, OOCL, Hapag, Lloyd PNW CKYH Cosco, K-Line, Yang Ming, Hanjin HPNX CKYH Hanjin, K-Line, Cosco, Yang Ming KPNW CKYH K-Line, Yang Ming, Hanjin, Cosco Centerm New World APL, MOL, Hyundai Fraser Surrey Maruba, Hamburg Sud
Source: Terminal brochures
Shipping alliances have most of the shipping berth time and rail capacity booked in advance. Therefore with high demand for terminal capacity, it is difficult for a new entrant to get service at Deltaport. Vessels may be delayed due to weather, pilotage, tug, berth, and crane availability and each delay can affect cumulative port time and costs. Upsets at one terminal affect the schedule at the other terminals on the route. For example, Deltaport berths have an occupancy rate of
19 John Vickerman, TranSystems Inc., Norfolk, Virginia “Emerging Canadian Port & Intermodal
Opportunities: A Capacity Assessment” 2006.
Container Capacity Expansion Plans at Pacific Coast Ports Hanam Canada Corporation January 2007
11
75% and only a two-day window for ship arrival times. If there are problems at one port on the route, there may be costly waits at the following ports.
Shipping companies are using increasingly sophisticated Internet accessible computer tracking of shipments from the point of origin to the final destination. Paperless trading systems such as “Bolero” are used to monitor and reduce the time containers spend at terminals thus increasing capacity.
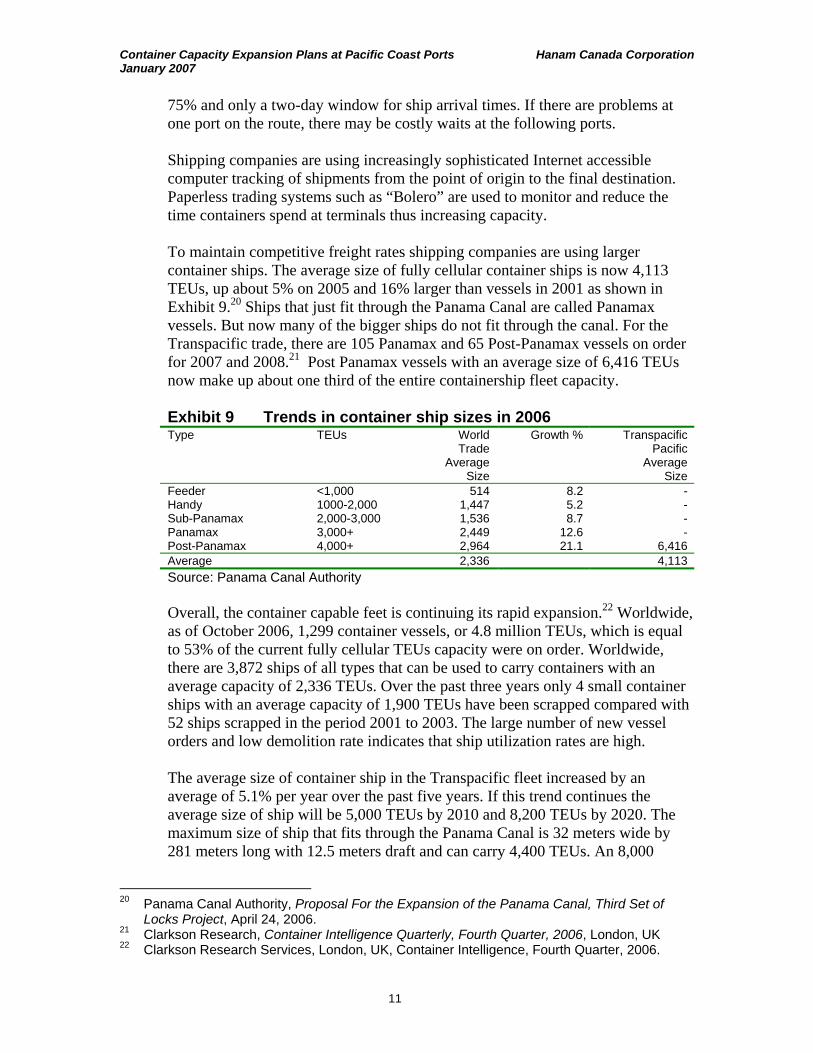
To maintain competitive freight rates shipping companies are using larger container ships. The average size of fully cellular container ships is now 4,113 TEUs, up about 5% on 2005 and 16% larger than vessels in 2001 as shown in Exhibit 9.20 Ships that just fit through the Panama Canal are called Panamax vessels. But now many of the bigger ships do not fit through the canal. For the Transpacific trade, there are 105 Panamax and 65 Post-Panamax vessels on order for 2007 and 2008.21 Post Panamax vessels with an average size of 6,416 TEUs now make up about one third of the entire containership fleet capacity.
Exhibit 9 Trends in container ship sizes in 2006 Type TEUs World
Trade Average
Size
Growth % Transpacific Pacific
Average Size
Feeder <1,000 514 8.2 - Handy 1000-2,000 1,447 5.2 - Sub-Panamax 2,000-3,000 1,536 8.7 - Panamax 3,000+ 2,449 12.6 - Post-Panamax 4,000+ 2,964 21.1 6,416 Average 2,336 4,113
Source: Panama Canal Authority
Overall, the container capable feet is continuing its rapid expansion.22 Worldwide, as of October 2006, 1,299 container vessels, or 4.8 million TEUs, which is equal to 53% of the current fully cellular TEUs capacity were on order. Worldwide, there are 3,872 ships of all types that can be used to carry containers with an average capacity of 2,336 TEUs. Over the past three years only 4 small container ships with an average capacity of 1,900 TEUs have been scrapped compared with 52 ships scrapped in the period 2001 to 2003. The large number of new vessel orders and low demolition rate indicates that ship utilization rates are high.
The average size of container ship in the Transpacific fleet increased by an average of 5.1% per year over the past five years. If this trend continues the average size of ship will be 5,000 TEUs by 2010 and 8,200 TEUs by 2020. The maximum size of ship that fits through the Panama Canal is 32 meters wide by 281 meters long with 12.5 meters draft and can carry 4,400 TEUs. An 8,000
20 Panama Canal Authority, Proposal For the Expansion of the Panama Canal, Third Set of
Locks Project, April 24, 2006. 21 Clarkson Research, Container Intelligence Quarterly, Fourth Quarter, 2006, London, UK 22 Clarkson Research Services, London, UK, Container Intelligence, Fourth Quarter, 2006.

Container Capacity Expansion Plans at Pacific Coast Ports Hanam Canada Corporation January 2007
12
TEUs ship is 46 by 325 meters. It is expected that ships of 12,000 TEUs capacity 53 by 400 meters and 15 meters draft will be common by 2015. This is the limit of the Suez Canal and proposed Panama canal expansion.
The trend to larger ships is shifting trade to larger, deeper draft ports with ample container storage space, rail yard, and warehouse capacity.23 The average vessel size at Deltaport is forecast to increase from 4,065 TEUs in 2003 to 4,650 TEUs by 2012 with the largest ships about 10,000 TEUs. 24 The ships calling on Fraser Surrey Docks, with shallower draft restrictions are smaller, between 1,500 to 2,500 TEUs.
2.4 Larger and more productive terminals
There is a trend towards centralizing of container business in fewer larger terminals with higher quality service, better productivity, and lower costs. In Los Angeles and Long Beach several adjacent terminals are being combined into several larger ones. It is recognized that ocean shipping and rail transportation can be just as important in the productivity of the overall supply chain. For example, the most productive terminals handle the largest container ships.
The ports’ container terminals are ranked by several productivity indicators in Exhibit 10. The values shown are averages for a port but the newest terminals such as Hanjin, Long Beach, APM, Los Angeles and APL, Oakland are more productive than the average. Deltaport, Los Angeles and Long Beach have the most through put per terminal, berth and crane. They have the most on dock space, the best rail access, and most convenient hours of service. The lower ranking terminals Ensenada, Portland and Surrey are vulnerable to competition. Tacoma, Oakland and Lazaro Cardenas’ low productivity is partly due to recent expansions and excess capacity and may be temporary.
23 Mongelluzo, Bill, Landslide Lagjam: New Generation of big ships will force ports, railroads to
change operations, Journal of Commerce, Feb. 28, 2005. 24 Vancouver Port Authority, Environmental Assessment Application for the Deltaport Third
Berth Project, January, 2005. http://www.eao.gov.bc.ca

Container Capacity Expansion Plans at Pacific Coast Ports Hanam Canada Corporation January 2007
13
Exhibit 10 Productivity comparisons 2006 1000TEUs/
y Terminal
1000TEUs/y
Berth
1000TEUs/y
Crane
1000TEUs/y
Hectare
Hours/
Year
Lifts/
Hour
Useful Excess Capacit
y 1 Delta 1,078 539 180 17 3,188 24 0.2 2 Los Angeles 1,169 273 106 12 6,096 23 0.8 3 Long Beach 896 184 80 12 6,096 25 1.2 4 Balboa 500 250 167 59 8,760 0.2 5 Manzanillo 450 225 113 38 8,592 0.4 6 Seattle 556 185 72 9 2,146 22 0.2 7 Vancouver 504 252 92 17 3,188 19 0.4 8 Lazaro 375 375 188 25 8,760 0.1 9 Oakland 347 128 76 9 2,322 23 1.0
10 Tacoma 310 172 65 7 2,045 25 1.5 11 Surrey 200 100 50 7 2,250 0 12 Portland 196 65 28 4 2,146 0 13 Ensenada 109 109 27 8 8,760 0
Average 657 276 121 12 3,650 6.0 Source: Calculated from Port data
At most terminals, container ships are serviced 24 hours per day 7 days a week and rail cars are also loaded and unloaded continuously. Shipping companies rate the railroad efficiency by the number of days a container spends on the dock, an average of 3 days at Deltaport and 4 days at Vancouver terminals. However sometimes containers stay at Vanterm for 10 to 16 days because of space constraints or the lack of allocations for space on CP Rail cars. For example a terminal operator may notice a shipping line is bringing in 200 containers on a ship but their rail allotment is only 100 cars. Sometimes they have left the extra containers on board. But if the company stores them, they may get left for a week or more until the shipping line is allotted space on the train to take them away.
Truck pick-up and deliveries are made only during posted gate hours or by reservation after the posted times. Some truckers and lumber exporters complained they must book two days ahead to get appointments. When larger ships are unloaded sometimes the in-bound lanes and truck reservations are closed. Deltaport achieves about 1,150 gate transactions per day; Vanterm, about 1,000; and Centerm about 550. The average wait time for truckers at all three terminals is about the same, two hours. One container yard operator reported that they currently need 60 trucks to handle a volume of 100 containers per day where previously they needed only 25 due to increased waits at the terminal and more traffic congestion. Trucking representatives stated that a reasonable wait time would be one hour and a proposed engineering standard is thirty minutes.25
The largest terminals in Los Angeles and Long Beach compete to reduce unit costs and improve throughput capacity and service. For example, 500 truckers who serve these two ports are regularly surveyed about terminal quality and service. APL’s, Los Angeles container terminal has repeatedly won the award
25 Michael Ircha, University of New Brunswick, Oct. 24, 2005 Atlantic Institute For Market
Studies. www.aims.ca
Container Capacity Expansion Plans at Pacific Coast Ports Hanam Canada Corporation January 2007
14
“Fastest and Best Overall Marine Terminal”. Speed is determined by the amount of time truckers spend at the terminal discharging one container and collecting another. The overall rating includes variables such as professionalism, courtesy, competence, and the quality of container handling equipment.26
In Los Angeles and Long Beach the PierPass not-for-profit company was created to reduce congestion and improve air quality by offering night and weekend gate openings. Of the truck drivers surveyed most, 71% reported reduced traffic on the freeways and roads leading to the terminals, and 43% confirmed they were making more trips per shift.27 Off peak night hours are 6 PM to 3 AM, Monday through Thursday and 8 AM to 6 PM on Saturday. A fee on daytime traffic paid in advance by the shipper provides the financial incentive to use off peak hours.
Shipping companies typically compare labour productivity by the lifts per crane per hour. Delta achieves 24 lifts per crane per hour comparable to Los Angeles whereas the Vancouver ports achieve about 19. Japanese ports operate at about 35 lifts per hour.28 In Vancouver and Delta, workers are represented by International Longshore Workers Union. Members will handle containers at any time provided they are given 24 hours notice. However the terminal operators do not see enough business during afternoon and night shifts. Although the Vancouver and Delta terminals have been open Tuesday, Wednesday and Thursday evening for the past two months, truckers’ representatives report they are not getting enough loads on the afternoon shift to pay for their costs.
Trucking company representatives suggested some of the following reasons for this lower productivity during the afternoon:
• Export customers are not set up to handle containers during the afternoon shift
so trucker can not get a container to take back to the terminal. • Labour contracts at some warehouses may not include afternoon openings. • Truckers need to pick up an extra chassis to get an import container since the
other chassis has been left at the delivery point. • Shorter shift from 5 PM to midnight and a ½ to 1 hour transition time at
terminal shift change when truckers can not get service. • Container storage yards not open. Coast 2000 is open till 9 PM and Delco to 8
PM but the rest are closed. • Shipping company offices are closed at night.
The available storage space at a terminal and off-site is a major factor in terminal productivity. At present companies get 4 days free container storage at Vanterm and Deltaport and 5 days at Centerm. After that they have to pay $200 per day for storage. Some storage company representatives suggested the free time could be
26 APL Press Release, March 15, 2006. www.apl.com 27 Richard Steinke, Port of Long Beach, August, 2006.
http://www.pierpass.org/press_room/releases/?id=38 28 John Vickerman, Transystems, Norfolk, VA, Canada Asia Maritime Conference Notes, 2006.

Container Capacity Expansion Plans at Pacific Coast Ports Hanam Canada Corporation January 2007
15
reduced to 2 days. Some container terminals are trying to improve the stacking density of their terminals by using more rubber tired gantry cranes. Conversely, others maintain more ground storage making it easier for truckers to pick up containers. The storage density at a few Pacific Coast container terminals is compared in Exhibit 11. Stacked three high without space in between, the maximum would be 2,040 TEUs per acre. The actual storage is about a quarter of this maximum.
Exhibit 11 Container storage capacity 2006 Hectares Storage
Grounded TEUs
Storage Total
TEUs
TEUs/ Hectare
Cal United, Long Beach 38 14,400 43,200 1,135 Seaside, Oakland 23 5,898 17,694 762 Hutchison, Ensenada, Mexico 13 6,500 507 Pacific Container, Long Beach 102 15,317 45,951 450 SSAT, Long Beach (Matson) 28 4,000 12,000 427 Centerm, Vancouver 29 12,000 410 TSI, Delta 64 24,000 375 SSAT Long Beach 68 24,000 352 APM Terminals, Tacoma 54 4,700 14,100 260 Terminal 6, Portland 80 7,700 97
Source: Terminal brochures and port websites
2.5 Port related wetland restoration
The leading US ports, Los Angeles, Long Beach, Oakland and Tacoma have been proactive in providing wetland habitat compensation to gain support for port development. For Port of Oakland expansions, US Federal government agencies played a leading role in projects to provide public amenities, restore waterfowl and wildlife habitat throughout the Bay area. The Bay Conservation and Development Commission helped to open 320 kilometers of shoreline to the public while retaining mudflats and restoring degraded marshes. The San Francisco Bay National Wildlife Refuge and the San Pablo Bay National Wildlife Refuge were established to further protect the Bay.
Oakland’s harbour-deepening project included 100% beneficial reuse of dredge material for restoration of Bay area wetlands, the creation of a new waterfront park, and increased public access to the shoreline. State law requires ships to exchange ballast water at sea in order to prevent foreign organisms from contaminating San Francisco Bay. The Port of Oakland has developed and implemented a storm water pollution prevention program that goes beyond the minimum requirements of regulations.
The Port of Los Angeles has also been proactive in wetlands restoration. In 1996, a 40 hectare project was completed at a cost of $57 million to restore halibut and sea bass habitat. Several threatened and endangered bird species are nesting in record numbers and shorebirds are feeding on the newly created mud flats. These

Container Capacity Expansion Plans at Pacific Coast Ports Hanam Canada Corporation January 2007
16
projects have received enthusiastic public support. The Port of Long Beach through agreements with the U.S. Fish and Wildlife Service and other natural resource agencies, acquires and restores coastal wetlands in Southern California in exchange for the right to develop Port property. Tacoma has also completed habitat restoration projects with each of their terminal construction projects.
To reduce air emissions, the Port of Long Beach has a program underway to convert to shore based electrical power and a 15% reduced dockage rate if ships travel at less than 12 knots within 20 miles of the coast.29 Ship generators must use fuel with less than 0.2% sulfur. The Port of Los Angeles has attached a “no net emission increase standard” to its expansion plans.30
In Mexico, the Instituto Nacional del Ecologia is responsible for environmental issues including the major container port expansion at the Balsas River estuary in Lazaro Cardenas. Industrial development has been kept on the north arm of the estuary whereas the south arm of the river remains relatively natural.
In Canada, the Fraser River Estuary Management Program is a partnership of governments and port authorities to protect the estuary. The budget is $356,000 per year with all partners contributing $45,000 per year.31 The Greater Vancouver Regional District has developed a biodiversity strategy for the region including the vicinity of Roberts Bank.32 It has been suggested that land and covenants could be purchased on Brunswick Point and Westham Island for about $60,000 per hectare33 Groups such as the Pacific Estuary Conservation Program have already purchased 300 hectares of land in Delta and some purchases allow continued farming while protecting bird habitat.34 Transport Canada, provided $6.0 million for habitat acquisition and a $3.0 million endowment to compensate for the expansion of the Vancouver airport in 1995.35
29 Port of Long Beach http://www.polb.com/environmen/air_quality/vessels/default.asp 30 Port of Los Angeles. Working Draft: No Net Increase Strategy with Preliminary
Recommendations Subject to Legal and Economic Review. March 15, 2005. http://www.portoflosangeles.org/DOC/NNI_Strategy_March_2005.pdf
31 Anna Mathewson, Manager FREMP & BIEAP, Burnaby, BC Dec. 29, 2006. 32 Greater Vancouver Regional District, Biodiversity Conservation Strategy Workshop, July 13,
2006 www.gvrd.bc.ca/growth/biodiversity/ 33 Ken Brock, Head of Habitat, Canadian Wildlife Service, Environment Canada, Jan. 2, 2006 34 Stephen Leahy, Conservator, Deal in Delta, March 26, 2005
www.ducks.ca/about/duc/news/conservator/263/delta.pdf 35 Theresa Duynstee, Policy & Planning, Regional Biodiversity Strategy, Greater Vancouver
Regional District, Vancouver, Dec. 29, 2006.
Container Capacity Expansion Plans at Pacific Coast Ports Hanam Canada Corporation January 2007
17
2.6 Implications of trends for British Columbia
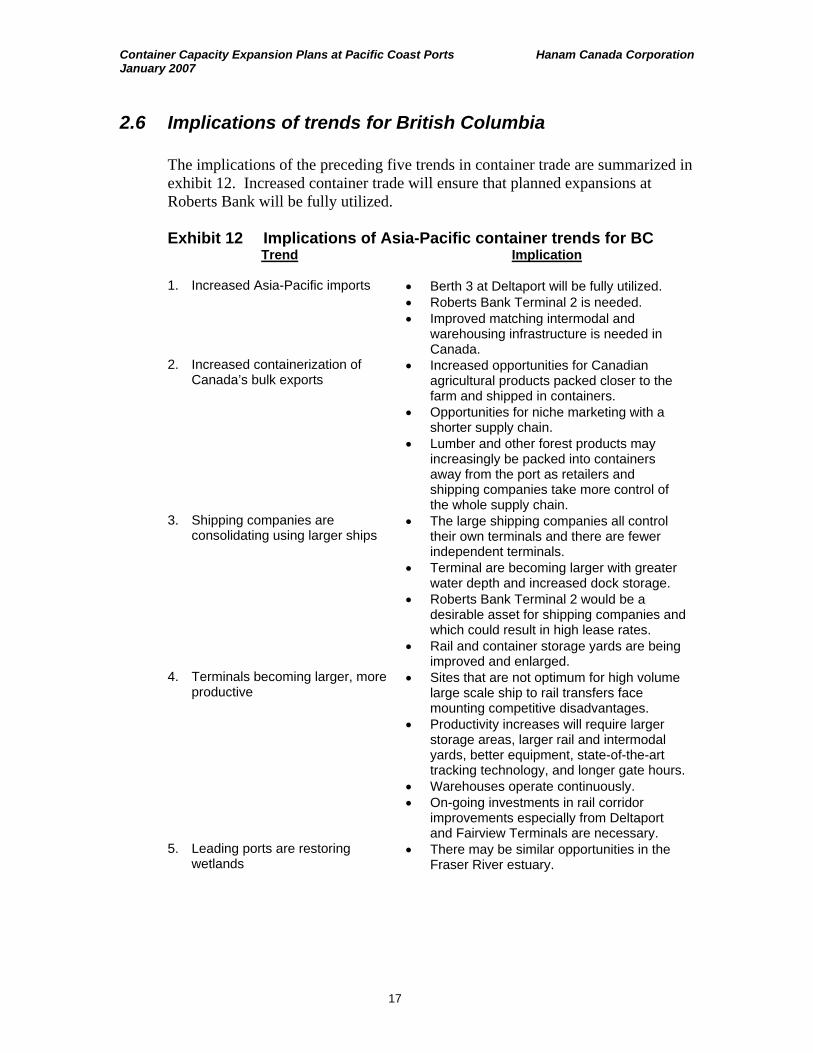
The implications of the preceding five trends in container trade are summarized in exhibit 12. Increased container trade will ensure that planned expansions at Roberts Bank will be fully utilized.
Exhibit 12 Implications of Asia-Pacific container trends for BC
Trend Implication
1. Increased Asia-Pacific imports • Berth 3 at Deltaport will be fully utilized. • Roberts Bank Terminal 2 is needed. • Improved matching intermodal and
warehousing infrastructure is needed in Canada.
2. Increased containerization of Canada’s bulk exports
• Increased opportunities for Canadian agricultural products packed closer to the farm and shipped in containers.
• Opportunities for niche marketing with a shorter supply chain.
• Lumber and other forest products may increasingly be packed into containers away from the port as retailers and shipping companies take more control of the whole supply chain.
3. Shipping companies are consolidating using larger ships
• The large shipping companies all control their own terminals and there are fewer independent terminals.
• Terminal are becoming larger with greater water depth and increased dock storage.
• Roberts Bank Terminal 2 would be a desirable asset for shipping companies and which could result in high lease rates.
• Rail and container storage yards are being improved and enlarged.
4. Terminals becoming larger, more productive
• Sites that are not optimum for high volume large scale ship to rail transfers face mounting competitive disadvantages.
• Productivity increases will require larger storage areas, larger rail and intermodal yards, better equipment, state-of-the-art tracking technology, and longer gate hours.
• Warehouses operate continuously. • On-going investments in rail corridor
improvements especially from Deltaport and Fairview Terminals are necessary.
5. Leading ports are restoring wetlands
• There may be similar opportunities in the Fraser River estuary.

Container Capacity Expansion Plans at Pacific Coast Ports Hanam Canada Corporation January 2007
18
3. PACIFIC CONTAINER TERMINAL PLANS & ISSUES
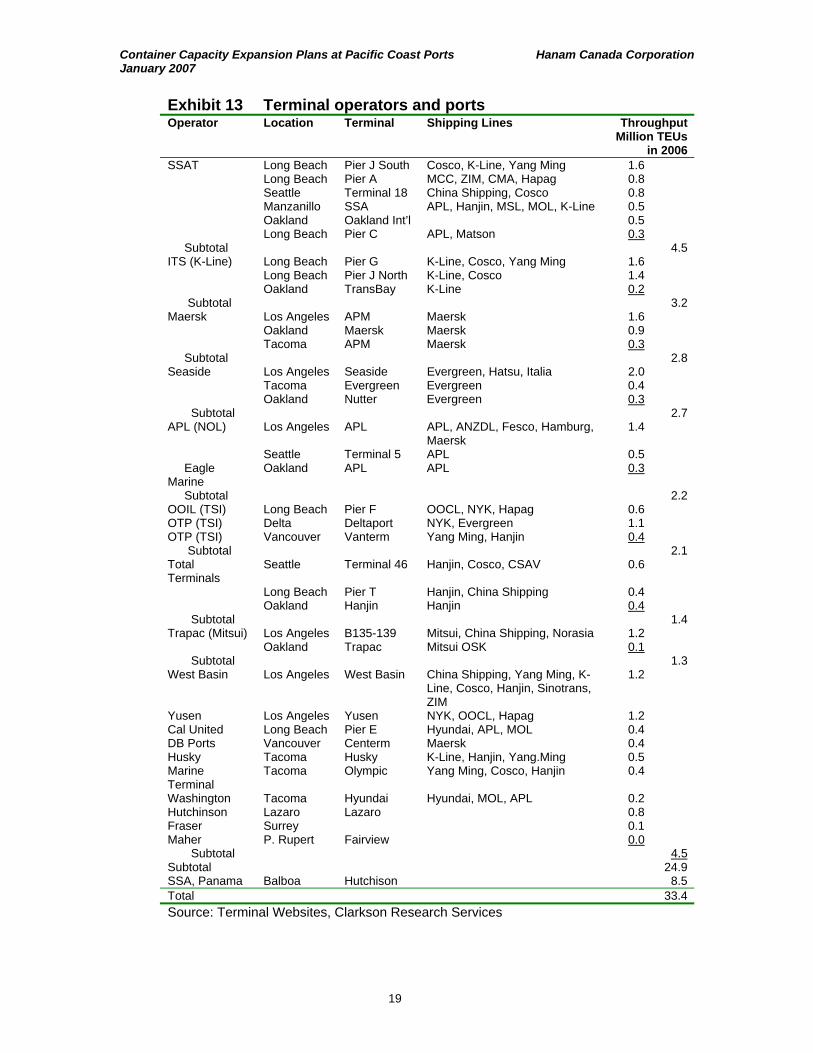
To obtain data and information on expansion plans and development issues representatives of most of the 14 west coast terminal operators and 12 Port Authorities listed in Exhibit 13 were interviewed by telephone for 10 to 30 minutes. The 55 container terminal expansion plans and 35 related issues are summarized in Exhibit 14. Investments totaling $6.8 billion are planned including 12,000 meters of new wharfs capable of handling 22 million TEUs per year.
We included only the plans that are immediately related or adjacent to container terminals. However many more projects in Canada’s Asia-Pacific Gateway and Corridor Initiative such as new highways and bridges that would be used by container trucks are not included. An assessment of the combined expansion plans is provided in chapter 4. Assessing the rationale for each of the plans, feasibility, site specific issues, economic and other risks is beyond the scope of this report.
Most of the plans requiring significant investments are generated by Port Authorities and local governments often in response to requests from terminal operators. The largest operator of terminals on the Pacific Coast is Stevedoring Services of America Inc. with three terminals in Long Beach and terminals in Seattle, Oakland and Manzanillo, Mexico. International Transport Services (K-Line, Japan) is next with two large terminals in Long Beach and one in Tacoma. APM (Maersk, Denmark) Seaside (Evergreen Shipping, Taiwan) and APL NOL Group, Singapore, follow closely behind.
Terminal operators expressed the following priorities:36, 37
• Importers and service companies need to develop more off-dock container
storage facilities, warehouses and distribution centers that are open 24 hours per day.
• Railways need to increase their car supply, improve their port access, and remove inter-modal bottlenecks.
• Governments need to improve road flow conditions with more rail overpasses, turning lanes, better radii, and improved port signage.
• Port Authorities need to provide assistance in funding dredging and gaining timely approvals for additional berths.
36 Maloni, M. and Jackson, E.C. Black School of Business, Penn State University,
Transportation Journal, Vol. 44, Issue 3, Summer, 2005. 37 US Department of Transportation Maritime Administration, “Report to Congress on the
Performance of Ports and the Intermodal System”, June, 2005.
Container Capacity Expansion Plans at Pacific Coast Ports Hanam Canada Corporation January 2007
19
Exhibit 13 Terminal operators and ports Operator Location Terminal Shipping Lines Throughput
Million TEUs in 2006
SSAT Long Beach Pier J South Cosco, K-Line, Yang Ming 1.6 Long Beach Pier A MCC, ZIM, CMA, Hapag 0.8 Seattle Terminal 18 China Shipping, Cosco 0.8 Manzanillo SSA APL, Hanjin, MSL, MOL, K-Line 0.5 Oakland Oakland Int’l 0.5 Long Beach Pier C APL, Matson 0.3 Subtotal 4.5 ITS (K-Line) Long Beach Pier G K-Line, Cosco, Yang Ming 1.6 Long Beach Pier J North K-Line, Cosco 1.4 Oakland TransBay K-Line 0.2 Subtotal 3.2 Maersk Los Angeles APM Maersk 1.6 Oakland Maersk Maersk 0.9 Tacoma APM Maersk 0.3 Subtotal 2.8 Seaside Los Angeles Seaside Evergreen, Hatsu, Italia 2.0 Tacoma Evergreen Evergreen 0.4 Oakland Nutter Evergreen 0.3 Subtotal 2.7 APL (NOL) Los Angeles APL APL, ANZDL, Fesco, Hamburg,
Maersk 1.4
Seattle Terminal 5 APL 0.5 Eagle Marine
Oakland APL APL 0.3
Subtotal 2.2 OOIL (TSI) Long Beach Pier F OOCL, NYK, Hapag 0.6 OTP (TSI) Delta Deltaport NYK, Evergreen 1.1 OTP (TSI) Vancouver Vanterm Yang Ming, Hanjin 0.4 Subtotal 2.1 Total Terminals
Seattle Terminal 46 Hanjin, Cosco, CSAV 0.6
Long Beach Pier T Hanjin, China Shipping 0.4 Oakland Hanjin Hanjin 0.4 Subtotal 1.4 Trapac (Mitsui) Los Angeles B135-139 Mitsui, China Shipping, Norasia 1.2 Oakland Trapac Mitsui OSK 0.1 Subtotal 1.3 West Basin Los Angeles West Basin China Shipping, Yang Ming, K-
Line, Cosco, Hanjin, Sinotrans, ZIM
1.2
Yusen Los Angeles Yusen NYK, OOCL, Hapag 1.2 Cal United Long Beach Pier E Hyundai, APL, MOL 0.4 DB Ports Vancouver Centerm Maersk 0.4 Husky Tacoma Husky K-Line, Hanjin, Yang.Ming 0.5 Marine Terminal
Tacoma Olympic Yang Ming, Cosco, Hanjin 0.4
Washington Tacoma Hyundai Hyundai, MOL, APL 0.2 Hutchinson Lazaro Lazaro 0.8 Fraser Surrey 0.1 Maher P. Rupert Fairview 0.0 Subtotal 4.5 Subtotal 24.9 SSA, Panama Balboa Hutchison 8.5 Total 33.4 Source: Terminal Websites, Clarkson Research Services

Container Capacity Expansion Plans at Pacific Coast Ports Hanam Canada Corporation January 2007
20
Exhibit 14 Pacific coast container port expansion plans Port Terminal Cost Plans Technical Issues $Million New
Wharf Meters
Area
Ha
Added TEUs/y
1000
Eco-nomic
Environ-
mental
Rail Other
Major projects Long Beach Redevelop 500 300 0 2,000 * Hyundai 300 300 0 1,000 * Terminal A 200 0 20 500 * Terminal S 500 1,500 140 3,000 * Los Angeles China Ship 500 760 54 2,000 * Yang Ming 500 1,070 11 1,500 * Trapac 300 800 21 800 * Evergreen 200 0 0 500 * Oakland Berth 21 150 300 149 800 ** ** * Tacoma Evergreen 384 240 0 400 ** Seattle Term 30 120 600 16 600 **** *** Subtotal US 3,654 5,870 411 13,100 Vancouver Rail 37 0 0 200 *** **** *** Delta Berth 3 272 465 20 600 * ** Terminal 2 900 600 20 1,900 **** * **** Other 900 0 0 0 ** ** Richmond Fraser 200 600 80 800 **** Prince Rupert Fairview 140 800 66 500 ** * N. Vancouver Lynnterm 200 0 0 800 **** Subtotal Canada 2,649 2,465 186 4,800 Manzanillo Hutchison 100 1,040 16 800 ** L. Cardenas Hutchison 200 1,300 84 1,200 *** Ensenada P. Colonet 0 0 0 0 **** **** **** Balboa Hutchison 200 1,200 44 2,000 ** Subtotal 500 3,540 144 4,000 Total 6,803 11,875 741 21,900 Current capacity - 2,144 41,000 ** ** * * Current volume 34,266 % increase 35 53
Source: Literature search, websites, telephone interviews Rating of obstacles: * significant, ** important, *** very important, ****extremely important
Between 2006 and 2010 expansions are planned that will double Canada’s Pacific coast container capacity with an investment of $ 849 million.38 Plans for 2010 to 2020 would almost double capacity again at an additional cost of $1.8 billion.39 The capital cost in Canada will be known more accurately following the completion of a current engineering study. The cost of eliminating nine level railway crossings in the Seattle area was $568 million.
The Seattle, Richmond, BC, North Vancouver and Ensenada expansion plans face difficult economic challenges. Roberts Bank Terminal 2 could be delayed by environmental and traffic delay issues. Some of the other issues include financing of improved railway crossings, competing higher value uses for land, and local political concerns.
38 Jim Cox, VP Infrastructure Development, Port of Vancouver, North America’s Asia Pacific
Gateway, Vancouver, 2005. 39 BC Ministry of Small Business & Economic Development & Ministry of Transportation, British
Columbia Ports Strategy, Victoria, 2005.
Container Capacity Expansion Plans at Pacific Coast Ports Hanam Canada Corporation January 2007
21
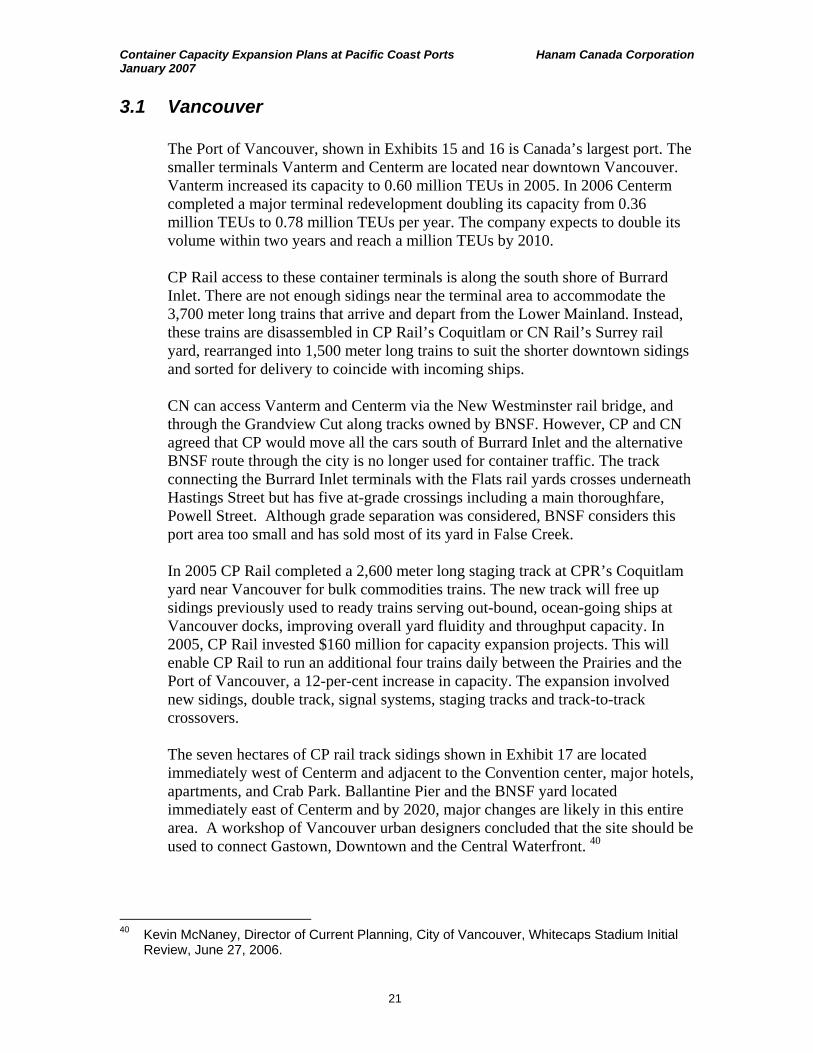
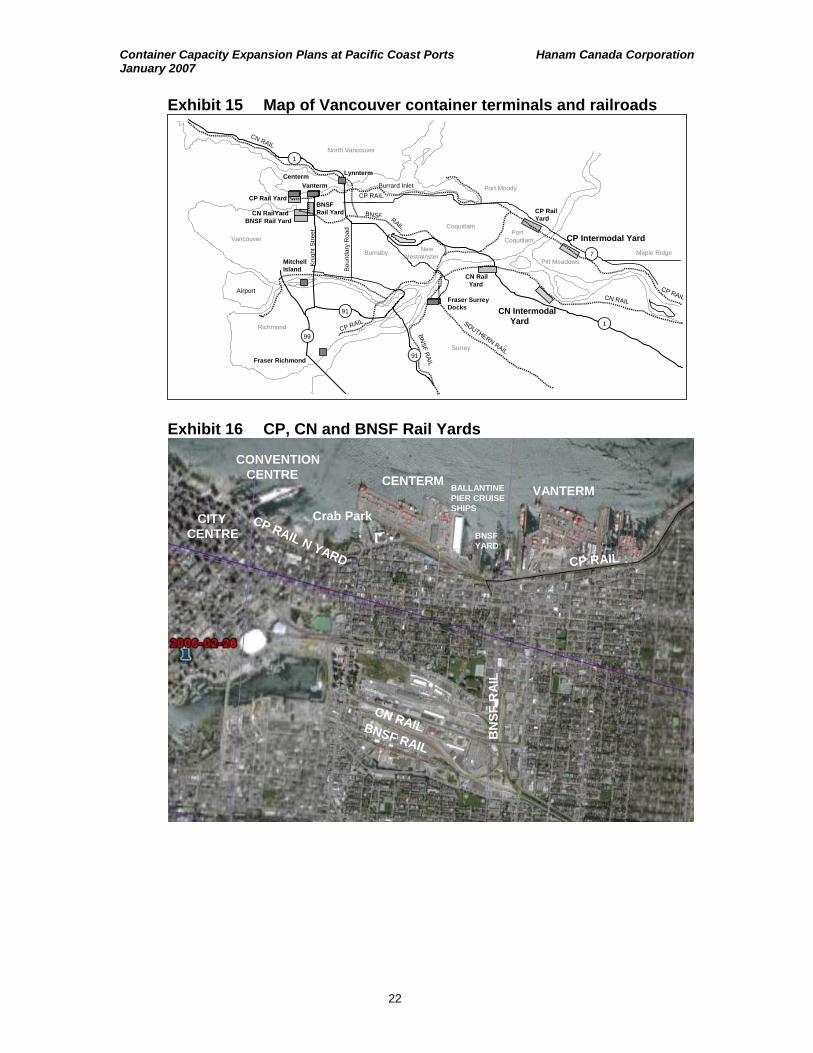
3.1 Vancouver
The Port of Vancouver, shown in Exhibits 15 and 16 is Canada’s largest port. The smaller terminals Vanterm and Centerm are located near downtown Vancouver. Vanterm increased its capacity to 0.60 million TEUs in 2005. In 2006 Centerm completed a major terminal redevelopment doubling its capacity from 0.36 million TEUs to 0.78 million TEUs per year. The company expects to double its volume within two years and reach a million TEUs by 2010.
CP Rail access to these container terminals is along the south shore of Burrard Inlet. There are not enough sidings near the terminal area to accommodate the 3,700 meter long trains that arrive and depart from the Lower Mainland. Instead, these trains are disassembled in CP Rail’s Coquitlam or CN Rail’s Surrey rail yard, rearranged into 1,500 meter long trains to suit the shorter downtown sidings and sorted for delivery to coincide with incoming ships.
CN can access Vanterm and Centerm via the New Westminster rail bridge, and through the Grandview Cut along tracks owned by BNSF. However, CP and CN agreed that CP would move all the cars south of Burrard Inlet and the alternative BNSF route through the city is no longer used for container traffic. The track connecting the Burrard Inlet terminals with the Flats rail yards crosses underneath Hastings Street but has five at-grade crossings including a main thoroughfare, Powell Street. Although grade separation was considered, BNSF considers this port area too small and has sold most of its yard in False Creek.
In 2005 CP Rail completed a 2,600 meter long staging track at CPR’s Coquitlam yard near Vancouver for bulk commodities trains. The new track will free up sidings previously used to ready trains serving out-bound, ocean-going ships at Vancouver docks, improving overall yard fluidity and throughput capacity. In 2005, CP Rail invested $160 million for capacity expansion projects. This will enable CP Rail to run an additional four trains daily between the Prairies and the Port of Vancouver, a 12-per-cent increase in capacity. The expansion involved new sidings, double track, signal systems, staging tracks and track-to-track crossovers.
The seven hectares of CP rail track sidings shown in Exhibit 17 are located immediately west of Centerm and adjacent to the Convention center, major hotels, apartments, and Crab Park. Ballantine Pier and the BNSF yard located immediately east of Centerm and by 2020, major changes are likely in this entire area. A workshop of Vancouver urban designers concluded that the site should be used to connect Gastown, Downtown and the Central Waterfront. 40
40 Kevin McNaney, Director of Current Planning, City of Vancouver, Whitecaps Stadium Initial
Review, June 27, 2006.
Container Capacity Expansion Plans at Pacific Coast Ports Hanam Canada Corporation January 2007
22
Exhibit 15 Map of Vancouver container terminals and railroads
Vancouver
Richmond
Surrey
Burnaby
North Vancouver
NewWestminster Maple Ridge
CP Intermodal Yard
Pitt Meadows
CN IntermodalYard
Fraser Surrey Docks
VantermCenterm
BNSFRail Yard
Airport
CP Rail Yard
PortCoquitlam
Port Moody
Coquitlam
CN RailYard
CN RAIL
SOUTHERN RAIL
CN RAIL
1
7
1
BNSF R
AIL
CP RAIL
Burrard Inlet
91
91
99
Knig
ht S
treet
Boun
dary
Roa
d
BNSF RAIL
CP RAIL
CN RailYardBNSF Rail Yard
CP Rail Yard
Lynnterm
Fraser Richmond
MitchellIsland
CP RAIL
Exhibit 16 CP, CN and BNSF Rail Yards
CN RAIL
CP RAIL N YARD
BN
SF R
AIL
CENTERMVANTERM
CONVENTIONCENTRE
Crab ParkCITYCENTRE
CP RAIL
BNSF RAIL
BNSFYARD
BALLANTINEPIER CRUISESHIPS

Container Capacity Expansion Plans at Pacific Coast Ports Hanam Canada Corporation January 2007
23
Exhibit 17 CP Rail N Yard and nearby BNSF Barge Slip
Centerm and Vanterm are the largest Port related origins and destinations for heavy truck traffic in Vancouver. About 57% of the containers are delivered by truck, while rail accounts for most of the long-haul destinations. This includes traffic to distribution and storage sites, movements between the terminals and off-dock nearby facilities. Truck traffic typically peaks in the afternoon. About 45% of truck movements to and from Vanterm and Centerm use Clark and Knight Street, 45% use the Trans Canada highway, and the remaining truck traffic uses truck routes such as Main, Cambie and Boundary Road.
The residential Clarke/Knight Street truck corridor now receives up to 55,000 vehicle trips daily. Trucks comprise nearly 9% of this volume including an average of about 600 container trucks a day. 41 The proportion of trucks is the highest for any Vancouver street because it links the port and industrial areas on the north side of the City with industrial areas in south Vancouver, Richmond, Delta, Surrey, and beyond via Highways 91 and 99.
Most de-stuffing of containers occurs in Richmond, Burnaby, Coquitlam and Surrey. The majority of containers are trucked along Knight Street and stored on Mitchell Island, Richmond or Delta. These suburban areas offer lower rents and proximity to the suburban consumer markets. Following de-stuffing containers are sent to yards for storage, cleaning, repair and return. Containers for export are re-stuffed by freight consolidators in the suburban yards who combine goods, such as lumber, wood pulp, and grains destined for export. These containers are then hauled by truck to the container port for loading on the return container ship leg. Some of the largest container storage yards and the capacities are:
Coast 2000, Richmond 14,000 TEUs Delco Container, Delta 8,000 TEUs CIS, Michell Island, Richmond 7,000 TEUs Marco Terminal, Vancouver 5,000 TEUs Bridge Terminal Transport (Maersk) 2,700 TEUs
41 Ian Fisher, Planning Department, City of Vancouver, “Clark-Knight Corridor Whole Route
Analysis”, March, 2003.
Container Capacity Expansion Plans at Pacific Coast Ports Hanam Canada Corporation January 2007
24
Lynnterm, on the north shore of Burrard Inlet, is a consolidation center for forest products, steel and break bulk cargo. In 2002 a study of converting to a container operation concluded there are no potential sites in Burrard Inlet or on the Fraser River where they could relocate their existing break-bulk business.
Expansion Plans
• Extended gate access- Centerm plans to reduce traffic congestion by
extending gate hours and adjusting gate fees so that truckers using off-peak hours would pay $50 per trip less.
• New rail sidings east of Centerm- Four new 7,000 foot long receiving tracks
near Vanterm and Centerm may be installed by 2021 if agreement from several landowners can be obtained.42,43 The estimated cost is $37 million.
• Redevelopment of N-Yard- Vancouver City Council approved a soccer
stadium to be located on a podium 9 meters above CP Rail’s N-Yard.44 The Whitecaps soccer club purchased land from Granville Square to Main Street from Fairmont Properties in 2005 with a covenant that allows CP Rail to retain the right-of-way.
• Redevelopment of BNSF’s Burrard inlet site- The railroad intends to sell its
four acre barge dock and sidings nearby. Their application to the Canadian Transportation Agency was denied but they intend to leave this site and have no interest in pulling small trains out of Centerm or Vanterm.
• Redevelopment of False Creek Flats- The Flats yard is presently used by CN
Rail and BNSF Rail for storage and passenger services.
• Overpasses on CP Rail line in Port Coquitlam, Pitt Meadows and Maple Ridge. UMA Engineering is studying the rail route from downtown Vancouver to Abbotsford to identify constraints to further expand Centerm and Vanterm.
• Coast Meridian Overpass- The City of Port Coquitlam, TransLink, and the
Canadian Pacific Railway have a partnership to construct an overpass across the rail yards by the end of 2009. The overpass will connect the Broadway and Kingsway Street intersection and the intersection with the Lougheed Highway.
42 Dale Bracewell, City of Vancouver, “False Creek Flats- Strategic Rail Overview and Detailed
Operation Study”, September, 20, 2005. 43 Michael White, City of Vancouver, City Plans Division, “Understanding the Service Needs of
Port Vancouver”, June 2002. www.city.vancouver.bc.ca/commsucs/cityplans/port_in_one.pdf 44 CBC News, July 12, 2006. http://www.cbc.ca/canada/british-columbia/story/2006/07/12/bc-
stadium.html
Container Capacity Expansion Plans at Pacific Coast Ports Hanam Canada Corporation January 2007
25
Issues
• Trucking cost issues- In Vancouver many truckers are owner operators and work only the day shift when they can get sufficient loads. At other ports drivers work for an hourly wage and operate the trucks on shifts. Vancouver’s new truck licensing system and move towards more unionized drivers is reducing the volumes carried by small trucking businesses.
• Gate reservation system- Needing to reserve at least 24 hour ahead is
inconvenient relative to Los Angeles. In Vancouver, if the trucker is delayed by loading, traffic or other events, the terminal will not provide service. The Pier Pass program in Los Angeles does not require a reservation in the day.
• Increasing City waterfront land value- CP Hotels and Resorts sold a 0.2
hectare building lot near N-yard site for $69 million in September 2005.45 At this price the end-of-track sidings could be worth $2.8 billion if redeveloped. Container rail operations close to city centers are facing escalating redevelopment pressure.46 Therefore, new rail sidings east of Centerm may be needed if the Vancouver terminals are to remain competitive.
• Higher costs- Because Centerm, Vanterm and the adjacent CP Rail yards
cannot handle the larger ships, shipping costs are higher than for other world scale terminals and this trend is expected to continue.
• Rail inefficiency- The rail system serving Vanterm and Centerm was not
designed to handle large ships. High cost land encroachment makes redesign and expansion costly. It is more efficient and less costly to handle these shipments outside of the city center where lower land costs allow larger-scale operations.
• Security of CP Rail sidings- The rail sidings in downtown Vancouver are
located in a densely populated area of Vancouver accessible to the public.
• Truck inefficiency- Since there is insufficient storage space at the Vanterm and Centerm terminals containers must be transported to storage yards on Mitchell Island and north Richmond.
• Traffic along Powell, Nanaimo and McGill Streets- Centerm and Vanterm
connect to Highway 1 via city streets rather than a freeway. The City of Vancouver has long opposed a freeway connection to downtown contending that other cities have failed to build their way out of congestion.47
45 Ashley Ford, Province, Vancouver, BC, Sept. 16, 2005. 46 Avison Young Commercial Rea Estate, Container Shipping Growth and Industrial Real Estate
Demand In Greater Vancouver: 2005-2020, Vancouver, June, 2005. 47 Gordon Price, Vancouver Alderman, Quoted in Vancouver Sun, June 8, 2005.
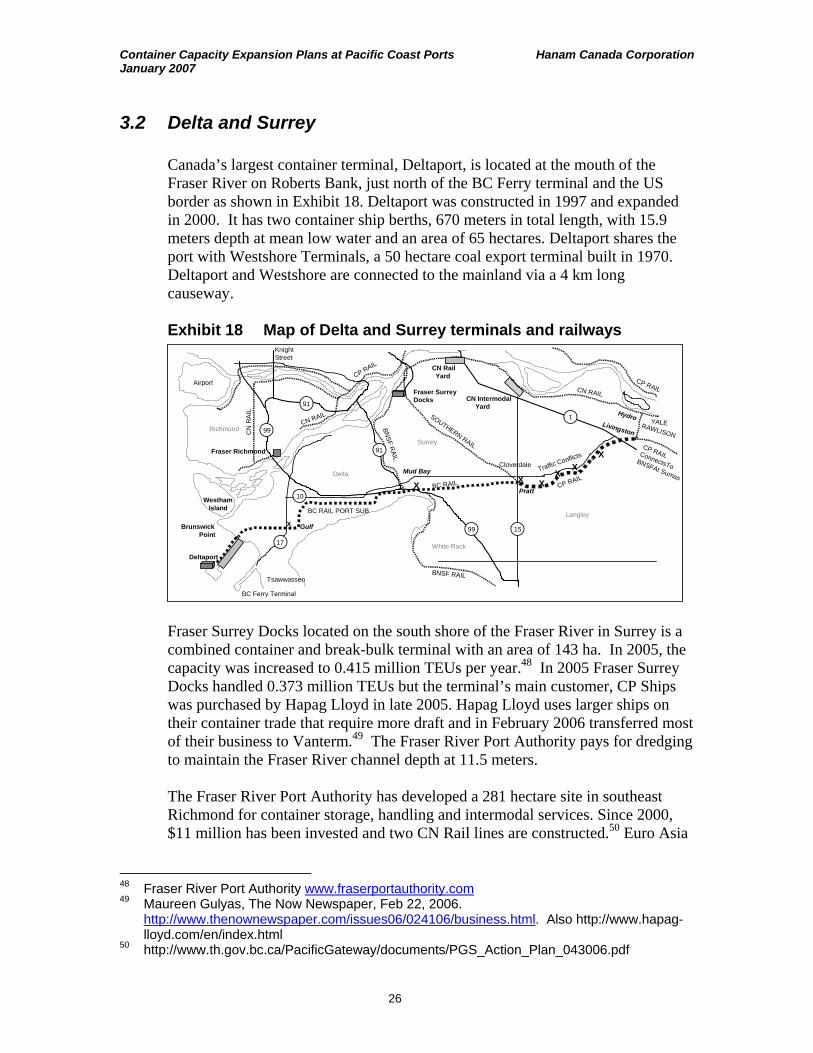
Container Capacity Expansion Plans at Pacific Coast Ports Hanam Canada Corporation January 2007
26
3.2 Delta and Surrey
Canada’s largest container terminal, Deltaport, is located at the mouth of the Fraser River on Roberts Bank, just north of the BC Ferry terminal and the US border as shown in Exhibit 18. Deltaport was constructed in 1997 and expanded in 2000. It has two container ship berths, 670 meters in total length, with 15.9 meters depth at mean low water and an area of 65 hectares. Deltaport shares the port with Westshore Terminals, a 50 hectare coal export terminal built in 1970. Deltaport and Westshore are connected to the mainland via a 4 km long causeway.
Exhibit 18 Map of Delta and Surrey terminals and railways
Richmond
Delta
Surrey
CN IntermodalYard
Fraser Surrey Docks
Deltaport
Langley
White Rock
Airport
CN RailYard
BNSF RAIL
SOUTHERN RAIL
CN RAIL
99
BNSF R
AIL
CP RAIL
BC Ferry Terminal
Tsawwassen
91
91
CP RAIL
15
XX
XX
10
17
XTraffic Conflicts
Fraser Richmond
CP RAILBC RAIL
BC RAIL PORT SUB
Cloverdale
X
1
99
Knight Street
RAWLISON
Pratt
Livingston
Hydro YALE
CP RAILConnectsToBNSFAt Sumas
Gulf
XMud Bay
CN RAIL
CN
RAI
L
WesthamIsland
BrunswickPoint
Fraser Surrey Docks located on the south shore of the Fraser River in Surrey is a combined container and break-bulk terminal with an area of 143 ha. In 2005, the capacity was increased to 0.415 million TEUs per year.48 In 2005 Fraser Surrey Docks handled 0.373 million TEUs but the terminal’s main customer, CP Ships was purchased by Hapag Lloyd in late 2005. Hapag Lloyd uses larger ships on their container trade that require more draft and in February 2006 transferred most of their business to Vanterm.49 The Fraser River Port Authority pays for dredging to maintain the Fraser River channel depth at 11.5 meters.
The Fraser River Port Authority has developed a 281 hectare site in southeast Richmond for container storage, handling and intermodal services. Since 2000, $11 million has been invested and two CN Rail lines are constructed.50 Euro Asia
48 Fraser River Port Authority www.fraserportauthority.com 49 Maureen Gulyas, The Now Newspaper, Feb 22, 2006.
http://www.thenownewspaper.com/issues06/024106/business.html. Also http://www.hapag-lloyd.com/en/index.html
50 http://www.th.gov.bc.ca/PacificGateway/documents/PGS_Action_Plan_043006.pdf

Container Capacity Expansion Plans at Pacific Coast Ports Hanam Canada Corporation January 2007
27
Transload Inc., a Burnaby-based warehousing and freight-forwarding operator, has leased a four hectare portion on the property.
The division of business between the five railways in the Roberts Bank railway corridor has an impact on competitiveness of Canada’s Pacific coast ports.
By agreement, CN is allocated 7,300 meters of container train per day and CP Rail, 3,650 meters of container train per day from Deltaport. At present there are about 20 trains per day through Langley: 12 coal trains, 6 container trains, and 2 local trains. Of the container trains CN has two 3,650 meter long trains and two 2,000 meter long trains per day and CP has two 2,000 meter trains per day. The Third Berth Project would add one 2,000 meter and two 3,650 meter container trains per day. With Terminal 2, there would be approximately 9 additional container trains for a total 30 trains per day.51
The Fraser Valley rail corridor serving the container terminal has five segments: BC Rail Port Subdivision, the BNSF rail line from Mud Bay to White Rock, CP Rail Page Subdivision, CN Rawlison subdivision, and the CN Yale Subdivision. The 38 km long BC Rail Port Subdivision is owned by the province of BC and connects Deltaport with BNSF Rail, CP Rail and Southern Rail. The line extends to Pratt Station near 184th Street in Surrey. BC Rail owns and controls the rail sidings along the causeway up to the Gulf Yard in Delta that are used to build and deconstruct trains essential to port operations. The Gulf Yard consists of three 3.0 km long tracks extending from 41B Street to 57B Street in Delta.
The BNSF Railway runs from Mud Bay to the US border at White Rock. According to BNSF it is economic to transport containers from Vancouver to Chicago via BNSF but they cannot have access to Deltaport. BNSF Rail has four tunnels south of Bellingham along the Chuckanut ocean front route that fit double stacked 8 foot high containers but not 10 foot high containers. The tunnels are 304, 230, 99 and 46 meters long and could be notched to accommodate the higher double stacked containers at a cost of $5 million.
The CPR Page Subdivision is a 12 km segment from Pratt through Langley to Livingston near 232nd Street. The Southern Railway of BC has operating rights to use this track to connect New Westminster, Annacis Island, Fraser Surrey Docks to CPR, CN and BNSF.52 The 2.5 km CN Rawlison Subdivision in Langley connects CPR’s Page Subdivision at Livingston to CN’s main track, at Hydro. The CN Yale Subdivision is 22 km long between Hydro and Matsqui Junction and is double track except for a 6 km stretch near Abrahamson.
51 John Manson, Director of Engineering, City of Langley, April 14, 2005
http://www.city.langley.bc.ca/pdf/deltaport.pdf 52 http://www.sryraillink.com/about/history.htm

Container Capacity Expansion Plans at Pacific Coast Ports Hanam Canada Corporation January 2007
28
Plans
• TSI’s Deltaport is increasing nighttime and weekend truck operations.
• Deltaport 3rd Berth- Deltaport is adding a 3rd berth at a cost of $400 million.53 The berth length will be increased from 670 to 1,135 m, a ship turn-around basin will be dredged, and all berths will have 15.9 meters draft. The project includes an infill of 20 hectares as shown in Exhibit 19. The project received provincial approval on September 29, 2006 and on November 3, 2006 the Federal Minister of Environment, announced conditional environmental project approval.54 The project is expected to be in service in 2009.
Exhibit 19 Deltaport 3rd Berth Project 2009
• Delta track and train yard expansion- A study is presently underway to evaluate where road and rail separations along the Roberts Bank Rail Corridor would support terminal expansion at Roberts Bank.
• New rail sidings- A Greater Vancouver Gateway Council study identified
conceptual rail infrastructure improvements along the Roberts Bank Rail Corridor. More detailed analysis related directly to Roberts Bank operations could produce a variation on these improvements:
– Additional track on the existing causeway – Mud Bay sidings for BCR and BNSF $23.2 million – Double track in BCR in Delta & Surrey 12 km $22.4 million – Double track CN line between Hydro and Matsqui $15.8 million
• Highway improvements- A $3 million project is planned to mitigate the impacts
of additional daily truck-trips.
53 Pacific Gateway Strategy Action Plan, April 2006. Pg. 20. 54 BC Environmental Assessment Office, November 3, 2006.
http://www.eao.gov.bc.ca/epic/output/documents/p212/1159550008290_c1624f1dd3bc47649a2cae567ee2f891.pdf

Container Capacity Expansion Plans at Pacific Coast Ports Hanam Canada Corporation January 2007
29
• Roberts Bank Terminal 2- The planned Terminal 2 would expand capacity by 1.9 million TEUs per year.55 Initial plans are for three berths, 10 cranes, on-site rail tracks, container storage, and widening the Roberts Bank causeway for additional rail sidings, and 80 hectares of infill land at a cost of $900 million as shown in Exhibit 20.56 The Vancouver Port Authority started the environmental approval process for Terminal 2 in 2003 but withdrew the application in February 2006. 57
Exhibit 20 Roberts Bank Terminal 2
• Environmental legacy- Deltaport is located on the Fraser River estuary and conservation organizations generally oppose port expansion. However if the expansion proceeds, it is likely that an environmental legacy would be a necessary part of the plan to help gain local support. Some of the design requirements proposed include: two for one habitat compensation, a Roberts Bank wildlife management area and burial of power lines to reduce bird mortality.58
55 Vancouver Port Authority, Port Plan, 2005. www.portvancouver.com/the_port/portplan.html 56 Port of Vancouver, Roberts Bank Container Expansion Project, Brochure, May, 2003.
www.eao.bc.ca 57 Patrick McLaughlin, Vancouver Port Authority, Director Container Development Group, Letter
to BC Environmental Assessment Office, Feb. 6, 2006. 58 Mary Tait, Director, Boundary Bay Conservation Committee, Delta,June, 5, 2003.
www.eao.gov.bc.ca
Container Capacity Expansion Plans at Pacific Coast Ports Hanam Canada Corporation January 2007
30
• Railroad Grade separations- There are 16 private and 38 public at-grade rail crossings on the Roberts Bank Rail Corridor.59 A technical evaluation of potential grade separations on this corridor is presently underway with a final report anticipated in early 2007. The 204th Steeet overpass project will be completed in 2007 with funding from TransLink, the City of Langley, the BC Ministry of Transportation and Transport Canada.
• Roberts Bank Land development adjacent to the causeway- The Tsawwassen
First Nation, has been offered 434 hectares of land adjacent to Roberts Bank in addition to their 290 hectares of reserve land.60 When their treaty is signed, 207 hectares could likely be removed from BC’s Agricultural Land Reserve, and the Nation could choose to allow development.
• South Arm Dredging- The Fraser River Port Authority proposes to deepen the
Fraser River channel from 11.5 to 12.5 meters the limit of the Massey Tunnel at a cost of $175 million plus on-going maintenance costs for dredging.61 With tidal aid ships of 13.5 meters draft can pass over the George Massey tunnel.
• Richmond container terminal- Fraser Port Authority plans to convert the
existing Richmond container storage yard to a 0.8 million TEU container terminal by 2010. Site development costs are estimated at $300 million, highway access costs at $40 million and Fraser River channel deepening costs $175 million.62
Issues
• Timing of environmental approvals for Terminal 2- Obtaining environmental
and other approvals for Deltaport’s third berth project has taken 4 years so far and Asian customers have stated concerns about Canada’s timetable for Terminal 2.
• Fish and bird habitat- Fisheries and Oceans Canada has expressed concerns
related to the destruction of salmon fingerling habitat and Environment Canada is concerned about the destruction of sandpiper habitat.63
• Community opposition to infill at Roberts Bank- There could be extra costs of
addressing non-regulatory concerns of environmental and community groups. 64
59 Transport Canada, “Canada’s Asia-Pacific Gateway and Corridor Initiative” Ottawa, 2006. 60 Tsawwassen First Nation, Tsawwassen Final Agreement, Dec. 1, 2006.
www.tsawwassenfirstnation.com/TFN_FA_Dec_1_2006_Final.pdf 61 Pacific Gateway Strategy Action Plan, April 2006. Pg. 29. 62 Pacific Gateway Strategy Action Plan, April 2006. Pg. 29. 63 Letter of April 1, 2003 from Jeff Johnson, A/Chief. Habitat and Enhancement Broach, DFO to
VPA, Container Development Group. 64 Peter O’Neil, Vancouver Sun, Dec. 12, 2006.

Container Capacity Expansion Plans at Pacific Coast Ports Hanam Canada Corporation January 2007
31
• Financing of Terminal 2- The Vancouver Port Authority’s borrowing limit may need to be raised.
• Level railroad crossings- Community agreement on these projects may take
time.
• Competitive rail service- Encouraging competition from BNSF at Deltaport may reduce transcontinental rail shipment prices and benefit eastern Canadian consumers and the Roberts Bank container terminals.
3.3 Prince Rupert
The new Fairview container terminal is being constructed to handle 500,000 TEU per year containers mainly for trade with China starting in mid 2007. Investments have been made by Maher Terminals, Berkeley Heights, New Jersey, and CN Rail. Fairview Terminal’s historical business was shipping lumber and pulp. Later specialty grains like canola, bran and dehydrated alfalfa pellets were handled in bulk. Concentrated copper ore was also shipped from the terminal. There are two ship berths and two 4,000 tonne capacity grain storage silos. At present, the rail line handles only some export lumber.65
CN anticipates that the containers will originate mainly in China and that return containers will include polyethylene, sulfur, malt, barley, beans, lentils, and peas from Alberta and Saskatchewan. The specialty crops will be filled into containers at Regina and Edmonton. The target market for these crops is mainly China where CN has a sales presence. Other potential export products are fish, specialty wood products and bottled water.66
CN forecasts that the number of trains will increase by 2 trains per day on opening of the Fairview container terminal.67 The total number of trains forecast for the end of 2007 is 7 trains per day.68 At the design capacity there would be 4 container trains per day, 2 in each direction. Future phases for container shipments are planned that would increase container traffic to 2 million TEU’s per day. Forecasts by companies operating at the port are for 10 trains per day by 2008.69 The current capacity of the rail line is about 12 trains per day.
65 Richard Kummen, Director of Sales, Forest Products, Western Canada, CN Rail. 66 Jim Rushton, Economic Development Officer, Prince Rupert quoted by Don Cayo, Vancouver
Sun, August 31, 2005. 67 Doug Haddenlach, Sales Director, International Sales, CN Rail, Calgary. 68 CN Rail
http://www.cn.ca/specialized/ports_docks/prince_rupert/en_KFPortsPrinceRupert.shtml 69 Gordon Eisenhuth, P.Eng., Bridge Engineering Section, Rail and Navigable Waters
Coordinator, BC Ministry of Transportation.

Container Capacity Expansion Plans at Pacific Coast Ports Hanam Canada Corporation January 2007
32
CN Rail’s crossing of Highway 16 40 km west of Terrace close to the Skeena River bank had 15 accidents in the past 5 years, 14 in the westbound direction, 1 fatality and 9 injuries.70 Highway 16 is a major trade corridor and the North Coast Regional Transportation Advisory Committee and the Port of Prince Rupert considers this crossing to reduce the reliability of CN’s track. Liquefied petroleum gases used in southern Alaska and visitors to Alaska move along this route.
Plans
• Export container stuffing terminals- Grain and other agricultural products will
be packed into containers in Edmonton and forest products will be packed in Prince George.
• Second terminal- A second phase for this terminal would add 1.5 million
TEUs per year capacity at a cost of $380 million and could be completed by 2010. Development of this second terminal will depend on the success of the initial project.
• Overpass at Dumont’s Crossing- The BC Ministry of Transportation is
seeking funding assistance to eliminate this crossing 40 Km west of Terrace on Highway 16 at an estimated cost of $20 million.
• South Kain Island container terminal- Preliminary planning has started for a
second container terminal on South Kain Island in the Port of Prince Rupert. The capacity could be 2 million TEUs per year.
Issues
• Shipping route adjustment- Other container ports on the Pacific coast such as
Los Angeles, Oakland, Seattle and Vancouver have large local markets for the products arriving in the containers and whether Prince Rupert can successfully compete with these ports is still unclear.71
• Rail reliability- All of the shipping companies interviewed expressed concerns
about CN’s reliability to and from Prince Rupert. Companies are concerned that if there were an accident on the route, a landslide, or a labor dispute, they would have no alternative port option like they have in Vancouver, Seattle and Tacoma.
70 Apex Engineering, 11 March, 2004. 71 Lorne Keller, VP Marketing, Prince Rupert Port Authority, March 23, 2005.
http://www.rupertport.com/pdf/presentations/opportunities%20mar2305.pdf

Container Capacity Expansion Plans at Pacific Coast Ports Hanam Canada Corporation January 2007
33
3.4 Seattle, Tacoma and Portland
The main customer for the Port of Seattle, accounting for 20% of its income from cargo, is Hanjin of South Korea at Terminal 46 in downtown Seattle shown in the aerial photo, Exhibit 21. Hanjin’s lease with the Port of Seattle expires in 2015 but it includes a 10-year extension option.72
Exhibit 21 Aerial photo of Seattle container terminals
Architectural plans have been prepared by Seattle real estate developers that they say will provide nine times more employment and make more diverse and community friendly use of the 37 hectare Terminal 46 site.73 Higher income generating uses including condominiums, offices, restaurants, a hotel, sports arena, cruise ship terminal, and parks would eliminate the property tax subsidy that the Port receives.
Terminal 46 is separated from interstate highways and rail routes by the Alaska Way Viaduct, an aerial highway that was damaged in the 2001 Seattle earthquake. Terminal 46 and the proposed Terminal 30 nearby requires a new highway connecting Interstate 90 to the waterfront, or some alternative. However the Port of Seattle and the City of Seattle disagree on this project and there is little indication that a solution will be found.74
72 Marc Stiles, Seattle Daily Journal of Commerce, Jan. 26, 2005. 73 Paul Nyhan, Seattle Post Intelligencer, August 11, 2004. 74 Kristen Bolt, Seattle Post Intelligencer, June 9, 2006.
http://seattlepi.nwsource.com/business/273347_container09.html
Container Capacity Expansion Plans at Pacific Coast Ports Hanam Canada Corporation January 2007
34
The lowest cost options favored by the mayor of Seattle for dealing with the earthquake damaged Viaduct would eliminate or reduce container operations at Terminal 46.75,76 Three options being considered by the state governor are:
• Waterfront tunnel $4 -6 billion • Replace viaduct $3 billion • At grade waterfront road $2 billion.
The lowest cost plans include rebuilding the seawall, regenerating existing piers for a variety of commercial and public uses including cruise ships and a ferry. The downtown waterfront would become more like San Francisco, Portland, and San Diego. In summary, Seattle is vulnerable to competition and could lose one of its three container terminals by 2020.
The Port of Tacoma opened two new container terminals in 2005, Yang Ming and Evergreen Marine and renovated K Line's terminal. Accordingly, K Line and Yang Ming are sending less cargo through Seattle and Tacoma’s container throughput is expected to overtake Seattle’s this year.
Plans
• Convert cruise ship Terminal 30 for containers- The Port of Seattle plans to
move cruise ships from downtown Terminal 30 to Pier 91 and to convert the existing cruise terminal for containers. However this preliminary plan, if implemented, adds only minor new capacity. The conversion of Terminal 30, received initial design money in February, 2006, but could be rejected if costs exceed $120 million.
• Intermodal yard expansion- BNSF Rail plans to expand its Seattle
International Gateway yard and add a second shift on Terminal 5's intermodal yard.
• Continuous gate hours at Seattle.
• Purchase off-dock container storage yards in Seattle- Eight hectares of off-
dock container storage yards would be purchased and leased back to terminal operators or shipping lines.
• Tacoma Evergreen terminal expansion- Maersk Sealand has preliminary plans
to expand its container terminal from 54 to 116 hectares. A 26 hectare expansion of the Evergreen container terminal is planned by 2010 at a cost of $84 million.
75 City of Seattle, Department of Planning and Development, Nov. 20, 2006. 76 Allied Arts, Seattle http://www.alliedarts-seattle.org/l_waterfront/collaborative.html

Container Capacity Expansion Plans at Pacific Coast Ports Hanam Canada Corporation January 2007
35
• Tacoma Hyundai terminal expansion- Plans are to increase its area from 32 to 60 hectares.
• Tacoma K-Line terminal expansion- A new facility is planned for K-Line that
can expand to 22 hectares. Upgrades are also planned for the north and south intermodal rail yards.
• New terminal- The Port of Tacoma is planning a $300 million investment for
a new terminal by 2011.77,78 On-dock intermodal rail yard is planned as part of this project.
• Widening Blair Waterway- The port plans to widen the 15.5 meter deep
waterway to 260 meters to accommodate 15,000 TEU container vessels.
• SSA Marine Terminal- In June 2006, SSA Marine bought 21 hectares of property near the Blair waterway and land owned by the Puyallup Tribe of Indians.79 The port and tribe own waterfront land nearby and have been discussing a partnership to develop a new container terminal.
• Land purchases- The Port of Tacoma and nearby Port of Olympia has
assembled a 600 hectare parcel of land that can be used for port expansion in the longer term.
• Portland has 7 container cranes but only 200,000 TEU/y of business. The Port
is planning to add 3 more cranes and to extend the container terminal dock partly to unload imported steel slabs.
• Columbia River dredging- Portland and five other ports are contributing to a
$40 million dollar per year dredging program along a 166 km of the Columbia River over the next three years. The navigation channel is being deepened from 12.2 to 13.1 meters. By comparison the Fraser River channel to Surrey is 11.5 meters deep and the proposal is to deepen it to 12.5 meters. However 15 meters depth is required for a competitive container terminal.
Issues
• Productivity- Seattle and Tacoma have relatively short working hours
compared with other ports. All containers are handled by International Longshore Workers Union members. The Port of Seattle has about 700
77 Christina Shevery, New York Times, Aug. 23, 2006.
http://www.nytimes.com/2006/08/23/business/ 78 Steve Wilhelm, Puget Sound Business Journal, Oct. 28, 2005.
http://seattle.bizjournals.com/seattle/stories/2005/10/31/story7.html 79 Kelly Kearsley, The News Tribune, Tacoma, April 26, 2006.

Container Capacity Expansion Plans at Pacific Coast Ports Hanam Canada Corporation January 2007
36
members plus 700 casuals and the Port of Tacoma has 850 members plus 550 casuals.80
• Urbanization- If downtown revitalization plans proceed the volume of
containers going through Terminal 46 may decline. Hanjin’s Total Terminals operates in Long Beach, Oakland and Tacoma and could relocate their business.
• Poor highway access- Terminal 46 has access to the freeway by temporary
ramps that exit to congested city streets.
• Security- In August 2006, The Port of Seattle evacuated a perimeter of one kilometer around Terminal 18 after bomb-sniffing dogs indicated that two containers could contain explosives.81 Vancouver and Seattle share many concerns related to container terminals near the city center.
• First Nations land issues- Tribal leaders have not decided if they want to
develop Tacoma terminal land on their own or with the port. The Puyallup Tribe got the property in 1989 with the resolution of a longtime dispute over treaty rights.
• Distribution warehouse moratoriums- Cities near Seattle and Tacoma have
limited new distribution warehouses because they generate few new jobs; provide little property tax and attract trucks that add to traffic congestion.
• Dredging costs- At present the federal government is the main source of funds
but Portland handles less than 0.5% of the Pacific coast containers.
• Rail capacity- The Stevens Pass tunnel east of Seattle is at capacity with 25 trains daily. More trains, about 40 per day, are using the longer BNSF route along the Columbia River but investments are required along this route to expand capacity.
3.5 Oakland
Most container business in the San Francisco Bay area has been consolidated from many smaller piers and several ports to a single site with seven terminals in the Port of Oakland. Oakland’s rapid growth is partly due to redevelopment of Port of San Francisco properties. For example 120 hectares of waterfront rail yards in the South of Market area near the main business district are being
80 Alwyn Scott, Seattle Times, April 3, 2005. http://www.ilwu.org/longshore/upload/04-03-
05%20Seattle%20Times.pdf 81 Heraldnet, Seattle, August 6, 2006.
http://www.heraldnet.com/stories/06/08/16/100wir_port1.cfm

Container Capacity Expansion Plans at Pacific Coast Ports Hanam Canada Corporation January 2007
37
redeveloped. A $4 billion plan calls for 6,000 housing units, university, 80,000 square meters of retail space, hotel, school, fire stations, and open space. The Port of San Francisco site has many characteristics similar to the Centerm and Vanterm areas in Vancouver. When the new container terminal capacity is built at Delta like it was in Oakland, some of the downtown Port of Vancouver properties could be developed like they are in San Francisco.
Plans
• Extended gate hours- Beginning September, The Port of Oakland and
Stevedoring Services of America initiated a 3 month trial project to extend gate hours from 6 PM to 2:30 AM, Monday through Friday for exports only. The project is intended to assist agricultural shippers, relieve traffic congestion and reduce air pollution.
• APL Container terminal expansion- In July this year Oakland finalized a 15-
year lease extension for APL with two subsequent 5-year options. Oakland is renovating the APL container terminal to triple capacity from 340,000 to 920,000 TEU per year over the next 3 years.82
• Berth 21- Oakland is redeveloping a 146 hectare former army base adjacent to
their existing container terminals. A 100 hectare intermodal terminal is planned for the east portion of the site and Berth 21 is planned for the west portion of the site as shown in Exhibit 22. A 7th Street grade separation is part of the project.
Exhibit 22 Port of Oakland Berth 21 Project
82 APL Press Release, July 26, 2006. http://www.apl.com

Container Capacity Expansion Plans at Pacific Coast Ports Hanam Canada Corporation January 2007
38
• Dredging 14 berths- Oakland is spending $50 million to dredge 14 of the 19 container berths from 12.8 to 15.2 meters and the shipping channel from 14.0 to 15.2 meters. This project has been designated for priority federal funding and is scheduled to be completed by April, 2009.
• Reconstruction of outer harbour container terminals- Several older terminals
in the outer harbour are being reconstructed to receive larger container ships. The cost of this development is over $100 million.
Issues
• Draft restrictions- Only the two newest of Oakland’s seven container
terminals are deep enough to handle the larger container ships. The other five terminals offer only 12.8 meters of draft. Extensive on-going investments in wharf upgrading and dredging are required for Oakland to meet its expansion goals.
• Environmental aspects of dredging- Dredged material from channel deepening
will be used to create a 72 hectare shallow water ecological reserve in the Middle Harbor. The Port will create a new 15 hectare park to surround the water habitat to give the public access to the shoreline.
3.6 Long Beach and Los Angeles
The Long Beach and Los Angeles ports are the busiest in North America. More than 5,000 ships per year pass through these ports with a record of 94 per day set in 2005. Much of the land used by these ports is from landfills into the ocean. Long Beach is enlarging its existing terminals. For example, Piers G and J North were consolidated in 2005 for use by K-Line, Cosco, and Yang Ming with a common operator, ITS owned by K-Line. This terminal has 1,900 meters of berth length. The most recently constructed new terminal, Pier T has 1,500 meters of berth length.
The Port of Los Angeles’ 3,000 hectares of land and water make it one of the largest constructed harbours in the world. The Port has expansion plans of similar scale as Long Beach based on rebuilding existing terminals. The most recently constructed APM terminal has 6 berths with a total berth length of 2,200 meters.
Both ports have many air pollution control projects underway. Long Beach has a tracking system for airborne chemicals. At its newest terminal, by 2009 70% of ships must use shore-based power or generator fuel with less than 0.2% sulfur.83 Dockage rates are reduced 15% if ships travel at less than 12 knots within 20 miles of the coast. Los Angeles provides 400-amp, 6.6 kV, 3 phase plug
83 Port of Long Beach http://www.polb.com/environmen/air_quality/vessels/default.asp

Container Capacity Expansion Plans at Pacific Coast Ports Hanam Canada Corporation January 2007
39
receptacles at each berth. Los Angeles requires no net emission increases in any expansion.84
Plans
• Long Beach container terminal consolidation and redevelopment- Seven of
the eight existing container terminals are being consolidated into five large terminals each exceeding 120 hectares in size.
• New fill areas- 180 hectares new landfill is proposed at Long Beach by 2020.
• Long Beach Terminal S- The most significant addition in capacity is Terminal
S, a redeveloped oilfield property. This is already partly completed and further planning is well underway. This development very similar to the recently completed 156 hectare terminal T.
• Expansion of Long Beach Hyundai Terminals- Container terminals now
operated by Hyundai and OOCL are being consolidated into a single 135 hectare terminal.
• Expansion of Long Beach SSA Terminal A.
• China Shipping Terminal Los Angeles- Three new berths on 54 hectares of
land, two bridges and two new buildings are planned.
• Yang Ming Terminal at Los Angeles- A new terminal is proposed at pier 121-131 for Yang Ming Shipping. This terminal will provide 5 new berths and 12 container cranes. Additional work includes redevelopment of 11 hectares of backland, terminal buildings and rail improvements.
• Expansion of Trapac terminal- This terminal will be redeveloped to provide
an additional 21 hectares, 3 new berths, 5 new cranes, new buildings and entry gates, new on-dock rail facility, and shore based maritime electricity.
• Expansion of Evergreen terminal- Improvements are planned for the wharves,
backland, crane rails, gates, roadways and railway tracks.
• Waterfront public access- Los Angeles is redeveloping 160 hectares of port property along a 13 kilometers of waterfront to allow public access and triple the amount of open space including a pier, marina, beaches, promenades for cruise ship passengers, shops and artistic features. The Port recently opened two new one hectare playing fields, Bayview and Neptune, near the container terminals.
84 Port of Los Angeles. No Net Increase Strategy. March 15, 2005. www.portoflosangeles.org

Container Capacity Expansion Plans at Pacific Coast Ports Hanam Canada Corporation January 2007
40
Issues
• Congestion at both ports- In 2005, 118 ships, about 2% of the total, were diverted to other ports.
• Air pollution.
• Dredging- About 18 of the 30 container ship berths in the Port of Los Angeles and
13 of the 39 in the Port of Long Beach will need to be dredged to accommodate larger containerships. Some of the older berths have only 10.7 meters of draft.
• Habitat restoration to compensate for environmental effects of dredging and new
construction.
3.7 Manzanillo, Lazaro Cardenas, and Ensenada
Manzanillo and Lazaro Cardenas container ports serve mainly Mexico City, Guadalajara, Monterrey and other Mexican cities. In June 2006 the US based Kansas City Southern Railway and its Mexican subsidiary began daily container train service from the Lazaro Cardenas with a commitment to provide transit times to Jackson, Miss. and Atlanta, GA that are competitive with those from US Pacific coast ports. A former US air force base in San Antonio, TX, has been converted into a large distribution center and containers transported by KCSR from Lazaro Cardenas would not clear US customs until they reach San Antonio.
However SSA Mexico representatives point out that in 2006, there were no international transits starting from Manzanillo and only a 90 container test shipment from Lazaro Cardenas. The containers were transferred to trucks at the US border because KCSR did not want their Mexican railway equipment to go over the border. Most shipping companies do not bring cargo directly to Mexico. They first call on Los Angeles or Long Beach and then continue on to Mexico. The trip from Los Angeles to Lazaro Cardenas is 68 hours and this gives containers unloaded in Los Angeles a head start for deliveries in the US mid-west. Because ships take longer to get to Manzanillo and Lazaro Cardenas it is difficult for Mexican terminals to compete with US and Canadian terminals for US mid west business.
Ensenada, located 340 km south of Los Angeles and 140 km south of San Diego currently handles 95,000 TEUs per year and the Port forecasts 200,000 TEUs by 2010. Ensenada has one berth with four cranes and most of the growth is expected to come from in-bond shipments to the US. However, Ensenada is not competitive with other container ports because it has no railroad.

Container Capacity Expansion Plans at Pacific Coast Ports Hanam Canada Corporation January 2007
41
Plans
• Two more berths at Manzanillo- The existing two berths, on dock container storage and rail tracks are being doubled.85 A 300 meter third berth is just coming into service and a fourth container berth 200 meters long will be in service early next year. Paving construction has started on additional storage of 12 hectares.
• Lazaro Cardenas expansion- Hutchinson Holdings has a $200 million
expansion underway that will increase the capacity from a single berth with 3 cranes to 5 berths and 10 cranes. The site will expand from 15 to 100 hectares. Following completion the port will have a capacity of 2.5 million TEUs per year. Phase 1 includes a 425 meter 2 berth pier with a capacity of 375,000 TEUs per year. Construction began in 2005 and is expected to be completed this year. Subsequent Phase 2 and 3 will include the construction of two additional terminals.86
• Rail yard and customs zone at Lazaro Cardenas- Kansa City Southern Rail is
building a 180 hectare rail yard and secure customs zone near the new port and 160 hectare intermodal yard in Houston and Kansas City. The rail trip from Lazaro Cardenas to Houston is 640 kilometers shorter than from Los Angeles but the distance to Chicago is 320 kilometers longer.
• New container port at Punta Colonet- A new port is proposed at Punta
Colonet located 130 km south within Ensenada Municipality but under federal jurisdiction. The plans are being developed by a stevedoring company Marine Terminals Corp., Oakland, CA. The port would be built on rip-rap landfill in 3,000 hectares of seawater and tidelands. Preliminary plans call for 4 container terminals with 4 berths each.87
• Ensenada- El Centro Railroad- A new railroad is proposed to connect the
existing small port at Ensenada and the proposed Punta Colonet port with Union Pacific connecting into the US at El Centro, California. One route is to go 200 km north to a border crossing at Tecate and then 120 KM eastward to connect with Union Pacific at El Centro. The other route would run 310 km to the northeast to connect with Union Pacific’s Mexican subsidiary at Mexicali and then 20 KM north to connect with UP Rail at El Centro. Both routes cross the Sierra de Juarez mountain range and the proposed track may be difficult and very costly to build. The cost for railway, port infrastructure, breakwater, terminals and equipment would be $5 billion.
85 SSA Mexico, Manzanillo, Nov. 17, 2006. 86 CG/LA Ports & Logistics Project Analytics, Building Mexico’s Port Infrastructure, Dec. 23, 2005. 87 Carlos Gonzales, Port of Ensenada, Feb. 1, 2006. http://www.ffca2006.com

Container Capacity Expansion Plans at Pacific Coast Ports Hanam Canada Corporation January 2007
42
Issues
• Political- The Ensenada project may not receive support from California and the US since it is designed to compete directly with Los Angeles and Long Beach.
• Environmental- The environmental and socio-economic impacts of the
proposed new port and railroad in Mexico have not yet been evaluated. The new railroad plan does not seem sufficiently advanced that it could be completed by 2020.
• Lazaro Cardenas container terminal is at the north arm of the Balsas River and
estuary ecosystem restoration has been identified as a priority by Mexican and international environmental agencies.88
3.8 Balboa (Panama)
The Panama Canal has been operating at close to capacity and cannot handle the new larger container ships. About 16% of the container traffic through Panama is now by rail. The 76 KM rail bridge passes through the Port of Balboa container terminal and runs parallel to the Panama Canal.89 The railway is owned equally by subsidiaries of Kansas City Southern Railway and Panama Holdings of Hazelcrest, Illinois.
Plans
• Rail bridge expansion- Hutchinson is expanding its container terminal at the
rail bridge across Panama. The dock is being extended from 350 meters to 1,500 meters, 9 post Panamax cranes are being added, and the storage area is being expanded from 8 to 50 hectares. In the past two years, $130 million has been invested, and another $200 million investment is planned.
• Panama canal widening- A $5.25 billion third locks project was approved by
Panamanian voters in a referendum in October 2006. These locks will be 427 m by 55 m wide and 18.3 m deep.90 The locks could be operational by 2015 and will be adequate for up to 12,000 TEUs ships.
• New terminal at Farfan- The Japanese government has prepared a feasibility
study for redeveloping the former US Howard air base into a new port at Farfan near Balboa on the Pacific side at an estimated cost of $ 1 billion.
88 Institodo Nacional de Ecologia, La Cuenta del Rio Balsas, March 31, 2005.
www.ine.gob.mx/ueajei/publicaciones 89 Kansas City Southern Railway, http://www.kcsi.com/customer/cus_international.html 90 www.pancanal.com/esp/plan/documentos/propuesta/acp-proposal-relevant-information.pdf -

Container Capacity Expansion Plans at Pacific Coast Ports Hanam Canada Corporation January 2007
43
Issues
• Canal tariff- An increase in the tariff passing through the canal is required to finance expansion. The competitiveness of the Panama Canal third locks project with the newly upgraded trans Panama rail system is unclear. The proposed Farfan container terminal may not be necessary if the canal tariffs are competitive.
• Panama Canal third locks project may need design changes- The design of the
proposed locks is insufficient to handle containerships in excess of 12,000 TEU ships, which are expected to be in-service by 2015. These ships are 22 containers across, requiring one meter more than the 55 meter planned width.91
91 Lloyd’s Register (2006) Container Ship Focus, June 2006, Issue 2. page 3.

Container Capacity Expansion Plans at Pacific Coast Ports Hanam Canada Corporation January 2007
44
4. ASSESSMENT OF COMBINED EXPANSION PLANS
4.1 Container growth forecast
Our projections for growth of container freight on the Pacific west coast are shown in Exhibit 23. The projection is based on actual data for 2001 to 2006. The weighted average growth forecasts of shipping companies interviewed was used to project growth from 2.3 million TEUs per year in 2006 to 3.1 million TEUs per year by 2010.
Exhibit 23 Graph of container freight growth by region
0
2
4
6
8
10
12
14
16
2000 2002 2004 2006 2008 2010 2012 2014 2016 2018 2020
Panama
Long Beach
Los Angele
s
Oakland
Seattle & Tacoma
CANADA
Mexico
YEAR
Mill
ions
of T
EUs
per y
ear
2000 2002 2004 2006 2008 2010 2012 2014 2016 2018 2020
0
2
4
6
8
10
12
14
16
Our forecast of 5.6 million TEUs per year by 2020 corresponds with shipping company forecasts. It is close to the midpoint of the Vancouver Port Authority’s December 2006 forecast range, the same as a forecast done for Fairview Terminals in March 2005 by Norbridge Consulting and close to the 5.8 million
Container Capacity Expansion Plans at Pacific Coast Ports Hanam Canada Corporation January 2007
45
TEUs per year forecast by Novacorp International in January 2005. 92,93 The line slope to 2020 is steeper than the past because the new Prince Rupert terminal will come on line in 2007.
Several lower forecasts for 2020 have been published. In November 2004 the Port of Vancouver forecast 4.4 million TEUs per year excluding Fairview Terminals.94 The forecast contained in the Port’s Berth 3 Environmental application in January 2005 was 5.3 million TEUs per year excluding Fairview Terminals. If a straight regression line is fit through the data for the period 2001 to 2006, a lower forecast of 5.3 million TEUs per year results. We found two higher forecasts for 2020, one by College Transportation Consulting of 6.0 million TEUs per year, and another by TranSystems Consulting, Norfolk, VA, of 6.8 million TEUs per year. 95,96
One explanation for the discrepancies in forecasts is that some of stated Canadian throughputs for 2020 are goals not forecasts. For example, Colledge Consulting’s forecast in the BC Ports Strategy is 6.0 million TEUs per year but the stated goal with more aggressive terminal expansion is 8.3 to 8.8 million TEUs in 2020. Intervistas Consulting’s forecast reported in The Pacific Gateway Strategy Action Plan is 5.0 to 7.0 million TEUs per year by 2020, close to other forecasts but their reported target demand for 2020 is 8.8 million TEUs per year and a boost in capacity to a total of 9.8 million TEU per year at eight BC locations.97 Another explanation for forecast variations is that some of the expanded throughput at larger terminals comes from declines at smaller ones.
Our forecast for 2010 is reasonable since it is based on the weighted average of shipping company forecasts and is comparable to several other forecasts. Our forecasts fit well with a projection for the past 5 years as shown in Exhibit 26. The forecast for 2010 is that BC will maintain its market share mainly by new business at Fairview Terminals. Assuming Roberts Bank Terminal 2 gets built as scheduled our forecast for 2020 is that Delta will be handling two thirds of BC’s container trade with the balance split between Prince Rupert and Vancouver.
The past performance, short-term forecasts and the long-term forecasts shown on the graph are expressed numerically in Exhibit 24. The chart projections correspond to continued container volume growth on the Pacific coast from 10.8% per year from 2001 to 2006, 6.6% from 2007 to 2010 and 3.7% from 2011
92 Norbridge Consulting, Concord, MA, Feasibility Study Fairview Terminals for the Canadian
Manufacturers’ Association, March 31, 2005. 93 Novacorp International, Short Sea Container Shipping Study, Vancouver, Jan. 2005 94 Jim Cox, VP Infrastructure Development, The Container Opportunity Port of Vancouver, Nov.
20, 2004. 95 Colledge Transportation Consulting Inc., for BC Ministry of Transportation, British Columbia
Ports Strategy, Victoria, March, 2005. 96 TranSystems Consulting, Norfolk, VA, Emerging Canadian Port and Intermodal
Opportunities: A Capacity Assessment, Canada Asia Maritime Conference, Vancouver, Oct. 3, 2006.
97 Intervistas Consulting, Pacific Gateway Strategy Action Plan, 2006-2020, Vancouver, 2006.

Container Capacity Expansion Plans at Pacific Coast Ports Hanam Canada Corporation January 2007
46
to 2020. Much of this growth is from the increase in population. Average growth in BC container shipments from 2001 to 2006 was 14.2% per year. Growth in Seattle/Tacoma was 7.5%, Los Angeles/LongBeach 9.8% and Oakland, 8.2%.
Exhibit 24 Container freight volume and growth forecasts Unit 2001 2006 2010 2020 Containers British Columbia Million TEUs 1.2 2.3 3.1 5.6 Seattle Tacoma Million TEUs 2.3 3.2 4.2 6.3 LA & Long Beach Million TEUs 9.6 15.3 20.0 26.9 Oakland Million TEUs 1.6 2.4 3.3 5.6 Mexico Million TEUs 0.4 1.3 2.8 4.8 Panama Million TEUs 5.0 9.5 10.6 14.2 Pacific coast Million TEUs 20.5 34.3 44.2 63.6 Annual growth 2001-2006 2007-2010 2010-2020 British Columbia % 14.2 7.9 6.0 Seattle Tacoma % 7.5 7.0 4.0 LA & Long Beach % 9.8 6.8 3.0 Oakland % 8.2 8.2 5.4 Mexico % 27.2 21.5 5.5 Panama % 13.8 2.8 0.3 Pacific Coast % 10.8 6.6 3.7 World % 11.8 11.1 5.7
The main factors contributing to uncertainty in the 2020 forecasts are:
• World, US and Canadian economic growth- all ports • US trade deficit & appreciation of Yuan- all ports • Environmental constraints- Delta • Urbanization and higher land values- Seattle, Vancouver • Distribution- Seattle, Vancouver • Rail traffic conflicts- Delta, Seattle • Productivity- Tacoma, Oakland • Political- Ensenada, Balboa • Rail capacity- Seattle, Ensenada • Dredging costs- Surrey, Portland • First Nations- Tacoma, Delta • Highway access- Seattle
Seattle and Delta timing issues contribute the greatest uncertainty in our forecasts. If Roberts Bank Terminal 2 does not proceed, Prince Rupert and Tacoma could each gain about half of the planned Terminal 2 capacity of 1.9 million TEUs per year. Swings of up to 0.5 million TEUs per year result from uncertainty related to rail and port operations in downtown Seattle and Vancouver.

Container Capacity Expansion Plans at Pacific Coast Ports Hanam Canada Corporation January 2007
47
4.2 Demand-capacity analysis
The fit between capacity expansion plans and the forecast growth in container business is shown graphically in Exhibit 25. The forecast increase in business from 2006 to 2020 is 30 million TEUs per year. There is always some incremental capacity expansion at each terminal and the planned capacity is greater than the forecast growth. Even if some major expansion projects do not come on-line, there is still adequate terminal capacity in the system.
Current expansion plans of 22 million TEUs per year and a productivity gain of 5 percent per year will increase total capacity from 34 million to over 70 million TEUs per year by 2015. By then the expanded Panama Canal will come into service to further boost capacity.
The operating rate as a percentage of capacity should stay relatively constant. The expansion plans in each country closely correspond to their domestic growth with only a small increase in the trans-border volume crossing into the US from Canada and Mexico.
On-going improvements at the Vancouver and Surrey terminals combined with new terminals in North Vancouver and Richmond, BC may provide sufficient capacity but at a higher overall shipping cost than Roberts Bank Terminal 2. Similarly there is enough new capacity planned at Tacoma to avoid the need for Terminal 2, but it is more costly to bring containers bound for Canada through Tacoma.
Some shipping companies may arrange their routes to redirect business from the Vancouver terminals to Prince Rupert if it is cost competitive. For example, some companies mentioned a direct shuttle service from Shanghai to Prince Rupert. However Terminal 2 is wanted by shipping companies that would bring in the most new container business.
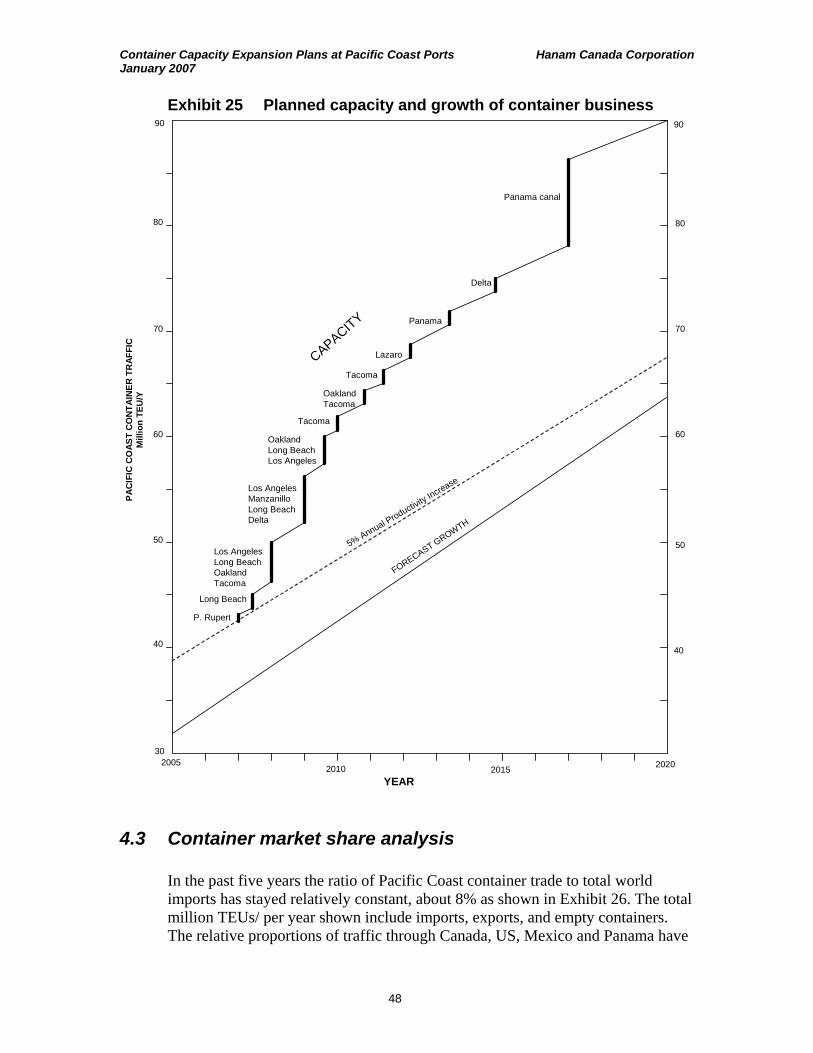
Container Capacity Expansion Plans at Pacific Coast Ports Hanam Canada Corporation January 2007
48
Exhibit 25 Planned capacity and growth of container business
30
40
50
60
70
202020102005
2015
90
80
70
60
50
40
FORECAST GROWTH
90
5% Annual Productivity Increase
80
P. Rupert
Tacoma
Tacoma
OaklandTacoma
OaklandLong BeachLos Angeles
Delta
Long Beach
Los AngelesLong BeachOaklandTacoma
Los AngelesManzanilloLong BeachDelta
Panama
Lazaro
Panama canal
YEAR
PAC
IFIC
CO
AST
CO
NTA
INER
TR
AFFI
CM
illio
n TE
U/Y
CAPACITY
4.3 Container market share analysis
In the past five years the ratio of Pacific Coast container trade to total world imports has stayed relatively constant, about 8% as shown in Exhibit 26. The total million TEUs/ per year shown include imports, exports, and empty containers. The relative proportions of traffic through Canada, US, Mexico and Panama have
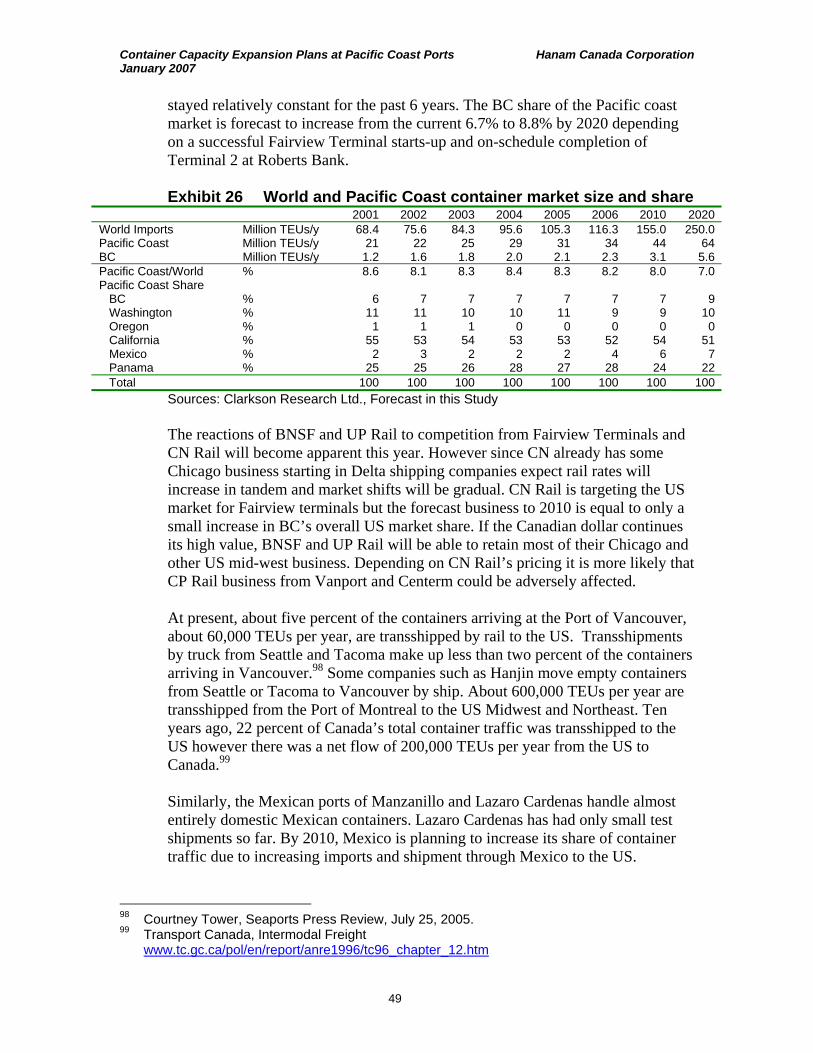
Container Capacity Expansion Plans at Pacific Coast Ports Hanam Canada Corporation January 2007
49
stayed relatively constant for the past 6 years. The BC share of the Pacific coast market is forecast to increase from the current 6.7% to 8.8% by 2020 depending on a successful Fairview Terminal starts-up and on-schedule completion of Terminal 2 at Roberts Bank.
Exhibit 26 World and Pacific Coast container market size and share
2001 2002 2003 2004 2005 2006 2010 2020 World Imports Million TEUs/y 68.4 75.6 84.3 95.6 105.3 116.3 155.0 250.0 Pacific Coast Million TEUs/y 21 22 25 29 31 34 44 64 BC Million TEUs/y 1.2 1.6 1.8 2.0 2.1 2.3 3.1 5.6 Pacific Coast/World % 8.6 8.1 8.3 8.4 8.3 8.2 8.0 7.0 Pacific Coast Share BC % 6 7 7 7 7 7 7 9 Washington % 11 11 10 10 11 9 9 10 Oregon % 1 1 1 0 0 0 0 0 California % 55 53 54 53 53 52 54 51 Mexico % 2 3 2 2 2 4 6 7 Panama % 25 25 26 28 27 28 24 22 Total 100 100 100 100 100 100 100 100
Sources: Clarkson Research Ltd., Forecast in this Study
The reactions of BNSF and UP Rail to competition from Fairview Terminals and CN Rail will become apparent this year. However since CN already has some Chicago business starting in Delta shipping companies expect rail rates will increase in tandem and market shifts will be gradual. CN Rail is targeting the US market for Fairview terminals but the forecast business to 2010 is equal to only a small increase in BC’s overall US market share. If the Canadian dollar continues its high value, BNSF and UP Rail will be able to retain most of their Chicago and other US mid-west business. Depending on CN Rail’s pricing it is more likely that CP Rail business from Vanport and Centerm could be adversely affected.
At present, about five percent of the containers arriving at the Port of Vancouver, about 60,000 TEUs per year, are transshipped by rail to the US. Transshipments by truck from Seattle and Tacoma make up less than two percent of the containers arriving in Vancouver.98 Some companies such as Hanjin move empty containers from Seattle or Tacoma to Vancouver by ship. About 600,000 TEUs per year are transshipped from the Port of Montreal to the US Midwest and Northeast. Ten years ago, 22 percent of Canada’s total container traffic was transshipped to the US however there was a net flow of 200,000 TEUs per year from the US to Canada.99
Similarly, the Mexican ports of Manzanillo and Lazaro Cardenas handle almost entirely domestic Mexican containers. Lazaro Cardenas has had only small test shipments so far. By 2010, Mexico is planning to increase its share of container traffic due to increasing imports and shipment through Mexico to the US.
98 Courtney Tower, Seaports Press Review, July 25, 2005. 99 Transport Canada, Intermodal Freight
www.tc.gc.ca/pol/en/report/anre1996/tc96_chapter_12.htm
Container Capacity Expansion Plans at Pacific Coast Ports Hanam Canada Corporation January 2007
50
The proportion of the US Chicago and central US business that Fairview and Lazaro Cardenas terminals can win depends on CN and KCS rail being competitive with BNSF and Union Pacific.
The Panama Canal is at capacity but a new rail bridge and a larger set of locks will continue to help the Panama Canal maintain a significant although lower market share. At present Panama has 38% of the containerized cargo on the northeast Asia- US East Coast route but this could drop to 29% or increase to 46% depending on when the Panama Canal is expanded to suit larger container vessels.100 The all water route has lower shipping costs but a longer transit time.101
The proportion of the world total containers destined for Pacific ports is forecast to stay at about 8% until at least 2010. By 2020 a slight decline is predicted due growth in traffic to eastern ports through the widened Panama Canal, competition from the Suez Canal and around Cape Horne routes. The proportion of container traffic at less developed countries may also increase.
Canadian researchers predict a summer ice-free Arctic between 2030 and 2070 that might be used for shipping.102 Entrepreneurs have proposed new ports and a 286 km railroad across Nicaragua at a cost of $1.4 billion. Some Nicaraguan politicians are trying to revive an old proposal for an $18 billion canal. These ideas are not well defined and seem unlikely to affect container trade flows until well beyond 2020.
4.4 Employment impacts of port expansion
Terminal operators interviewed asked to be acknowledged for their contributions to the prosperity of their communities and the nation as a whole. As shown in Exhibit 27, port related activities provide about 100,000 jobs in their communities and about 700,000 in their region. A $0.9 billion investment in Roberts Bank Terminal 2 would double BC port assets and have significant job impacts.
100 World Shipping Council, Panama Canal Expansion Position Paper, May, 2006. 101 Federal-Provincial Task Force, Transportation and Industrial Relations Issues, Oct. 26, 2005. 102 Dr. David Barber, University of Manitoba, quoted by Judith Lavoi, Times Colonist, Dec. 13,
2006.
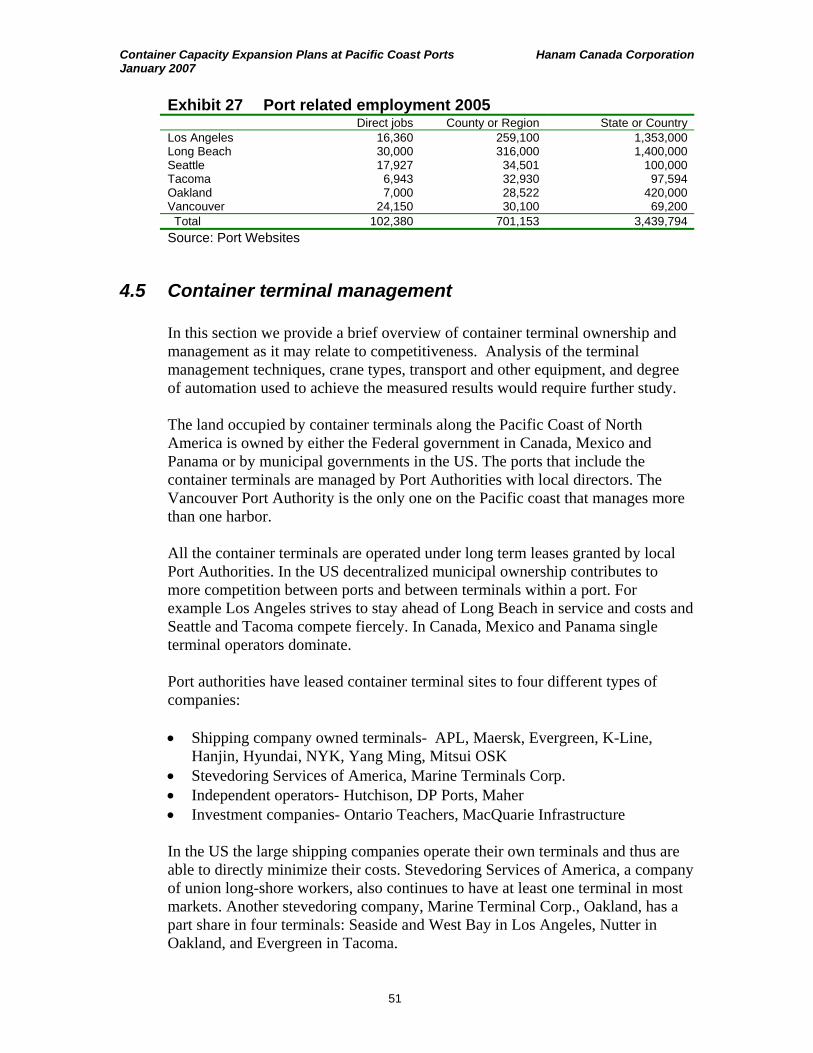
Container Capacity Expansion Plans at Pacific Coast Ports Hanam Canada Corporation January 2007
51
Exhibit 27 Port related employment 2005 Direct jobs County or Region State or Country Los Angeles 16,360 259,100 1,353,000 Long Beach 30,000 316,000 1,400,000 Seattle 17,927 34,501 100,000 Tacoma 6,943 32,930 97,594 Oakland 7,000 28,522 420,000 Vancouver 24,150 30,100 69,200 Total 102,380 701,153 3,439,794
Source: Port Websites
4.5 Container terminal management
In this section we provide a brief overview of container terminal ownership and management as it may relate to competitiveness. Analysis of the terminal management techniques, crane types, transport and other equipment, and degree of automation used to achieve the measured results would require further study.
The land occupied by container terminals along the Pacific Coast of North America is owned by either the Federal government in Canada, Mexico and Panama or by municipal governments in the US. The ports that include the container terminals are managed by Port Authorities with local directors. The Vancouver Port Authority is the only one on the Pacific coast that manages more than one harbor.
All the container terminals are operated under long term leases granted by local Port Authorities. In the US decentralized municipal ownership contributes to more competition between ports and between terminals within a port. For example Los Angeles strives to stay ahead of Long Beach in service and costs and Seattle and Tacoma compete fiercely. In Canada, Mexico and Panama single terminal operators dominate.
Port authorities have leased container terminal sites to four different types of companies:
• Shipping company owned terminals- APL, Maersk, Evergreen, K-Line,
Hanjin, Hyundai, NYK, Yang Ming, Mitsui OSK • Stevedoring Services of America, Marine Terminals Corp. • Independent operators- Hutchison, DP Ports, Maher • Investment companies- Ontario Teachers, MacQuarie Infrastructure
In the US the large shipping companies operate their own terminals and thus are able to directly minimize their costs. Stevedoring Services of America, a company of union long-shore workers, also continues to have at least one terminal in most markets. Another stevedoring company, Marine Terminal Corp., Oakland, has a part share in four terminals: Seaside and West Bay in Los Angeles, Nutter in Oakland, and Evergreen in Tacoma.

Container Capacity Expansion Plans at Pacific Coast Ports Hanam Canada Corporation January 2007
52
The market share of the various terminal operators at Pacific coast ports is shown in Exhibit 28. In the US, there is strong competition between container terminals in most ports with no dominant firms except SSAT in Seattle. Panama’s Pacific coast terminal and Mexico’s three terminals are all controlled by Hutchison Port Holdings. Similarly on Canada’s Pacific Coast 80% of the container business is handled by a single company TSI Terminal Systems Inc. Although US port terminal operations are privatized, as they are in Canada, the benefits from involving the private sector stem from the competitive pressures they introduce.
Exhibit 28 Terminal business dominance- % market share 2006
Terminal Name Leaseholder Vancouver Seattle Tacoma Oakland Long Beach
LA Manzanillo Larazaro
Ensenada SSA - 48 14 32 ITS, TransBay K-Line 17 8 38 Maersk Maersk 21 31 18 Seaside, Evergreen Evergreen, MTC 29 14 23 APL (NOL) APL 26 10 16 Delta &Vanterm TSI (OTPP) 80 OOCL OOCL 8 Total Hanjin 26 15 16 Trapac Mitsui OSK 8 14 W. Basin, Olympic YM, CS, MTC 16 12 Yusen NYK 13 Wash’ton, Cal Un Hyundai 6 Hutchison Hutchison 100 Centerm DP World 15 Washington Hyundai 17 Fraser MacQuarie 5 Port of LA - 4 Total 100 100 100 100 100 100 100
Source: Calculated from Port data
In November 2006 Orient Overseas International Ltd. (OOIL) sold four of its North American container ports, including Deltaport and Vanterm to the Ontario Teacher’s Pension Plan for US $2.4 billion subject to government approval.103 The company stated their terminal asset value was not adequately reflected in their balance sheet. OOIL is part of the Grand Alliance with NYK and Hapag-Lloyd but they are 12th in container ship capacity. The shipping companies that control the other Pacific coast container terminals are all bigger than OOIL. This sale of Deltaport and Vanterm follows the sale of Centerm, in February of 2006 to the Dubai, United Arab Emirates-based DP World. Subject to government approval, in January 2007, Fraser Surrey Docks LP was sold to MacQuarie Infrastructure Group, NY, an investment company that also owns a container terminal in Halifax, NS.
103 OOCL, November 24, 2006, Press Release. www.oocl.com
Container Capacity Expansion Plans at Pacific Coast Ports Hanam Canada Corporation January 2007
53
4.6 Container terminal competitiveness
Competition acts to reduce terminal handling charges, rail rates, and shipping time which over the long term will maximize the gains from trade for the national economy. Maintaining a competitive market for port services has the same consequence as reducing import duty or export tax and increases the competitiveness of a nation’s economy. Few competitors may give rise to opportunities for anticompetitive practices such as market allocations and price discrimination and may inflate cross country freight rates.
Our interviews revealed shipping company’s primary Canadian concerns relate to competition, environmental permitting and operating hours. These factors affect their schedule reliability and increase their costs. The areas they identified for more specific study were:
• Lack of competition between container terminals in Delta and Vancouver. • Possible delays in the construction schedule for Roberts Bank Terminal 2 due
to the slow environmental permitting process. • Container rail freight competition including the rail car allocation system and
lack of access by BNSF Rail to Deltaport. • Incentives for truckers and warehouses to operate continuously thereby
relieving terminal congestion.
Shipping prices from the port of origin to the final destination are compared in Exhibit 29. Our price estimates take into account various factors investigated by prior researchers at US104 and British105 universities. The prices shown are average values to smaller volume shippers. Some of the major importers with regular traffic such as Walmart and Home Depot have a combined discount including ship and rail of about $300 per forty foot container on these rates.
Delivered prices in California, BC and Washington are very similar. The delivered price at each terminal ranges from $2,045 per forty foot container in Delta and Los Angeles to $2,320 delivered to Lazaro Cardenas, Mexico. The local delivered price is about $100 per forty foot container less in Los Angeles and Delta, than it is in Seattle, Tacoma, or Vancouver. Routes to Chicago through Delta and Prince Rupert are lowest in price but the prices through Los Angeles, Long Beach, Seattle, Tacoma, and Vancouver are all quite similar. The US routes to Toronto are not competitive.
104 Robert Leachman, Dept. of Industrial Engineering and Operations Research, University of
California at Berkeley, Port and Modal Elasticity Study, 2005. 105 Alfred Baird, TRI Maritime Research Group, Napier University, Edinburgh, UK Planning
cityport container terminals: challenges and trends, 2001.

Container Capacity Expansion Plans at Pacific Coast Ports Hanam Canada Corporation January 2007
54
Exhibit 29 Shipping prices per forty foot imported container December 2006, US$ per 40 foot long container ($/FEU)
MX CA WA Delta Van Rupert Throughput Million TEU/y 0.8 17.8 3.3 1.2 1.0 0 Ship size basis 1000 TEU 5.5 9.4 4.4 6.0 3.5 6.0 Ocean Freight $/FEU 1,986 1,593 1,663 1,599 1,746 1,455 Port Costs $/FEU 113 358 345 246 289 194 Local trucking $/FEU 189 163 200 200 150 0 Local total 2,288 2,144 2,209 2,045 2,185 1,649 Rail, storage, & trucking $/FEU 2,110 1,945 1,907 1,770 1,935 2,181 Chicago total $/FEU 4,209 3,895 3,916 3,615 3,970 3,831 Cost above base $/FEU 594 280 301 Base 355 216 Toronto total $/FEU 4,639 4,230 4,346 3,575 3,930 3,791 Cost above base $/FEU 1,064 655 771 Base 355 216
Source: Shipping and rail quotes, Port tariff schedules
In general, export freight rates are about half the import rates and vary by the export destination. A forty foot container of lumber costs about $600 going from Vancouver to Shanghai, $900 to Qingdao, and $1,100 to Hong Kong. A forty foot container with 26 tonnes of grain going to China costs about $1,200. The grain shipping rate compares with the bulk shipment rate equivalent to $900 per forty foot container. As imported container shipments increase, return container shipping of grains and lumber becomes more competitive.
The highest cost component affecting the competitiveness of Ports is the ocean shipping rate and this rate varies significantly with economic conditions. For example APL’s average revenue per forty foot container varied from $2,200 to $2,950 over the past three years with an average of about $2,600. The trend to larger ships is significantly reducing ocean shipping costs. For example, a 6,000-TEU vessel at Deltaport saves $150 per forty foot container over a 3,500-TEU vessel at Vanterm. Although this 4% saving on the overall shipping cost from Shanghai to Toronto may seem small it is more than half the Vancouver port costs. Using a bigger ship and the new Fairview container terminal is expected to reduce costs of shipments to Toronto equivalent to the total port costs at Centerm or Vanterm in Vancouver.
The second most important factor in port competitiveness is the rail freight rate of the five transcontinental railways: CN, CP, BNSF, Union Pacific and KCS. Tacoma and Delta have government owned short-line railways that connect to the major railways. In 2004, BNSF agreed to move a train of containers from Delta to Chicago offering lower rates than CP and CN but could not gain access to Deltaport. BNSF then moved ten trains of rail cargo from Fraser Surrey docks before competition from The Port of Vancouver, TSI, CP and CN regained this business.
In 2006, a BNSF Railway rate increase from the port of Tacoma was enough to cause Evergreen Shipping to transfer significant volume to California where the Union Pacific railroad handles their cargo. Railways may reduce their import rates if there are return cargos. For example at Prince Rupert, if Shanghai
Container Capacity Expansion Plans at Pacific Coast Ports Hanam Canada Corporation January 2007
55
customers order specialty farm crops, the shipping and rail rates for imported containers could be reduced. The favorable Canadian exchange rate has kept US railways from being competitive in Canada. However, shipping companies forecast that US rail rates will increase 25% in the next three years and this may allow CN Rail to gain US business. CP Rail freight rates can increase significantly due to a $200 per forty foot container per day penalty imposed if shipping companies bring in more containers than their allocation.
Port costs include pilots, tugs, wharfage, demurrage, customs clearance, security surcharge, storage, services such as cleaning, terminal costs, gate charge, off-peak loading bonus, terminal lease, insurance, capital recovery, interest, property tax, income tax, and intermodal yard costs. Competition in as many of these areas as possible will minimize cumulative costs and help the port enlarge its market share. For example, Fraser Port, does not charge container ships wharfage at Fraser Surrey Docks.
Trucking rates are another important factor in cost competitiveness. It is reported that Vancouver’s newly created system of licensing truckers has eliminated trucking rate competition. During the trucking strike in Vancouver Walmart and Cosco brought containers from Seattle to Vancouver at an extra cost of $350 per forty foot container plus the cost of time delays. Thus Seattle is not a practical competitive option for most Vancouver importers.
Duty is another cost consideration affecting port competitiveness. Los Angeles’ Free Trade Zone includes 1,100 hectares at the port and sites throughout the area linked to the port. The benefits include:
• Duty deferral- Users pay duty only when merchandise is shipped • Duty Reduction- Importers pay duty only on imported components • Duty Elimination- Users pay no duty on exports • Increased flexibility- customs clearance is expedited • US Quota- Users may store merchandise until quota is opened
Canada’s recently enacted legislation that allows companies whose goods are primarily intended for export to set up a similar Export Distribution Center or Free Trade Zone.106 This legislation would be useful to a company located near Deltaport that might import parts and export finished products to the US. However, imports are mainly finished goods.
106 I to I logistics Inc., www.itoilogistics.com/chinaBridge.html
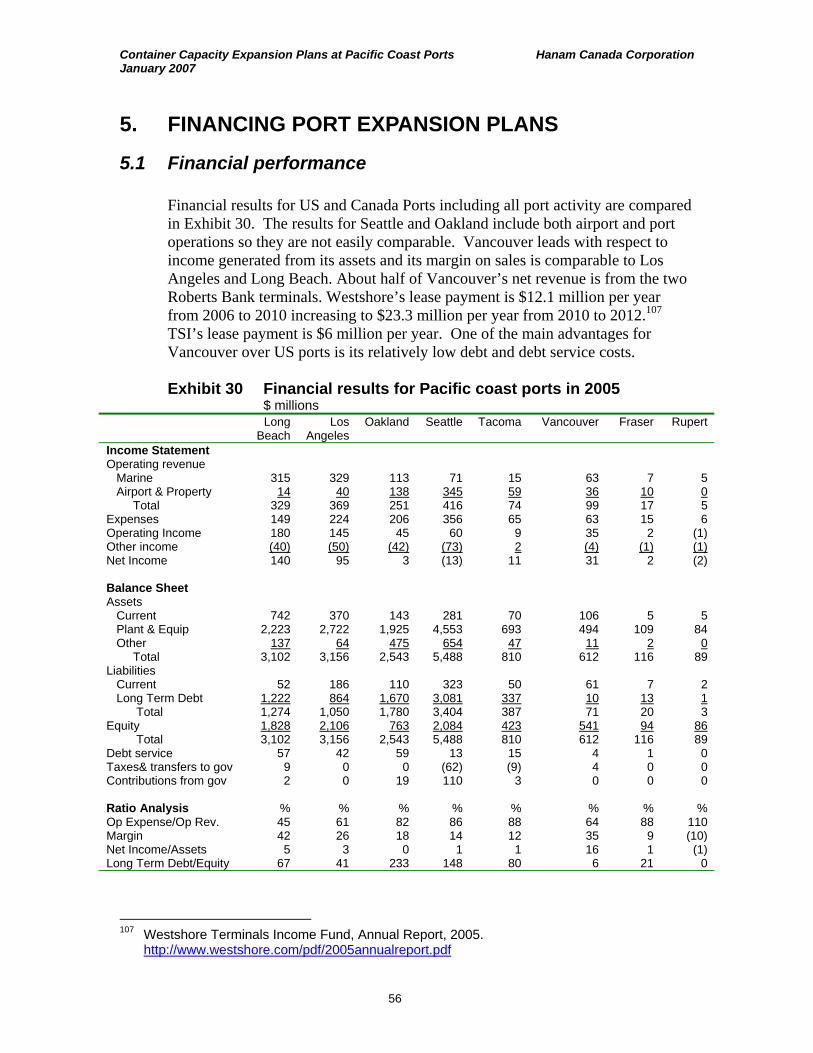
Container Capacity Expansion Plans at Pacific Coast Ports Hanam Canada Corporation January 2007
56
5. FINANCING PORT EXPANSION PLANS
5.1 Financial performance
Financial results for US and Canada Ports including all port activity are compared in Exhibit 30. The results for Seattle and Oakland include both airport and port operations so they are not easily comparable. Vancouver leads with respect to income generated from its assets and its margin on sales is comparable to Los Angeles and Long Beach. About half of Vancouver’s net revenue is from the two Roberts Bank terminals. Westshore’s lease payment is $12.1 million per year from 2006 to 2010 increasing to $23.3 million per year from 2010 to 2012.107 TSI’s lease payment is $6 million per year. One of the main advantages for Vancouver over US ports is its relatively low debt and debt service costs.
Exhibit 30 Financial results for Pacific coast ports in 2005
$ millions Long
Beach Los
Angeles Oakland Seattle Tacoma Vancouver Fraser Rupert
Income Statement Operating revenue Marine 315 329 113 71 15 63 7 5 Airport & Property 14 40 138 345 59 36 10 0 Total 329 369 251 416 74 99 17 5 Expenses 149 224 206 356 65 63 15 6 Operating Income 180 145 45 60 9 35 2 (1) Other income (40) (50) (42) (73) 2 (4) (1) (1) Net Income 140 95 3 (13) 11 31 2 (2) Balance Sheet Assets Current 742 370 143 281 70 106 5 5 Plant & Equip 2,223 2,722 1,925 4,553 693 494 109 84 Other 137 64 475 654 47 11 2 0 Total 3,102 3,156 2,543 5,488 810 612 116 89 Liabilities Current 52 186 110 323 50 61 7 2 Long Term Debt 1,222 864 1,670 3,081 337 10 13 1 Total 1,274 1,050 1,780 3,404 387 71 20 3 Equity 1,828 2,106 763 2,084 423 541 94 86 Total 3,102 3,156 2,543 5,488 810 612 116 89 Debt service 57 42 59 13 15 4 1 0 Taxes& transfers to gov 9 0 0 (62) (9) 4 0 0 Contributions from gov 2 0 19 110 3 0 0 0 Ratio Analysis % % % % % % % % Op Expense/Op Rev. 45 61 82 86 88 64 88 110 Margin 42 26 18 14 12 35 9 (10) Net Income/Assets 5 3 0 1 1 16 1 (1) Long Term Debt/Equity 67 41 233 148 80 6 21 0
107 Westshore Terminals Income Fund, Annual Report, 2005.
http://www.westshore.com/pdf/2005annualreport.pdf
Container Capacity Expansion Plans at Pacific Coast Ports Hanam Canada Corporation January 2007
57
About 80% of the Port of Seattle’s revenues come from the 3 container terminals and the lease rate on each of the three container terminals is scheduled to increase in 2008. The Port received $62 million from property taxes in 2005. This tax was originally set up to compensate UP and BNSF rail for waterfront property and studies have been conducted to eliminate this subsidy.108 In 2005, the Port of Tacoma also received a $9 million property tax subsidy and the Port of Portland received $7 million.
The two terminals at Roberts Bank paid $10 million in property taxes to the Corporation of Delta in 2005. Westshore Terminals paid $6 million and TSI, $4 million. The Vancouver Port Authority paid $3.3 million in lieu of taxes and a $4.0 million dividend (stipend) to the Federal government in 2005.109 This is equivalent to a 1.1% return on the total assets. The port seeks to eliminate these payments because their US competitors do not have to make them. However, in the US, terminal lease payments are made to the municipal owners. Therefore the total of lease payments, municipal taxes, and dividends would need to be included in a more comprehensive comparison of competitiveness.
5.2 Sources of port investments
The Vancouver Port Authority states that about $500 million is needed in federal infrastructure grants over the next two decades.110 Their current interest rate for new long term debt is 6.5% per year. Without federal grants the port authority considers their borrowing limit of $510 million too low to develop the proposed Terminal 2 container terminal.111 The sources of financing for recent port and related infrastructure expansions are summarized in Exhibit 31. In the US about half the investment is provided by local port authorities. Most of the US federal government investment has been for the improvements to the rail corridor through Los Angeles. The US federal government also makes significant investments in dredging especially at Oakland.
The largest private sector investor in Pacific Coast ports is Hutchison Port Holdings, Hong Kong. Hutchison has the rights to operate all three Mexican Pacific coast ports and the Port of Balboa in Panama. They have invested more than $0.5 billion to improve these ports. Kansas City Rail invested $70 million to improve tracks and port connections in Panama and will pay 5% of earnings to the government until the investment is recovered and 10 percent after that.
108 Martin McComber, The Seattle Times, Nov. 22, 2004.
http://seattletimes.nwsource.com/html/businesstechnology/2002097568_porttax22.html 109 Vancouver Port Authority, Annual Report, 2005. 110 Industry Advisory Group, Intervistas Consulting & Colledge Transportation Consulting Inc.,
Pacific Gateway Strategy Action Plan, April, 2006. 111 Vancouver Port Authority, Submission to the Canada Marine Act Review Panel, Sept. 2002.
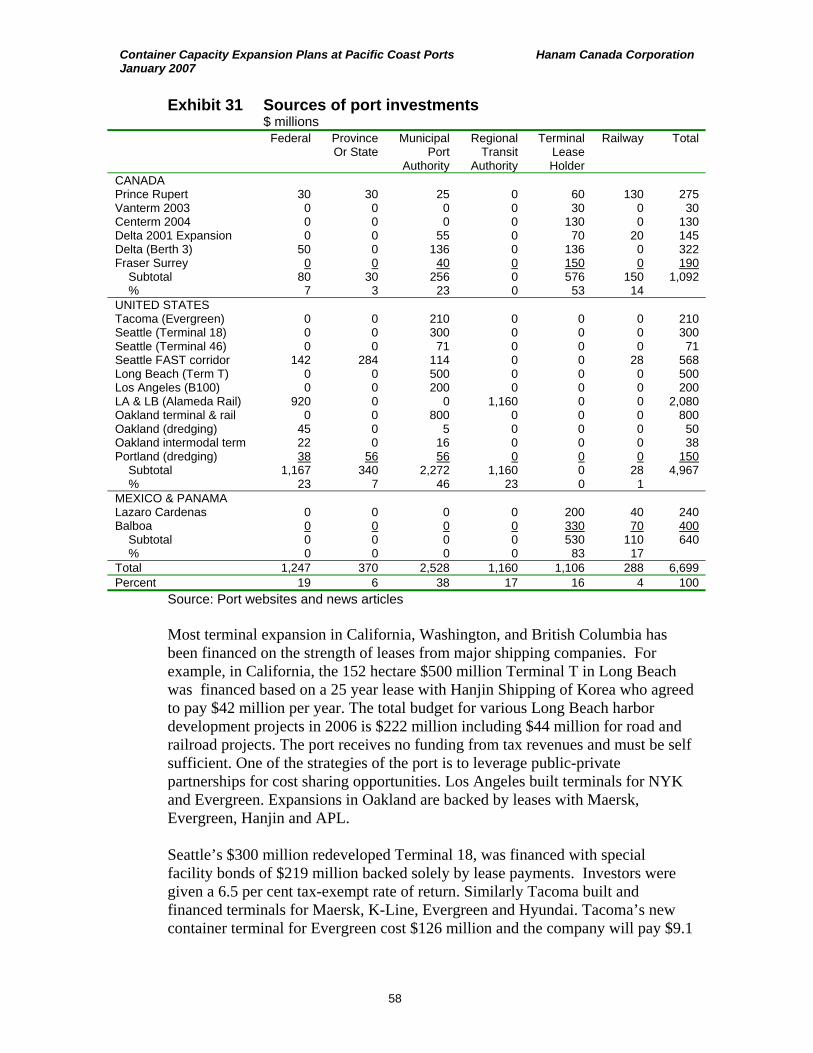
Container Capacity Expansion Plans at Pacific Coast Ports Hanam Canada Corporation January 2007
58
Exhibit 31 Sources of port investments $ millions
Federal Province Or State
Municipal Port
Authority
Regional Transit
Authority
Terminal Lease Holder
Railway Total
CANADA Prince Rupert 30 30 25 0 60 130 275Vanterm 2003 0 0 0 0 30 0 30Centerm 2004 0 0 0 0 130 0 130Delta 2001 Expansion 0 0 55 0 70 20 145Delta (Berth 3) 50 0 136 0 136 0 322Fraser Surrey 0 0 40 0 150 0 190 Subtotal 80 30 256 0 576 150 1,092 % 7 3 23 0 53 14 UNITED STATES Tacoma (Evergreen) 0 0 210 0 0 0 210Seattle (Terminal 18) 0 0 300 0 0 0 300Seattle (Terminal 46) 0 0 71 0 0 0 71Seattle FAST corridor 142 284 114 0 0 28 568Long Beach (Term T) 0 0 500 0 0 0 500Los Angeles (B100) 0 0 200 0 0 0 200LA & LB (Alameda Rail) 920 0 0 1,160 0 0 2,080Oakland terminal & rail 0 0 800 0 0 0 800Oakland (dredging) 45 0 5 0 0 0 50Oakland intermodal term 22 0 16 0 0 0 38Portland (dredging) 38 56 56 0 0 0 150 Subtotal 1,167 340 2,272 1,160 0 28 4,967 % 23 7 46 23 0 1 MEXICO & PANAMA Lazaro Cardenas 0 0 0 0 200 40 240Balboa 0 0 0 0 330 70 400 Subtotal 0 0 0 0 530 110 640 % 0 0 0 0 83 17 Total 1,247 370 2,528 1,160 1,106 288 6,699Percent 19 6 38 17 16 4 100 Source: Port websites and news articles
Most terminal expansion in California, Washington, and British Columbia has been financed on the strength of leases from major shipping companies. For example, in California, the 152 hectare $500 million Terminal T in Long Beach was financed based on a 25 year lease with Hanjin Shipping of Korea who agreed to pay $42 million per year. The total budget for various Long Beach harbor development projects in 2006 is $222 million including $44 million for road and railroad projects. The port receives no funding from tax revenues and must be self sufficient. One of the strategies of the port is to leverage public-private partnerships for cost sharing opportunities. Los Angeles built terminals for NYK and Evergreen. Expansions in Oakland are backed by leases with Maersk, Evergreen, Hanjin and APL.
Seattle’s $300 million redeveloped Terminal 18, was financed with special facility bonds of $219 million backed solely by lease payments. Investors were given a 6.5 per cent tax-exempt rate of return. Similarly Tacoma built and financed terminals for Maersk, K-Line, Evergreen and Hyundai. Tacoma’s new container terminal for Evergreen cost $126 million and the company will pay $9.1

Container Capacity Expansion Plans at Pacific Coast Ports Hanam Canada Corporation January 2007
59
million in the first year plus escalation over the 20 year lease period. Evergreen invested $55 million for the cranes and straddle carriers for the terminal.
Similarly in Canada, terminal leaseholder including Fraser Surrey Docks, Surrey, OOCL, Hong Kong, and DP Ports Canada have provided more than half the container terminal investments. In Canada, port authorities provided about one quarter of the investment. CN Rail invested $30 million at Fairview Terminals and $100 million in Memphis, TN, to establish a related intermodal terminal. Financing for Fairview Terminals was led by Maher Terminals of New Jersey, and CN Rail. Canada and BC each contributed 17% and the Port contributed 14% in bank-secured financing. The Federal contribution came from Western Economic Diversification Canada.
The US federal government subsidizes its port developments through the federally-tax exempt bonds backed by leases mainly from shipping companies.112 The interest paid on municipal bonds for public purposes can be free of federal, state and municipal tax. Typically the security of the revenue bonds is the port revenue streams not the assets of the port tenants or terminal operators. The revenue bond supported facility may pay a leasehold tax that is lower than property tax.
Tax free revenue bonds do not apply in Canada but container terminals can be similarly project financed, where payments required to service the debt incurred are based solely on the cash flow expected to be generated by the asset.113 Container terminals in Hong Kong and South Korea have been project financed. A project financing structure usually includes some loss of control by the Port Authority.
Both the US and Canada federal governments contribute to marine security enhancement. On October 2006 the US SAFE Port Act authorized the expenditure of $3.4 billion over five years for safety measures, including radiation detection equipment for the 22 largest U.S. ports by 2007.114 In 2004, Canada announced a five-year $155 million Marine Security Contribution Program that pays 75 percent of the cost of projects to comply with regulations under the Canada Marine Transportation Security Act. Eligible projects include surveillance equipment, dockside and perimeter fencing, gates, signage and lighting, communications equipment, training and security design studies.
112 Principal Global Investors, Any Port in a Storm: US Ports Prepare for Growth, Real Estate
Insights, Sept. 2004. 113 David Egan, PricewaterhouseCoopers LLP, Canadian Port Financing: Issues and
Challenges”, June 14, 2006 www.aapa_ports.org/files/SeminarPresenations/06_Commissioners_Brush.pdf
114 http://www.navarik.com/home/blog/?p=390. The SAFE Ports Act, effectively extends the previous federal funding through the US Marine Transportation Anti-Terrorism Act of 2002, which provided US$225 million in grants over three years to enhance port security.
Container Capacity Expansion Plans at Pacific Coast Ports Hanam Canada Corporation January 2007
60
An important port investment vehicle in the US is the Alameda Transit Authority in the Los Angeles area. The $2.4 billion railway corridor to the ports of Los Angeles and Long Beach eliminated 200 level crossings within 32 kilometers of the ports. About 50 trains per day pass along this corridor, half UP and half BNSF Railway. By comparison, 20 trains per day presently pass through the Roberts Bank-Matsqui corridor in the Fraser Valley. A $400 million subordinated loan at 6.79% interest was approved by the US Congress as part of U.S. DOT's 1997 appropriations. 115 The loan allowed the Alameda Corridor Transportation Authority to sell $1.16 billion in project revenue bonds. Grant funds from a federal highway aid program contributed another $347 million to the project.
The Transit Authority collects fees on each container that moves between the ports and the rail yards, and has pledged this revenue as the principal source of repayment for the project bonds and the Federal loan. By taking the position of a subordinate lender and by deferring debt service repayments in the early years of project operation, the Federal loan made possible market access for the project's senior bonds at reasonable interest rate costs. In 2004 the Transit Authority paid $573 million to retire the loan plus accrued interest with proceeds from a sale of revenue bonds based on two years of operational performance and a ruling confirming the tax-exempt eligibility of a portion of the bonds.
The fees paid by railway users are $30 per 40-foot container ($15/TEU), $8 per empty container ($4/TEU), and $8 for other types of railcars.116 BC Rail generates $6.8 million gross and $2.0 million per year net revenue. If a similar fee were charged for 3.2 million full and 0.5 million TEUs per year empty containers, the revenue would be $50 million per year. Twelve 100 car coal trains per day would generate an additional $3 million/y. The Los Angeles fee is small enough that it does not shift container movements to other ports.
Similarly, financing the $5.4 billion proposed 3rd lock for the Panama Canada is based on a 3.5% increase per year of tolls. With this toll increase, the maximum external financing required would be $2.3 billion. Calculations are based on a 6.25% interest rate with a 1.25% charge on the unused portion of available financing.117
In Washington, the FAST partnership of the federal, state, county governments, 12 cities, the ports of Everett, Seattle, and Tacoma, the BNSF and Union Pacific Railway have raised $568 million since 1998 to build nine projects most of them eliminating rail level crossings between Tacoma and Everett. The group plans to complete 16 more projects including 10 grade separations at an additional cost of $300 million.
115 Mark Sullivan, US Department of highway Administration, Innovative Finance Quarterly,
Spring, 2004. http://www.fhwa.dot.gov/innovativefinance/ifq101.htm 116 Parsons, Indiana Rail Plan, 2002. 117 Panama Canal Authority, Proposal for Expansion of the Panama Canal, April, 2006.

Container Capacity Expansion Plans at Pacific Coast Ports Hanam Canada Corporation January 2007
61
6. CONCLUSIONS
This report provides an overview of expansion plans and issues facing major container ports along the Pacific Coast of North America to assist Transport Canada in monitoring and developing policies for container terminals and related infrastructure. Many of the plans and issues discussed raise questions for further study. Our conclusions are:
1. Planning is underway for a 53% increase in capacity. The 12 ports and 14
operators of 37 container terminals in the study area plan 55 expansion projects to handle 22 million twenty foot equivalent units per year with an investment of $6.8 billion. Canada plans for expansions at Roberts Bank and the Roberts Bank Rail Corridor are similar in scale as the expansion plans at competitive ports. Canada is a small open economy that depends on efficient trade flows. Given the financial independence of port authorities from the federal government, the investment risk is in the hands of the port authorities. Some overcapacity in the system would benefit the base load container throughput and would still be good for the Canadian economy. Traffic flow improvements and an environmental legacy at Roberts Bank would result in long-term benefits even if the new terminal were not initially fully utilized.
2. Increased trade and larger ships create attractive expansion opportunities at
Delta and inland. Increased Asia-Pacific imports will ensure that the proposed expansion at Roberts Bank will be fully utilized. There are many opportunities for increasing containerized exports of agricultural and forest products. The most successful container terminals such as Deltaport are becoming larger and more productive whereas smaller terminals face increasing competitive challenges.
3. Containerized imports and exports for Canadian Pacific ports are forecast to
grow conservatively to 5.6 million TEUs per year by 2020. The main imports are furniture, bedding, machine parts, toys, games and sports equipment. The main exports are pulp, paper, waste paper, lumber, other wood products and agricultural crops. In 2006 about 1.1 million TEUs were imported, 0.9 million exported and 0.3 million were empty containers.
4. Terminals in Delta, Los Angeles and Long Beach are the current container
market leaders. These terminals have the highest productivity per terminal, berth and crane. They have the most efficient and competitive rail and truck access. Los Angeles and Long Beach have congestion mitigation policies including reduced gate fees and bonuses to encourage container transport and receiving during off-peak hours. The large container terminals in these ports have about 5% lower local delivered costs - about $2,100 per 40-foot container. Container export costs are competitive with traditional bulk shipments due to low back-rates. Research is needed to identify bottlenecks at intermodal transfer points, warehouses, and container storage yards.
Container Capacity Expansion Plans at Pacific Coast Ports Hanam Canada Corporation January 2007
62
Research is needed to determine how competition between terminals and railways in the Port of Vancouver can be increased to improve service and reduce costs.
5. Large new terminals can be financed. High lease rates are achievable from
major shipping companies. In the US, rail overpasses have been financed with federal loan guarantees and user fees of $30 per 40-foot container. Provided it is linked to faster approval of the Roberts Bank Terminal 2 project, shipping companies and railways may support such a fee because it would lead to overall lower transport costs.
6. The US federal government helps gain acceptance of large new competitive
terminals at California ports by creating environmental legacies such as new wetlands, parks, and public waterfront access.


