Embed Size (px)
Citation preview

Electronic copy available at: http://ssrn.com/abstract=1735506
Compensation Consultant Independence and CEO Pay
Wei Cen Cornell University
Naqiong Tong1 University of Baltimore
[email protected] Jan 2011 Preliminary Version
1Contact Author: Naqiong Tong, Merrick School of Business, University of Baltimore, 1420 N. Charles St, BC 450, Baltimore, MD 21201, Phone: 410-837-5114, Email: [email protected]

Electronic copy available at: http://ssrn.com/abstract=1735506
2
Abstract:
Critics allege that executive compensation consultants face potential conflicts of interest (lack of independence) that might lead to higher CEO pay. Conflicts of interest include the desires to “cross-sell” service and to secure “repeat business”. Using a unique dataset of compensation consultant service fee in U.S. S& P 500 firms in 2009, we find strong evidence that compensation consultant’s conflicts of interest is associated with higher CEO pay. We find that CEO bonus and total compensation are higher in companies where the consultant charges higher compensation-related service fees (“repeat business”). We also find that CEO salary, bonus and total compensation are higher in firms where the consultants provide other service and that pay is higher when the fees paid to consultants for other services are larger (“cross-sell” service). In particular, evidence shows that that CEO receives 7% more salary, 22.9% more bonus and 15.6% more total compensation in firms where compensation consultants provide other services than that of firms where the consultants do not provide other service. In addition, we also document that CEO’s pay-for-performance-sensitivity (PPS) is lower in firms where the consultants have potential conflicts of interest. In particular, CEO’s PPS over cumulative equity pay (annual equity pay) is 30.12% (256.41%) lower in firms that retain compensation consultant to engage other services than those retain consultants without other services. Keywords:
Executive Compensation, Compensation Consultant, Conflicts of Interest, CEO Pay, board of directors, corporate governance, disclosure

Electronic copy available at: http://ssrn.com/abstract=1735506
3
1. Introduction
Most large companies rely on executive compensation consultants in designing CEO pay,
including making recommendations based on survey, competitive-benchmarking information of
industry practice and designing and implementing incentive plans to align CEO pay with a firm’ s
long/short term strategies.2 Understanding the influence of consultants has become an important
question as the use of compensation consultants by boards of directors has risen (Higgins, 2007).
While consultants can use their expertise to assist the compensation committee in designing
compensation packages to maximize shareholder value, critics accuse them of aiding executives at
the shareholders’ expense and focus on their conflicts of interest (Bebchuk and Fried, 2006;
Morgenson, 2006; Higgins, 2007 and Waxman 2007). This study examines whether potential
conflicts of interest of compensation consultants influence CEO pay for a sample of S & P 500
firms, using the new disclosure data of consulting fees required by Security and Exchange
Committee (SEC) in August 2009. Compensation consultants are often subject to conflicts,
including “repeat business” and “non-compensation-related service” interest (Murphy and Sandino,
2010). 3 If consultants do respond to conflicting incentives, they might compromise their
independence and recommend overly generous compensation for client CEOs. We thus examine
the effect of conflicts of interest of consultants on the level of pay and pay-for-performance
sensitivity (PPS).
Although compensation committee almost always has the sole authority to hire a compensation
consultant, CEOs make recommendations of the consultant selection. In addition, the hiring 2 Beyond routine CEO pay, compensation consultants also provide guidance on change-in-control and employment agreements, and other complex accounting, tax, or regulatory issues related to executive pay. As consultants, they might also provide other consulting service to their client firms, including actuarial services, employee pay services benefits-administration services, and non-pay consulting, employee training, outsourcing HR functions, tax services, and investment services for pension funds. 3 “Repeat business” interest refers to the consultants’ concern with being reappointed, while “non-compensation-related service” interest refers to the provision of non-compensation-related services is under the decisions of the same top executives whose pay packages are designed by compensation consultants.

4
decisions for non-compensation-related services are ultimately under the CEO’s control, thus the
consultant have the potential conflicts of interest as the desires to secure “repeat business” and to
“cross-sell” service. For example, both Higgins (2007) and Waxman (2007) concluded that
companies using consultants offer significantly higher pay than companies not using consultants.
They also concluded that CEO pay is higher in firms when the consultants are simultaneously
receiving millions of dollars from the corporate executives whose companies they are supposed to
assess. Interestingly, empirical studies find little evidence that support above alleged critics. In
particular, academic studies failed to document consistent evidence about whether the usage of
compensation consultant is associated with a firm’s optimal contracting (Armstrong, Ittner and
Larcker (2010), Conyon, Peck, and Sadler (2009) Voulgaris, Stathopoulos and Walker (2010) and
Kabir and Minhat (2010)) or whether “cross-sell” service of compensation consultant leads to
CEO “excess pay” (Murphy and Sandino (2010), Cadman, Carter and Hillegeist (2010),
Armstrong, Ittner and Larcker (2010)) and Goh and Gupta (2010)). Data unavailability in US
might have limited researchers to investigate this important issue since the actual consultant fee
data is not available until December 2009. Although the Security and Exchange Commission (SEC)
required firms in 2006 to disclose whether firms engage any consultants and whether the
consultants are engaged directly by the compensation committee rather than by management in
2006, the 2009 regulation requires firms to disclose fees paid to consultants for any additional
services provided to the company by the consultants and their affiliates if the fees in
non-compensation-related services are more than $120,000.
To examine the effect of potential conflicts of interest as “repeat service” and “cross-sell”
service, we take advantage of new SEC rules requiring companies to disclose the use of

5
compensation consultants in proxy statements in 2009. We hand collect compensation consultants
and related service fees data on SP 500 firms for 2009 fiscal-year. To test the “repeat business”
effect (i.e., the consultants’ concern with being reappointed and its impact on the
compensation-related fees), we use the compensation-related fees as a measure of “repeat
business” and examine the association between the compensation-related service fee and CEO pay
(level of salary, bonus, equity and total compensation and pay-performance sensitivity (PPS)). To
test the “cross-sell” service argument, we examine whether CEO pay is higher when the consultant
provides services beyond executive compensation advice. We use three proxies to measure the
“cross-sell” service. First, client firms who affirmatively disclose that their compensation
consultant provides non-compensation-related services; second, we use the other-service-related
fees; third, we use the fee ratio of non-compensation-related service fee and compensation-related
service fee.
Using the actual service fee data, we find strong evidence that compensation consultant’s
conflicts of interest (both “repeat business” and “cross-sell” service) is associated with higher CEO
pay. In particular, we find that CEO bonus and total compensation are higher in companies with
higher compensation-related service fees (“repeat business”). We also find that CEO salary, bonus
and total compensation are higher in firms where the consultants provide non-compensation-related
service and when the fees paid to consultants for non-compensation-related services are larger
(“cross-sell” service). In particular, evidence shows that that CEO receives 7% more salary, 22.9%
more bonus and 15.6% more total compensation in firms where compensation consultants provide
non-compensation-related services than that of firms where the consultants do not provide
non-compensation-related service. In addition, we also document that CEO’s

6
pay-performance-sensitivity (PPS) is lower in firms where the consultants have potential conflicts
of interest. CEO’s PPS of total equity value change (annual equity pay) is 30.12% (256.41%) lower
in firms that retain compensation consultant to engage non-compensation-related services than
those retain consultants without non-compensation-related services.
Our research contributes to the literature related to executive compensation in general, and
more specifically to the emerging literature on the role of compensation consultants. By taking
advantage of the new disclosure rule in 2009, this paper is the first study that uses the actual
disclosure data, which provides more accurate information on the role of compensation consultants
and their impact on executive pay. This is a unique contribution since most previous studies such
as Murphy and Sandino (2010) and Cadman et. al. (2010) were not able to obtain the actual
compensation-related service fees and non-compensation-related service fees and use other proxies
to measure compensation consultant’s conflicts. 4 In particular, using actual compensation
consultant data, this study finds that compensation consultants’ potential conflicts of interest also
are associated with CEO pay-performance sensitivity, which contrasts to Cadman et. al (2010)’s
failure to document any evidence.
We begin in Section 2 with a discussion of US institutional environment and related literature,
followed by hypothesis development and model specification in Section 3. Section 4 reports a
4 Since the US firms were not required to disclose actual compensation consultant fees before 2010, Cadman (2010) and Murphy et al (2010) both use proxies, which might create measure error. In particular, Cadman (2010) uses three proxies that they can identify in firms’ 2006 disclosures (1) client firms who affirmatively disclose that their compensation consultant provides non-EC services; (2) firms that are not clients of Frederic W. Cook or Pearl Meyer, large consultants that focus exclusively on executive compensation services and thus do not have cross-selling incentives; and (3) firms that hire their auditor for significant non-audit services, indicating a willingness to allow possible conflicts of interest among their professional service providers. Murphy and Sandino (2010) use the compensation consultant’s actuaries fees as identified from IRS and Department of Labor filings. The actual compensation consultant fee data is available for Canadian firms, so Murphy et al. were able to obtain 124 Canadian companies that retained compensation consultants.
7
summary of data and a description of the compensation consulting industry. Section 5 presents our
primary findings on examining the influence of conflicts of interest on CEO pay. Section 6
concludes the study.
2. US Institutional Changes in 2009 and Related Literature Review
Historically, US firms were not required to disclose their utilization of compensation
consultants and the names of the consultant. A recent Congress report (Waxman, 2007) suggests
that cross-selling conflicts may influence pay. Using proprietary data obtained from six
compensation consultants, this report examines pay in Fortune 250 companies between 2002 and
2006 and finds that firms with the highest conflicts of interest with their consultants, as measured
by the ratio of fees for non-compensation-related services to fees for executive pay advice, had
higher median compensation than other firms.
Concerns over the role of compensation consultants led the US Securities and Exchange
Commission (SEC) in 2006 to require companies to identify and describe the role of all
consultants who provided advice on executive compensation, and to disclose whether the
consultants are engaged directly by the compensation committee rather than by management. This
new regulation stirs the research interest and two streams emerged. The first research stream
(Armstrong, Ittner and Larcker (2010), Conyon, Peck, and Sadler (2009) Voulgaris, Stathopoulos
and Walker (2010) and Kabir and Minhat (2010)) focuses on whether the use of compensation
consultants helps a firm achieve optimal contracting. In particular, Armstrong et al (2010) find that
the association between CEO pay and compensation consultant is conditional on the corporate
governance. Higher CEO pay is present in firms with weaker governance and they are likely to use
compensation consultants. In UK, Conyon et al (2009) finds that the level of CEO pay (and equity

8
incentives) is generally greater in firms that use compensation consultants.5 Voulgaris et al (2010)
examine the impact of hiring a compensation consultant using managerial power approach (MPA)
to corporate governance and find that positive effect of consultants on CEO pay levels mainly
stems from an increase in equity-based compensation. In addition, Kabir and Minhat (2010)
examine the impact of multiple compensation consultants on CEO pay and find that CEOs receive
higher equity-based pay when firms with multiple compensation consultant and the market shares
of compensation consultant are positively related to CEO compensation.
The second research stream focuses on whether the use of same compensation consultant on
non-compensation-related service besides compensation service generates a “conflict of interest”,
which might lead to CEO “excess pay” (Murphy and Sandino (2010), Cadman, Carter and
Hillegeist (2010), Armstrong, Ittner and Larcker (2010)) and Goh and Gupta (2010)). Although
SEC regulation has required firms to disclose whether they use compensation consultant and their
roles, it did not require the firms to disclose the service fees paid to compensation consultants.
Therefore, most of the previous studies use different approaches to proxy the “conflict of interest”.
In particular, Murphy et al (2010) utilize Canadian firms and Cadman et al (2010) use four proxies
in US firms, including a dummy variable (takes one if the firm voluntary disclosure the usage of
compensation consultant on non-compensation-related services. zero otherwise), the use of auditor
on other consulting services, the importance of the individual client to the consulting firms (total
assets of one client/total assets combined by other clients. Due to lack of data, Cadman et al (2010)
and Armstrong et al (2010) fail to find widespread evidence of association between higher levels
5 Their explanation of the excess pay is based on the following arguments: Survey by compensation consultants usually report information about salient parts of the pay distribution, such as the 25th, 50th, and 75th percentiles. Compensation at or below the median is often treated as “below market,” where as pay in the 50th to 75th percentile is deemed “competitive”. Consultants are unlikely to recommend below market CEO pay. By benchmarking, consultants tend to ratchet pay upward as firms seek to give their CEOs competitive (i.e., above median) pay.

9
of pay (or lower pay-performance sensitivities) and potentially greater conflicts of interest.
Similarly, Murphy et al (2010) find that pay is higher in US firms where the consultant works for
the board rather than for management. In Canada, CEO pay is higher in companies where the
consultant provides non-compensation-related services (“cross-sell” services), and that pay is
higher in Canadian firms when the fees paid to consultants for non-compensation-related services
are large relative to the fees for executive-compensation services. In UK, Goh and Gupta (2010)
study the impact of consultant change on managerial compensation and find that, in the year of the
switch, CEOs of switch firms receive higher salary increments (both absolute and adjusted for
median peer levels) and a less risky compensation package, through a higher proportion of bonus
and a lower proportion of equity pay.
In response to increased concerns over executive pay, the SEC expanded its disclosure rules in
August 2009. The expanded rule requires firms to disclose fees paid for both compensation
consulting and non-compensation-related services if a firm purchases more than $120,000 in
non-compensation-related services from its executive-pay consultant. Under the new regulations,
firms can avoid such disclosures if the board retains its own compensation consultant (and if that
consultant provides no non-compensation-related services). In fear of public anger of the potential
conflicts of interest, the consulting firms lobbied the SEC intensely over the summer of 2009,
holding eight meetings with various SEC commissioners and staffers over a period of 11 and a half
weeks. However, the lobbies did not prevent the passage of the regulation and the fall in 2009
witnessed dramatically changes in the consulting industry, especially among the biggest four
consulting firms (Tower Perrin, Hewitt, Mercer and Watson Wayatt) that historically provide other
non-compensation-related services. In September 2009, a leading consultant left Mercer to form

10
Compensation Advisory Partners (“CAP”). In early 2010, Watson Wyatt merged with Towers
Perrin to form Towers Watson & Co. on January 4, 2010. Later in July 2010 Pay Governance was
spun-off from Towers Watson. Furthermore, Hewitt spun-off part of its North American Executive
Compensation business into a new and independent consulting firm, Meridian Consulting Partners
on January 29, 2010. In addition, the individuals at Hewitt joined another firm, Exequity in early
2010 and later in 2010, Aon Corporation merges with Hewitt Associates, creating Aon Hewitt, the
world’s premier human capital solutions firm on October 1, 2010.
The dramatic changes in the consulting industry trig the public’s concerns of compensation
consultants’ conflicts of interest. In particular, how independent the compensation consultants are.
This study aims to utilize the 2009 SEC regulation and use the actual consulting fee data to
examine whether the conflicts of interest of consultant is associated with higher CEO pay.
3. Hypothesis and Model Specification
Compensation consultants have various types of expertise and can assist compensation
committees in two primary ways. 6First, they provide expertise on compensation-related issues to
tailor executive pay packages for the board, including knowledge of relevant laws and an
understanding of executive compensation practices in general and for organizational changes such
as mergers, acquisitions, and restructurings. Second, they typically have access to detailed,
proprietary information about pay practices for specific industry or market. Based on peer group
information, they can make recommendations to compensation committee about pay package.
6 Insight and advice about wider trends in executive compensation, analysis of managerial labor markets (e.g., how tight or slack the market for executive talent is), advice on performance measures and standards in compensation contracts, advice on compensation and benefits practices relative to peers, advice on pensions, an assessment of executive compensation relative to executive performance, and insight and advice on the level and mix of pay and benefits

11
The optimal contracting theory argues that under industry reputation self-discipline and
effectiveness of the board structure, compensation consultants help to facilitate an efficient contract
between the firm and executives, by providing useful labor market information and expertise. This
is particular true when the hiring and firing power rests on the compensation committee. First,
consultants have strong incentives to develop and maintain their reputations by providing accurate
and unbiased advice. In long run their ability to retain a portfolio of customers relies on their
credibility when considering the “repeat business” effect (i.e., the consultants’ concern of being
reappointed) [Murphy and Sandino (2010) and Conyon, Peck, and Sadler (2009)]. To prevent
potential conflicts, some consulting firms ensure that the individual who advises the compensation
committee does not work on non-EC projects for the same client (Powers, 2007)7. Second,
compensation committees understand the importance of their oversee responsibility on executive
pay. Directors are required by many state laws to have a “duty of care” to exercise due diligence
where the use of expert advisors is encouraged. If the advisors are not independent or are deemed to
have a conflicting interest, then directors could be at risk of not fulfilling their responsibility to
shareholders. Third, compensation committee can take steps to mitigate potential cross-selling
conflicts of interests by requiring written approval of the non-compensation-related services (Lublin,
2007)8. Prior studies suggest that firms that employ compensation consultants have a higher
proportion of their compensation packages “at risk” in the form of equity pay, consistent with the
7Hewitt compensation services are segregated from other consulting services into a single, separate business unit within Hewitt. As part of that structure, the executive compensation consultants are paid solely based on the results of the executive compensation business unit, and not based on the performance of any other business unit or any other aspect of Hewitt’s performance. Executive compensation consultants are not eligible for Hewitt equity awards. They also proactively provide summary disclosures to Compensation Committee clients of all of Hewitt’s services to the company. 8 Other committees prohibit any non-compensation work from the consulting firm that provides EC services (Powers, 2007; Lowman, 2007). Some committee have written policy of the compensation consultant’s independence as the company’s total service revenue is less than 1% of their consolidated gross revenues from the Company. For example, one firms states on their proxy statement that
“an Independence Policy for the Compensation Committee consultant in February 2008 that establishes independence requirements, including that Towers Perrin and its affiliates do not derive more than 1% of their consolidated gross revenues from the Company. The Independence Policy also requires an annual certification from Towers Perrin confirming compliance with the Compensation Committee’s Independence Policy. During 2009, Towers Perrin and its affiliates received substantially less than 1% of their consolidated gross revenues from the Company for consulting and actuarial fees.

12
shareholder alignment view (Conyon, Peck, & Sadler [2009]; Voulgaris, Stathopoulos, & Walker
[2009]). In this case, we would not expect to find an association between conflicts of interest and
the level of CEO pay or pay-performance sensitivity (PPS).
However, the rent-extraction theory (management power theory) argues that CEOs can use
their power over compensation consultants to extract excess pay, and consultants have strong
incentives to keep CEOs satisfied (Bebchuk & Fried [2003]; Morgenson [2006]; Anderson et al.
[2007]; Waxman [2007]). Historically, compensation consultants have been retained not by the
compensation committee but rather by company management. This situation creates an obvious
conflict of interest, since the consultants make recommendations on the pay of the individuals who
hire them (and who might hire them for repeat business). Although nowadays most firms assign the
power of hiring and retaining compensation consultant in compensation committee, CEOs make
recommendations of the consultant selection and CEOs can still influence the board’s decision
through their powers (Crystal, 1991; Bebchuk and Fried, 2003, 2004 ), thus the consultant have the
potential conflicts of interest as the desires to secure “repeat business” and to “cross-sell” service
(Cadman,2010). “Repeat business” conflicts of interest arise when the consultant provide repeat
business to the same client year after year while “cross-sell” conflicts of interest arise when the
consultant provides potentially more profitable non-executive-compensation services to the client
firm beyond advice on executive pay.9 The “cross-sell” service can compromise consultants’
independence, since the other revenues are sometimes more than ten times the client’s
compensation-related revenue and the profit margin of the other revenues are higher than the
compensation revenues (Waxman, 2007). If cross-selling incentives compromise the independence 9 Non-compensation-related services include actuarial services, employee pay services benefits-administration services, and other uncommon services include non-pay consulting, employee training, outsourcing HR functions, tax services, investment services for pension funds, and actuarial services unrelated to pension plans.

13
and objectivity of compensation consultants, then we would expect that CEOs of firms that retain
consultants with greater potential conflicts of interest would receive higher compensation levels. In
addition, compensation schemes link executive wealth to firm performance, typically by including
variable cash pay (bonus) and equity-based components. Risk- and effort-averse executives prefer
large fixed compensation packages with variable pay that is less sensitive to firm performance.
Therefore, in addition to recommending higher levels of pay, consultants with greater conflicts of
interest are also likely to advocate contracts that result in weaker PPS.
Therefore, based on the above argument, our hypotheses are:
Null Hypothesis: CEO pay is not associated with compensation consultant’s conflicts of interest. Alternative Hypothesis: CEOs of firms that retain consultants with greater potential conflicts of interest would receive higher compensation levels and larger fixed compensation packages with variable pay that is less sensitive to firm performance
To test the hypothesis, we use actual fee disclosure data of SP500 firms in 2009. We use four
measures to proxy the compensation consultant conflicts of interest: COMPFEE (to test the “repeat
service” conflict), OTHERSERVICE, OTHERFEE and FEERATIO (to test “cross sell” conflict).
COMPFEE represents the service fee related to compensation consultants. OTHERSERVICE is a
dummy variable, which takes one if the consultant provides non-compensation-related service, zero
otherwise. OTHERFEE represents the service fee related to non-compensation-related service, such
as pension, actuaries and general management service. FEERATIO represents the ratio of
COMPFEE and OTHERFEE.
Our dependent variable is CEO pay. To measure CEO pay, we use the level of the
compensation (salary, bonus, equity and total compensation), and pay-performance sensitivity (PPS)

14
on the CEO total pay. The dependent variable in Model A is LnPAY, where LnPAY is defined as the
log of one of four measures: Salary, Bonus (bonus and non-equity incentive pay), Equity (sum of
stock awards and option awards) and Total (sum of salary, bonus and equity, pension and other
compensation) received during the year. Salaries represent the fixed component of pay, while bonus
and equity pay are typically tied to performance criteria and represent a variable element of
compensation. The dependent variable in Model B is PPS, where PPS is measured by two proxies:
PPSCUM is the ratio of total equity value change over 1% change in share price; PPSANN is the
ratio of CEO annual equity pay over 1% change in share price.
We control other firm and corporate governance factors that might affect the CEO pay: firm
economical characteristics, CEO characteristics and governance characteristics. For economical
characteristics, studies indicate that CEO compensation levels should be increasing in firm size,
operating and stock price performance, and investment opportunities (e.g., Murphy, 1999; Lambert
and Larcker, 1987; Smith and Watts, 1992; Core and Guay, 1999). We include both operating
income performance (ROA) and stock market performance (RETURN) as our proxies for firm
performance. ROA (EBITDA scaled by the average of beginning and end of year total assets) and
Lag(ROA)(ROA at time t-1) measure the operating performance, while RETURN (measured by
total returns to shareholders, reflecting share price appreciation and dividend yield during the year)
and LagRETURN (RETURN at time t-1) is to capture market performance. We also control firm
leverage, size and book-to-market ratio, as they may reflect organizational complexity and growth
opportunities. Leverage (LEV) is defined as the ratio of long term and short term debt to total assets.
Size (SIZE) is the log of the firm’s total assets measured at the end of the fiscal year, and
investment opportunity (BTM) is measured by the ratio of book value to market value of assets.

15
CEO-specific characteristics may also influence compensation levels. First, CEO pay is likely to
be higher for more experienced CEOs. We use three variables to capture CEO experience: Age (age
of CEO), Tenure (tenure of CEO). The CEO_CHANGE variable is included because firms often
provide relatively large compensation packages in the first year equity incentives and to make the
CEO whole with respect to any compensation forfeited from his or her prior employer. Moreover,
CEOs may have other economic incentives that substitute for annual pay, such as the existing CEO
shareholdings. Second, to control CEO’s existing equity incentives, we use CEOSHARE to measure
CEO’s existing shareholdings. There are two possible pay outcomes associated with equity
incentives. When equity incentives (and total wealth) are high already, there may be little reason to
provide additional incentives using annual compensation, and compensation levels may be lower. In
contrast, if the equity incentives provide the CEO with considerable power over the Board, we may
observe higher annual compensation.
Our other control variables include variables related to corporate governance and management
power. Consistent with earlier studies, we use six variables to capture board characteristics. 1.
Armstrong et al (2010) argues that when a Board is dominated with CEO as chairman, Board tends
to be under the influence of the CEO, therefore, we use a dummy variable (CEODUAL), which
takes one if the Chairman of Board is same as CEO and zero otherwise. 2. Core et al. (1999)
suggests that board independence is positively influence managerial and board decision-making;
therefore, we use the percentage of outside director in a Board (OUTDIR) to proxy board
independence. 3. Yermack (1996) and Coles et al. (2008) find that board size negatively influences
managerial and board decision-making. We use the number of directors on the board (BSIZE) to

16
proxy the board size. 4. Yermack (1996) finds that board meeting is positively associated with
strong governance, therefore, we use numbers of board meetings (BMEET) to proxy board
effectiveness. 5. BAGE is the percentage of Board members who are at least 69 years old. 6.
BTENURE is the percentage of board members who have tenure more than 10 years. 7 BBUSY:
previous studies (Armstrong et al (2010) have shown that board is less effective if the board
members have more positions other than in a particular company. Following Core et al. (1999) and
other governance studies, we expect stronger board governance to be positively related to OUTPCT
and BMEET, BTENTURE and negatively related to CEODUAL, BSIZE and BAGE.
Finally, we follow prior literature and use industry fixed effects to capture industry-specific
differences in compensation levels. These fixed effects indicators are based on two-digit SIC codes.
The followings are the regression models used to test our hypothesis.
ModelA:
RETURNROA FEERATIO/OTHERFEE/HERSERVICECOMPFEE/OT LnPAY
161514
13121110987
65432
10
εβββ
βββββββ
βββββ
ββ
+++++
+++++++
+++++
+=
MMYINDUSTRYDUBBUSYBTENUREBAGEBMEETBSIZEOUTDIRCEODUALCEOSHARETENUREAGE
LEVMBSIZE
Model B:
RETURNROA FEERATIO/OTHERFEE/HERSERVICECOMPFEE/OT PPS
161514
13121110987
65432
10
εβββ
βββββββ
βββββ
ββ
+++++
+++++++
+++++
+=
MMYINDUSTRYDUBBUSYBTENUREBAGEBMEETBSIZEOUTDIRCEODUALCEOSHARETENUREAGE
LEVMBSIZE
Model A is to test the association between the compensation consultant’s conflicts of interest
and the CEO level pay (salary, bonus, equity and total compensation) while Model B is to test the
association between the compensation consultant’s conflicts of interest and the CEO

17
pay-performance sensitivity.
4. Data and Descriptive Statistics
Our sample initially consists of SP500 publicly-traded companies with: (1) fiscal years of 2009,
that filed their annual proxy statements (DEF 14A) as of December 31. The compensation
consultant data is hand collected from the compensation committee report in the proxy statement
following the introduction of the new disclosure rules. In most cases, the primary consultant is
clearly identified in the text of the proxy. If no consultant is discussed, we classify the company as
not using a consultant. In some instances when multiple consultants are used, we use the primary
consultant that provides most service to the board. In these cases, we code the consultant used by
the company for senior executive compensation.
We delete 60 firms missing valid proxy statement due to merge and acquisition. As a result, only
440 firms are selected with proxy statement data available for fiscal year 2009. Then we also delete
several firms due to data availability from CRSP and COMPUSTAT, ExeComp and Corporate
library. Our final data sample has 429 firms. Among these 429 firms, we find that about 24%
firms (106) are using compensation consultant along with non-compensation-related services,
including actuarial services, employee pay services, benefits-administration services, and other
uncommon services. The rest 76% firms (323 firms) do not use compensation consultants for
non-compensation-related services.
INSERT TABLE 1
Table 2 presents the market shares of the leading compensation consultant firms, including
18
Towers Perrin, Frederic Cook, Hewitt, Mercer, Watson Wyatt, Pearl Meyer and Semler Brossy.
Contrasts to previous studies (Murphy and Sandino (2010), Cadman, Carter and Hillegeist (2010))
that identify Towers Perrin with the highest market share, we find that Frederic Cook has the
highest market share (25.7 %), followed by Towers Perrin (17.02 %), Hewitt (15.38%), Mercer
(9.56 %), Watson Wyatt (7.23%), Pearl Meyer (6.06%). The small boutique consulting firms include
Semler Brossy (5.36%), Aon Consulting (2.23%), Hay (1.86%), Deloitt Consulting (1.4%) and
Compensia (1.4%).
INSERT TABLE 2
Table 3 presents fees of 106 firms where compensation consultants also engage
non-compensation-related services. Compensation consultants charge wide range fees for the CEO
compensation service, starting from $8,631 (minimum) to $789,000 (maximum), with the mean
(median) of COMPFEE as $214,122.5 ($188500). Similarly, we also observe a wide range of fees
for non-compensation-related services, starting from $110000 to $3,583,061, with the mean
(median) of OTHERFEE as $2,531,343 ($1,123,477). The FEERATIO is also widely spread, the
maximum FEERATIO is 127, indicating that compensation consultant engage
non-compensation-related services with value 127 times larger than the compensation-related
service fee. Table 3 Panel B also lists the fee distributions of compensation service fees,
non-compensation-related service fees and fee ratio. The majority of compensation consultant
charge compensation service fees between 100,000 and 200,000 (40 firms, 37.7% of the sample),
followed by the range between 200,000 and 300,000 (29 firms, 27.4%). 20 firms (18.9%) have the
compensation service fees less than 100,000, while 6 firms have compensation service fees over

19
$500,000. We also find wide distribution of non-compensation-related service fees charged by
compensation consultants, ranging from over 10 million dollars to less than 120,000 dollars. In
particular, we find that the majority consultants provide non-compensation-related service in the
range of 1 million and 5 million (40 firms, 37.7%), followed by 22 firms (20.8%) within the range
of $120,000 and $500,000. Four firms have non-compensation-related service fees over 10 million
dollars, while only 9 firms have non-compensation-related service fees less than 120,000. We then
look at the FEERATIO, and find that 5 firms engage compensation consultant to provide
non-compensation-related service that is over 100 times of the compensation service fees. The
majority of consultants provide non-compensation-related service between 1 and 5 times of the
compensation service.
Table 3 Panel C and D present the CEO pay for various groups by FEERATIO and
non-compensation-related fees, according to percentiles of sample firms. In particular, we group
firms into five groups according to the levels of non-compensation-related fees (Group 1: 0—3,
Group 2: 3—7, Group 3: 7-13, Group 4: 13—30 and Group 5: over 30) and FEERATIO (Group 1:
0.12—0.5 million, Group 2: 0.5—1 million, Group 3: 1-2 millions, Group 4: 2—5 millions and
Group 5: over 5 millions). Panel E clearly presents an up-ward trend of CEO pay (salary, bonus,
equity and total compensation), from Group 1 to arrive peak in Group 4. However, after the peak of
CEO pay in Group 4, we observe a decline of CEO in Group 5. This is very interesting, since the
distribution of CEO pay does suggest that when compensation consultants’
non-compensation-related fees increase, CEOs receive higher salary, bonus, equity and total
compensation. It is strong evidence that suggests that the potential conflicts of interest of
compensation consultant do bias their advice towards favorable CEO pay to secure greater revenue

20
from their clients by providing. However, the declines in CEO pay for Group 5 (the group with
highest FEERATIO and OTHERFEE) imply that when the consultants receive more revenue from
other services, they tend to reward CEO less, in fear of public recognition of their conflicts of
interest and to avoid scrutiny from regulatory bodies (such as SEC) or the public. This is
particularly true after the passage of SEC regulation in August 2009 when the fees are required to
disclose. This pattern is similar to Murphy et al (2010)’s findings, where they find that increasing
the ratio of non-executive-pay fees to executive-pay fees from 0 to 10 (approximately the average in
our sample) corresponds to approximately an 11% increase in pay for Canadian CEOs.
INSERT TABLE 3
Table 4 presents the descriptive statistics of variables we used in analysis. The mean (median) of
CEO salary during 2009 is $1,082,490 ($1,000,000) while the mean (median) of CEO bonus is
$2,169,450 ($1,500,000). The mean (median) of CEO equity is about $5,186,290 ($4,266,100) and
the mean (median) of CEO total compensation is $9,897,340 ($8,430,340) respectively. The
pay-performance sensitivity of CEO pay of total equity value change in past years has a mean
(median) as -7.23369 (0.19718) and the pay-performance sensitivity of CEO pay of annual equity
pay has a mean (median) as -47.419 (-0.7175). Sample firms have median total assets approaching 9
billion. The mean of ROA is 12.73% and the mean of RETURN is 1.45%. The median market to
book ratio is 3.88 and the median leverage level of the sample is 21%. On average, CEO is 55 years
of age and has been in his current role for over 5 years and has owned 0.005% of company’s
outstanding shares. As to the board characteristics, on average, the board has 11 board members,
87.4% of whom are non-executive or independent directors. Board meets on average 9 times, with

21
the average percentage of directors over 10 years as 30% and the average percentage of directors
over 69 years is 7%.
INSERT TABLE 4
5. Results of Analysis
In this section, we discuss the results of univariate and multivariate regression
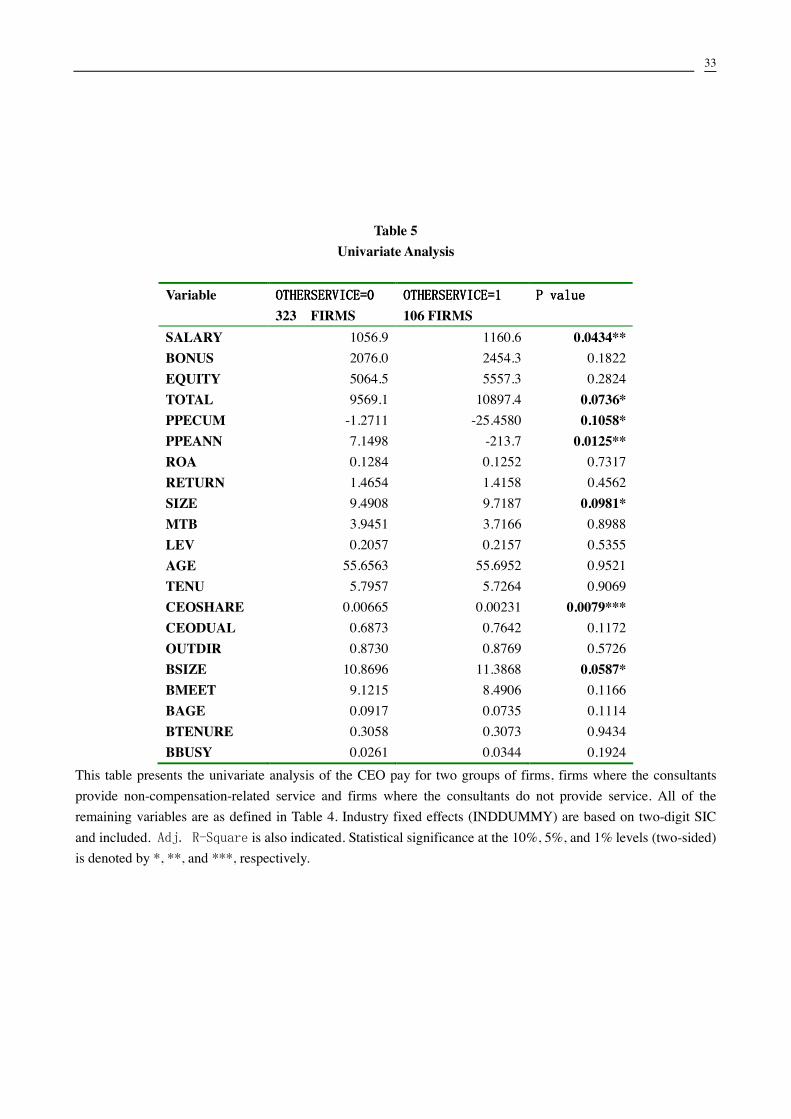
analysis. Table 5 presents the univariate analysis of the CEO pay (salary, bonus, equity and total)
between firms that retain compensation consultants with non-compensation-related services and
firms without non-compensation-related services. We find significant differences on CEO salary
(1056.9 vs 1160.6), total compensation (9569.1 vs 10897.4), PPSCUM (-1.2711 vs -25.4580) and
PPSANN (7.1498 vs -213.7). This univariate result implies that CEO receives higher salary pay in a
firm where the compensation consultant provides non-compensation-related service. Since salary
represents the fixed and riskless portion of the total compensation, this result suggest that the
compensation consultant tends to reward CEO with higher salary when a firm engage its
compensation consultant with non-compensation-related service,. It supports the CEO
rent-extracting theory arguing that compensation consultants with conflicts of interest tend to
compromise its independence to cater for the CEO’s favor. In terms of corporate governance and
CEO characteristics, we also find that CEOSHARE (0.00665vs 0.00231) and BSIZE (10.8696 vs
11.3868) are significantly different.
INSERT TABLE 5
Tables 6 documents strong evidence for the association between compensation fees
(COMPFEE) and the level of CEO pay. In particular, we find that COMPFEE is significantly

22
positive associated with BONUS and TOTAL. This indicates that CEO receives higher bonus and
total compensation in a firm with higher compensation-related service fee. Table 6 also presents the
results with regard to our control variables. In particular, we find that CEO’s pay (salary, bonus,
equity and total) is positively associated with a firm’s operating performance (ROA) and market
performance (RETURN) and firm size. As to the corporate governance variables, we find that salary
is positively associated with CEO duality (CEODUAL) and board age (BAGE), and negatively
associated with board tenure (BTEN). In addition, CEO bonus is negatively associated with board
meetings. CEO’s total compensation is positively associated with CEO duality, board age and board
tenure and negatively associated with board meetings. These results suggest that strong CEO power
and weak board efficiency are related to higher CEO pay.
INSERT TABLE 6
Table 7 shows evidence of the association between non-compensation-related services provided
by compensation consultants (OTHERSERVICE) and the level of CEO pay. The coefficients of
OTHERSERVICE on SALARY, BONUS and TOTAL are 0.074, 0.229 and 0.156, indicating that
CEO receives 7% more salary, 22.9% more bonus and 15.6% more total compensation in firms
where compensation consultants provide non-compensation-related services. These findings are
similar to Murphy et al (2010)’ findings since they find that “US CEOs receive about 18% more
total compensation, and Canadian CEOs receive about 33% more, when their executive
compensation consultant also provides non-compensation-related services to the firm.”10 These
findings are particularly important to add the current debate on whether the CEO receives “excess
pay” when compensation consultants have conflicts of interest. Our results support the 10 The difference between our findings and Murphy et.al (2010)’s findings for Canadian firms might due to the fact that Canadian companies retaining more than one executive pay consultant and multiply consultants are associated with higher CEO pay, as documented in Kabir et.al (2010).

23
rent-extracting theory that suggests compensation consultant might cater to CEO in exchange for
the possibility of obtaining non-compensation-related service.
INSERT TABLE 7
In Tables 8, we further on show the association between non-compensation-related service fees
(OTHERFEE) and the level of CEO pay. We find that CEO receives more salary and total
compensation when the compensation consultants receive higher fees on non-compensation-related
service. Since CEO salary represents the fixed portion of the CEO compensation that represents
riskless pay compared to equity-based compensation, this finding shows that compensation
consultants designs a riskless fixed pay of CEO pay package to cater CEO’s favor to obtain higher
non-compensation-related service fees. Table 8 also presents the results with regards to our control
variables. Table 8 also shows that salary is positively associated with CEO duality (CEODUAL)
and board age (BAGE), and negatively associated with board tenure (BTENURE). CEO equity is
also positively associated with BAGE and negatively associated with board meetings. Moreover,
CEO’s total compensation is positively associated with CEO duality, board age and board tenure
and negatively associated with board meetings. These consistently suggest that strong CEO power
and weak board efficiency is related to higher CEO pay.
INSERT TABLE 8
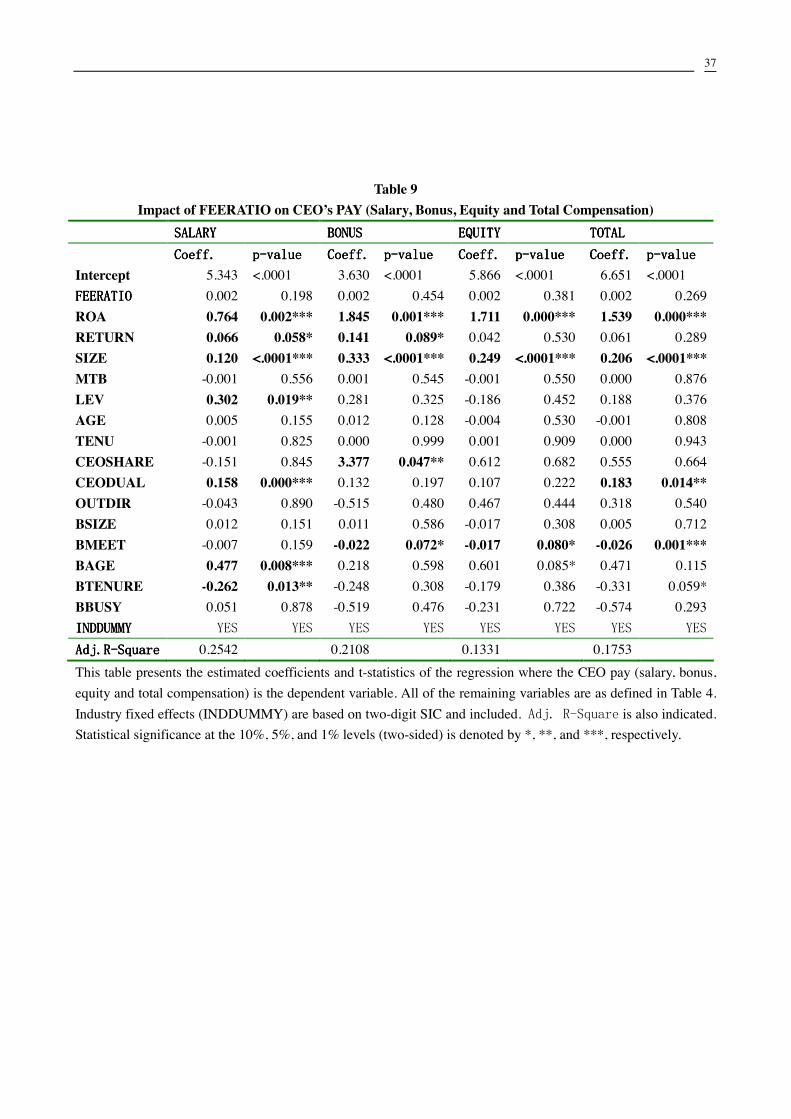
Table 9 presents the regression results of FEERATIO on CEO pay. Our regression model fail to
find evidence to support the argument that potential conflict of interest of consultants, represented

24
by FEERATIO, leads to CEO “excess pay”. This finding is consistent with the previous analysis in
Table 3 when we present the primary results of comparing the mean (median) of CEO salary, bonus,
equity and total compensation among groups with different levels of FEERATIO. In particular, we
observe the increase in CEO pay from Group 1 to Group 4 (for 80% of sample firms), which
implies that potential conflicts of interest of compensation consultant do bias their advice towards
favorable CEO pay to secure greater revenue from their clients by providing. However, the declines
in CEO pay for Group 5 (the group with highest FEERATIO) imply that when the consultants
receive more revenue from other services, they tend to reward CEO less, in fear of public
recognition of their conflicts of interest and to avoid scrutiny from regulatory bodies (such as SEC)
or the public. Therefore, the pattern of CEO pay as initially increasing and later decline among five
groups might explain the insignificant regression results. Findings of other control variables are
similar to previous tables, indicating that firms reward CEO more in firms when board sizes are big,
when CEO is also the chairman of the board and when directors are either old or sit in board with
shorter tenure.
INSERT TABLE 9
In addition to measure the CEO pay level, we also examine the sensitivity of CEO pay on a
firm’s performance using pay-performance-sensitivity (PPS). We use two proxies to measure PPS:
total equity value change over the years and annual equity pay. Table 10 and Table 11 present
regression results. The negative coefficient of OTHERSERVICE (-30.115) in regression model on
PPS in Table 10 suggests that PPS measured by total equity value change is 30.12% lower in firms
that retain compensation consultant to engage non-compensation-related services. In addition, the
negative coefficient of OTHERSERVICE (-256.411) in regression model on PPS in Table 11

25
suggests that CEO’s PPS measured by annual equity pay is 256.41% lower in firms that retain
compensation consultant to engage non-compensation-related services. These findings are
particularly interesting since PPS represents the alignment of interest between the shareholders and
CEO pay and the optimal-contracting theory suggests that the use of compensation consultant help
align stockholders’ interests with CEO pay. However, our findings provide contradictory evidence..
In addition, we find the PPS is negatively associated with firm size and CEO tenure, indicating that
when firm grows in size or CEO remains in his position longer, the PPS becomes lower.
INSERT TABLE 10 and 11
Overall, our multivariate analysis results suggest that compensation consultants’ conflicts of
interest are associated with higher CEO pay and lower PPS. Our results support the rent-extraction
argument. The rent extraction view argues that consultants have a strong incentive to serve the
interest of CEOs in order to retain both their compensation consulting business and other consulting
business with client firms. Our results are consistent with the conclusion of Bebchuk and Fried
(2003): “Providing advice that hurts the CEO’s pocketbook is hardly a way to enhance the
consultant’s chances of being hired in the future by this firm or, indeed, by any other firms.”
6. Conclusion
Despite the essential role that the compensation consultants play in setting the CEO
compensation, little is known about the influence of compensation consultants on executive pay.
While consultants can use their expertise to assist the compensation committee in designing
compensation packages that maximize shareholder value, critics accuse them of helping secure and

26
justify excessively high CEO compensation levels and aiding CEOs at the expense of shareholders.
However, more rigid academic studies fail to document consistent association between potential
conflicts of interest of compensation consultants and the CEO pay.
Data unavailability in US might have limited researchers to investigate this important issue
since the actual consultant fee data is not available until December 2009. Utilizing new disclosed
data of compensation consultants and related service fees, we examine whether potential conflicts
of interest faced by compensation consultants lead to higher observed levels of CEO pay. We find
significant evidence on that firms that retain consultants with greater conflicts of interest
compensate their CEOs more (salary, bonus and total compensation) than their counterparts. In
particular, evidence shows that that CEO receives 7% more salary, 22.9% more bonus and 15.6%
more total compensation in firms where compensation consultants provide
non-compensation-related services. In addition, we also document that CEO’s
pay-performance-sensitivity (PPS) is lower in firms where the consultants have potential conflicts
of interest. Results show that CEO’s PPS measured by total equity value change (annual equity pay)
is 30.12% (256.41%) lower in firms that retain compensation consultant to engage
non-compensation-related services.
Our study is the first study that takes advantage of new 2009 SEC regulations that requires
detailed disclosure of the fees received by compensation consultants and uses actual disclosure data
to examine impact of the potential conflict of interest of compensation consultants on CEO pay. It
provides evidence of the rent extraction argument that compensation consultants with potential
conflicts of interest do bias their advices towards CEOs in their client firms to secure their revenues.

27
Findings of this study have very important policy implications on the role of compensation
consultant. In particular, this paper sheds light on the parallel literature on “auditor independence”
and “security analyst”, while both professions have potential conflicts of interest that might hinder
their independence. Interestingly, concerns of conflicts of interest have led regulatory changes,
including the Sarbanes-Oxley Act with detail disclosures of fees charged for auditing and
non-auditing business and the New York Stock Exchange (NYSE)’s new regulations to separate
investment banking units from research units and disclose more fee-related information.
Although the 2009 SEC regulation does not prohibit companies from purchasing other services,
to avoid disclosure of service fees charged by consultants, firms can either avoid using their
executive-pay consulting firms for other services, or to hire two or more consultants, one working
exclusively for the board and the other(s) working for management (while providing other services).
Therefore, future research could examine whether the new regulation leads to popularity of multiple
consultants. Meanwhile, this new regulation have influenced the market shares of consulting
industry since we observed dramatic changes in the consulting industry with merges and
acquisitions among consulting firms, as described in Section 2. Hence, future research could
examine the impact of this new regulation on the changes in compensation consultants. In addition,
companies can set barriers to restrict compensation consultants’ conflicts of interest by setting
safeguards put in place by compensation committees, such as requiring prior approval of or
prohibiting the provision of non-compensation-related services by the consultant. Hence, future
research can examine the corporate governance characteristics for firms using same consultants for
both CEO compensation and other non-compensation-related service.

28
Bibliography:
Armstrong, C., Ittner, C, & Larcker, D. 2010, Corporate Governance, Compensation Consultants, and CEO Pay Levels, Rock Center for Corporate Governance at Stanford University Working Paper No. 92 Bebchuk, L. & Fried, J. 2003. Executive Compensation as an Agency Problem. Journal of
Economic Perspectives, 17: 71-92. Cadman B., Carter M., & Hillegeist. S., 2010, the Incentives of Compensation Consultants and CEO Pay, Journal of Accounting and Economics, Forthcoming Connelly, Julie. 2010. Transparency Time for Compensation Consultants' Own Compensation Corporate, Board Member, First Quarter 2010 Conyon, M. & Peck, S. 1998. Board Control, Remuneration Committees and Top Management
Compensation. Academy of Management Journal, 41: 146-157. Conyon, M., Peck, S., & Sadler, G. 2009. Compensation Consultants and Executive Pay: Evidence
form the United States and United Kingdom. Academy of Management Perspectives, 23, 43-55. Corporate Board Member and Pricewaterhouse Coopers, 2007. What Directors Think: Annual Board of Directors Survey. Core J. & Guay, W. 1999. The Use of Equity Grants to Manage Optimal Equity Incentive Levels.
Journal of Accounting and Economics, 28, 151-184. Core J. & Guay, W. 2002. Estimating the Value of Employee Stock Option Portfolios and their Sensitivities to Price and Volatility. Journal of Accounting Research, 40, 613-630. Core, J., Holthausen, R., & Larcker, D. 1999. Corporate Governance, Chief Executive Officer
Compensation, and Firm Performance. Journal of Financial Economics, 51, 371-406. Corporate Library 2007. The Effect of Compensation Consultants: a Study of Market Share and
Compensation policy advice. Murphy, K., & Sandino,T., 2010. Executive Pay and 'Independent' Compensation Consultants,
Journal of Accounting and Economics, Forthcoming Goh. L. & Gupta.A. 2010, Executive Compensation, Compensation Consultants, and Shopping for
Opinion: Evidence from the UK, Journal of Accounting, Auditing and Finance, Forthcoming Higgins. 2007, the Corporate Library report, The Effect of Compensation Consultants Morgenson, G. 2006. Gilded Paychecks: Troubling Conflicts. New York Times, April 10.

29
Morgenson, G. 2007. Panel to Look at Conflicts in Consulting, New York Times, May 11. Murphy, K. J. 1999. Executive Compensation, in Handbook of Labor Economics. Orley Ashenfelter
and David Card eds. 2485-2563. Lublin, J. 2007. Boards Aim to Avoid Conflicts -- Safeguards are Imposed on Same Pay Consultant for Executives, directors. Wall Street Journal, May 14. Paulin, G. 2007. “Testimony of George B. Paulin, Chairman and CEO, Frederick W. Cook &Co.,Inc. before House of Representatives Committee on Oversight and Government Reform Hearing on Executive Compensation Consultants Independence”, December 5: 2 Powers, M. 2007. “Testimony of Michael J. Powers Hewitt Associates LLC before House Committee on Oversight and Government Reform on Executive Pay and the Role of the Compensation Consultant”, December 5: 7 Kabir, R. & Minhat M. 2010, Multiple Compensation Consultants and CEO Pay, working paper Smith, C. & Watts, R. 1992. The Investment Opportunity Set and Corporate Financing, Dividend,
and Compensation Policies. Journal of Financial Economics, 15, 2-29. The US House of Representatives Committee on Oversight and Government Reform Report, 2007
“ Executive Pay: Conflicts of Interest Among Compensation Consultants” (the “Waxman Report”) Georgios, V. Stathopoulos.K & Walker.M 2010 Compensation Consultants and CEO Pay: UK
Evidence, Corporate Governance: An International Review, Vol. 18, Issue 6, pp. 511-526 Yermack, D. 1996. Higher Market Valuation of Companies with a Small Board of Directors, Journal
of Financial Economics, 40, 185-211.

30
Table 1
Sample Selection Total Initial Sample from SP500’s proxy statement in 2010 S & P 500 firms
Deduct Firms without valid Proxy Statement (40 firms) Deduct firms with missing variable due to merge with other database (31 firms)
Total Final Sample 429 firms Firms that Compensation Consultants Provide Non-compensation-related
services 106firms (24%)
Firms that Compensation Consultants Do not Provide Non-compensation-related services
323 firms (76%)
Table 2 Market Share of Consulting Firms of SP 500 in 2009
Consultant Name Firms %
Cook 108 25.17Towers Perrin 73 17.02
Hewitt 66 15.38Mercer 41 9.56
Watson Wyatt 31 7.23PM&P 26 6.06
Semler Brossy 23 5.36Aon Consulting 10 2.33
Hay Group 8 1.86Deloitte Consulting 6 1.4
Compensia 6 1.4PricewaterhouseCoopers 4 0.93James F. Reda Associates 3 0.7
Delves Group 3 0.7Others(2/1firm) 21 4.89
Total 429

31
Table 3 Fee Characteristics of Consulting Firms of SP 500 in 2009 and CEO Pay
Panel A Variable Minimum 25%
QuartileMean Median 75%
QuartileMaximum Std Dev
COMPFEE 8,631 120,000 214,122.5 188,500 265,398 789,000 139307.5OTHERFEE 110,000 515,000 2,531,343 1,123,477 3,300,000 22,404,000 3583061FEERATIO 0.459866 2.218807 18.26482 7.245662 18.79991 127.4009 28.09026Panel B COMPFEE Firms % OTHERFEE Firms % FEERATIO Firms % Over 500,000 6 5.7% Over 10 Millions 4 3.8% Over 100 5 4.7% 400,000--- 500,000 6 5.7% 5 M--- 10 M 10 9.4% 50-100 7 6.6% 300,000-400,000 5 4.7% 1 M--- 5 M 40 37.7% 10-50 28 26.4% 200,000---300,000 29 27.4% 500,000---1M 21 19.8% 5-10 16 15.1% 100,000-200,000 40 37.7% 120,000-500,000 22 20.8% 1-5 35 33.0% Less than 100,000 20 18.9% Less than 120,000 9 8.5% Less than 1 15 14.2% Panel C OTHER FEES GROUPS (Millions)
SALARY MEAN(MED.)
BONUS MEAN(MED.)
EQUITY MEAN(MED.)
TOTALCOMP MEAN(MED.)
Group1: 0.12 - 0.5M. Group2: 0.5 - 1 M. Group3: 1 - 2 M. Group4: 2 - 5 M. Group5: Over 5 M. Panel D FEERATIO GROUPS
SALARY MEAN(MED.)
BONUS MEAN(MED.)
EQUITY MEAN(MED.)
TOTALCOMP MEAN(MED.)
Group1: 0 -- 3 1111.44(1024.5) 1565.24(1453.86) 5136.43(4334.69) 9211.04(8501.17) Group2: 3 -- 7 1139.34(1100) 1943.37(1909.7) 4718.48(3858.94) 9357.42(9211.1) Group3: 7-- 13 1167.06(1115.83) 3160.53(2287.21) 4920.93(4597.82) 11280.07(9869.09) Group4: 13--30 1314.66(1133.33) 4185.52(3500) 7539.35(5554.64) 15375.67(11600.34) Group5: Over 30 1239.55(1242.99) 2268.45(2530.46) 6317(5235.52) 11321.2(10390.75) Panel E
This table lists the fee characteristics of consulting firms of SP 500 firms in 2009. COMPFEE represents the service fee related to compensation consultants; OTHERFEE represents the service fee related to non-compensation-related service, such as pension, actuaries and general management service. FEERATIO represents the ratio of COMPEE and OTHERFEE.

32
Table 4
Summary Statistics of Variables Variable Minimum 25%
QuartileMean Median 75%
QuartileMaximum Std Dev
SALARY (Thousands)
1 872.308 1082.49 1000 1225 5600 458.9139
BONUS (Thousands)
1 750.038 2169.45 1500 2668.75 19500 2532.25
EQUITY (Thousands)
1 2521.94 5186.29 4266.1 7150.05 33293.11 4090.88
TOTAL (Thousands)
128.751 5424.64 9897.34 8430.34 12109.79 54584.02 6633.94
PPECUM -2686.26 0.007386 -7.23369 0.19718 0.5019 334.2685 132.9823 PPEANN -7942.00 -48.5317 -47.419 -0.7175 36.832 7786.83 791.6323 ROA -0.11293 0.076595 0.12763 0.120789 0.175664 0.610874 0.083691RETURN 0.402303 1.112186 1.454184 1.345308 1.632393 4.686957 0.555307SIZE 6.621055 8.562992 9.547122 9.379906 10.31642 14.6145 1.337152MTB -48.5065 1.410073 3.888635 2.253331 3.602857 368.6832 19.46459LEV 0 0.098497 0.208185 0.20117 0.304608 0.988825 0.144558AGE 39 51 55.66589 56 60 82 5.994772TENU 1 2 5.778555 4 8 46 5.280887CEOSHARE 0 0.000416 0.005575 0.00101 0.00246 0.410121 0.024507CEODUAL 0 0 0.706294 1 1 1 0.455991OUTDIR 0.571429 0.851649 0.873945 0.9 0.916667 1 0.062558BSIZE 5 9 10.99766 11 12 32 2.444225BMEET 4 6 8.964871 8 10 34 4.119253BAGE 0 0 0.087195 0.076923 0.153846 0.545455 0.108273BTENURE 0 0.1666670 0.3061659 0.3076920 0.4409720 0.8333330 0.1907982 BBUSY 0 0 0.0281869 0 0 0.3333330 0.0565702This table reports summary statistics results and the variable definitions are as follows: SALARY is CEO salary; BONUS is CEO bonus and non-equity incentives. EQUITY is the value of short- and long-term incentive plans and stock options. TOTAL is the sum of the CEO’s salary, bonus, equity, changes in pension and other benefits received during the year. ROA is operating profit scaled by the average of beginning and end of year total assets; RETURN is total returns to shareholders, reflecting share price appreciation and dividend yield during the year; MTB is the ratio of market value to book value of assets, where market value of assets is calculated as (book value of assets common equity + (common shares outstanding market price at year-end); LEV is ratio of debt to total assets; AGE is the age of CEO; TENU is measured by the number of years that the individual has been in his/her current role. CEOSHARE is measured as the value of the CEO’s ordinary and restricted shares at the end of the fiscal year (with logged values used in the regression models); CEODUAL takes one when CEO is the chairman of the board, 0 otherwise. OUTDIR denotes the percentage of the board that is composed of non-executive directors; BSIZE is the size of the board. BMEET is the meeting time of the board during a year. BAGE is the percentage of the directors with age over 70. BTENURE is the percentage of the directors with tenure over 10 years or longer. BBUSY is the percentage of directors that have sat on more than 4 boards.
33
Table 5 Univariate Analysis
Variable
323 FIRMS 106 FIRMSSALARY 1056.9 1160.6 0.0434**BONUS 2076.0 2454.3 0.1822EQUITY 5064.5 5557.3 0.2824TOTAL 9569.1 10897.4 0.0736*PPECUM -1.2711 -25.4580 0.1058* PPEANN 7.1498 -213.7 0.0125** ROA 0.1284 0.1252 0.7317RETURN 1.4654 1.4158 0.4562SIZE 9.4908 9.7187 0.0981*MTB 3.9451 3.7166 0.8988LEV 0.2057 0.2157 0.5355AGE 55.6563 55.6952 0.9521TENU 5.7957 5.7264 0.9069CEOSHARE 0.00665 0.00231 0.0079***CEODUAL 0.6873 0.7642 0.1172OUTDIR 0.8730 0.8769 0.5726BSIZE 10.8696 11.3868 0.0587*BMEET 9.1215 8.4906 0.1166BAGE 0.0917 0.0735 0.1114 BTENURE 0.3058 0.3073 0.9434 BBUSY 0.0261 0.0344 0.1924
This table presents the univariate analysis of the CEO pay for two groups of firms, firms where the consultants provide non-compensation-related service and firms where the consultants do not provide service. All of the remaining variables are as defined in Table 4. Industry fixed effects (INDDUMMY) are based on two-digit SIC and included. is also indicated. Statistical significance at the 10%, 5%, and 1% levels (two-sided) is denoted by *, **, and ***, respectively.

34
Table 6 Impact of COMPFEE on CEO’s PAY (Salary, Bonus, Equity and Total Compensation)
Intercept 5.349 <.0001 3.670 <.0001 5.871 <.0001 6.653 <.0001COMPFEE 0.001 0.315 0.001 0.038** 0.000 0.213 0.001 0.037** ROA 0.772 0.001*** 1.904 0.001*** 1.705 0.000*** 1.559 0.000*** RETURN 0.064 0.067* 0.148 0.071* 0.039 0.565 0.068 0.238 SIZE 0.119 <.0001*** 0.324 <.0001*** 0.255 <.0001*** 0.202 <.0001***MTB -0.001 0.553 0.001 0.527 -0.001 0.516 0.000 0.896 LEV 0.297 0.021** 0.257 0.366 -0.167 0.501 0.168 0.427 AGE 0.005 0.180 0.012 0.149 -0.004 0.521 -0.002 0.738 TENU -0.001 0.860 0.001 0.943 0.000 0.955 0.000 0.984 CEOSHARE -0.177 0.818 3.339 0.048** 0.552 0.711 0.538 0.672 CEODUAL 0.160 0.000*** 0.128 0.206 0.113 0.197 0.183 0.014*** OUTDIR -0.086 0.784 -0.658 0.365 0.510 0.404 0.204 0.693 BSIZE 0.014 0.105* 0.015 0.448 -0.017 0.306 0.009 0.547 BMEET -0.007 0.152 -0.023 0.063* -0.018 0.073* -0.026 0.001*** BAGE 0.487 0.007** 0.257 0.531 0.613 0.079* 0.486 0.101* BTENURE -0.261 0.014** -0.266 0.273 -0.171 0.408 -0.334 0.056** BBUSY 0.109 0.740 -0.362 0.616 -0.235 0.716 -0.445 0.412
0.2529 0.2200 0.1350 0.1821This table presents the estimated coefficients and t-statistics of the regression where the CEO pay (salary, bonus, equity and total compensation) is the dependent variable. All of the remaining variables are as defined in Table 4. Industry fixed effects (INDDUMMY) are based on two-digit SIC and included. is also indicated. Statistical significance at the 10%, 5%, and 1% levels (two-sided) is denoted by *, **, and ***, respectively.

35
Table 7 Impact of OTHERSERVICE on CEO’s PAY (Salary, Bonus, Equity and Total Compensation)
Intercept 5.326 <.0001 3.588 <.0001 5.860 <.0001 6.604 <.0001OTHER SERVICE
0.074 0.097* 0.229 0.021** 0.053 0.536 0.156 0.034**
ROA 0.768 0.002*** 1.856 0.001*** 1.717 0.000*** 1.544 0.000*** RETURN 0.065 0.060* 0.145 0.077* 0.043 0.524 0.062 0.278 SIZE 0.120 <.0001*** 0.328 <.0001*** 0.250 <.0001*** 0.206 <.0001***MTB -0.001 0.556 0.001 0.528 -0.001 0.544 0.000 0.886 LEV 0.306 0.017** 0.289 0.307 -0.182 0.464 0.196 0.355 AGE 0.005 0.159 0.012 0.120 -0.005 0.510 -0.001 0.814 TENU -0.001 0.813 0.000 0.971 0.001 0.911 -0.001 0.930 CEOSHARE -0.102 0.894 3.546 0.036** 0.620 0.678 0.682 0.592 CEODUAL 0.155 0.001*** 0.114 0.262 0.107 0.226 0.174 0.019** OUTDIR -0.036 0.909 -0.472 0.515 0.463 0.449 0.346 0.503 BSIZE 0.012 0.154 0.009 0.627 -0.016 0.323 0.004 0.771 BMEET -0.006 0.177 -0.021 0.078* -0.017 0.081* -0.025 0.002*** BAGE 0.504 0.005*** 0.283 0.490 0.627 0.073* 0.522 0.079* BTENURE -0.262 0.013** -0.251 0.299 -0.178 0.390 -0.333 0.056* BBUSY 0.040 0.904 -0.617 0.393 -0.217 0.739 -0.619 0.255
0.2564 0.2225 0.1322 0.1825 This table presents the estimated coefficients and t-statistics of the regression where the CEO pay (salary, bonus, equity and total compensation) is the dependent variable. All of the remaining variables are as defined in Table 4. Industry fixed effects (INDDUMMY) are based on two-digit SIC and included. is also indicated. Statistical significance at the 10%, 5%, and 1% levels (two-sided) is denoted by *, **, and ***, respectively.

36
Table 8 Impact of OTHERFEE on CEO’s PAY (Salary, Bonus, Equity and Total Compensation)
Intercept 5.385 <.0001 3.738 <.0001 5.883 <.0001 6.715 <.0001OTHERFEE 0.001 0.101* 0.001 0.137 0.001 0.868 0.001 0.102* ROA 0.767 0.002*** 1.851 0.001*** 1.716 0.000*** 1.542 0.000*** RETURN 0.066 0.059** 0.140 0.089* 0.043 0.526 0.062 0.286 SIZE 0.119 <.0001*** 0.328 <.0001*** 0.250 <.0001*** 0.203 <.0001***MTB -0.001 0.573 0.001 0.516 -0.001 0.540 0.000 0.899 LEV 0.288 0.025** 0.244 0.394 -0.186 0.455 0.165 0.438 AGE 0.005 0.178 0.012 0.151 -0.005 0.499 -0.002 0.754 TENU -0.001 0.857 0.000 0.977 0.001 0.904 0.000 0.977 CEOSHARE -0.162 0.833 3.389 0.045* 0.568 0.704 0.544 0.670 CEODUAL 0.155 0.001*** 0.122 0.233 0.110 0.213 0.177 0.017** OUTDIR -0.060 0.848 -0.527 0.469 0.446 0.466 0.295 0.569 BSIZE 0.013 0.140 0.010 0.604 -0.016 0.343 0.005 0.699 BMEET -0.007 0.147 -0.022 0.065* -0.018 0.075* -0.026 0.001*** BAGE 0.493 0.006*** 0.249 0.546 0.616 0.078* 0.494 0.097* BTENURE -0.266 0.012** -0.258 0.289 -0.177 0.393 -0.337 0.054* BBUSY 0.065 0.842 -0.528 0.465 -0.185 0.775 -0.556 0.307
0.2560 0.2146 0.1313 0.1780This table presents the estimated coefficients and t-statistics of the regression where the CEO pay (salary, bonus, equity and total compensation) is the dependent variable. All of the remaining variables are as defined in Table 4. Industry fixed effects (INDDUMMY) are based on two-digit SIC and included. is also indicated. Statistical significance at the 10%, 5%, and 1% levels (two-sided) is denoted by *, **, and ***, respectively.
37
Table 9 Impact of FEERATIO on CEO’s PAY (Salary, Bonus, Equity and Total Compensation)
Intercept 5.343 <.0001 3.630 <.0001 5.866 <.0001 6.651 <.00010.002 0.198 0.002 0.454 0.002 0.381 0.002 0.269
ROA 0.764 0.002*** 1.845 0.001*** 1.711 0.000*** 1.539 0.000*** RETURN 0.066 0.058* 0.141 0.089* 0.042 0.530 0.061 0.289 SIZE 0.120 <.0001*** 0.333 <.0001*** 0.249 <.0001*** 0.206 <.0001***MTB -0.001 0.556 0.001 0.545 -0.001 0.550 0.000 0.876 LEV 0.302 0.019** 0.281 0.325 -0.186 0.452 0.188 0.376 AGE 0.005 0.155 0.012 0.128 -0.004 0.530 -0.001 0.808 TENU -0.001 0.825 0.000 0.999 0.001 0.909 0.000 0.943 CEOSHARE -0.151 0.845 3.377 0.047** 0.612 0.682 0.555 0.664 CEODUAL 0.158 0.000*** 0.132 0.197 0.107 0.222 0.183 0.014** OUTDIR -0.043 0.890 -0.515 0.480 0.467 0.444 0.318 0.540 BSIZE 0.012 0.151 0.011 0.586 -0.017 0.308 0.005 0.712 BMEET -0.007 0.159 -0.022 0.072* -0.017 0.080* -0.026 0.001*** BAGE 0.477 0.008*** 0.218 0.598 0.601 0.085* 0.471 0.115 BTENURE -0.262 0.013** -0.248 0.308 -0.179 0.386 -0.331 0.059* BBUSY 0.051 0.878 -0.519 0.476 -0.231 0.722 -0.574 0.293
0.2542 0.2108 0.1331 0.1753This table presents the estimated coefficients and t-statistics of the regression where the CEO pay (salary, bonus, equity and total compensation) is the dependent variable. All of the remaining variables are as defined in Table 4. Industry fixed effects (INDDUMMY) are based on two-digit SIC and included. is also indicated. Statistical significance at the 10%, 5%, and 1% levels (two-sided) is denoted by *, **, and ***, respectively.

38
Table 10 Impact of COMPFEE, OTHERSERVICE, OTHERFEE, FEERATIO on CEO’s
PAY-PERFORMANCE-SENSITIVITY (PPS)
Intercept -64.587 0.615 -57.612 0.658 -92.406 0.475 -68.653 0.599 COMPFEE 0.000 0.001***
-30.115 0.078* OTHERFEE 0.000 0.004***
-0.230 0.620 ROA -90.542 0.321 -85.029 0.356 -84.299 0.357 -84.788 0.360 RETURN 7.441 0.573 9.686 0.468 9.884 0.456 9.839 0.463 SIZE -11.037 0.101* -12.781 0.060* -11.444 0.090* -12.905 0.058* MTB -0.075 0.831 -0.056 0.873 -0.081 0.818 -0.049 0.890 LEV -13.365 0.783 -22.789 0.642 -10.425 0.831 -21.325 0.665 AGE 2.555 0.050** 2.415 0.067* 2.518 0.055* 2.459 0.064* TENU -0.712 0.643 -0.463 0.765 -0.609 0.693 -0.490 0.753 CEOSHARE -16.330 0.955 -37.148 0.900 -20.982 0.943 -7.505 0.980 CEODUAL -5.785 0.733 -4.864 0.777 -2.949 0.863 -6.913 0.688 OUTDIR 98.654 0.407 54.757 0.648 64.735 0.586 62.468 0.604 BSIZE -0.203 0.950 0.970 0.768 1.028 0.752 0.619 0.852 BMEET 0.005 0.998 -0.030 0.987 0.154 0.933 0.173 0.926 BAGE -164.449 0.016** -171.309 0.013** -169.396 0.014** -163.210 0.019** BTENURE 21.823 0.585 20.673 0.609 24.421 0.543 20.210 0.619 BBUSY 41.356 0.740 88.958 0.481 84.253 0.500 75.079 0.553
0.0253 0.0030 0.0168 0.0363
This table presents the estimated coefficients and t-statistics of the regression where the where the CEO
is the dependent variable. All of the remaining variables are as defined in Table 4. Industry fixed effects (INDDUMMY) are based on two-digit SIC and included. is also indicated. Statistical significance at the 10%, 5%, and 1% levels (two-sided) is denoted by *, **, and ***, respectively.

39
Table 11 Impact of COMPFEE, OTHERSERVICE, OTHERFEE, FEERATIO on CEO’s
PAY-PERFORMANCE-SENSITIVITY (PPS)
Intercept 374.425 0.625 453.093 0.555 237.078 0.757 370.798 0.631 COMPFEE -0.002 0.005***
-256.411 0.011*** OTHERFEE 0.000 0.011***
-2.873 0.297 ROA -695.433 0.200 -667.352 0.220 -662.664 0.223 -661.092 0.228 RETURN 71.788 0.362 82.387 0.296 83.825 0.287 83.962 0.290 SIZE -69.611 0.082* -77.180 0.054* -71.060 0.077* -77.715 0.054* MTB 0.169 0.935 0.218 0.917 0.128 0.951 0.264 0.900 LEV -52.796 0.855 -102.569 0.723 -36.964 0.899 -91.029 0.755 AGE 6.427 0.407 5.462 0.482 6.211 0.424 5.659 0.470 TENU -16.232 0.076* -14.921 0.103* -15.718 0.086* -15.102 0.102* CEOSHARE 363.239 0.834 134.001 0.939 331.396 0.849 362.076 0.836 CEODUAL 5.231 0.959 18.658 0.854 20.109 0.843 2.294 0.982 OUTDIR 261.342 0.712 10.409 0.988 92.980 0.895 63.966 0.928 BSIZE -13.324 0.491 -5.741 0.767 -7.121 0.713 -8.115 0.678 BMEET 2.141 0.844 1.111 0.919 2.695 0.804 2.536 0.817 BAGE -410.772 0.310 -469.196 0.248 -431.217 0.288 -389.611 0.340 BTENURE 335.007 0.159 332.863 0.163 345.937 0.147 327.279 0.173 BBUSY 340.022 0.647 641.768 0.388 560.188 0.450 550.014 0.463
0.0133 0.0096 0.0096 0.0361
This table presents the estimated coefficients and t-statistics of the regression where the CEO is the dependent variable. All of the remaining
variables are as defined in Table 4. Industry fixed effects (INDDUMMY) are based on two-digit SIC and included. is also indicated. Statistical significance at the 10%, 5%, and 1% levels (two-sided) is denoted by
*, **, and ***, respectively.


![CEO pay Q[1] · When an owner that controls the firm serves also as its CEO, this owner-CEO can pay himself inflated unjustified pay. Any such excessive compensation to the owner](https://img.dokumen.tips/doc/110x75/5ec229311ed38d58ed33ab2c/ceo-pay-q1-when-an-owner-that-controls-the-firm-serves-also-as-its-ceo-this-owner-ceo.jpg)