Embed Size (px)
Citation preview

1 | CEO PAY IN ASX200 COMPANIES: JULY 2018
CEO Pay in ASX200 Companies
ACSI Annual Survey of S&P/ASX200
Chief Executive Remuneration July 2018
This survey was commissioned by the Australian Council of Superannuation Investors and conducted by Ownership Matters.
A u s t r a l i a n C o u n c i l o f S u p e r a n n u a t i o n I n v e s t o r s

2 | CEO PAY IN ASX200 COMPANIES: JULY 2018
ABOUT ACSI
Established in 2001, ACSI provides a strong, collective voice on environmental, social and governance (ESG) issues on
behalf of our members.
Our members include 38 Australian and international asset owners and institutional investors. Collectively, they manage
over $2.2 trillion in assets and own on average 10 per cent of every ASX200 company. Our members believe that ESG risks
and opportunities have a material impact on investment outcomes. As fiduciary investors, they have a responsibility to act to
enhance the long-term value of the savings entrusted to them.
Through ACSI, our members collaborate to achieve genuine, measurable and permanent improvements in the ESG
practices and performance of the companies they invest in. We undertake a year-round program of research,
engagement, advocacy and voting advice. These activities provide a solid basis for our members to exercise their
ownership rights.
We also offer additional consulting services including: ESG and related policy development; analysis of service providers, fund
managers and ESG data; and disclosure advice.
ABOUT OWNERSHIP MATTERS
Ownership Matters is an Australian governance advisory firm. Its principals have collective experience of more than 40
years in advising institutional investors on governance issues at ASX listed companies.
Ownership Matters Pty Ltd, Level 5, 167 Queen Street, Melbourne VIC 3000, P: (03) 9602 4548,
www.ownershipmatters.com.au
6 INTERNATIONAL
MEMBERS
32 AUSTRALIAN
MEMBERS

CEO PAY IN ASX200 COMPANIES: JULY 2018 | 3
FOREWORD
CEO PAY UP AS BUSINESS TRUST DECLINES
For the best part of a decade, chief executive remuneration has remained broadly static. Under pressure from investors,
boards have kept a tight rein on CEO pay – until recently. This year’s study reveals that in the 2017 financial year, CEO
pay increased significantly, reaching levels not seen since the lead up to the GFC.
Strong capital markets contributed to the increase – several CEOs benefited handsomely from the value of equity awards
– but share price increases were not solely responsible.
Another culprit is persistent and increasing bonus payments. Both the average and median total bonuses to ASX100 CEOs
were the highest recorded since ACSI began collecting this data in 2011. Not only that, but bonuses paid continue to be
near the top end of their maximum potential. Ironically, a CEO is now more likely to lose their job than their bonus.
The increase in pay levels for CEOs occurs at a time when public trust in business is at a low ebb, and wages growth in the
broader economy can best be described as anaemic. Against this background, decisions to significantly increase bonuses
appear not only tone-deaf but also make me wonder whether boards have lost sight of the link between community and
investor expectations, and a company’s social licence to operate.
This may have the consequence of further damaging community perceptions of business. We see a real prospect of
regulatory intervention if the current trend continues.
In light of the results of this year’s survey, we will be looking closely at bonus outcomes in the upcoming reporting season.
If the rationales for bonuses are not transparent, and their magnitude doesn’t reflect performance, we will be
recommending that our members vote against remuneration reports at those companies.
Louise Davidson
Chief Executive Officer

4 | CEO PAY IN ASX200 COMPANIES: JULY 2018
TABLE OF CONTENTS
ABOUT ACSI ................................................................................................................................................................................................... 2
FOREWORD ................................................................................................................................................................................................... 3
TABLE OF CONTENTS ................................................................................................................................................................................. 4
EXECUTIVE SUMMARY ............................................................................................................................................................................... 5
METHODOLOGY .......................................................................................................................................................................................... 7
REALISED and REPORTED PAY: ASX100 ................................................................................................................................................ 9
REALISED and REPORTED PAY: ASX101-200 ..................................................................................................................................... 14
CEO FIXED PAY IN FY17 ........................................................................................................................................................................... 18
CEO BONUSES IN FY17 ............................................................................................................................................................................ 21
CEO CASH PAY ............................................................................................................................................................................................ 26
TERMINATION PAYMENTS ..................................................................................................................................................................... 29
APPENDIX A: FIXED PAY DATA FOR ASX100 .................................................................................................................................... 31
APPENDIX B: CASH BONUS DATA FOR ASX100............................................................................................................................... 32
APPENDIX C: CASH PAY DATA FOR ASX100 ..................................................................................................................................... 33
APPENDIX D: REPORTED PAY DATA FOR ASX100 .......................................................................................................................... 34

CEO PAY IN ASX200 COMPANIES: JULY 2018 | 5
EXECUTIVE SUMMARY
ACSI’s 17th annual survey of chief executive remuneration in ASX200 companies reveals that CEO pay is on the rise, with
average realised pay outcomes reaching their highest level in four years. This uplift correlates with strong equity market
performance.
Across the sample, bonus persistence was strikingly apparent – most ASX100 CEOs received a bonus at a significant
proportion of their maximum entitlement – and its quantum increased. Bonuses for ASX101-200 CEOs were smaller, and
harder to get, but still exhibit remarkable consistency for an ‘at risk’ payment. This survey includes data covering 84
ASX100 CEOs, and a further 77 ASX101-200 CEOs.
BONUSES CONTINUE TO RESEMBLE VARIABLE FIXED PAY
▪ Bonuses remain consistent for the ASX100. Close to 1 in 3 ASX100 CEOs received 80 per cent (or more) of their
maximum bonus during the period.
▪ ASX100 CEOs are more likely to lose their job than their bonus. In FY17, 74 of the 80 CEOs eligible for a bonus
received one, and the median outcome was 70.5% of maximum (FY16: 68.6%). There were 10 Top 100 CEOs who
departed their roles in FY17.
▪ Median bonus awards on the rise. The median bonus awarded for an ASX100 CEO was up nearly 20 per cent to
$1.76m, the highest ever recorded in our survey, while the median cash bonus also rose by 8.7 per cent to $1.11m.
▪ Bonuses remained slightly harder to achieve for ASX101-200 CEOs, being paid to only 63 of the 72 eligible CEOs.
The median bonus (as a proportion of maximum) was awarded at 69 per cent (FY16: 74.5 per cent).
REALISED PAY AT RECORD HIGHS
▪ Median realised pay for an ASX100 CEO rose 12.4 per cent to $4.36m. Realised pay for both ASX100 and ASX101-
200 CEOs was the highest in the four years that we have reported this data. The average for the ASX100 rose 9.3
per cent to $6.23m - the first time it has been above $5.7m.
▪ For ASX101-200 CEOs, median realised pay rose 22.1 per cent to $1.76m, narrowly surpassing the prior high of
FY14 ($1.74m). Average realised pay rose a comparatively modest 11.8 per cent to $2.26m (the FY14 average
remains the highest at $2.30m).
Table 1: 10 highest-paid ASX100 CEOs on a realised pay basis in FY17
Rank CEO Company Realised pay
1 Don Meij Domino’s Pizza Enterprises $36,837,702
2 Peter & Steven Lowy Westfield Corp. $25,906,960
3 Nicholas Moore Macquarie Group $25,191,040
4 Chris Rex Ramsay Health Care $22,308,656
5 Louis Gries James Hardie Industries $18,030,451
6 Andrew Bassat Seek $14,123,802
7 Ron Delia Amcor $12,208,088
8 Alan Joyce Qantas Airways $11,247,850
9 Colin Goldschmidt Sonic Healthcare $10,616,531
10 Mike Kane Boral $9,826,935
6 | CEO PAY IN ASX200 COMPANIES: JULY 2018
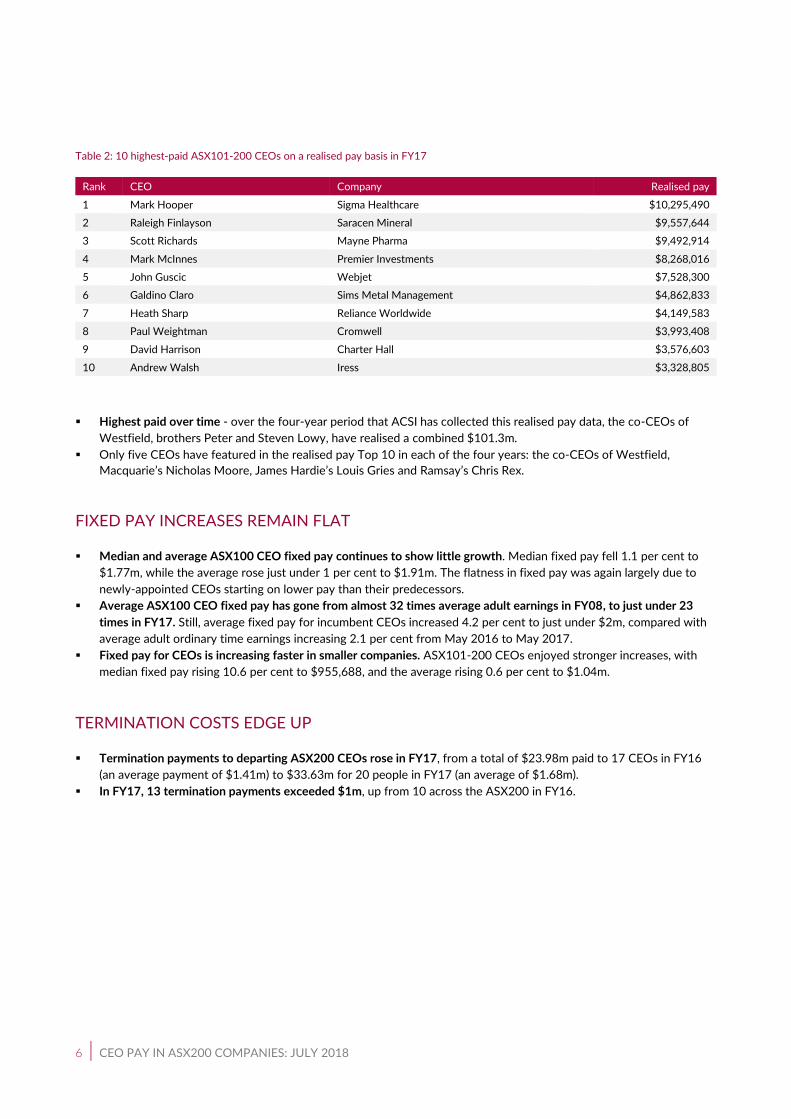
Table 2: 10 highest-paid ASX101-200 CEOs on a realised pay basis in FY17
Rank CEO Company Realised pay
1 Mark Hooper Sigma Healthcare $10,295,490
2 Raleigh Finlayson Saracen Mineral $9,557,644
3 Scott Richards Mayne Pharma $9,492,914
4 Mark McInnes Premier Investments $8,268,016
5 John Guscic Webjet $7,528,300
6 Galdino Claro Sims Metal Management $4,862,833
7 Heath Sharp Reliance Worldwide $4,149,583
8 Paul Weightman Cromwell $3,993,408
9 David Harrison Charter Hall $3,576,603
10 Andrew Walsh Iress $3,328,805
▪ Highest paid over time - over the four-year period that ACSI has collected this realised pay data, the co-CEOs of
Westfield, brothers Peter and Steven Lowy, have realised a combined $101.3m.
▪ Only five CEOs have featured in the realised pay Top 10 in each of the four years: the co-CEOs of Westfield,
Macquarie’s Nicholas Moore, James Hardie’s Louis Gries and Ramsay’s Chris Rex.
FIXED PAY INCREASES REMAIN FLAT
▪ Median and average ASX100 CEO fixed pay continues to show little growth. Median fixed pay fell 1.1 per cent to
$1.77m, while the average rose just under 1 per cent to $1.91m. The flatness in fixed pay was again largely due to
newly-appointed CEOs starting on lower pay than their predecessors.
▪ Average ASX100 CEO fixed pay has gone from almost 32 times average adult earnings in FY08, to just under 23
times in FY17. Still, average fixed pay for incumbent CEOs increased 4.2 per cent to just under $2m, compared with
average adult ordinary time earnings increasing 2.1 per cent from May 2016 to May 2017.
▪ Fixed pay for CEOs is increasing faster in smaller companies. ASX101-200 CEOs enjoyed stronger increases, with
median fixed pay rising 10.6 per cent to $955,688, and the average rising 0.6 per cent to $1.04m.
TERMINATION COSTS EDGE UP
▪ Termination payments to departing ASX200 CEOs rose in FY17, from a total of $23.98m paid to 17 CEOs in FY16
(an average payment of $1.41m) to $33.63m for 20 people in FY17 (an average of $1.68m).
▪ In FY17, 13 termination payments exceeded $1m, up from 10 across the ASX200 in FY16.

CEO PAY IN ASX200 COMPANIES: JULY 2018 | 7
METHODOLOGY
This survey includes CEO pay for all companies in the ASX200 for the 2017 financial year (FY17). The relevant date range
covers 31 January 2017 (for Sigma Healthcare) to 31 December 2017.
Our longitudinal survey of ASX100 CEO pay started in 2001. We now have 17 years of data for this cohort, and seven
years of data for ASX101-200 CEOs.
Our 2017 survey included 84 ASX100 CEOs (FY16: 83) and, as in FY16, 77 ASX101-200 CEOs. We also included a sub-
set of data for incumbent CEOs – those included in their respective cohort (either ASX100 or ASX101-200) in both years.
In FY17, there were 68 incumbent ASX100 CEOs (FY16: 71) and 57 incumbent ASX101-200 CEOs (FY16: 42).
As usual, not all ASX200 CEOs are included in our survey, because:
▪ Some CEOs were appointed mid-way through the financial year and their disclosed remuneration was for less than
12 months. We removed these individuals to avoid distorting total pay figures.
▪ A small number of entities in the ASX200 were externally managed at the census date (such as Macquarie Atlas
Roads, Charter Hall REIT and Investa Office Fund). The executives of these entities do not have their pay disclosed as
they are employed by the external manager.
▪ Companies domiciled outside of Australia and subject to different remuneration disclosure requirements such as
Janus Henderson, Fisher & Paykel Healthcare and News Corporation were also excluded. As in past years, entities
such as James Hardie (domiciled in Ireland) and Oil Search (domiciled in Papua New Guinea) are included, as they
disclose remuneration on the same basis as Australian companies, as are entities such as APA Group, Spark
Infrastructure and Dexus Property Group (internally managed Australian trusts).
All pay figures in this survey are given in Australian dollars (AUD) and have been sourced from the relevant company’s
annual report. If the listed entity disclosed pay in another currency (in all cases the alternative currency was United States
dollars, USD), these figures have been converted into AUD using the average exchange rate for the relevant financial year
or, in some cases, the AUD figures provided as supplementary disclosure by the company. In the case of Westfield
Corporation which has co-CEOs, the combined pay of the joint CEOs has been included in the survey.
This survey refers to ‘CEO pay’, although for some companies the executive whose pay is included did not hold the formal
title of CEO. This could occur because the company has an executive chair and a separate CEO, and the executive chair is
the effective leader of the company’s management. For example, Harvey Norman's executive chair, Gerry Harvey, is
treated as CEO for the purposes of this survey, despite his wife, Katie Page, holding the CEO title and being paid
substantially more.
We continue to include realised-pay data for all ASX200 CEOs. Realised pay is calculated on a ‘cash pay’ basis –
essentially, reported pay excluding share-based payments expense – but including the value of any equity that vested
during the year, using disclosures from annual reports and ‘Change of director-interest’ notices. The value of options with
an exercise price is assessed when they are exercised, rather than when they vest. The value of zero exercise price
options (ZEPOs) is assessed on vesting.

8 | CEO PAY IN ASX200 COMPANIES: JULY 2018
To illustrate, Table 3 shows how realised pay for FY17 was calculated for Domino’s CEO, Don Meij while Table 4 shows
the same calculation for Sigma’s Mark Hooper
Table 3: FY17 reported to realised pay reconciliation for Domino’s CEO Don Meij
FY17 pay Reference
A - Reported pay $4,662,752 2017 annual report, p.29
B - Less share-based payments expense ($3,567,050) As above
C - Plus value of options exercised during FY17 $35,742,000 2017 annual report, p.33
Total realised pay $36,837,702 A – B + C
Table 4: FY17 reported to realised pay reconciliation for Sigma Healthcare CEO Mark Hooper
FY17 pay Reference
A - Reported pay $3,326,572 2017 annual report, p.16
B - Less share-based payments expense ($947,101) As above
C - Plus value of loan-funded shares exercised during FY17 $7,641,787 Change of director’s interest notices, 23 January 2017 and 22 June 2016
D – Plus value of deferred bonus ZEPOs vesting during FY17 $277,598 Change of director’s interest notice, 29 March 2016
Total realised pay $10,295,490 A – B + C + D
The 2017 financial year was the second consecutive year that both Meij and Hooper have featured among the highest
paid Top 100 and 101-200 CEOs. Meij’s realised pay ranked him third in the 2016 sample, while Hooper’s realised pay
ranked him 15th in the ASX101-200 cohort. Realised pay does not necessarily, however, reflect cash proceeds to an
executive depending on whether they retain or sell shares received on vesting of incentives.
In the case of Meij, for example, from the start of FY17 to February 2018 he acquired 900,000 shares on the exercise of
options but held fewer shares as at February 2018 than he did at the start of FY17, with his holding declining from 2.13m
shares to 1.84m.1 Over this period, Meij paid $15.81m to exercise his options, and sold shares worth in total $53.11m to
fund option exercises, tax liabilities from his options and a divorce settlement.2
1 Domino’s Pizza Enterprises, Change of director interest notices, 22 August 2016 and 22 February 2018. 2 Domino’s Pizza Enterprises, Change of director interest notices, 22 August 2016, 25 August 2016, 2 September 2016, 7 September 2017 and 22 February 2018. Based on the gain at the time of exercise, Meij’s tax bill for options exercised in FY16 and FY17 would have been approx. $26.9m.

CEO PAY IN ASX200 COMPANIES: JULY 2018 | 9
REALISED AND REPORTED PAY: ASX100
In FY17, average realised pay was again higher than the average pay disclosed for ASX100 CEOs, as calculated under
regulatory requirements. The average Top 100 CEO’s realised pay in FY17 was $6.23m, the highest in the four years this
data has been collected (the median was also the highest recorded) and 11.9 per cent higher than reported pay (in FY16
the gap was 10.3 per cent). Median realised pay was, as in prior years, lower than median reported pay at $4.36m,
compared to $4.73m. FY17 was the first year where either median or average realised pay data has moved significantly
over the prior year (see Table 5).
Table 5: Realised pay for ASX100 CEOs
FY17 FY16 FY15 FY14
Median realised $4,361,201 $3,878,990 $3,880,672 $3,958,000
Average realised $6,226,213 $5,695,184 $5,542,509 $5,610,057
Highest $36,837,702 $26,255,778 $24,753,949 $30,796,223
Lowest $646,396 $637,100 $518,238 $657,073
Median incumbent $4,634,108 $4,021,013
Average incumbent $6,813,133 $6,009,068
Calculating realised pay results in a small number of executives with very high pay, in cases where share prices have
increased substantially, and these few distort the averages. In the Top 100 cohort for FY17, for example, there are four
CEOs with realised pay above $20m while, in the statutory group, only two CEOs have pay in excess of $20m.
Reported pay removes the impact of increasing share prices, because of the way equity incentives are disclosed under
accounting rules.3.
Table 6: Reported pay for ASX100 CEOs4
FY17 FY16 FY12 FY07 One-year change
Five-year p.a. change
10-year p.a. change
Median $4,728,890 $4,196,435 $3,985,254 $4,168,554 12.7% 3.5% 1.3%
Average $5,544,2845 $5,164,722 $4,705,093 $5,540,815 7.3% 3.3% 0.0%
Highest $23,566,967 $21,572,743 $21,105,291 $33,489,818
Lowest $646,396 $637,100 $540,791 $404,062
Median incumbent $5,109,714 $4,685,302
Average incumbent $5,992,133 $5,421,724
3 The Australian Accounting Standards Board’s AASB2 apportions the value of executive equity allocations over several years, with equity values calculated at the date of grant. See: http://www.aasb.gov.au/Pronouncements/Current-standards.aspx. 4 Full data on reported outcomes over the period 2001 to 2017 is available in Appendix D. 5 The FY17 statutory average includes the acceleration of expensing of equity incentives retained by Ramsay’s Chris Rex on his retirement at the end of FY17. If this $8.556m is excluded the statutory average falls to $5,442,429, below the 2007 record.

10 | CEO PAY IN ASX200 COMPANIES: JULY 2018
This also removes the impact, in many cases, of equity incentives not vesting. Of the 84 CEOs in the Top 100 sample,
there are 15 who received no value from equity vesting in FY17, while only two CEOs in the sample had no equity value
under statutory disclosure requirements. Another CEO, QBE’s John Neal, had a negative equity incentive value because
previously accrued expenses, relating to incentives subject to accounting hurdles, were reversed as it became clear that
the hurdles would not be achieved.6
Realised and reported pay, however, both increased in FY17, despite the differences in how they are calculated. Average
reported pay in FY17 rose more than 7 per cent to the highest level ever recorded in our survey (just surpassing the prior
record of FY07), while the median was behind only FY10 and FY11 (the FY11 median of $4.52m remains the highest in
the history of our survey).
Table 7: 10 highest-paid ASX100 CEOs on a realised pay basis in FY17
Rank CEO Company Realised pay (FY16 rank) Reported pay (FY17 rank)
1 Don Meij Domino’s Pizza Enterprises $36,837,702 (3) $4,662,752 (43)
2 Peter & Steven Lowy Westfield Corp. $25,906,9607 (1) $21,401,953 (2)
3 Nicholas Moore Macquarie Group $25,191,0408 (2) $18,713,836 (3)
4 Chris Rex Ramsay Health Care $22,308,6569 (5) $23,566,967 (1)
5 Louis Gries James Hardie Industries $18,030,45110 (4) $13,299,136 (4)
6 Andrew Bassat Seek $14,123,80211 (56) $5,091,275 (40)
7 Ron Delia Amcor $12,208,08812 (7) $8,016,047 (13)
8 Alan Joyce Qantas Airways $11,247,85013 (6) $7,949,000 (14)
9 Colin Goldschmidt Sonic Healthcare $10,616,53114 (27) $5,914,821 (26)
10 Mike Kane Boral $9,826,93515 (13) $6,100,900 (25)
The highest realised pay outcomes for ASX100 CEOs were again significantly higher than reported pay outcomes. The
highest-paid CEO in the sample was Domino’s Don Meij whose realised pay of $36.84m was almost eight times his statutory
pay, and well above his FY16 realised pay of $21.03m. As in FY17, Meij’s high pay was due to the rapid increase in Domino’s
share price above the exercise price of options granted as an equity incentive.
Of the FY17 Top 10, six others aside from Meij were in the FY16 Top 10, and four were also members of the 2017 Top
10 on a reported pay basis. The Lowy brothers were again part of both Top 10s (as they were in FY16, FY15 and FY14)
and even on an individual basis would have been ranked seventh and eighth in the realised pay Top 10 and included in the
reported pay Top 10.
The other repeat entrants were Macquarie’s Nicholas Moore, Ramsay’s Chris Rex, James Hardie’s Louis Gries, Amcor’s
Ron Delia and Qantas’s Alan Joyce. In the case of Joyce, his inclusion again reflected a significant improvement in
Qantas’s share price over the period equity incentives were assessed. For all others, their repeat inclusion was at least in
part due to very high pay levels coupled with strong share-price performance.
6 QBE Insurance Group Limited, 2017 Annual report, p.80. 7 Westfield Corporation Limited, 2017 Annual Report, pp.30-31. 8 Macquarie Group Limited, 2017 Annual Report, p.79; 2013 Annual Report, pp.70-71; 2011 Annual Report, pp.112-113; 2010 Annual Report, pp.110-111; Change of director’s interest notice, 10 June 2016. 9 Ramsay Health Care Limited, 2017 Annual Report, p.65. 10 James Hardie Industries plc, 2017 Remuneration Report, p.20; Change of director’s interest notice, 22 September 2016. 11 Qantas Airways Limited, 2016 Annual Report, p. 36; Change of director’s interest notice, 21 August 2015. 12 Amcor Limited, Change of director’s interest notices, 1 September 2016 and 20 December 2016. 13 Qantas Airways Limited, Change of director’s interest notice, 2 September 2016. 14 Sonic Healthcare Limited, Change of director’s interest notices, 2 September 2016 and 18 November 2016. 15 Boral Limited, 2017 Annual Report, p.68.
CEO PAY IN ASX200 COMPANIES: JULY 2018 | 11
The members of the FY17 Top 10 who were not part of the FY16 Top 10 included Seek’s Andrew Bassat, who reaped
$10.48m on the exercise of options in FY17. Similar benefits, from a rapid increase in share price over the life of an option
grant, saw Bassat included in the FY15 and FY14 Top 10s. The other two new members were Sonic’s Colin Goldschmidt,
who harvested the benefit of an increase in share price over the life of an option grant (Sonic’s share price doubled over
the life of the option) and Boral’s Mike Kane, who had long-term incentives vest in substantial numbers.
Every CEO in the Top 10, on a realised pay basis, owed their inclusion to large values of equity vesting during FY17.
However, with the exception of Domino’s Meij and Bassat’s Seek all also received at least $4m in cash pay during FY17 –
with Goldschmidt, Delia and the Lowy brothers each receiving more than $5m in cash, or cash equivalent, benefits. These
cash pay levels illustrate that high CEO pay outcomes, even where much of the benefit has been due to equity incentives
vesting, are largely driven by board decisions about pay levels and the level of bonuses to award.
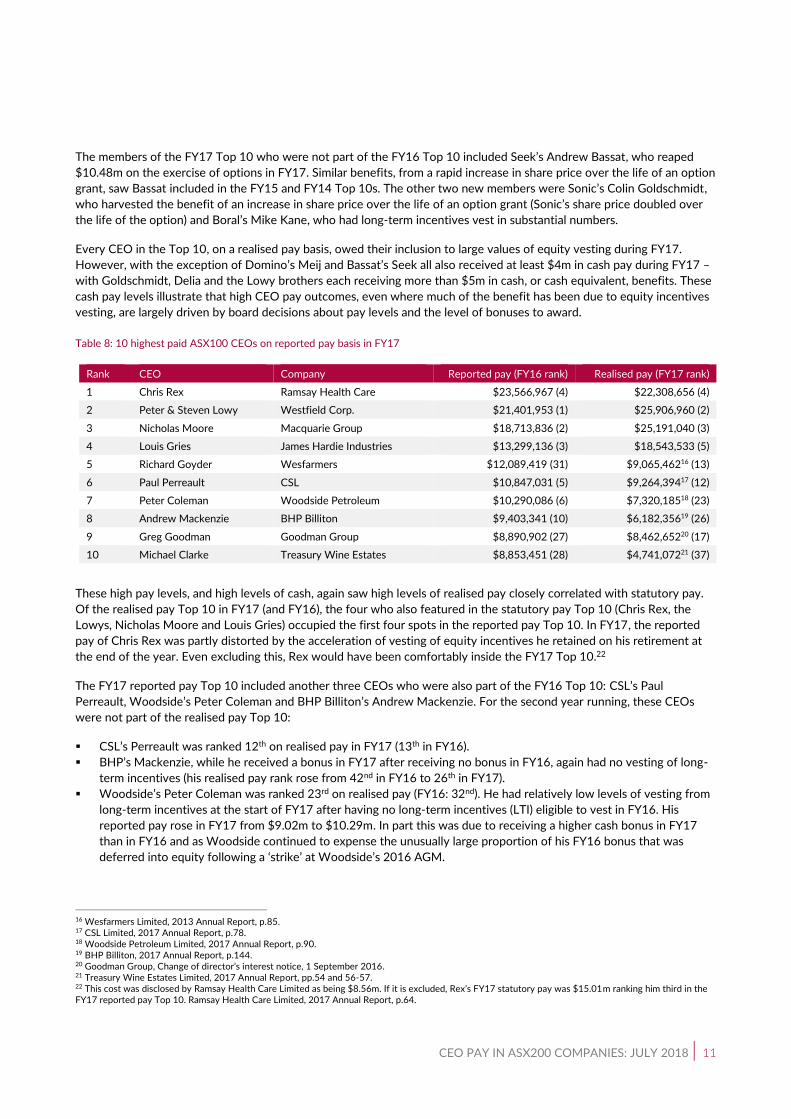
Table 8: 10 highest paid ASX100 CEOs on reported pay basis in FY17
Rank CEO Company Reported pay (FY16 rank) Realised pay (FY17 rank)
1 Chris Rex Ramsay Health Care $23,566,967 (4) $22,308,656 (4)
2 Peter & Steven Lowy Westfield Corp. $21,401,953 (1) $25,906,960 (2)
3 Nicholas Moore Macquarie Group $18,713,836 (2) $25,191,040 (3)
4 Louis Gries James Hardie Industries $13,299,136 (3) $18,543,533 (5)
5 Richard Goyder Wesfarmers $12,089,419 (31) $9,065,46216 (13)
6 Paul Perreault CSL $10,847,031 (5) $9,264,39417 (12)
7 Peter Coleman Woodside Petroleum $10,290,086 (6) $7,320,18518 (23)
8 Andrew Mackenzie BHP Billiton $9,403,341 (10) $6,182,35619 (26)
9 Greg Goodman Goodman Group $8,890,902 (27) $8,462,65220 (17)
10 Michael Clarke Treasury Wine Estates $8,853,451 (28) $4,741,07221 (37)
These high pay levels, and high levels of cash, again saw high levels of realised pay closely correlated with statutory pay.
Of the realised pay Top 10 in FY17 (and FY16), the four who also featured in the statutory pay Top 10 (Chris Rex, the
Lowys, Nicholas Moore and Louis Gries) occupied the first four spots in the reported pay Top 10. In FY17, the reported
pay of Chris Rex was partly distorted by the acceleration of vesting of equity incentives he retained on his retirement at
the end of the year. Even excluding this, Rex would have been comfortably inside the FY17 Top 10.22
The FY17 reported pay Top 10 included another three CEOs who were also part of the FY16 Top 10: CSL’s Paul
Perreault, Woodside’s Peter Coleman and BHP Billiton’s Andrew Mackenzie. For the second year running, these CEOs
were not part of the realised pay Top 10:
▪ CSL’s Perreault was ranked 12th on realised pay in FY17 (13th in FY16).
▪ BHP’s Mackenzie, while he received a bonus in FY17 after receiving no bonus in FY16, again had no vesting of long-
term incentives (his realised pay rank rose from 42nd in FY16 to 26th in FY17).
▪ Woodside’s Peter Coleman was ranked 23rd on realised pay (FY16: 32nd). He had relatively low levels of vesting from
long-term incentives at the start of FY17 after having no long-term incentives (LTI) eligible to vest in FY16. His
reported pay rose in FY17 from $9.02m to $10.29m. In part this was due to receiving a higher cash bonus in FY17
than in FY16 and as Woodside continued to expense the unusually large proportion of his FY16 bonus that was
deferred into equity following a ‘strike’ at Woodside’s 2016 AGM.
16 Wesfarmers Limited, 2013 Annual Report, p.85. 17 CSL Limited, 2017 Annual Report, p.78. 18 Woodside Petroleum Limited, 2017 Annual Report, p.90. 19 BHP Billiton, 2017 Annual Report, p.144. 20 Goodman Group, Change of director’s interest notice, 1 September 2016. 21 Treasury Wine Estates Limited, 2017 Annual Report, pp.54 and 56-57. 22 This cost was disclosed by Ramsay Health Care Limited as being $8.56m. If it is excluded, Rex’s FY17 statutory pay was $15.01m ranking him third in the FY17 reported pay Top 10. Ramsay Health Care Limited, 2017 Annual Report, p.64.

12 | CEO PAY IN ASX200 COMPANIES: JULY 2018
There were three CEOs in the reported pay Top 10 who were not part of the FY16 reported pay Top 10 or the realised
pay Top 10 in FY17. They were:
• Wesfarmers’ long-serving CEO Richard Goyder, whose FY17 pay was distorted by his announced retirement date in
November 2017. This required Wesfarmers to accelerate expensing of equity incentives he retained after his
retirement. Even allowing for this, Goyder’s high fixed pay of $3.69m and the board’s decision to award him almost
maximum bonus for FY17 and pay the entire $4.07m in cash, meant he ranked 13th on realised pay.
• Goodman Group founder and CEO, Greg Goodman, who was ranked 17th on realised pay. The high and rising
statutory pay for Goodman reflects increasing allocations of equity incentives from FY16 onwards. If these incentives
vest, as is likely given the frequency with which Goodman Group achieves its earnings incentive targets, then
Goodman will climb higher in the realised pay rankings.23
• The CEO of Treasury Wine since 2014, Michael Clarke. His inclusion in the Top 10, for the first time, reflects a
significant increase in salary and bonus potential in FY17, another year of maximum bonus and the expensing of large
equity incentive allocations. The first LTI allocation for Clarke vested after the end of FY17 (in August 2017) and saw
him receive shares worth $10.76m on that date.24
FY17 was a rarity in the history of our longitudinal survey, in that no ‘Big Four’ bank CEO featured in the Top 10 reported
or realised pay groups – reflecting the gradual reduction in bank-CEO pay. This has occurred as incumbent CEOs have
been replaced with lower-paid successors or, in the case of CBA, the unprecedented decision by the board to pay no
bonuses to senior executives for FY17 in the wake of action against the bank by Austrac. The bank CEO included last year
was CBA’s Ian Narev, who received no bonus and much lower vesting of LTIs, and so fell out of both Top 10 groups in
FY17. Incidentally, Narev was the only CEO to feature in both the reported and realised Top 10s in FY16 not to feature in
both in FY17.
The highest-ranking bank CEO in FY17 was Westpac’s Brian Hartzer, at 20th on reported pay with $6.68m and 33rd on
realised pay with $5.28m. Hartzer owed his inclusion to having the highest fixed pay and, so, bonus potential of any bank
CEO.25 The other Big Four CEOs’ rankings on reported pay were 21st (NAB’s Andrew Thorburn), 30th (Narev) and 31st
(ANZ’s Shayne Elliott). No other Big Four CEO other than Hartzer ranked above median on realised pay (ANZ’s Elliott
ranked 44th, Narev 45th and NAB’s Thorburn 48th). For the life of our survey there has been at least one, and usually two
or more, Big Four CEOs in the Top 10 CEOs.
Outside of Narev, the two CEOs who were in the reported Top 10 in FY16, but not FY17, were Qantas’s Alan Joyce,
whose statutory pay ranked him 13th in FY17, and Asciano’s John Mullen (Asciano was acquired early in FY18).
Bluescope’s Paul O’Malley, a CEO never included in the realised pay Top 10, would likely have been in FY18 but for his
retirement as of 31 December 2017. His realised pay for FY17 was $5.37m but, in September 2017, O’Malley had equity
vest worth $22.3m. This related to full vesting under ‘transformation’ incentive arrangements Bluescope put in place for
FY16 and FY17 when the CEO’s annual bonus was converted into a two-year incentive delivered entirely in equity, as
well as substantial vesting of long-term incentives.26 The FY16-FY17 incentive allocation was worth $4.45m when it was
allocated and $14.18m when it vested.
23 Goodman Group has achieved the operating Earnings Per Share target applying to 75 per cent of equity allocations every year since FY10. Goodman Group, 2012 Annual Report, p.40; 2014 Annual Report, p.28; 2016 Annual Report, p.34; 2017 Annual Report, p.39. 24 Treasury Wine Estates Limited, Change of director’s interest notice, 25 August 2017. 25 Westpac Banking Corporation, 2017 Annual Report, p.62; 2015 Annual Report, p.69; Change of director’s interest notice, 15 December 2015. 26 Bluescope Steel Limited, 2017 Annual Report, pp.35,37-38; Change of director’s interest notice, 31 August 2016, 9 September 2016 and 13 September 2017.

CEO PAY IN ASX200 COMPANIES: JULY 2018 | 13
Four CEOs have been included in the ASX100 Top 10 realised pay list every year this data has been collected. They are
Ramsay’s Chris Rex, the Lowy brothers at Westfield, Macquarie CEO Nicholas Moore and James Hardie’s Louis Gries.
Between them, the cumulative pay of these CEOs over this four-year period is $341m.
Table 9: Aggregate realised pay FY14 – FY17 for selected ASX100 CEOs
CEO (Code) Total cash pay Total realised equity Total pay Total TSR
Peter & Steven Lowy (WFD) $53.12m $48.2m $101.32m 47.1%27
Chris Rex (RHC) $18.33m $68.21m $86.54m 116.7%
Nicholas Moore (MQG) $22.94m $54.26m28 $77.2m 171.5%
Louis Gries (JHX) $16.9m $58.99m $75.89m 149.8%
As seen in Table 9, for Rex, Gries and Moore, the clear majority of their total pay over this period has been from equity
vesting. These three CEOs each presided over total shareholder returns (TSR) over the four-year period of well over 110 per
cent. This is reflected in the very large rewards each reaped from their equity incentives. In the case of Moore and Rex, this
also led to a significant increase in their shareholdings over this period.
Even after selling 1.12m shares, Rex’s shareholding increased from 484,000 to 806,000 shares.29 In the case of Moore, his
shareholding rose from 1.436m to 2.109m shares over this period with no share sales. Meanwhile, the value of his vested
shares over this period rose from $56.5m to $190.2m.30 The only one of the three to not retain a significant proportion of
the equity that vested during the four-year period was Gries, who held less shares at the end of FY17 then he did at the
end of FY13.31
The exception among the four was the Lowy brothers. They were the only CEO of the group not to record TSR of more
than 100 per cent over the four years ending FY17. The TSR over the period for a Westfield investor was 47.1 per cent –
and the only CEO where cash pay made up more than half of total realised pay.
27 This TSR is calculated using the closing price of Westfield Group securities on 31 December 2013 and treating, as a distribution, the Scentre Group (SCG) securities received in the Westfield Group restructure at that time. The closing price on the first day of trading for SCG securities was used. 28 This includes earnings on deferred profit share paid in cash and cash vesting of deferred profit share. 29 Ramsay Health Care Limited, 2014 Annual Report, p.70; 2015 Annual Report, p.73; 2017 Annual Report, p.69. 30 Macquarie Group Limited, 2014 Annual Report, p.152; 2017 Annual Report, p.75. 31 James Hardie Industries plc, 2013 20-F, p.51; 2017 Remuneration Report, p.22. At the end of FY13, Gries held 469,000 shares and at the end of FY17, 404,000.

14 | CEO PAY IN ASX200 COMPANIES: JULY 2018
REALISED AND REPORTED PAY: ASX101-200
Strong equity market performance was reflected in sharp increases in realised pay for ASX101-200 CEOs in FY17. Average
and median realised pay increased above FY16 levels, the median by 22.1 per cent to the highest level recorded in the
four years the data has been collected, narrowly surpassing the FY14 median of $1.74m. Average realised pay increased
by 11.8 per cent to $2.26m, just below the record average in FY14.
Table 10: Realised pay for ASX101-200 CEOs
FY17 FY16 FY15 FY14
Median realised $1,754,582 $1,437,375 $1,413,322 $1,738,822
Average realised $2,262,776 $2,023,930 $1,885,457 $2,297,001
Highest $10,295,490 $11,090,136 $12,804,929 $18,028,506
Lowest $382,489 $378,581 $379,455 $357,009
Median incumbent $1,803,300 $1,395,797
Average incumbent $2,306,896 $1,842,657
The increase in realised pay levels in the ASX101-200 cohort was widespread, with 60 of the 77 CEOs in our survey
receiving realised pay of more than $1m and 32 more than $2m. By comparison, in FY16 56 of the 77 CEOs surveyed
recorded realised pay above $1m and only 20 more than $2m.
As in the Top 100, the strong increase in overall realised pay levels in FY17 was matched by increases in reported pay.
Average and median reported pay both rose more than 20 per cent in FY17. At $1.88m, median reported pay was the
highest recorded in the seven years data has been collected for ASX101-200 CEOs. At $2.17m, average reported pay was
behind only FY14 and above $2m for only the second time in seven years. There were 13 ASX101-200 CEOs with reported
pay above $3m in FY17 and only six in FY16.
There was only one ASX101-200 CEO with realised pay above $10m in FY17 – Sigma’s Mark Hooper. This compares with
two in FY16; Premier’s Mark McInnes, whose FY17 realised pay of $8.27m ranked him fourth in the ASX101-200 sample
and BT’s Emilio Gonzalez who in FY17 was part of the Top 100 sample (his FY17 realised pay of $6.10m ranked him 27th in
the Top 100 cohort).32
There were, however, another four CEOs in the ASX101-200 sample whose FY17 realised pay would have ranked them
above the third ranked CEO in FY16. Saracen’s Raleigh Finlayson, Mayne Pharma’s Scott Richards and Webjet’s John Guscic
all reaped the benefit from vesting and/or exercise of large equity allocations made when their company’s share prices were
substantially lower. In the case of Mayne’s Richards, these strong share prices proved short-lived with the company’s share
price declining 43 per cent in FY17.33
32 In April 2018 BT changed its name to Pendal. BT Investment Management Limited, 2016 Annual Report, p.68; Change of director’s interest notice, 4 November 2016. 33 Mayne Pharma Group Limited, 2017 Annual Report, pp.34-35 and 39. The share price when Richards exercised his options was $1.29, already down 32.5 per cent from the start of the year. Mayne shares closed on 14 June 2018 at $0.90.

CEO PAY IN ASX200 COMPANIES: JULY 2018 | 15
A similar situation occurred with Sigma’s Hooper who exercised his loan-funded shares at share prices well above $1.10
during 2016 and January 2017. Sigma shares have been below $1 for almost the entire period since a May 2017 profit
downgrade saw the share price fall 31 per cent in a day.34 In the cases of Richards and Hooper, both CEOs retained
significant exposure to the declining share price. Richards sold no shares in FY17 and Hooper, even after substantial share
sales in FY17, ended the year holding 8.95m shares against 3.43m shares in February 2016.35
Table 11: Average, median and outliers for ASX101-200 reported CEO pay
FY17 FY16 FY15 FY14 FY13 FY12 FY11
Median $1,875,690 $1,538,000 $1,471,321 $1,711,379 $1,582,325 $1,595,404 $1,518,654
Average $2,169,956 $1,777,343 $1,782,417 $2,341,142 $1,749,036 $1,654,603 $1,700,321
Median incumbent $1,924,554 $1,700,292
Average incumbent $2,110,307 $1,774,349
Highest $10,090,741 $6,487,392 $6,831,204 $19,588,095 $5,984,652 $4,072,000 $4,924,362
Lowest $382,489 $378,581 $379,455 -$386,999 $369,159 $448,062 $365,053
One-year change (median): 22.0% Five-year change p.a. (median): 3.3%
One-year change (average): 22.1% Five-year change p.a. (average): 5.6%
Table 12: 10 highest-paid ASX101-200 CEOs on a realised pay basis in FY17
Rank CEO Company Realised pay (FY16 rank) Reported pay (FY17 rank)
1 Mark Hooper Sigma Healthcare $10,295,490 (15) $3,323,206 (11)
2 Raleigh Finlayson Saracen Mineral $9,557,64436 (65) $2,690,132 (21)
3 Scott Richards Mayne Pharma $9,492,91437 (62) $2,809,439 (18)
4 Mark McInnes Premier Investments $8,268,01638 (1) $10,090,741 (1)
5 John Guscic Webjet $7,528,30039 (-) $1,601,479 (48)
6 Galdino Claro Sims Metal Management $4,862,83340 (-) $8,649,232 (2)
7 Heath Sharp Reliance Worldwide $4,149,58341 (-) $4,539,751 (5)
8 Paul Weightman Cromwell $3,993,40842 (13) $3,792,988 (6)
9 David Harrison Charter Hall $3,576,60343 (6) $3,426,721 (10)
10 Andrew Walsh Iress $3,328,80544 (8) $2,353,885 (27)
The ASX101-200 realised pay sample continued to exhibit more volatility than the Top 100 group. Unlike the Top 100,
where seven of the FY17 Top 10 were members of the FY16 Top 10, only three members of the FY17 ASX101-200 Top
10 were also in the FY16 group. Excluding McInnes, whose annual fixed pay of $2.5m before non-monetary benefits
ensures he will always be close to the ASX101-200 Top 10, the other repeat Top 10 members were Charter Hall’s David
Harrison who receives relatively high cash pay for an ASX101-200 CEO, while Walsh receives regular large equity
allocations subject to no hurdles other than continued service.45
34 Sigma Healthcare Limited, ASX announcement, ‘Trading Update’, 24 May 2017. After closing at $1.185 on 23 May 2017, Sigma shares subsequently closed at $0.815 on 24 May 2017. 35 Sigma Pharmaceuticals Limited, 2017 Annual Report, p.20. 36 Saracen Mineral Holdings Limited, Change of director’s interest notices, 12 August 2016, 28 October 2016 and 9 May 2017. 37 Mayne Pharma Group Limited, 2017 Annual Report, p.34. 38 Premier Investments Limited, 2017 Annual Report, p.34. 39 Webjet Limited, 2017 Annual Report, p.27. 40 Sims Metal Management Limited, 2017 Annual Report, pp.54-57. 41 Reliance Worldwide Corporation Limited, 2017 Annual Report, pp.30-31. 42 Cromwell Group, Change of director’s interest notice, 12 December 2016. 43 Charter Hall Group, 2017 Annual Report, p.17. 44 Iress Limited, 2017 Annual Report, p.30. 45 In FY17, McInnes’ non-monetary benefits cost shareholders $161,000; see Premier Investments Limited, 2017 Annual Report, p.30. In FY17, Harrison’s cash pay was $2.39m; see Charter Hall Group, 2017 Annual Report, p.28. For FY17, Walsh was allocated ZEPOs worth $500,000 subject to no hurdles other

16 | CEO PAY IN ASX200 COMPANIES: JULY 2018
New entrants included Sims Metal’s (now former) CEO Galdino Claro, who in FY16 was part of the Top 100 sample. His
inclusion owed more to his US-sized pay package, which saw him receive cash salary and bonuses for FY17 of approaching
$5m.46 Another new entrant, Reliance’s Heath Sharp, owed his inclusion to the board’s unexpected decision to pay him a
one-off cash bonus of $2.5m after listing in 2016, while Cromwell’s Paul Weightman rose from 13th in FY16 to eighth in
FY17 due to a substantial increase in his pay package after the group’s expansion into Europe. This saw his fixed pay
increase 19 per cent to $1.6m and his bonus potential double to $1.6m. The increases were despite Cromwell writing off
more than 40 per cent of the value of the European funds management business it acquired in March 2015 in FY16.47
Table 13: 10 highest-paid ASX101-200 CEOs on a reported pay basis in FY17
Rank CEO Company Reported pay (FY16 rank) Realised pay (FY17 rank)
1 Mark McInnes Premier Investments $10,090,741 (2) $8,268,016 (4)
2 Galdino Claro Sims Metal Management $8,649,232 (-) $4,862,833 (6)
3 Chris Ellison Mineral Resources $5,183,675 (8) $3,267,95948 (11)
4 Martin Sheppard Spotless $4,757,801 (-) $3,159,51649 (12)
5 Heath Sharp Reliance Worldwide $4,539,751 (-) $4,149,583 (7)
6 Paul Weightman Cromwell $3,792,988 (13) $3,993,408 (8)
7 Vik Bansal Cleanaway $3,522,825 (-) $2,316,82450 (27)
8 Ian Morrice Metcash $3,493,571 (7) $3,046,84151 (15)
9 Paul Flynn Whitehaven Coal $3,477,754 (16) $2,568,73052 (21)
10 David Harrison Charter Hall $3,426,721 (4) $3,576,603 (9)
Consistent with prior years, the reported pay Top 10 features five of the realised pay Top 101-200. The list is topped by
Premier’s McInnes – his FY17 reported pay of $10.09m would rank him sixth in the Top 100 for FY17 – and includes
Sims’ Claro, Reliance’s Sharp, Cromwell’s Weightman and Charter Hall’s Harrison. It also includes Metcash’s Ian Morrice
for the second year in a row, again reflecting the strong correlation between high cash pay and reported pay, who was
ranked 15th on realised pay for FY17, and Mineral Resources’ Chris Ellison.
The inclusion of Ellison, as in FY16, partially reflects the company’s practice of including the full value ($2.7m) of the
CEO’s FY17 equity allocation despite it vesting in future years, as well as its unusual response to a substantial vote against
its 2016 remuneration report which included increasing the CEO’s fixed pay from $950,000 to $1.5m.53 His high reported
pay as also reflected in high realised pay, ranking 11th in the ASX101-200 sample.
The reported pay Top 10 also featured several new inclusions, including the now former CEO of Spotless, Martin
Sheppard, whose reported and realised pay were somewhat distorted by Downer EDI taking control of the company at
the end of June 2017. Even so, Sheppard’s FY17 pay included $1.67m in cash.54 Also new to the Top 10 were
Cleanaway’s Vik Bansal and Whitehaven’s Paul Flynn. Both CEO’s reported pay including the expensing of equity
incentives yet to vest. In Flynn’s case, some of these incentives vested after the end of FY17 and he received shares
worth $3.10m.55
than continued service after receiving $510,000 in equity for FY16 and $615,000 for FY15; see Iress Limited, 2017 Annual; Report, p.33 and 2016 Annual Report, p.32. 46 Claro was terminated as CEO on 4 August 2017. His pay for FY17 includes no benefit from his early termination. 47 Cromwell Group, 2017 Annual Report, p.38; 2016 Annual Report, pp.86-87. CMW acquired Valad Europe for $199m in cash and impaired $87m of the $143m in goodwill it recognised on acquisition in FY16. 48 Mineral Resources Limited, 2017 Annual Report, p.52; Change of director’s interest notice, 1 September 2016. 49 Spotless Group Holdings Limited, 2017 Annual Report, pp.27-30. 50 Cleanaway Waste Management Limited, 2017 Annual Report, pp.44, 52 and 54. 51 Metcash Limited, 2017 Annual Report, pp.39 and 41. 52 Whitehaven Coal Limited, 2016 Annual Report, pp.78-79; Change of director’s interest notice, 9 September 2016. 53 Mineral Resources Limited, 2017 Annual Report, pp.47 and 52. 54 Downer EDI achieved a 50 per cent shareholding in Spotless on 27 June 2017; see Downer EDI Limited, ASX announcement, ‘Downer’s stake in Spotless now greater than 50%’, 27 June 2017. 55 Whitehaven Coal Limited, Change of director’s interest notice, 6 September 2017.

CEO PAY IN ASX200 COMPANIES: JULY 2018 | 17
The CEOs included in the FY16 reported pay Top 10 who did not make the FY17 group included Village Roadshow’s co-
CEOs (as Village fell out of the S&P/ASX 200), BT’s Emilio Gonzalez (whose company entered the Top 100) and
Automotive Holding’s Bronte Howson (who retired during FY17 and received the largest termination payment for an
ASX101-200 CEO in FY17; see the ‘Termination Payments’ section below). The others not to make the FY17 Top 10 were
Sigma’s Mark Hooper, who was ranked 11th in the FY17 sample, and Saracen’s Finlayson, who was ranked 21st. These two
CEOs, as noted above, were ranked first and second for realised pay in FY17.
Reported and realised pay were again closely correlated across the entire S&P/ASX 200 sample in FY17. Of the 161 CEOs
in the sample, there were only 10 whose realised pay was more than 200 per cent of reported pay and only three whose
realised pay was less than half their reported pay. Nearly half the sample – 75 of 161 or 47 per cent – had realised pay
that was between 80 per cent and 120 per cent of their reported pay and 66 per cent had realised pay that was between
70 per cent and 130 per cent of reported pay.
Table 14: ASX200 CEOs with the most understated pay in FY17
Rank CEO (Company/Index) Realised pay (as % of reported pay)
1 Don Meij (Domino’s/100) 790%
2 John Guscic (Webjet/200) 470%
3 Raleigh Finlayson (Saracen/200) 355%
4 Scott Richards (Mayne Pharma/200) 338%
5 Jake Klein (Evolution/100) 320%
Domino’s CEO Don Meij again had the most understated pay on a statutory basis. For four of the five CEOs whose pay
was the most understated on a statutory basis, including Meij, this was due to surging share prices increasing the value of
equity incentives between grant and vesting. In the case of Meij, for example, the options he exercised in FY17 for a gain
of $35.74m had a value at grant of $1.89m. Under accounting standards, it is the value of equity at grant date that is
expensed over the life of the options, and included in statutory pay disclosures.56
The exception among the five most understated CEOs was Saracen’s Raleigh Finlayson, whose FY16 pay was the most
overstated in the sample. This was due to Finlayson receiving a very large equity allocation in 2015 vesting over 18
months to three years (a large part of this grant was expensed in FY16 but vested in FY17).57
Table 15: ASX200 CEOs with the most overstated pay in FY17
Rank CEO (Company) Realised pay as % of reported pay
1 Anthony Tse (Galaxy/200) 18%
2 Bill Beament (Northern Star/100) 42%
3 Trent Ottawa (Gateway/200) 49%
4 Tom O’Leary (Iluka/100) 51%
5 Mark Clark (Regis Resources/200) 52%
The CEOs with the most overstated pay in the FY17 sample again included a number of smaller resources companies.
These types of companies often make large, less regular equity allocations to senior executives and this explains the
mismatch between the reported and realised pay for Galaxy’s Anthony Tse, Northern Star’s Beament and Regis’s Mark
Clark. In the case of Galaxy’s Tse, his FY17 reported pay of $2.915m includes the bulk of the $3.58m expense associated
with the four million options he was granted following the company’s 2017 AGM.58
The exceptions among the five CEOs with the most overstated pay were Gateway’s Trent Ottawa and Iluka’s Tom
O’Leary. For both CEOs, their inclusion was due to timing differences. To this end, their reported pay includes expenses
associated with equity incentives that are yet to vest. In Ottawa’s case, no equity incentives are due to vest until FY19,
while O’Leary has no long-term incentives due to vest until FY18.59
56 Domino’s Pizza Enterprises Limited, 2017 Annual Report, p.33. 57 Saracen Mineral Holdings Limited, 2017 Annual Report, pp.58 and 60. 58 Galaxy Resources Limited, 2017 Financial Report, pp.10-12. 59 Gateway Lifestyle Group, 2017 Annual Report, p.27; Iluka Resources Limited, 2017 Annual Report, p.72.
18 | CEO PAY IN ASX200 COMPANIES: JULY 2018
CEO FIXED PAY IN FY17
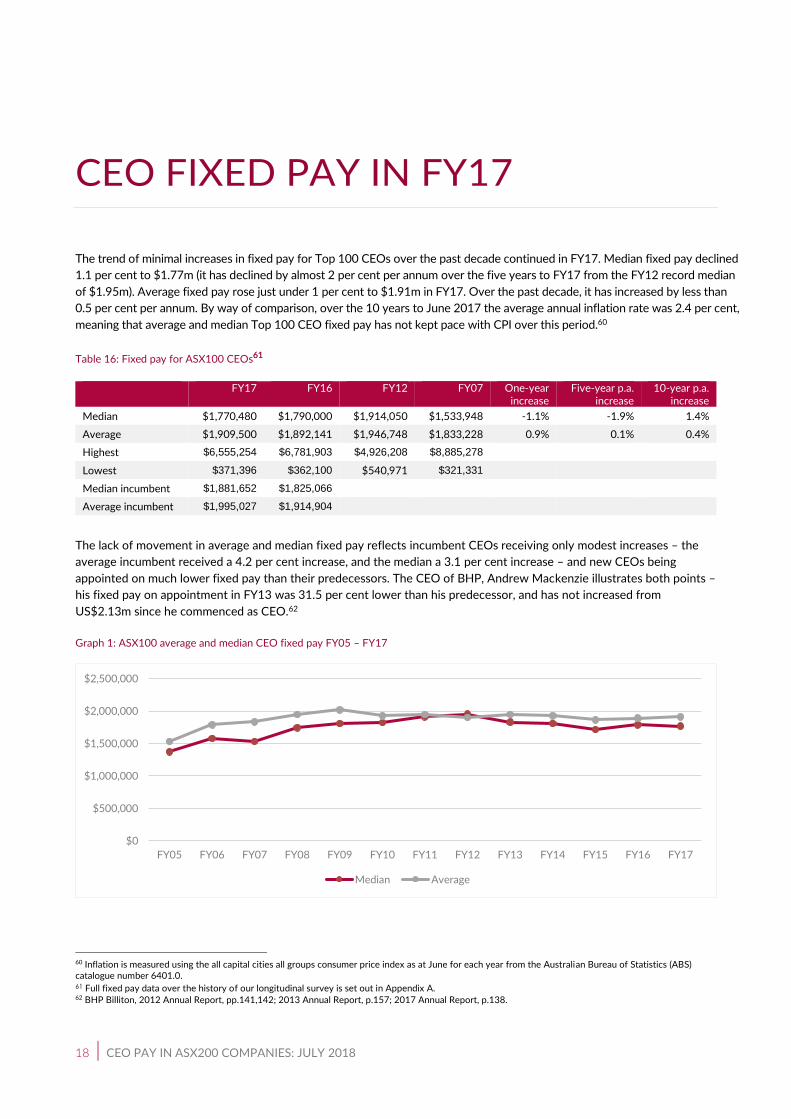
The trend of minimal increases in fixed pay for Top 100 CEOs over the past decade continued in FY17. Median fixed pay declined
1.1 per cent to $1.77m (it has declined by almost 2 per cent per annum over the five years to FY17 from the FY12 record median
of $1.95m). Average fixed pay rose just under 1 per cent to $1.91m in FY17. Over the past decade, it has increased by less than
0.5 per cent per annum. By way of comparison, over the 10 years to June 2017 the average annual inflation rate was 2.4 per cent,
meaning that average and median Top 100 CEO fixed pay has not kept pace with CPI over this period.60
Table 16: Fixed pay for ASX100 CEOs61
FY17 FY16 FY12 FY07 One-year increase
Five-year p.a. increase
10-year p.a. increase
Median $1,770,480 $1,790,000 $1,914,050 $1,533,948 -1.1% -1.9% 1.4%
Average $1,909,500 $1,892,141 $1,946,748 $1,833,228 0.9% 0.1% 0.4%
Highest $6,555,254 $6,781,903 $4,926,208 $8,885,278
Lowest $371,396 $362,100 $540,971 $321,331
Median incumbent $1,881,652 $1,825,066
Average incumbent $1,995,027 $1,914,904
The lack of movement in average and median fixed pay reflects incumbent CEOs receiving only modest increases – the
average incumbent received a 4.2 per cent increase, and the median a 3.1 per cent increase – and new CEOs being
appointed on much lower fixed pay than their predecessors. The CEO of BHP, Andrew Mackenzie illustrates both points –
his fixed pay on appointment in FY13 was 31.5 per cent lower than his predecessor, and has not increased from
US$2.13m since he commenced as CEO.62
Graph 1: ASX100 average and median CEO fixed pay FY05 – FY17
60 Inflation is measured using the all capital cities all groups consumer price index as at June for each year from the Australian Bureau of Statistics (ABS) catalogue number 6401.0. 61 Full fixed pay data over the history of our longitudinal survey is set out in Appendix A. 62 BHP Billiton, 2012 Annual Report, pp.141,142; 2013 Annual Report, p.157; 2017 Annual Report, p.138.
$0
$500,000
$1,000,000
$1,500,000
$2,000,000
$2,500,000
FY05 FY06 FY07 FY08 FY09 FY10 FY11 FY12 FY13 FY14 FY15 FY16 FY17
Median Average

CEO PAY IN ASX200 COMPANIES: JULY 2018 | 19
There was, however, an increase in the number of highly-paid CEOs, on a fixed pay basis, in the Top 100 sample. The 12
CEOs with fixed pay of $2.5m or higher in FY16 increased to 15 in FY17. This included a number of incumbent CEOs who
received generous pay increases, such as Treasury Wine’s Michael Clarke, Seek’s Andrew Bassat, AGL’s Andy Vesey and
Hamish Douglass of Magellan (see more below), and some CEOs included in the sample for the first time who were
appointed on large salaries – such as Woolworth’s Brad Banducci who started on a salary of $2.5m.63
Again, the highest fixed pay for an ASX100 CEO was again the combined packages of Peter and Steven Lowy. On an
individual basis, their salaries of US$2.5m apiece would have ranked them third and fourth in the FY17 sample – behind
only Amcor’s Ron Delia at $4.69m and the (now former) Wesfarmers CEO Richard Goyder.64 In Delia’s case, his high fixed
pay (as in FY16) consisted of a salary of US$1.5m, which is less than half his fixed cost to Amcor shareholders after
expatriate benefits including tax equalisation.
The other CEO to have fixed pay above $3m in FY17 was Magellan’s Hamish Douglass whose new pay arrangements set
his fixed pay as 1.5 percentage points of the pre-tax profit of the funds management business, averaged over the prior
three years. Without the more than doubling of Douglass’ fixed pay, the average fixed pay for incumbent Top 100 CEOs
would have risen only 2.8 per cent, not 4.2 per cent, while the average for the whole sample would have fallen slightly
from FY16.65 The impact of outliers on the sample will be apparent in the FY18 survey, given that the removal of the
Lowy brothers from the sample with the acquisition of Westfield by Unibail will (all else being equal) reduce average fixed
pay by 3 per cent.
In FY17 there were eight Top 100 CEOs with fixed pay below $1m (FY16: 10). The lowest fixed pay for a Top 100 CEO
went to Flight Centre’s Graham Turner who was again the only CEO with fixed pay below $500,000 – and indeed was the
only Top 100 CEO with fixed pay below $750,000. The next lowest-paid CEO on a fixed pay basis was OZ Minerals’
Andrew Cole at $751,000.
Graph 2: ASX100 average CEO fixed pay FY05 – FY17 as a multiple of average adult earnings
63 Clarke’s fixed pay increased from $1.7m to $2.2m from March 2016, excluding various additional benefits. It increased again in September 2017 to $2.5m; see Treasury Wine Estates, 2017 Annual Report, pp.46 and 51. Bassat’s cash fixed pay increased 8 per cent in FY17; see Seek Limited, 2016 Notice of annual general meeting, p.7. Vesey’s fixed pay increased 9.5 per cent in FY17 to $2.3m per annum after increasing 10.5 per cent in FY16, excluding non-monetary benefits; see AGL Energy Limited, 2017 Annual Report, p.34. For Banducci see Woolworths Group Limited, 2017 Annual Report, p.37. 64 Amcor Limited, 2017 Annual Report, p.42; Wesfarmers Limited, 2017 Annual Report, p.87. 65 Magellan Financial Group Limited, 2017 Annual Report, p.20.
0.0
5.0
10.0
15.0
20.0
25.0
30.0
35.0
$0
$500,000
$1,000,000
$1,500,000
$2,000,000
$2,500,000
FY07 FY08 FY09 FY10 FY11 FY12 FY13 FY14 FY15 FY16 FY17
Average CEO fixed pay - Top 100 Multiple of average adult earnings
20 | CEO PAY IN ASX200 COMPANIES: JULY 2018
The graph above shows that, despite generally weak wages growth over the 10 years to FY17, average adult total
earnings over this period have risen 3.4 per cent per annum. This has been sufficient to substantially reduce the multiple
of Top 100 CEO fixed pay, relative to general earnings, given the even weaker growth in CEO fixed pay.66 From a peak in
FY08, when average Top 100 CEO fixed pay was almost 32 times average adult full-time earnings, the gap has closed to
just under 23 times in FY17 as average adult earnings have risen 37 per cent over this period, and average CEO fixed pay
has fallen 2 per cent.
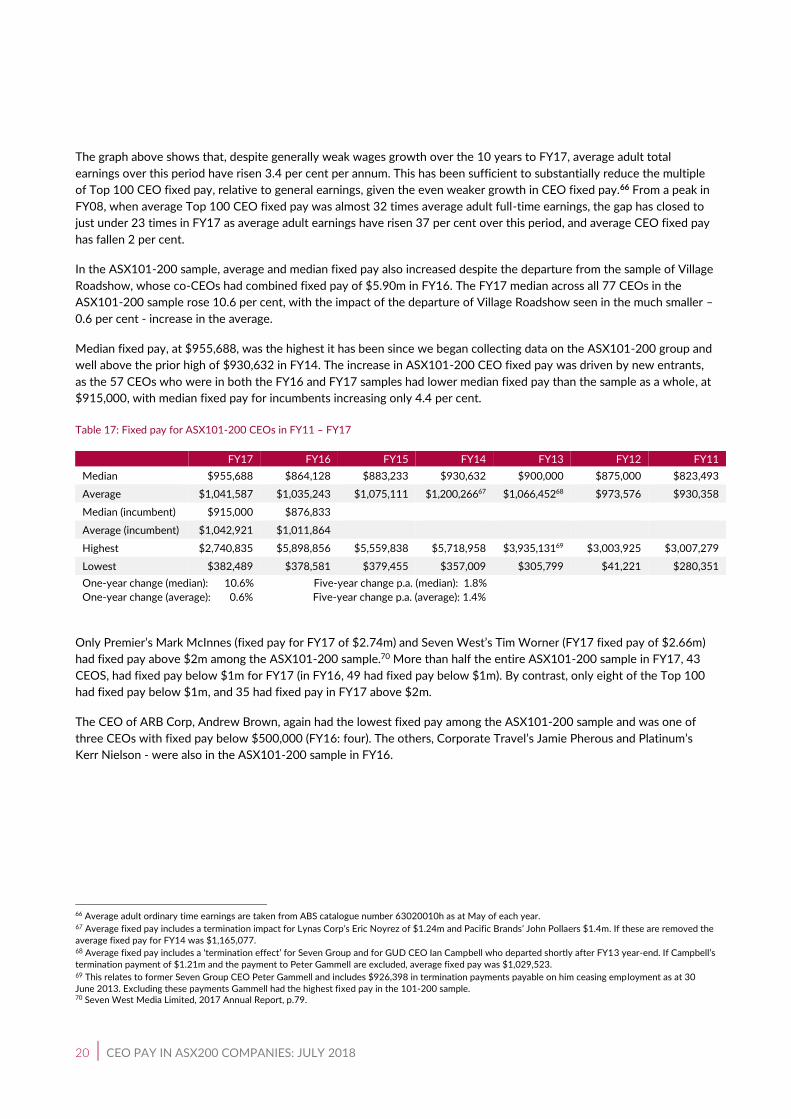
In the ASX101-200 sample, average and median fixed pay also increased despite the departure from the sample of Village
Roadshow, whose co-CEOs had combined fixed pay of $5.90m in FY16. The FY17 median across all 77 CEOs in the
ASX101-200 sample rose 10.6 per cent, with the impact of the departure of Village Roadshow seen in the much smaller –
0.6 per cent - increase in the average.
Median fixed pay, at $955,688, was the highest it has been since we began collecting data on the ASX101-200 group and
well above the prior high of $930,632 in FY14. The increase in ASX101-200 CEO fixed pay was driven by new entrants,
as the 57 CEOs who were in both the FY16 and FY17 samples had lower median fixed pay than the sample as a whole, at
$915,000, with median fixed pay for incumbents increasing only 4.4 per cent.
Table 17: Fixed pay for ASX101-200 CEOs in FY11 – FY17
FY17 FY16 FY15 FY14 FY13 FY12 FY11
Median $955,688 $864,128 $883,233 $930,632 $900,000 $875,000 $823,493
Average $1,041,587 $1,035,243 $1,075,111 $1,200,26667 $1,066,45268 $973,576 $930,358
Median (incumbent) $915,000 $876,833
Average (incumbent) $1,042,921 $1,011,864
Highest $2,740,835 $5,898,856 $5,559,838 $5,718,958 $3,935,13169 $3,003,925 $3,007,279
Lowest $382,489 $378,581 $379,455 $357,009 $305,799 $41,221 $280,351
One-year change (median): 10.6% Five-year change p.a. (median): 1.8%
One-year change (average): 0.6% Five-year change p.a. (average): 1.4%
Only Premier’s Mark McInnes (fixed pay for FY17 of $2.74m) and Seven West’s Tim Worner (FY17 fixed pay of $2.66m)
had fixed pay above $2m among the ASX101-200 sample.70 More than half the entire ASX101-200 sample in FY17, 43
CEOS, had fixed pay below $1m for FY17 (in FY16, 49 had fixed pay below $1m). By contrast, only eight of the Top 100
had fixed pay below $1m, and 35 had fixed pay in FY17 above $2m.
The CEO of ARB Corp, Andrew Brown, again had the lowest fixed pay among the ASX101-200 sample and was one of
three CEOs with fixed pay below $500,000 (FY16: four). The others, Corporate Travel’s Jamie Pherous and Platinum’s
Kerr Nielson - were also in the ASX101-200 sample in FY16.
66 Average adult ordinary time earnings are taken from ABS catalogue number 63020010h as at May of each year. 67 Average fixed pay includes a termination impact for Lynas Corp’s Eric Noyrez of $1.24m and Pacific Brands’ John Pollaers $1.4m. If these are removed the
average fixed pay for FY14 was $1,165,077. 68 Average fixed pay includes a ‘termination effect’ for Seven Group and for GUD CEO Ian Campbell who departed shortly after FY13 year-end. If Campbell’s
termination payment of $1.21m and the payment to Peter Gammell are excluded, average fixed pay was $1,029,523. 69 This relates to former Seven Group CEO Peter Gammell and includes $926,398 in termination payments payable on him ceasing employment as at 30
June 2013. Excluding these payments Gammell had the highest fixed pay in the 101-200 sample. 70 Seven West Media Limited, 2017 Annual Report, p.79.

CEO PAY IN ASX200 COMPANIES: JULY 2018 | 21
CEO BONUSES IN FY17
The FY17 survey results illustrate that a Top 100 CEO is more likely to lose their job, than to receive no bonus for
performance reasons. In FY17, only 10 of the 84 CEOs in the Top 100 sample didn’t receive a bonus. Six of those were for
performance reasons. There were 10 CEO departures from the sample, excluding QBE’s John Neal who left at the end of
FY17.71 A number of the departing CEOs also received a bonus, including Neal, who was awarded $800,000, Healthscope’s
Robbie Cooke, who was awarded approximately $640,000, and Primary’s Peter Gregg, who received $300,000.72
Bonus persistence was strikingly evident in the Top 100 sample in FY17. The median cash bonus rose 8.7 per cent to
$1.11m, and median bonus awarded rose 18.8 per cent to $1.76m – the highest median bonus awarded since ACSI began
collecting this data in FY11 (the previous high was $1.6m in FY15).73 The average bonus also rose 11.7 per cent to a
record high of $2.3m, from the prior record of $2.06m in FY16, although the average cash bonus declined 2.7 per cent to
$1.28m. For an ASX100 CEO, the median bonus as a proportion of maximum rose slightly in FY17, from 68.6 per cent to
70.5 per cent – again indicating that the overwhelming majority of ASX100 CEOs received well over half their maximum
potential bonus.74
Graph 3: ASX100 CEO bonus outcomes FY07 – FY17
The six CEOs who received no bonus for performance reasons in FY17 (FY16: eight), were CBA’s Ian Narev (the first
major bank CEO in the history of our survey to receive no bonus), Tabcorp’s David Attenborough, Star Entertainment’s
Matt Bekier, Adelaide Brighton’s Martin Brydon, Vocus’s Geoff Horth and Domino’s Don Meij. Of these six, only
Attenborough, Bekier and Meij remain in their roles. This confirms a longstanding trend whereby no bonus payment to a
CEO is a lead indicator of impending CEO turnover.
71 This excludes ASX where Elmer Funke Kupper departed in FY16 and his replacement, Dominic Stevens, commenced in FY17. The four CEOs not eligible to receive a bonus in the FY17 sample were Seek’s Andrew Bassat, Goodman Group’s Greg Goodman, Harvey Norman’s Gerry Harvey and Northern Star’s Bill Beament. 72 QBE Insurance Group Limited, 2017 Annual Report, p.62; Healthscope Limited, 2017 Annual Report, pp.38-39; Primary Health Care Limited, 2017 Annual Report, p.57. 73 Data on bonuses awarded excludes entities where no bonus was paid i.e. the sample is 74. 74 Data on bonuses awarded as a proportion of maximum was available for 76 CEOs (FY16: 71).
0.0%
2.0%
4.0%
6.0%
8.0%
10.0%
12.0%
14.0%
16.0%
18.0%
20.0%
0
200000
400000
600000
800000
1000000
1200000
1400000
1600000
1800000
2000000
FY07 FY08 FY09 FY10 FY11 FY12 FY13 FY14 FY15 FY16 FY17
Pro
po
rtio
n o
f T
op
10
0 C
EO
s re
ceiv
ing
no
bo
nu
s
Median accrued bonus Median cash bonus Proportion receiving no cash bonus (RHS)

22 | CEO PAY IN ASX200 COMPANIES: JULY 2018
No ‘incumbent’ Top 100 CEO did not receive a bonus in both the FY16 and FY17 survey and the median bonus outcome
for an incumbent Top 100 CEO rose from 65 per cent in FY16 to 69.7 per cent in FY17.
Table 18: Cash bonuses for ASX100 CEOs75
FY17 FY16 FY12 FY07 One-year change
Five-year p.a. change
10-year p.a. change
Median $1,110,087 $1,021,000 $1,060,095 $1,360,000 8.7% 0.9% -2.0%
Average $1,277,179 $1,313,223 $1,315,221 $2,260,741 -2.7% -0.6% -5.6%
Highest $6,389,286 $6,645,144 $7,245,088 $25,615,987
Median incumbent $1,249,715 $1,051,800
Average incumbent $1,342,753 $1,207,943
The consistent decline in cash bonuses over a prolonged period – over 10 years the average cash bonus has declined 5.6
per cent per annum, and the median by 2 per cent – is largely due to increases in bonus deferral rather than a decline in
total bonus outcomes. The average has fallen by more than the median due to the impact of a handful of very large cash
bonus payments in FY07, which have not been repeated in part due to increases in bonus deferral. As an example, in
FY07 current Macquarie CEO Nicholas Moore received the second largest bonus at Macquarie behind then CEO Allan
Moss at $28.5m, and only 20 per cent was deferred. As CEO in FY17, Moore was awarded a bonus for FY17 of $17.24m
but 80 per cent of it was deferred.76 To address the rise of bonus deferral, since FY11 our survey has captured data on
bonuses awarded for a year (including the deferred element) and these are shown in Table 19 below.
Table 19: Awarded bonuses for ASX100 CEOs
FY17 FY16 FY15 FY14 FY13 FY12 FY11
Median $1,763,623 $1,485,000 $1,604,724 $1,516,985 $1,290,150 $1,366,730 $1,500,000
Average $2,303,960 $2,063,479 $1,949,392 $1,964,975 $1,684,571 $1,736,497 $1,657,376
Highest $17,236,480 $17,721,760 $15,913,613 $11,948,209 $9,386,708 $9,177,417 $9,002,180
Median incumbent $1,806,500 $1,599,600
Average incumbent $2,474,786 $2,230,669
For the third consecutive year, Macquarie’s Nicholas Moore received the highest accrued bonus in FY17. Either Moore, or
the Lowys at Westfield, have received the highest accrued bonus every year that our survey has been collecting data on
accrued bonuses.77 In FY17, there were only four entities where the CEO received a cash bonus above $3m; Macquarie,
Westfield (each Lowy brother received a cash bonus of more than $3m), CSL’s Paul Perreault and Wesfarmers’ Goyder
(whose cash bonus was above $4m).78
There were 13 bonuses of more than $3m awarded, including components deferred. This included Bluescope Steel’s Paul
O’Malley, whose combined bonus for FY16 and FY17 was awarded entirely in equity and (as noted above) was worth
$14.18m when it vested in full.79 No Big Four bank CEO received a bonus of more than $3m, although Westpac’s Brian
Hartzer did receive $2.98m.80
75 Full bonus data over the history of our longitudinal survey is disclosed in Appendix B. 76 Macquarie Bank Limited, 2007 Annual Report, pp.62 and 72; Macquarie Group Limited, 2017 Annual Report, p.58. Macquarie refers to annual bonus awards as ‘profit share’ allocations. 77 Nicholas Moore had the highest accrued bonus for FY11, FY15, FY16 and FY17. 78 CSL Limited, 2017 Annual Report, p.76. 79 The CEOs to be awarded a bonus of more than $3m for FY17 other than Moore, Perreault, O’Malley, Goyder and the Lowys were Oil Search’s Peter Botten, Woodside’s Peter Coleman, BHP’s Andrew Mackenzie, Newcrest’s Sandeep Biswas, Fortescue’s Nev Power, Qantas’ Alan Joyce, Treasury’s Michael Clarke and Woolworths’ Brad Banducci. None of these eight CEOs received a bonus above $4m. 80 Westpac Banking Corporation, 2017 Annual Report, p.50.

CEO PAY IN ASX200 COMPANIES: JULY 2018 | 23
Graph 4: Distribution of bonus outcomes for ASX100 CEOs as a percentage of maximum
Graph 4 shows the high likelihood of a Top 100 CEO receiving a bonus at a substantial proportion of maximum. This is
consistent with data from prior years and is remarkably consistent across a wide range of individuals and diverse
businesses for payments routinely described by boards as being ‘at risk’.
Like FY16, seven CEOs received their maximum bonus in FY17, including Cochlear’s now former CEO Chris Smith who
was awarded 107 per cent of target.81 Of the seven, two received 100 per cent of maximum for the second year in
succession; Treasury’s Michael Clarke and JB Hi-Fi’s Richard Murray.82 Another seven CEOs received 90 per cent or more
of maximum, while only 15 CEOs in the survey received less than half of maximum (one received half of maximum). In
FY16, 18 CEOs in the sample received less than half of maximum.
Table 20: Cash bonuses for ASX101-200 CEOs
FY17 FY16 FY15 FY14 FY13 FY12 FY11
Median $362,500 $386,223 $329,253 $334,500 $350,000 $336,500 $376,915
Average $556,658 $485,616 $505,987 $609,010 $418,911 $402,025 $421,576
Highest $2,889,682 $2,000,000 $3,100,000 $5,169,183 $1,166,229 $1,156,000 $1,500,000
Median incumbent $378,387 $405,211
Average incumbent $534,222 $442,445
Proportion receiving
no bonus
18% 19% 33% 21% 33% 26% 24%
One-year increase (median): -6.1% Five-year increase p.a. (median): 1.5%
One-year increase (average): 14.6% Five-year increase p.a. (average): 6.7%
81 Cochlear Limited, 2017 Annual Report, p.42. The company does not appear to have a maximum bonus concept and instead refers all executive bonus outcomes as being relative to target. 82 Treasury Wine Estates, 2017 Annual Report, p.52; 2016 Annual Report, p.47; JB Hi-Fi Limited, 2017 Annual Report, p.31 and 2016 Annual Report, p.32.
0.0%
20.0%
40.0%
60.0%
80.0%
100.0%
120.0%
24 | CEO PAY IN ASX200 COMPANIES: JULY 2018
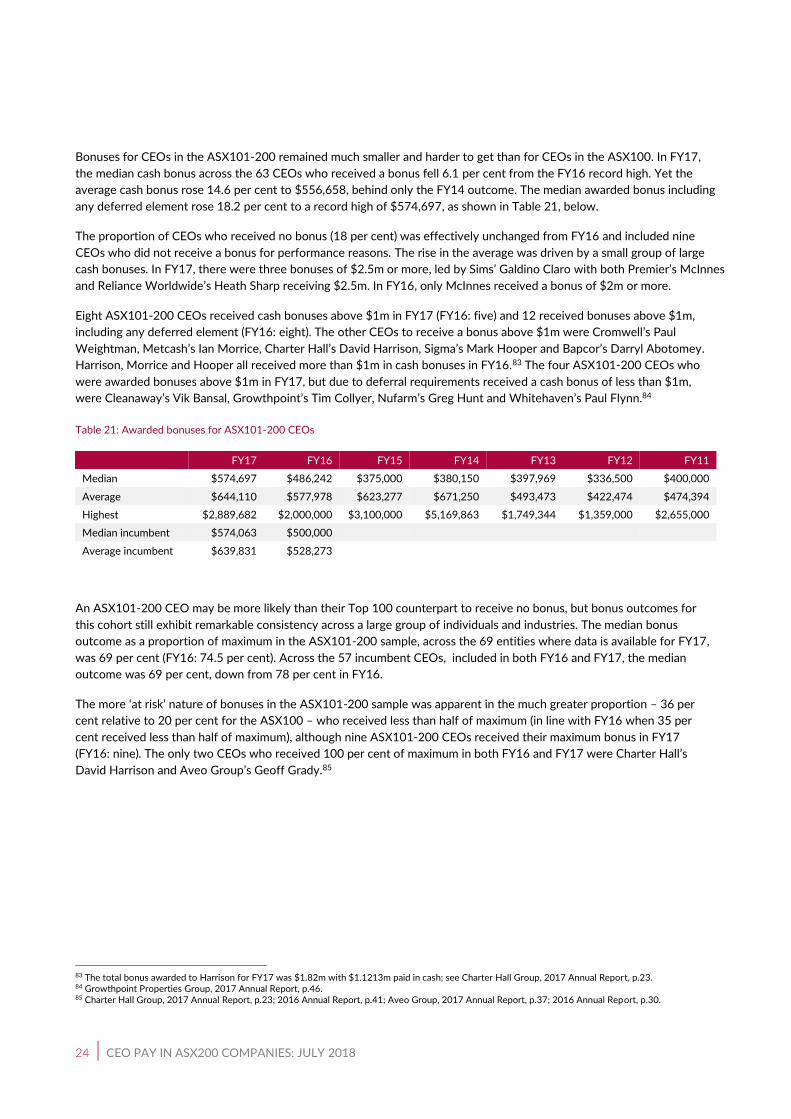
Bonuses for CEOs in the ASX101-200 remained much smaller and harder to get than for CEOs in the ASX100. In FY17,
the median cash bonus across the 63 CEOs who received a bonus fell 6.1 per cent from the FY16 record high. Yet the
average cash bonus rose 14.6 per cent to $556,658, behind only the FY14 outcome. The median awarded bonus including
any deferred element rose 18.2 per cent to a record high of $574,697, as shown in Table 21, below.
The proportion of CEOs who received no bonus (18 per cent) was effectively unchanged from FY16 and included nine
CEOs who did not receive a bonus for performance reasons. The rise in the average was driven by a small group of large
cash bonuses. In FY17, there were three bonuses of $2.5m or more, led by Sims’ Galdino Claro with both Premier’s McInnes
and Reliance Worldwide’s Heath Sharp receiving $2.5m. In FY16, only McInnes received a bonus of $2m or more.
Eight ASX101-200 CEOs received cash bonuses above $1m in FY17 (FY16: five) and 12 received bonuses above $1m,
including any deferred element (FY16: eight). The other CEOs to receive a bonus above $1m were Cromwell’s Paul
Weightman, Metcash’s Ian Morrice, Charter Hall’s David Harrison, Sigma’s Mark Hooper and Bapcor’s Darryl Abotomey.
Harrison, Morrice and Hooper all received more than $1m in cash bonuses in FY16.83 The four ASX101-200 CEOs who
were awarded bonuses above $1m in FY17, but due to deferral requirements received a cash bonus of less than $1m,
were Cleanaway’s Vik Bansal, Growthpoint’s Tim Collyer, Nufarm’s Greg Hunt and Whitehaven’s Paul Flynn.84
Table 21: Awarded bonuses for ASX101-200 CEOs
FY17 FY16 FY15 FY14 FY13 FY12 FY11
Median $574,697 $486,242 $375,000 $380,150 $397,969 $336,500 $400,000
Average $644,110 $577,978 $623,277 $671,250 $493,473 $422,474 $474,394
Highest $2,889,682 $2,000,000 $3,100,000 $5,169,863 $1,749,344 $1,359,000 $2,655,000
Median incumbent $574,063 $500,000
Average incumbent $639,831 $528,273
An ASX101-200 CEO may be more likely than their Top 100 counterpart to receive no bonus, but bonus outcomes for
this cohort still exhibit remarkable consistency across a large group of individuals and industries. The median bonus
outcome as a proportion of maximum in the ASX101-200 sample, across the 69 entities where data is available for FY17,
was 69 per cent (FY16: 74.5 per cent). Across the 57 incumbent CEOs, included in both FY16 and FY17, the median
outcome was 69 per cent, down from 78 per cent in FY16.
The more ‘at risk’ nature of bonuses in the ASX101-200 sample was apparent in the much greater proportion – 36 per
cent relative to 20 per cent for the ASX100 – who received less than half of maximum (in line with FY16 when 35 per
cent received less than half of maximum), although nine ASX101-200 CEOs received their maximum bonus in FY17
(FY16: nine). The only two CEOs who received 100 per cent of maximum in both FY16 and FY17 were Charter Hall’s
David Harrison and Aveo Group’s Geoff Grady.85
83 The total bonus awarded to Harrison for FY17 was $1.82m with $1.1213m paid in cash; see Charter Hall Group, 2017 Annual Report, p.23. 84 Growthpoint Properties Group, 2017 Annual Report, p.46. 85 Charter Hall Group, 2017 Annual Report, p.23; 2016 Annual Report, p.41; Aveo Group, 2017 Annual Report, p.37; 2016 Annual Report, p.30.
CEO PAY IN ASX200 COMPANIES: JULY 2018 | 25
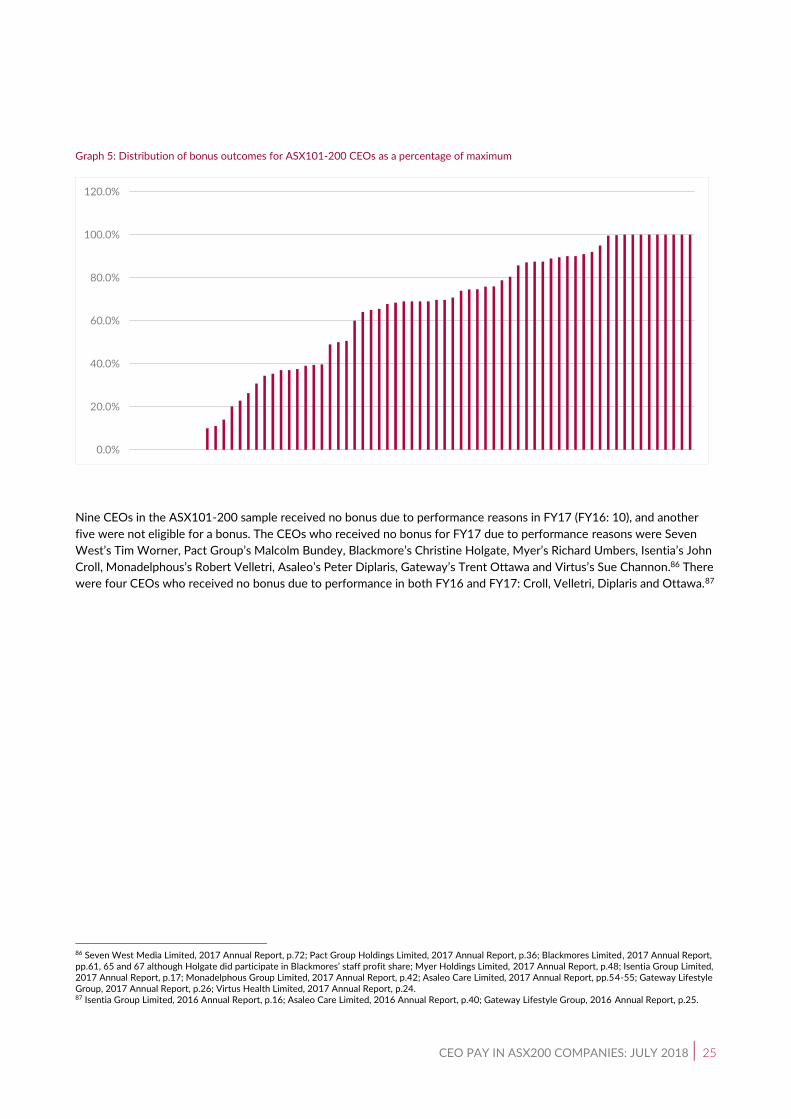
Graph 5: Distribution of bonus outcomes for ASX101-200 CEOs as a percentage of maximum
Nine CEOs in the ASX101-200 sample received no bonus due to performance reasons in FY17 (FY16: 10), and another
five were not eligible for a bonus. The CEOs who received no bonus for FY17 due to performance reasons were Seven
West’s Tim Worner, Pact Group’s Malcolm Bundey, Blackmore’s Christine Holgate, Myer’s Richard Umbers, Isentia’s John
Croll, Monadelphous’s Robert Velletri, Asaleo’s Peter Diplaris, Gateway’s Trent Ottawa and Virtus’s Sue Channon.86 There
were four CEOs who received no bonus due to performance in both FY16 and FY17: Croll, Velletri, Diplaris and Ottawa.87
86 Seven West Media Limited, 2017 Annual Report, p.72; Pact Group Holdings Limited, 2017 Annual Report, p.36; Blackmores Limited, 2017 Annual Report, pp.61, 65 and 67 although Holgate did participate in Blackmores’ staff profit share; Myer Holdings Limited, 2017 Annual Report, p.48; Isentia Group Limited, 2017 Annual Report, p.17; Monadelphous Group Limited, 2017 Annual Report, p.42; Asaleo Care Limited, 2017 Annual Report, pp.54-55; Gateway Lifestyle Group, 2017 Annual Report, p.26; Virtus Health Limited, 2017 Annual Report, p.24. 87 Isentia Group Limited, 2016 Annual Report, p.16; Asaleo Care Limited, 2016 Annual Report, p.40; Gateway Lifestyle Group, 2016 Annual Report, p.25.
0.0%
20.0%
40.0%
60.0%
80.0%
100.0%
120.0%
26 | CEO PAY IN ASX200 COMPANIES: JULY 2018
CEO CASH PAY
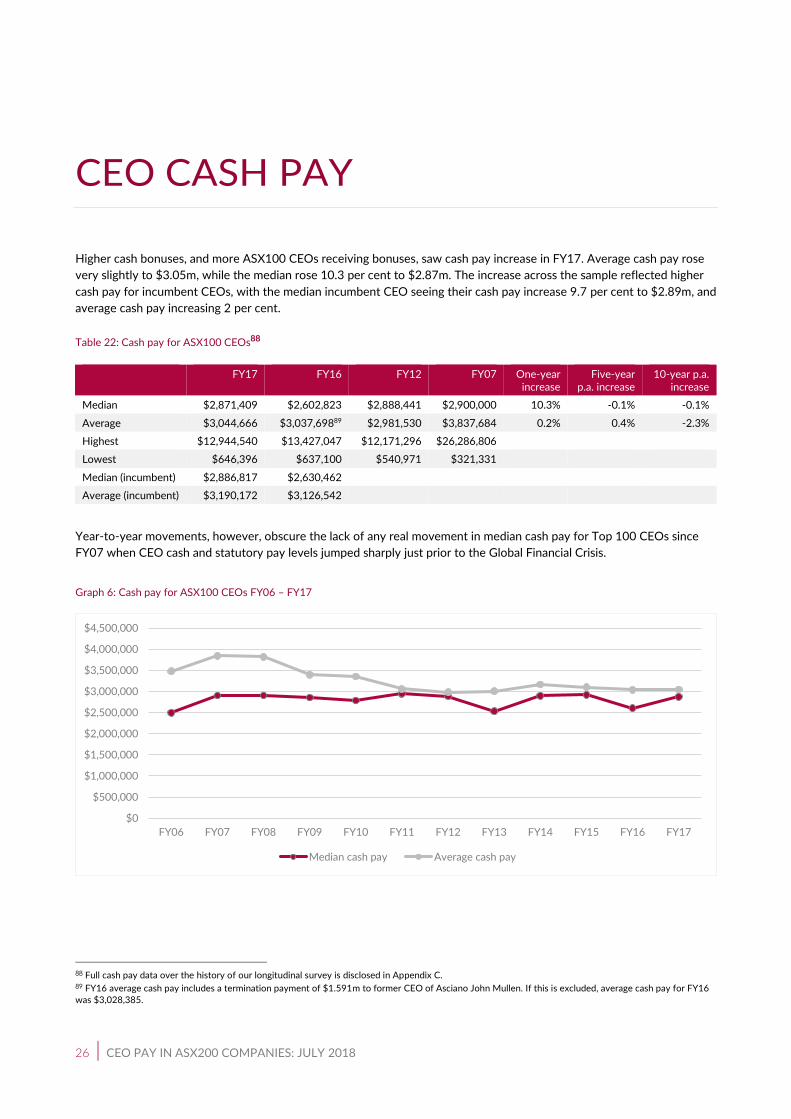
Higher cash bonuses, and more ASX100 CEOs receiving bonuses, saw cash pay increase in FY17. Average cash pay rose
very slightly to $3.05m, while the median rose 10.3 per cent to $2.87m. The increase across the sample reflected higher
cash pay for incumbent CEOs, with the median incumbent CEO seeing their cash pay increase 9.7 per cent to $2.89m, and
average cash pay increasing 2 per cent.
Table 22: Cash pay for ASX100 CEOs88
FY17 FY16 FY12 FY07 One-year increase
Five-year p.a. increase
10-year p.a. increase
Median $2,871,409 $2,602,823 $2,888,441 $2,900,000 10.3% -0.1% -0.1%
Average $3,044,666 $3,037,69889 $2,981,530 $3,837,684 0.2% 0.4% -2.3%
Highest $12,944,540 $13,427,047 $12,171,296 $26,286,806
Lowest $646,396 $637,100 $540,971 $321,331
Median (incumbent) $2,886,817 $2,630,462
Average (incumbent) $3,190,172 $3,126,542
Year-to-year movements, however, obscure the lack of any real movement in median cash pay for Top 100 CEOs since
FY07 when CEO cash and statutory pay levels jumped sharply just prior to the Global Financial Crisis.
Graph 6: Cash pay for ASX100 CEOs FY06 – FY17
88 Full cash pay data over the history of our longitudinal survey is disclosed in Appendix C. 89 FY16 average cash pay includes a termination payment of $1.591m to former CEO of Asciano John Mullen. If this is excluded, average cash pay for FY16
was $3,028,385.
$0
$500,000
$1,000,000
$1,500,000
$2,000,000
$2,500,000
$3,000,000
$3,500,000
$4,000,000
$4,500,000
FY06 FY07 FY08 FY09 FY10 FY11 FY12 FY13 FY14 FY15 FY16 FY17
Median cash pay Average cash pay

CEO PAY IN ASX200 COMPANIES: JULY 2018 | 27
Average cash pay declined swiftly from these record highs, as the distorting impact of a handful of CEOs with very high
cash pay was removed by departures or changes in practice (such as increased bonus deferral at Macquarie). With the
exception of two ‘low’ years in FY13 and FY16, the median has however remained in a relatively narrow band between
$2.79m and $2.95m. This lack of movement reflects minimal increases in fixed pay, reduced packages on new CEO
appointments, and annual bonuses increasingly being deferred into equity.
The highest CEOs on a cash pay basis were once again the Lowy brothers at Westfield who even individually would have
been ranked second and third on a cash pay basis behind Wesfarmers’ Richard Goyder. Goyder was not part of the FY16
top five (as noted above, his FY17 bonus was paid entirely in cash due to his impending retirement; his bonus in FY17 was
also substantially higher than in FY16).
Of the FY16 top five, Amcor’s Ron Delia and CSL’s Paul Perreault were again part of the FY17 top five, while Macquarie’s
Nicholas Moore dropped out solely due to his deferred bonus proportion increasing from 70 per cent to 80 per cent in
FY17. Aside from Goyder, the other new entrant was Sonic’s long-serving CEO, Colin Goldschmidt, due to a much higher
bonus and high fixed pay (only 16 Top 10 CEOs had higher fixed pay than Goldschmidt, and only four had a higher cash
bonus). The other FY16 top five member, the now former CEO of CBA, Ian Narev, fell out of the FY17 top five due to his
receiving no bonus.
Table 23: Highest paid ASX100 CEOs on a cash pay basis in FY17
CEO Company FY17 cash pay (FY16) Value of equity holding (as at end of FY17)
Steven & Peter Lowy Westfield Corporation $12,944,540 ($13,427,047) $1.89b90
Richard Goyder Wesfarmers $7,759,791 ($4,705,489) $30.49m
Ron Delia Amcor $6,329,183 ($6,554,424) $11.35m
Paul Perreault CSL $5,711,969 ($6,054,550) $6.94m
Colin Goldschmidt Sonic Healthcare $5,165,861 ($4,492,503) $16.98m
High cash pay insulates executives’ personal fortunes from movements in a company’s share price, especially if high cash
pay levels are recurring. Even a CEO such as Richard Goyder, who by the end of FY17 owned Wesfarmers shares worth
more than $30m, received cash pay of well over $35m in the six years to FY17.
CEOs are also able to insulate themselves from the performance of their company in other ways. For example, the FY17
cash pay for Sonic’s Goldschmidt, while less than a third of the value of his equity holding at year-end, obscures equity
sales totalling $15.99m between September 2016 and October 2017.91 The lowest cash pay in the FY17 ASX100 sample
was again Flight Centre’s Graham Turner with the other Top 100 CEOs with cash pay of less than $1m in FY17 Harvey
Norman’s Gerry Harvey and Northern Star’s Bill Beament.
90 Reflects the combined holding of the Lowy family. 91 Sonic Healthcare Limited, Change of director’s interest notices, 10 October 2017 and 23 September 2016.
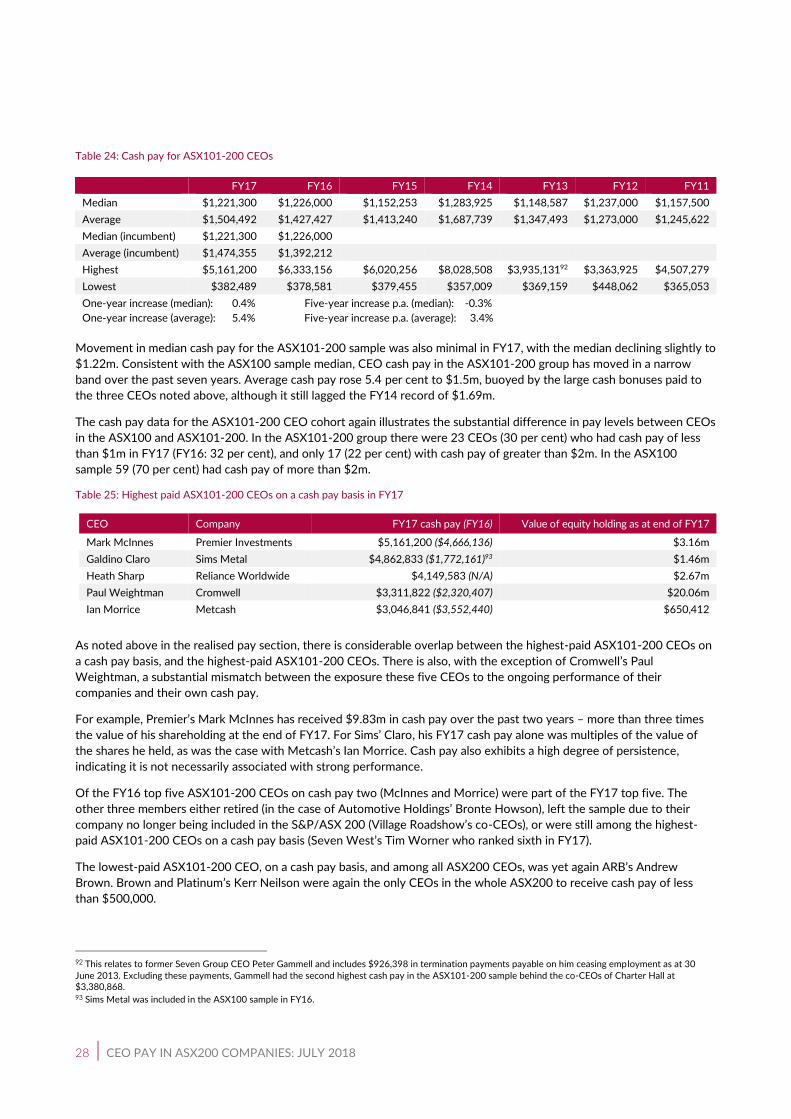
28 | CEO PAY IN ASX200 COMPANIES: JULY 2018
Table 24: Cash pay for ASX101-200 CEOs
FY17 FY16 FY15 FY14 FY13 FY12 FY11
Median $1,221,300 $1,226,000 $1,152,253 $1,283,925 $1,148,587 $1,237,000 $1,157,500
Average $1,504,492 $1,427,427 $1,413,240 $1,687,739 $1,347,493 $1,273,000 $1,245,622
Median (incumbent) $1,221,300 $1,226,000
Average (incumbent) $1,474,355 $1,392,212
Highest $5,161,200 $6,333,156 $6,020,256 $8,028,508 $3,935,13192 $3,363,925 $4,507,279
Lowest $382,489 $378,581 $379,455 $357,009 $369,159 $448,062 $365,053
One-year increase (median): 0.4% Five-year increase p.a. (median): -0.3%
One-year increase (average): 5.4% Five-year increase p.a. (average): 3.4%
Movement in median cash pay for the ASX101-200 sample was also minimal in FY17, with the median declining slightly to
$1.22m. Consistent with the ASX100 sample median, CEO cash pay in the ASX101-200 group has moved in a narrow
band over the past seven years. Average cash pay rose 5.4 per cent to $1.5m, buoyed by the large cash bonuses paid to
the three CEOs noted above, although it still lagged the FY14 record of $1.69m.
The cash pay data for the ASX101-200 CEO cohort again illustrates the substantial difference in pay levels between CEOs
in the ASX100 and ASX101-200. In the ASX101-200 group there were 23 CEOs (30 per cent) who had cash pay of less
than $1m in FY17 (FY16: 32 per cent), and only 17 (22 per cent) with cash pay of greater than $2m. In the ASX100
sample 59 (70 per cent) had cash pay of more than $2m.
Table 25: Highest paid ASX101-200 CEOs on a cash pay basis in FY17
CEO Company FY17 cash pay (FY16) Value of equity holding as at end of FY17
Mark McInnes Premier Investments $5,161,200 ($4,666,136) $3.16m
Galdino Claro Sims Metal $4,862,833 ($1,772,161)93 $1.46m
Heath Sharp Reliance Worldwide $4,149,583 (N/A) $2.67m
Paul Weightman Cromwell $3,311,822 ($2,320,407) $20.06m
Ian Morrice Metcash $3,046,841 ($3,552,440) $650,412
As noted above in the realised pay section, there is considerable overlap between the highest-paid ASX101-200 CEOs on
a cash pay basis, and the highest-paid ASX101-200 CEOs. There is also, with the exception of Cromwell’s Paul
Weightman, a substantial mismatch between the exposure these five CEOs to the ongoing performance of their
companies and their own cash pay.
For example, Premier’s Mark McInnes has received $9.83m in cash pay over the past two years – more than three times
the value of his shareholding at the end of FY17. For Sims’ Claro, his FY17 cash pay alone was multiples of the value of
the shares he held, as was the case with Metcash’s Ian Morrice. Cash pay also exhibits a high degree of persistence,
indicating it is not necessarily associated with strong performance.
Of the FY16 top five ASX101-200 CEOs on cash pay two (McInnes and Morrice) were part of the FY17 top five. The
other three members either retired (in the case of Automotive Holdings’ Bronte Howson), left the sample due to their
company no longer being included in the S&P/ASX 200 (Village Roadshow’s co-CEOs), or were still among the highest-
paid ASX101-200 CEOs on a cash pay basis (Seven West’s Tim Worner who ranked sixth in FY17).
The lowest-paid ASX101-200 CEO, on a cash pay basis, and among all ASX200 CEOs, was yet again ARB’s Andrew
Brown. Brown and Platinum’s Kerr Neilson were again the only CEOs in the whole ASX200 to receive cash pay of less
than $500,000.
92 This relates to former Seven Group CEO Peter Gammell and includes $926,398 in termination payments payable on him ceasing employment as at 30
June 2013. Excluding these payments, Gammell had the second highest cash pay in the ASX101-200 sample behind the co-CEOs of Charter Hall at $3,380,868. 93 Sims Metal was included in the ASX100 sample in FY16.

CEO PAY IN ASX200 COMPANIES: JULY 2018 | 29
TERMINATION PAYMENTS
There were 13 termination payments above $1m in FY17; 10 in the ASX100 and three in the ASX101-200 (FY16:10, and
eight in the ASX100). Four were in excess of $2m, all in the ASX100 (FY16: three in the Top 100).
The 20 termination payments in FY17 in the ASX200 cost shareholders $33.63m, up from an aggregate of $23.98m
across 17 payments in FY16.
Table 26: Termination payments for ASX100 CEOs in FY1794
Financial year Total Number Minimum Maximum
FY08 $83.03m 13 $793,333 $18.31m95
FY09 $34.56m 13 $168,000 $6.39m
FY10 $5.70m 5 $513,079 $1.68m
FY11 $35.02m 12 $566,667 $10.90m
FY12 $19.06m96 13 $150,000 $4.57m
FY13 $11.81m97 9 $141,459 $2.81m
FY14 $25.93m 9 $281,644 $13.59m
FY15 $24.17m 8 $30,315 $6.68m
FY16 $17.88m 9 $855,000 $4.38m
FY17 $26.14m 12 $832,089 $6.27m
Table 27: Termination payments for ASX101-200 CEOs in FY17
Financial year Total Number Minimum Maximum
FY11 $14,945,926 11 $270,710 $3,630,000
FY12 $5,761,582 6 $72,698 $2,510,000
FY13 $5,531,944 5 $301,926 $1,532,000
FY14 $11,809,607 7 $125,000 $8,132,985
FY15 $14,247,979 10 $202,321 $2,767,458
FY16 $6,098,580 8 $8,314 $2,888,614
FY17 $7,484,869 8 $205,552 $1,861,000
94 Termination payments include bonuses for part year worked, the value of long-term incentives that vest solely due to termination, payments in lieu of notice or for severance and the value of accrued leave entitlements for executives where leave entitlements have not previously been accrued in the remuneration table. 95 This payment, to former Santos CEO John Ellice-Flint, includes $14.592m which was the value of options that vested on his departure calculated based on the difference between the exercise price and closing price on the date his termination arrangements were announced to the ASX on 14 May 2008. It is not known if these options were exercised. The cash termination payments were $3.718m. 96 Figures disclosed in currencies other than AUD were converted into AUD using the exchange rate on the disclosed date of departure. 97 Figures disclosed in currencies other than AUD were converted using the average exchange rate for FY13 as the payments related to pro rata bonuses.

30 | CEO PAY IN ASX200 COMPANIES: JULY 2018
The increase in the average size of termination payments in FY17 was largely driven by one large payment of $6.27m to
former Crown CEO Rowen Craigie, which was approved by shareholders under the Corporations Act requirement that
any payment above 12 months’ salary, outside of certain specific exemptions, be approved by shareholders.98 This
payment was backed by Crown’s largest shareholder, Consolidated Press Holdings (CPH), although it would have still been
passed even without CPH’s support.
Aside from Craigie, the largest termination payments in FY17 all went to former ASX100 CEOs:
▪ QBE’s John Neal received cash termination payments of $4.64m upon his departure at the end of FY17, including 12
months’ payment in lieu of notice (despite his departure having been announced in September 2017), and what QBE
described as a ‘deferred bonus’ based on his length of service – equal to another 12 months’ fixed pay.99
▪ Former Aristocrat CEO Jamie Odell received $2.24m upon retirement, including a cash bonus of $584,000 – despite
working only five months of the FY17 year. He also received a “payment in connection with termination of his
employment” of $1.66m. This did not include a further $584,000 of his five-month FY17 bonus, awarded as deferred
equity.100
▪ The former CEO of Origin, Grant King, received a payment in lieu of notice of $2.17m on his departure during
FY17.101
The largest termination payment for an ASX101-200 CEO was paid to Automotive Holdings’ Bronte Howson who was,
prior to his departure, a regular member of the highest-paid group of ASX101-200 CEOs. His termination payment of
$1.86m included $662,000, paid in salary after he retired as managing director halfway through the year, a bonus of
$600,000 for FY17, and a $600,000 payment to secure an extended post-employment restraint.102
In FY17, there was one CEO who departed a company in the ASX200 sample who was disclosed as receiving no
termination payment – former Sirtex Medical CEO Gilman Wong. His departure followed a board-commissioned
investigation of the CEO’s share trading ahead of a downgrade, at the conclusion of which the board terminated Wong,
seemingly for cause.103
98 Crown Resorts Limited, 2017 notice of annual general meeting, pp.3-4; Crown Resorts Limited, ASX announcement, ‘Results of 2017 annual general meeting’, 26 October 2017. 99 QBE Insurance Group Limited, 2017 Annual Report, pp.68 and 80-81. QBE has separated Neal’s ‘business as usual’ remuneration from his termination payments in its statutory pay disclosures. 100 Aristocrat Leisure Limited, 2017 Annual Report, p.41. 101 Origin Energy Limited, 2017 Annual Report, pp.58-59. 102 Automotive Holdings Group Limited, 2017 Annual Report, p.53. 103 Sirtex Medical Limited, ASX announcement, ‘Investigation of concerns around CEO share trading’, 13 January 2017.

APPENDIX A: FIXED PAY DATA FOR ASX100
(Italicised data 2001-2004 includes News Corp)
Year Average Median Minimum Maximum
2017 $1,909,500 $1,770,480 $371,396 $6,555,254
2016 $1,892,141 $1,790,000 $362,100 $6,781,903
2015 $1,865,484 $1,715,087 $278,238 $6,979,057
2014 $1,929,122 $1,810,000 $343,573 $5,385,916
2013 $1,948,949 $1,830,614 $247,275 $6,359,705
2012 $1,900,878 $1,951,814 $540,971 $4,926,208
2011 $1,946,748 $1,914,050 $277,638 $4,573,000
2010 $1,929,062 $1,823,168 $119,057 $8,964,902
2009 $2,016,923 $1,807,561 $223,877 $8.981,956
2008 $1,947,350 $1,745,856 $198,648 $9,204,760
2007 $1,833,228 $1,533,948 $321,331 $8,885,278
2006 $1,789,826 $1,579,292 $394,769 $8,888,197
2005 $1,533,231 $1,373,437 $494,531 $8,789,826
2004 $1,416,877
$1,554,410
$1,353,000
$1,376,798
$410,437 $4,084,000
$11,731,875
2003 $1,361,769
$1,424,285
$1,136,537
$1,137,769
$345,056 $6,716,040
$13,486,153
2002 $984,045
$1,027,288
$903,838
$914,330
$50,575 $7,938,000
$7,938,000
2001 $888,407
$1,008,012
$780,975
$781,788
$52,055 $2,650,565
$8,543,137

32 | CEO PAY IN ASX200 COMPANIES: JULY 2018
APPENDIX B: CASH BONUS DATA FOR ASX100
(Italicised data 2001-2004 includes News Corp)
Year Average Median Minimum Maximum
2017 $1,277,179 $1,110,087 $147,485 $6,389,286
2016 $1,313,223 $1,021,000 $209,932 $6,645,144
2015 $1,271,251 $1,162,488 $35,000 $6,617,549
2014 $1,345,662 $1,065,009 $152,000 $7,766,336
2013 $1,220,744 $950,000 $100,000 $6,101,360
2012 $1,315,221 $1,060,095 $40,000 $7,245,088
2011 $1,255,212 $1,098,300 $57,750 $3,367,965
2010 $1,584,120 $1,122,000 $13,642 $10,298,586
2009 $1,564,273 $1,206,662 $223,877 $8,238,246
2008 $2,016,214 $1,167,645 $202,293 $27,223,798
2007 $2,260,741 $1,360,000 $750,000 $25,615,987
2006 $1,683,252 $1,005,890 $100,000 $15,833,577
2005 $1,364,295 $1,000,000 $75,000 $13,892,889
2004 $1,293,093
$1,671,608
$900,000
$911,803
$126,000 $13,400,000 $17,980,437
2003 $1,102,603
$1,283,330
$725,000
$735,129
$88,000 $12,381,000
2002 $902,969
$937,347
$468,011
$475,000
$50,000 $10,944,000
2001 $769,125
$871,389
$377,936
$386,805
$73,000 $6,239,739
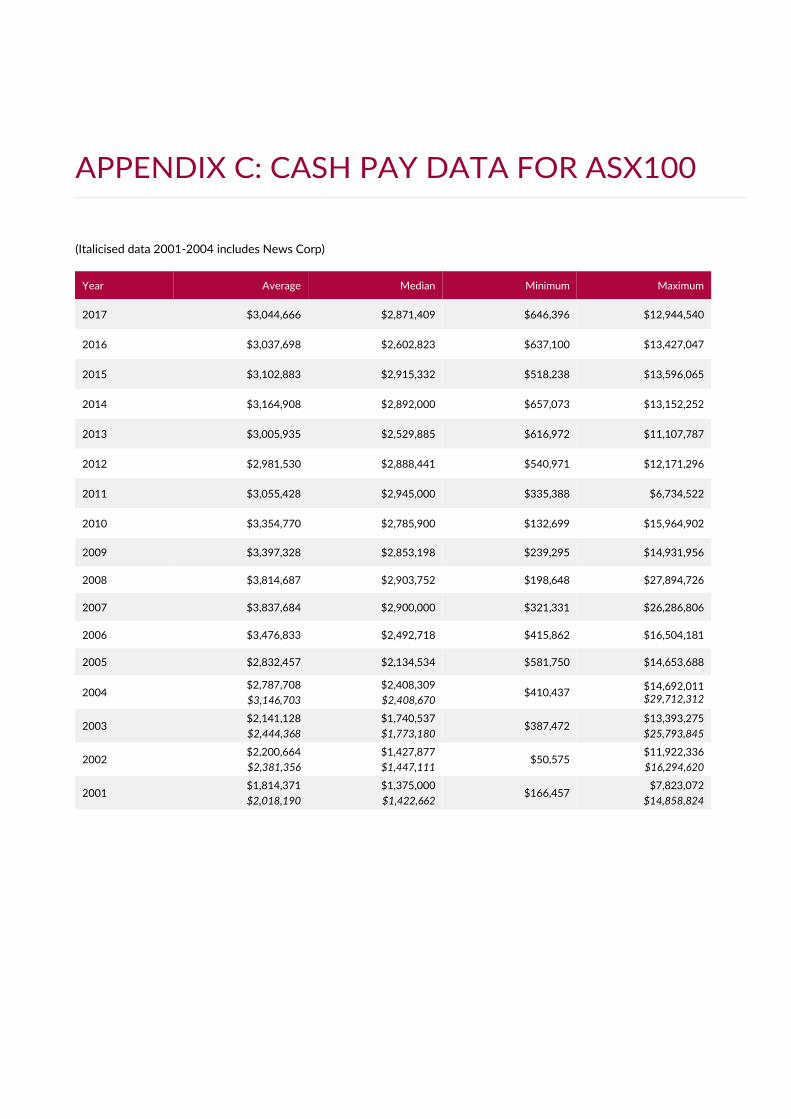
APPENDIX C: CASH PAY DATA FOR ASX100
(Italicised data 2001-2004 includes News Corp)
Year Average Median Minimum Maximum
2017 $3,044,666 $2,871,409 $646,396 $12,944,540
2016 $3,037,698 $2,602,823 $637,100 $13,427,047
2015 $3,102,883 $2,915,332 $518,238 $13,596,065
2014 $3,164,908 $2,892,000 $657,073 $13,152,252
2013 $3,005,935 $2,529,885 $616,972 $11,107,787
2012 $2,981,530 $2,888,441 $540,971 $12,171,296
2011 $3,055,428 $2,945,000 $335,388 $6,734,522
2010 $3,354,770 $2,785,900 $132,699 $15,964,902
2009 $3,397,328 $2,853,198 $239,295 $14,931,956
2008 $3,814,687 $2,903,752 $198,648 $27,894,726
2007 $3,837,684 $2,900,000 $321,331 $26,286,806
2006 $3,476,833 $2,492,718 $415,862 $16,504,181
2005 $2,832,457 $2,134,534 $581,750 $14,653,688
2004 $2,787,708
$3,146,703
$2,408,309
$2,408,670 $410,437
$14,692,011 $29,712,312
2003 $2,141,128
$2,444,368
$1,740,537
$1,773,180 $387,472
$13,393,275
$25,793,845
2002 $2,200,664
$2,381,356
$1,427,877
$1,447,111 $50,575
$11,922,336
$16,294,620
2001 $1,814,371
$2,018,190
$1,375,000
$1,422,662 $166,457
$7,823,072
$14,858,824

34 | CEO PAY IN ASX200 COMPANIES: JULY 2018
APPENDIX D: REPORTED PAY DATA FOR ASX100
(Italicised data 2001-2004 includes News Corp)
Year Average Median Minimum Maximum
2017 $5,544,284 $4,728,890 $646,396 $23,566,967
2016 $5,164,722 $4,196,435 $637,100 $21,572,743
2015 $4,992,943 $4,066,225 $518,238 $21,706,636
2014 $5,008,869 $4,195,278 $657,073 $22,088,011
2013 $4,843,607 $4,155,693 $616,972 $19,110,336
2012 $4,705,093 $3,985,254 $540,791 $21,105,291
2011 $4,724,758 $4,517,815 $426,542 $11,803,992
2010 $4,991,319 $4,388,073 $132,699 $16,157,746
2009 $4,924,256 $4,039,748 -$961,853 $14,931,956
2008 $5,162,441 $4,049,293 $198,648 $24,755,444
2007 $5,540,815 $4,168,554 $404,062 $33,489,818
2006 $4,561,393 $3,274,675 $415,862 $21,210,349
2005 $3,766,549 $3,092,576 $659,002 $18,553,566
2004 $3,564,486
$3,913,123
$3,074,837
$3,138,235 $410,437
$14,692,011 $29,712,312
2003 $2,858,343
$3,163,769
$2,309,384
$2,325,692 $387,472
$13,393,275
$26,681,537
2002 $3,059,008
$3,228,695
$2,081,110
$2,098,601 $50,575
$11,922,336
$16,294,620
2001 $2,450,513
$2,644,393
$1,843,987
$2,120,411 $166,457
$11,682,638
$14,858,824


Austra l ian Counci l of Superannuat ion Investors
Level 23
150 Lonsdale Street
Melbourne VIC 3000
Austra l ia
P: +61 38677 3890
E : info@acs i .org. au
W: www.acs i .org.au


![CEO pay Q[1] · When an owner that controls the firm serves also as its CEO, this owner-CEO can pay himself inflated unjustified pay. Any such excessive compensation to the owner](https://img.dokumen.tips/doc/110x75/5ec229311ed38d58ed33ab2c/ceo-pay-q1-when-an-owner-that-controls-the-firm-serves-also-as-its-ceo-this-owner-ceo.jpg)