Embed Size (px)
Citation preview
Advanced Review
Comparison of synthetic naturalgas production pathways for thestorage of renewable energySebastian Fendt,* Alexander Buttler, Matthias Gaderer and Hartmut Spliethoff
The production of synthetic natural gas (SNG) to store renewable energy in achemical energy carrier can be accomplished basically through three main pro-duction pathways: the biochemical (biogas upgrade), thermochemical (gasifica-tion and synthesis gas upgrade) and electrochemical (‘Power-to-Gas’) pathway.The technologies applied in these concepts are described and the three pathwaysare compared in terms of their state of development, efficiencies, and economics.While the biochemical pathway is already established on a commercial scale, thethermochemical and electrochemical routes are still in the pilot-plant phase. Bio-chemical production of SNG reaches efficiencies in the range of 55–57% but witha potential of above 80%. In comparison, higher efficiencies of up to 70% for thethermochemical pathway are currently expected, with future improvement up to75%. Electrochemical production achieves efficiencies in the range of 54–60%with expected potential up to 78%. Therefore at the moment the highest efficien-cies are given for the thermochemical pathway followed by the electrochemicaland biochemical pathways. Economic evaluation is done by comparing specificproduction costs as well as mean specific investment costs for SNG. Generallyspeaking, specific production and investment costs decrease with time horizonand increasing scale of the plant. Specific production cost levels in €ct/kWhSNG
vary between 5.9 and 13.7 (biochemical), 5.6 and 37 (thermochemical), and 8.2and 93 (electrochemical). Thus, none of the concepts can compete with today’snatural gas prices, but all options are able to provide valuable assistance for asustainable transition of the energy system. © 2015 John Wiley & Sons, Ltd
How to cite this article:WIREs Energy Environ 2015. doi: 10.1002/wene.189
INTRODUCTION
In 2009, the G8 countries agreed to reduce green-house gas emissions by 2050 by 80% or more
against 1990 levels.1 The long-term transition towarda renewable energy based system is the basis forreaching these ambitious goals. Thereby SNG pro-duced from renewable energy sources can play a keyrole for greenhouse gas reduction as well as in
guaranteeing the security of supply by balancing theincreasing volatile energy supply of wind andPV. SNG benefits from an existing well-developedinfrastructure for storage, distribution, and utiliza-tion. Currently, there are 688 underground gas stor-age facilities in operation at worldwide level with astorage capacity of about 990 TWh in Europe and1520 TWh in North America, which is in the rangeof 30–35% of the respective energy consumption peryear.2,3
Owing to its storage and distribution potential,the natural gas infrastructure allows a decentralizedregenerative production of SNG from biomass forflexible utilization in internal combustion engines orhighly efficient combined cycle power plants withoptional combined heat and power production. In
*Correspondence to: [email protected]
Institute for Energy Systems, Technische Universität München,München, Germany
Conflict of interest: The authors have declared no conflicts of inter-est for this article.
© 2015 John Wiley & Sons, Ltd
the long term, SNG produced via water electrolysisand methanation can also serve as seasonal storagefor excess electricity from wind and PV when regen-erative supply exceeds demand.4 Germany is playinga pioneering role in the commercialisation of this so-called Power-to-Gas (PtG) technology due to itsambitious goal of achieving an 80% share of renew-ables in gross electricity generation by 20505 with anexpected need for energy storage in the GWrange.6–8 Owing to its high energy density of 1200kWh/Nm3 (at 200 bar) compared to compressed airwith 6.9 kWh/Nm3 or pumped hydro storages with0.23 kWh/Nm3 SNG is especially suitable for sea-sonal storage.9
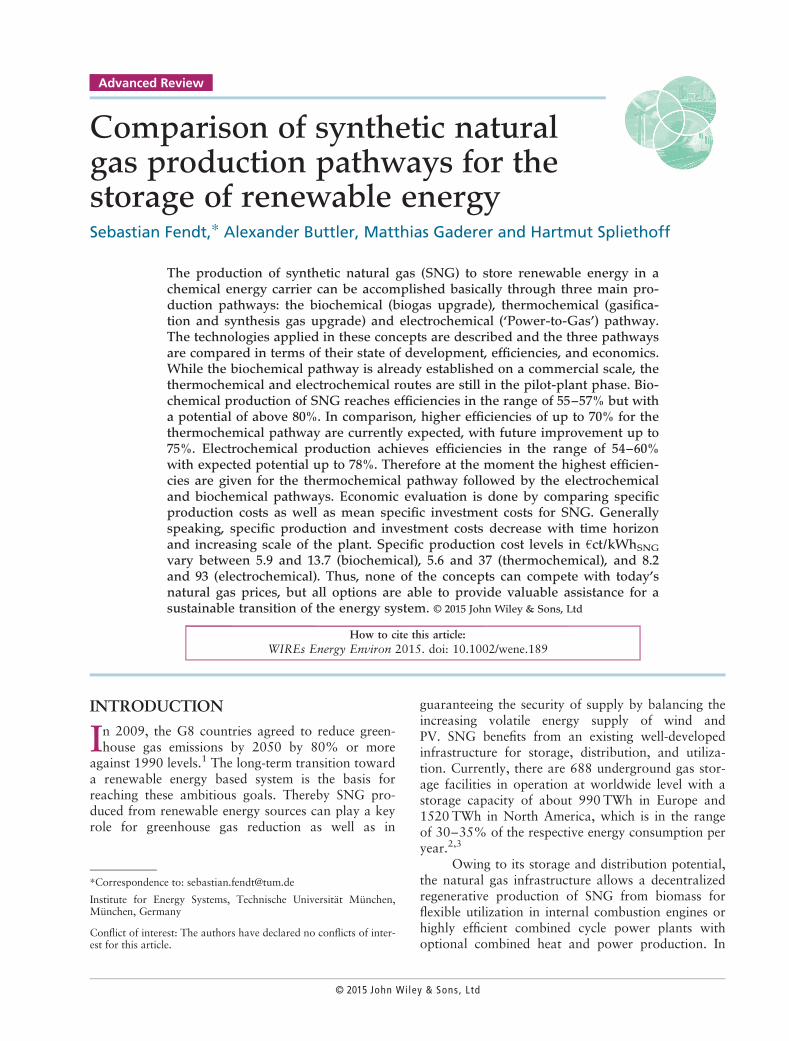
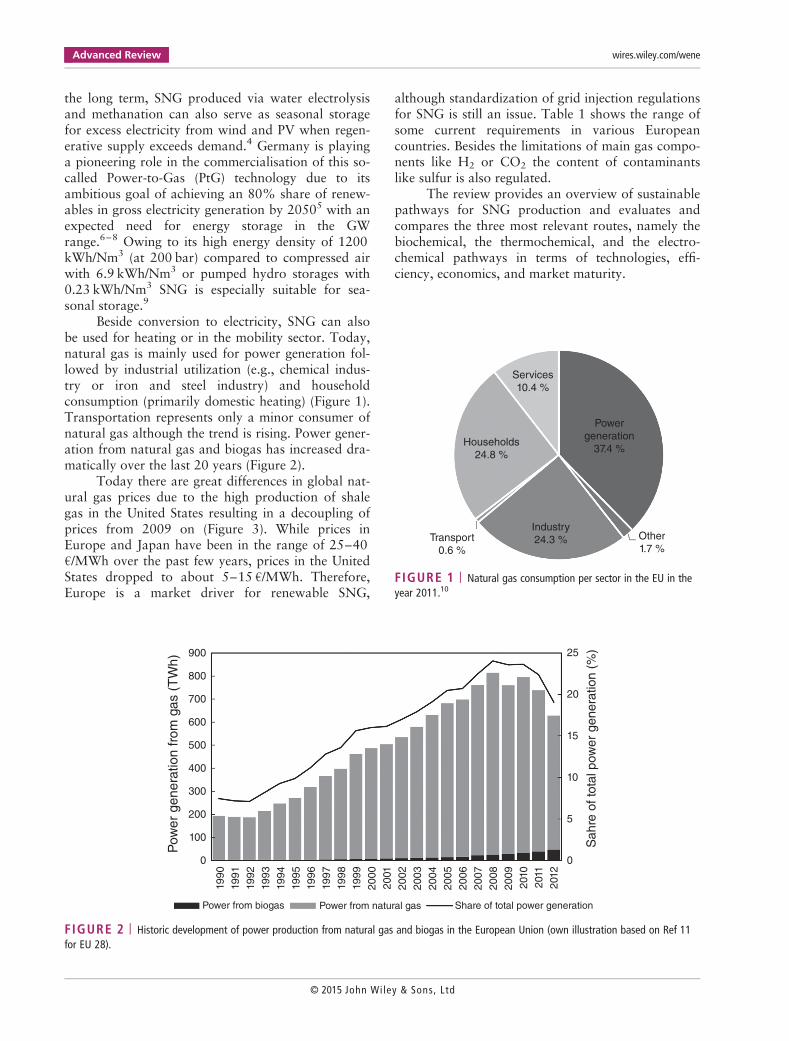
Beside conversion to electricity, SNG can alsobe used for heating or in the mobility sector. Today,natural gas is mainly used for power generation fol-lowed by industrial utilization (e.g., chemical indus-try or iron and steel industry) and householdconsumption (primarily domestic heating) (Figure 1).Transportation represents only a minor consumer ofnatural gas although the trend is rising. Power gener-ation from natural gas and biogas has increased dra-matically over the last 20 years (Figure 2).
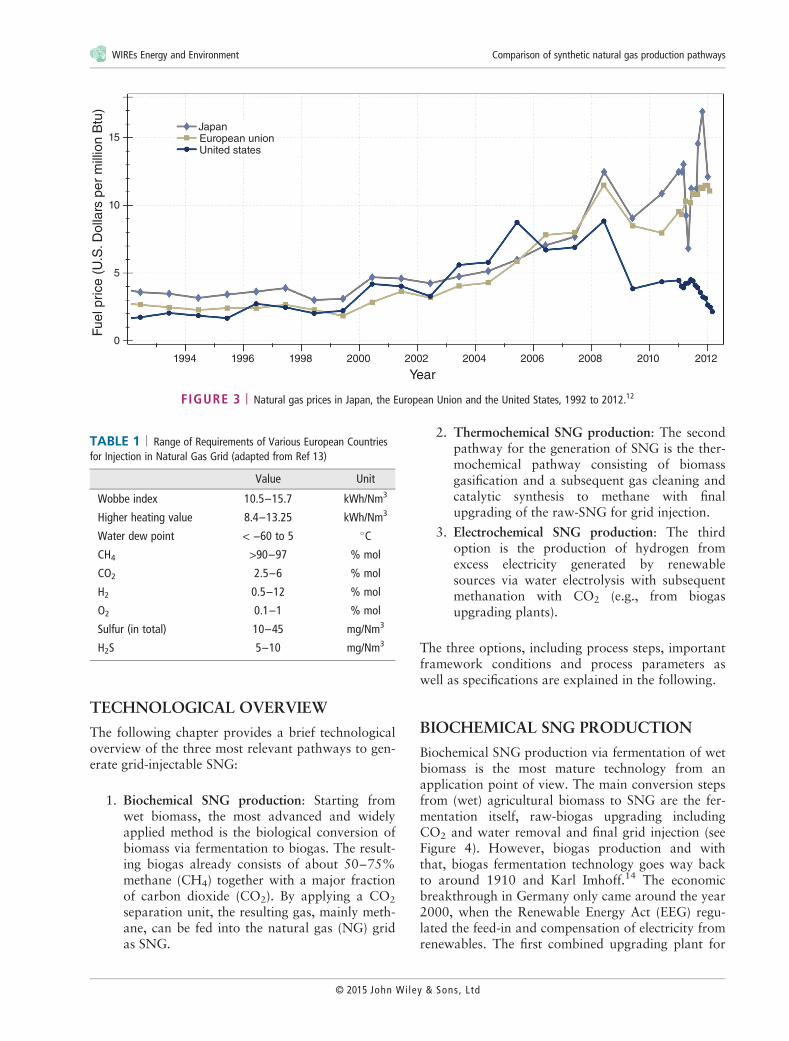
Today there are great differences in global nat-ural gas prices due to the high production of shalegas in the United States resulting in a decoupling ofprices from 2009 on (Figure 3). While prices inEurope and Japan have been in the range of 25–40€/MWh over the past few years, prices in the UnitedStates dropped to about 5–15 €/MWh. Therefore,Europe is a market driver for renewable SNG,
although standardization of grid injection regulationsfor SNG is still an issue. Table 1 shows the range ofsome current requirements in various Europeancountries. Besides the limitations of main gas compo-nents like H2 or CO2 the content of contaminantslike sulfur is also regulated.
The review provides an overview of sustainablepathways for SNG production and evaluates andcompares the three most relevant routes, namely thebiochemical, the thermochemical, and the electro-chemical pathways in terms of technologies, effi-ciency, economics, and market maturity.
Households
24.8 %
Services
10.4 %
Powergeneration
37.4 %
Industry
24.3 %Transport
0.6 %
Other
1.7 %
FIGURE 1 | Natural gas consumption per sector in the EU in theyear 2011.10
900
800
700
600
500
400
300
200
100
0
Power from biogas Power from natural gas Share of total power generation
Sahre
of to
tal pow
er
genera
tion (
%)
Pow
er
genera
tion fro
m g
as (
TW
h)
0
5
10
15
20
25
1990
1991
1992
1993
1994
1995
1996
1997
1998
1999
2000
2001
2002
2003
2004
2005
2006
2007
2008
2009
2010
2011
2012
FIGURE 2 | Historic development of power production from natural gas and biogas in the European Union (own illustration based on Ref 11for EU 28).
Advanced Review wires.wiley.com/wene
© 2015 John Wiley & Sons, Ltd
TECHNOLOGICAL OVERVIEW
The following chapter provides a brief technologicaloverview of the three most relevant pathways to gen-erate grid-injectable SNG:
1. Biochemical SNG production: Starting fromwet biomass, the most advanced and widelyapplied method is the biological conversion ofbiomass via fermentation to biogas. The result-ing biogas already consists of about 50–75%methane (CH4) together with a major fractionof carbon dioxide (CO2). By applying a CO2
separation unit, the resulting gas, mainly meth-ane, can be fed into the natural gas (NG) gridas SNG.
2. Thermochemical SNG production: The secondpathway for the generation of SNG is the ther-mochemical pathway consisting of biomassgasification and a subsequent gas cleaning andcatalytic synthesis to methane with finalupgrading of the raw-SNG for grid injection.
3. Electrochemical SNG production: The thirdoption is the production of hydrogen fromexcess electricity generated by renewablesources via water electrolysis with subsequentmethanation with CO2 (e.g., from biogasupgrading plants).
The three options, including process steps, importantframework conditions and process parameters aswell as specifications are explained in the following.
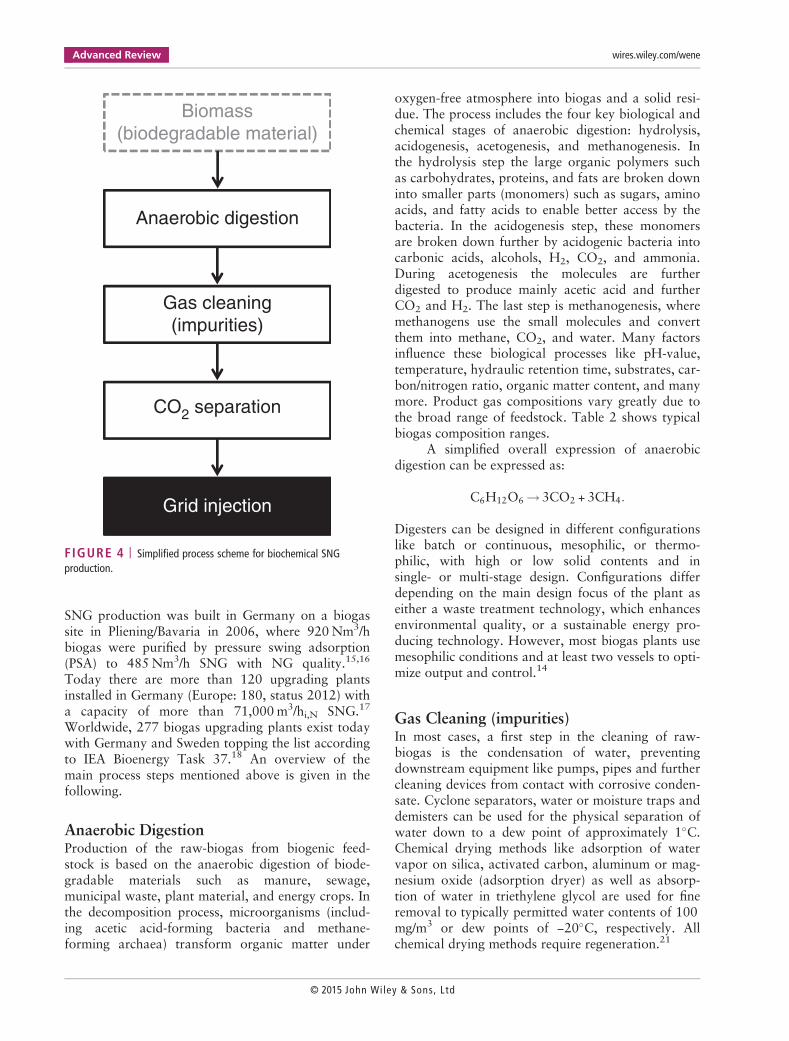
BIOCHEMICAL SNG PRODUCTION
Biochemical SNG production via fermentation of wetbiomass is the most mature technology from anapplication point of view. The main conversion stepsfrom (wet) agricultural biomass to SNG are the fer-mentation itself, raw-biogas upgrading includingCO2 and water removal and final grid injection (seeFigure 4). However, biogas production and withthat, biogas fermentation technology goes way backto around 1910 and Karl Imhoff.14 The economicbreakthrough in Germany only came around the year2000, when the Renewable Energy Act (EEG) regu-lated the feed-in and compensation of electricity fromrenewables. The first combined upgrading plant for
15
10
5
0
1994 1996 1998 2000 2002
Year
JapanEuropean unionUnited states
Fuel pri
ce (
U.S
. D
olla
rs p
er
mill
ion B
tu)
2004 2006 2008 2010 2012
FIGURE 3 | Natural gas prices in Japan, the European Union and the United States, 1992 to 2012.12
TABLE 1 | Range of Requirements of Various European Countriesfor Injection in Natural Gas Grid (adapted from Ref 13)
Value Unit
Wobbe index 10.5–15.7 kWh/Nm3
Higher heating value 8.4–13.25 kWh/Nm3
Water dew point < −60 to 5 �C
CH4 >90–97 % mol
CO2 2.5–6 % mol
H2 0.5–12 % mol
O2 0.1–1 % mol
Sulfur (in total) 10–45 mg/Nm3
H2S 5–10 mg/Nm3
WIREs Energy and Environment Comparison of synthetic natural gas production pathways
© 2015 John Wiley & Sons, Ltd
SNG production was built in Germany on a biogassite in Pliening/Bavaria in 2006, where 920Nm3/hbiogas were purified by pressure swing adsorption(PSA) to 485Nm3/h SNG with NG quality.15,16
Today there are more than 120 upgrading plantsinstalled in Germany (Europe: 180, status 2012) witha capacity of more than 71,000m3/hi,N SNG.17
Worldwide, 277 biogas upgrading plants exist todaywith Germany and Sweden topping the list accordingto IEA Bioenergy Task 37.18 An overview of themain process steps mentioned above is given in thefollowing.
Anaerobic DigestionProduction of the raw-biogas from biogenic feed-stock is based on the anaerobic digestion of biode-gradable materials such as manure, sewage,municipal waste, plant material, and energy crops. Inthe decomposition process, microorganisms (includ-ing acetic acid-forming bacteria and methane-forming archaea) transform organic matter under
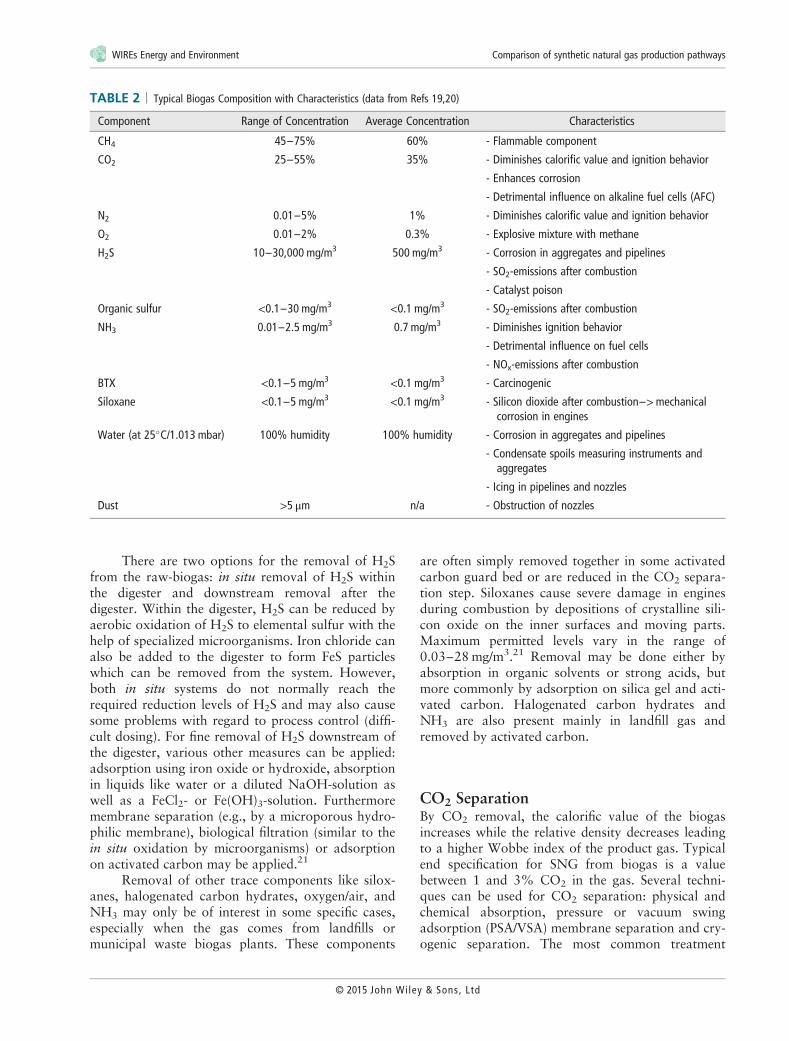
oxygen-free atmosphere into biogas and a solid resi-due. The process includes the four key biological andchemical stages of anaerobic digestion: hydrolysis,acidogenesis, acetogenesis, and methanogenesis. Inthe hydrolysis step the large organic polymers suchas carbohydrates, proteins, and fats are broken downinto smaller parts (monomers) such as sugars, aminoacids, and fatty acids to enable better access by thebacteria. In the acidogenesis step, these monomersare broken down further by acidogenic bacteria intocarbonic acids, alcohols, H2, CO2, and ammonia.During acetogenesis the molecules are furtherdigested to produce mainly acetic acid and furtherCO2 and H2. The last step is methanogenesis, wheremethanogens use the small molecules and convertthem into methane, CO2, and water. Many factorsinfluence these biological processes like pH-value,temperature, hydraulic retention time, substrates, car-bon/nitrogen ratio, organic matter content, and manymore. Product gas compositions vary greatly due tothe broad range of feedstock. Table 2 shows typicalbiogas composition ranges.
A simplified overall expression of anaerobicdigestion can be expressed as:
C6H12O6 ! 3CO2 + 3CH4:
Digesters can be designed in different configurationslike batch or continuous, mesophilic, or thermo-philic, with high or low solid contents and insingle- or multi-stage design. Configurations differdepending on the main design focus of the plant aseither a waste treatment technology, which enhancesenvironmental quality, or a sustainable energy pro-ducing technology. However, most biogas plants usemesophilic conditions and at least two vessels to opti-mize output and control.14
Gas Cleaning (impurities)In most cases, a first step in the cleaning of raw-biogas is the condensation of water, preventingdownstream equipment like pumps, pipes and furthercleaning devices from contact with corrosive conden-sate. Cyclone separators, water or moisture traps anddemisters can be used for the physical separation ofwater down to a dew point of approximately 1�C.Chemical drying methods like adsorption of watervapor on silica, activated carbon, aluminum or mag-nesium oxide (adsorption dryer) as well as absorp-tion of water in triethylene glycol are used for fineremoval to typically permitted water contents of 100mg/m3 or dew points of −20�C, respectively. Allchemical drying methods require regeneration.21
Biomass(biodegradable material)
Anaerobic digestion
Gas cleaning(impurities)
CO2 separation
Grid injection
FIGURE 4 | Simplified process scheme for biochemical SNGproduction.
Advanced Review wires.wiley.com/wene
© 2015 John Wiley & Sons, Ltd
There are two options for the removal of H2Sfrom the raw-biogas: in situ removal of H2S withinthe digester and downstream removal after thedigester. Within the digester, H2S can be reduced byaerobic oxidation of H2S to elemental sulfur with thehelp of specialized microorganisms. Iron chloride canalso be added to the digester to form FeS particleswhich can be removed from the system. However,both in situ systems do not normally reach therequired reduction levels of H2S and may also causesome problems with regard to process control (diffi-cult dosing). For fine removal of H2S downstream ofthe digester, various other measures can be applied:adsorption using iron oxide or hydroxide, absorptionin liquids like water or a diluted NaOH-solution aswell as a FeCl2- or Fe(OH)3-solution. Furthermoremembrane separation (e.g., by a microporous hydro-philic membrane), biological filtration (similar to thein situ oxidation by microorganisms) or adsorptionon activated carbon may be applied.21
Removal of other trace components like silox-anes, halogenated carbon hydrates, oxygen/air, andNH3 may only be of interest in some specific cases,especially when the gas comes from landfills ormunicipal waste biogas plants. These components
are often simply removed together in some activatedcarbon guard bed or are reduced in the CO2 separa-tion step. Siloxanes cause severe damage in enginesduring combustion by depositions of crystalline sili-con oxide on the inner surfaces and moving parts.Maximum permitted levels vary in the range of0.03–28mg/m3.21 Removal may be done either byabsorption in organic solvents or strong acids, butmore commonly by adsorption on silica gel and acti-vated carbon. Halogenated carbon hydrates andNH3 are also present mainly in landfill gas andremoved by activated carbon.
CO2 SeparationBy CO2 removal, the calorific value of the biogasincreases while the relative density decreases leadingto a higher Wobbe index of the product gas. Typicalend specification for SNG from biogas is a valuebetween 1 and 3% CO2 in the gas. Several techni-ques can be used for CO2 separation: physical andchemical absorption, pressure or vacuum swingadsorption (PSA/VSA) membrane separation and cry-ogenic separation. The most common treatment
TABLE 2 | Typical Biogas Composition with Characteristics (data from Refs 19,20)
Component Range of Concentration Average Concentration Characteristics
CH4 45–75% 60% - Flammable component
CO2 25–55% 35% - Diminishes calorific value and ignition behavior
- Enhances corrosion
- Detrimental influence on alkaline fuel cells (AFC)
N2 0.01–5% 1% - Diminishes calorific value and ignition behavior
O2 0.01–2% 0.3% - Explosive mixture with methane
H2S 10–30,000 mg/m3 500 mg/m3 - Corrosion in aggregates and pipelines
- SO2-emissions after combustion
- Catalyst poison
Organic sulfur <0.1–30 mg/m3 <0.1 mg/m3 - SO2-emissions after combustion
NH3 0.01–2.5 mg/m3 0.7 mg/m3 - Diminishes ignition behavior
- Detrimental influence on fuel cells
- NOx-emissions after combustion
BTX <0.1–5 mg/m3 <0.1 mg/m3 - Carcinogenic
Siloxane <0.1–5 mg/m3 <0.1 mg/m3 - Silicon dioxide after combustion–> mechanicalcorrosion in engines
Water (at 25�C/1.013 mbar) 100% humidity 100% humidity - Corrosion in aggregates and pipelines
- Condensate spoils measuring instruments andaggregates
- Icing in pipelines and nozzles
Dust >5 μm n/a - Obstruction of nozzles
WIREs Energy and Environment Comparison of synthetic natural gas production pathways
© 2015 John Wiley & Sons, Ltd
methods are pressurized water scrubbing (PWS,41%), chemical scrubbing (22%) and PSA (21%).18
Pressurized water scrubbing uses water at ele-vated pressures (10–20 bar) as an absorbent in apacked, gas–liquid counter-flow column. The CH4-rich, upgraded biogas leaves the column at the topstripped of CO2 and also H2S, whereas the ladenwater has to be stripped of the dissolved gas compo-nents also containing CH4 in small amounts andrecycled to the process. At atmospheric pressure,CO2 and H2S are stripped in the desorption columnwith air or steam and released to the environment.Owing to the difference in solubility of CO2 andCH4, separation efficiencies above 97% and CH4
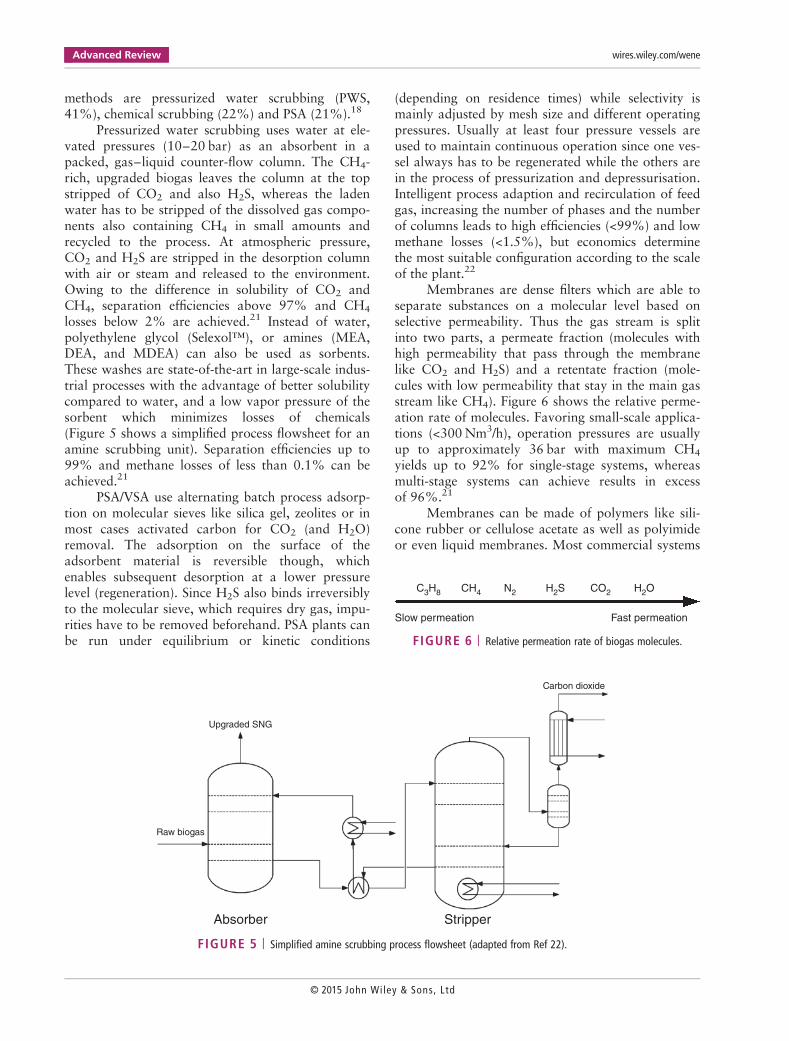
losses below 2% are achieved.21 Instead of water,polyethylene glycol (Selexol™), or amines (MEA,DEA, and MDEA) can also be used as sorbents.These washes are state-of-the-art in large-scale indus-trial processes with the advantage of better solubilitycompared to water, and a low vapor pressure of thesorbent which minimizes losses of chemicals(Figure 5 shows a simplified process flowsheet for anamine scrubbing unit). Separation efficiencies up to99% and methane losses of less than 0.1% can beachieved.21
PSA/VSA use alternating batch process adsorp-tion on molecular sieves like silica gel, zeolites or inmost cases activated carbon for CO2 (and H2O)removal. The adsorption on the surface of theadsorbent material is reversible though, whichenables subsequent desorption at a lower pressurelevel (regeneration). Since H2S also binds irreversiblyto the molecular sieve, which requires dry gas, impu-rities have to be removed beforehand. PSA plants canbe run under equilibrium or kinetic conditions
(depending on residence times) while selectivity ismainly adjusted by mesh size and different operatingpressures. Usually at least four pressure vessels areused to maintain continuous operation since one ves-sel always has to be regenerated while the others arein the process of pressurization and depressurisation.Intelligent process adaption and recirculation of feedgas, increasing the number of phases and the numberof columns leads to high efficiencies (<99%) and lowmethane losses (<1.5%), but economics determinethe most suitable configuration according to the scaleof the plant.22
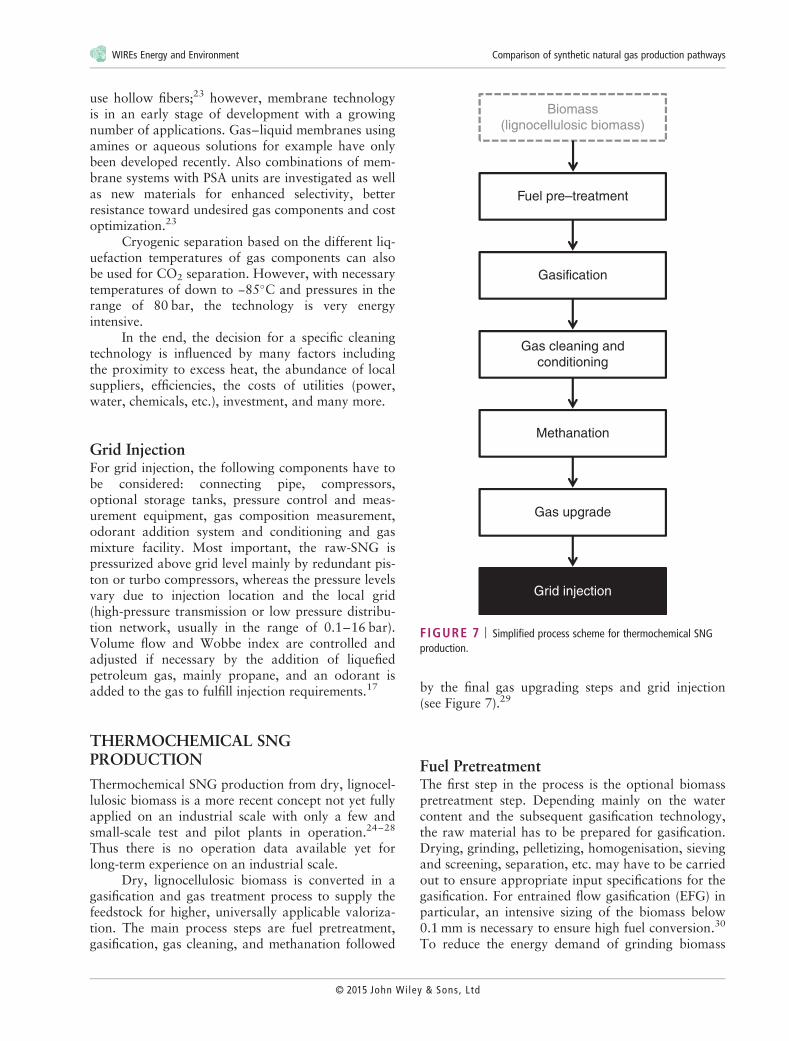
Membranes are dense filters which are able toseparate substances on a molecular level based onselective permeability. Thus the gas stream is splitinto two parts, a permeate fraction (molecules withhigh permeability that pass through the membranelike CO2 and H2S) and a retentate fraction (mole-cules with low permeability that stay in the main gasstream like CH4). Figure 6 shows the relative perme-ation rate of molecules. Favoring small-scale applica-tions (<300Nm3/h), operation pressures are usuallyup to approximately 36 bar with maximum CH4
yields up to 92% for single-stage systems, whereasmulti-stage systems can achieve results in excessof 96%.21
Membranes can be made of polymers like sili-cone rubber or cellulose acetate as well as polyimideor even liquid membranes. Most commercial systems
Upgraded SNG
Carbon dioxide
Raw biogas
Absorber Stripper
FIGURE 5 | Simplified amine scrubbing process flowsheet (adapted from Ref 22).
Slow permeation
C3H8 CH4 CO2H2S H2ON2
Fast permeation
FIGURE 6 | Relative permeation rate of biogas molecules.
Advanced Review wires.wiley.com/wene
© 2015 John Wiley & Sons, Ltd
use hollow fibers;23 however, membrane technologyis in an early stage of development with a growingnumber of applications. Gas–liquid membranes usingamines or aqueous solutions for example have onlybeen developed recently. Also combinations of mem-brane systems with PSA units are investigated as wellas new materials for enhanced selectivity, betterresistance toward undesired gas components and costoptimization.23
Cryogenic separation based on the different liq-uefaction temperatures of gas components can alsobe used for CO2 separation. However, with necessarytemperatures of down to −85�C and pressures in therange of 80 bar, the technology is very energyintensive.
In the end, the decision for a specific cleaningtechnology is influenced by many factors includingthe proximity to excess heat, the abundance of localsuppliers, efficiencies, the costs of utilities (power,water, chemicals, etc.), investment, and many more.
Grid InjectionFor grid injection, the following components have tobe considered: connecting pipe, compressors,optional storage tanks, pressure control and meas-urement equipment, gas composition measurement,odorant addition system and conditioning and gasmixture facility. Most important, the raw-SNG ispressurized above grid level mainly by redundant pis-ton or turbo compressors, whereas the pressure levelsvary due to injection location and the local grid(high-pressure transmission or low pressure distribu-tion network, usually in the range of 0.1–16 bar).Volume flow and Wobbe index are controlled andadjusted if necessary by the addition of liquefiedpetroleum gas, mainly propane, and an odorant isadded to the gas to fulfill injection requirements.17
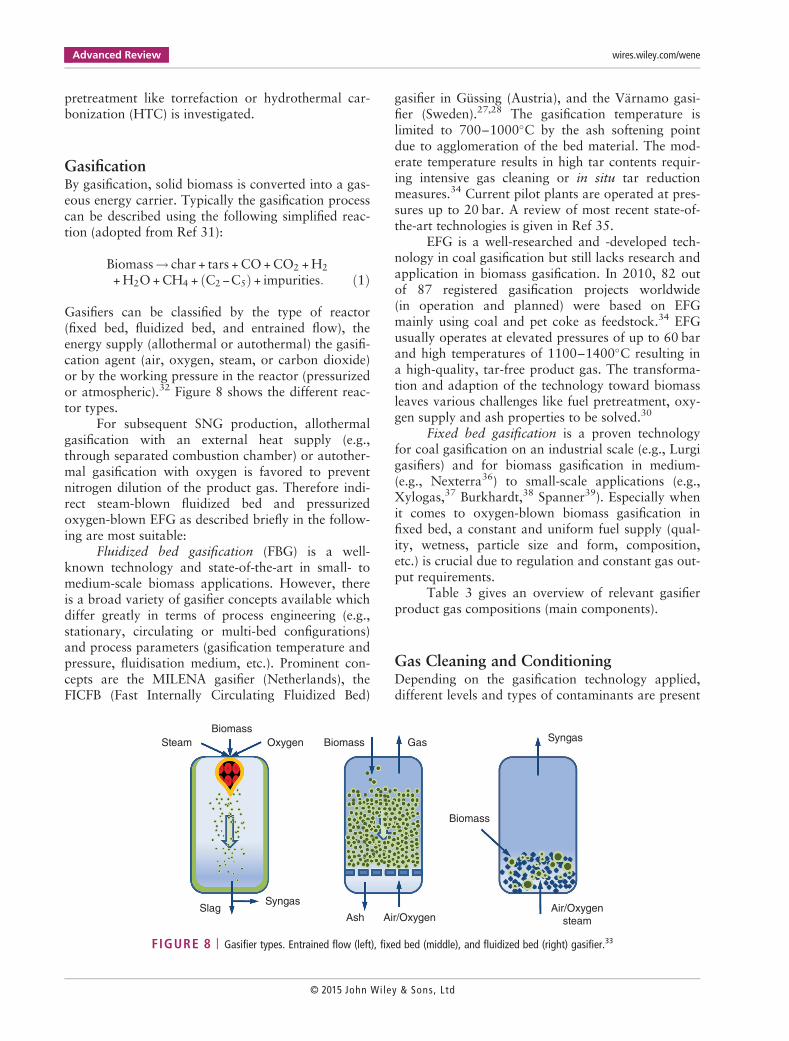
THERMOCHEMICAL SNGPRODUCTION
Thermochemical SNG production from dry, lignocel-lulosic biomass is a more recent concept not yet fullyapplied on an industrial scale with only a few andsmall-scale test and pilot plants in operation.24–28
Thus there is no operation data available yet forlong-term experience on an industrial scale.
Dry, lignocellulosic biomass is converted in agasification and gas treatment process to supply thefeedstock for higher, universally applicable valoriza-tion. The main process steps are fuel pretreatment,gasification, gas cleaning, and methanation followed
by the final gas upgrading steps and grid injection(see Figure 7).29
Fuel PretreatmentThe first step in the process is the optional biomasspretreatment step. Depending mainly on the watercontent and the subsequent gasification technology,the raw material has to be prepared for gasification.Drying, grinding, pelletizing, homogenisation, sievingand screening, separation, etc. may have to be carriedout to ensure appropriate input specifications for thegasification. For entrained flow gasification (EFG) inparticular, an intensive sizing of the biomass below0.1 mm is necessary to ensure high fuel conversion.30
To reduce the energy demand of grinding biomass
Biomass(lignocellulosic biomass)
Fuel pre–treatment
Gasification
Gas cleaning andconditioning
Methanation
Gas upgrade
Grid injection
FIGURE 7 | Simplified process scheme for thermochemical SNGproduction.
WIREs Energy and Environment Comparison of synthetic natural gas production pathways
© 2015 John Wiley & Sons, Ltd
pretreatment like torrefaction or hydrothermal car-bonization (HTC) is investigated.
GasificationBy gasification, solid biomass is converted into a gas-eous energy carrier. Typically the gasification processcan be described using the following simplified reac-tion (adopted from Ref 31):
Biomass! char + tars +CO+CO2 +H2
+H2O+CH4 + C2−C5ð Þ+ impurities: ð1Þ
Gasifiers can be classified by the type of reactor(fixed bed, fluidized bed, and entrained flow), theenergy supply (allothermal or autothermal) the gasifi-cation agent (air, oxygen, steam, or carbon dioxide)or by the working pressure in the reactor (pressurizedor atmospheric).32 Figure 8 shows the different reac-tor types.
For subsequent SNG production, allothermalgasification with an external heat supply (e.g.,through separated combustion chamber) or autother-mal gasification with oxygen is favored to preventnitrogen dilution of the product gas. Therefore indi-rect steam-blown fluidized bed and pressurizedoxygen-blown EFG as described briefly in the follow-ing are most suitable:
Fluidized bed gasification (FBG) is a well-known technology and state-of-the-art in small- tomedium-scale biomass applications. However, thereis a broad variety of gasifier concepts available whichdiffer greatly in terms of process engineering (e.g.,stationary, circulating or multi-bed configurations)and process parameters (gasification temperature andpressure, fluidisation medium, etc.). Prominent con-cepts are the MILENA gasifier (Netherlands), theFICFB (Fast Internally Circulating Fluidized Bed)
gasifier in Güssing (Austria), and the Värnamo gasi-fier (Sweden).27,28 The gasification temperature islimited to 700–1000�C by the ash softening pointdue to agglomeration of the bed material. The mod-erate temperature results in high tar contents requir-ing intensive gas cleaning or in situ tar reductionmeasures.34 Current pilot plants are operated at pres-sures up to 20 bar. A review of most recent state-of-the-art technologies is given in Ref 35.
EFG is a well-researched and -developed tech-nology in coal gasification but still lacks research andapplication in biomass gasification. In 2010, 82 outof 87 registered gasification projects worldwide(in operation and planned) were based on EFGmainly using coal and pet coke as feedstock.34 EFGusually operates at elevated pressures of up to 60 barand high temperatures of 1100–1400�C resulting ina high-quality, tar-free product gas. The transforma-tion and adaption of the technology toward biomassleaves various challenges like fuel pretreatment, oxy-gen supply and ash properties to be solved.30
Fixed bed gasification is a proven technologyfor coal gasification on an industrial scale (e.g., Lurgigasifiers) and for biomass gasification in medium-(e.g., Nexterra36) to small-scale applications (e.g.,Xylogas,37 Burkhardt,38 Spanner39). Especially whenit comes to oxygen-blown biomass gasification infixed bed, a constant and uniform fuel supply (qual-ity, wetness, particle size and form, composition,etc.) is crucial due to regulation and constant gas out-put requirements.
Table 3 gives an overview of relevant gasifierproduct gas compositions (main components).
Gas Cleaning and ConditioningDepending on the gasification technology applied,different levels and types of contaminants are present
Steam
Biomass
Biomass
Biomass
Oxygen
SlagSyngas
Syngas
Ash Air/OxygenAir/Oxygen
steam
Gas
FIGURE 8 | Gasifier types. Entrained flow (left), fixed bed (middle), and fluidized bed (right) gasifier.33
Advanced Review wires.wiley.com/wene
© 2015 John Wiley & Sons, Ltd
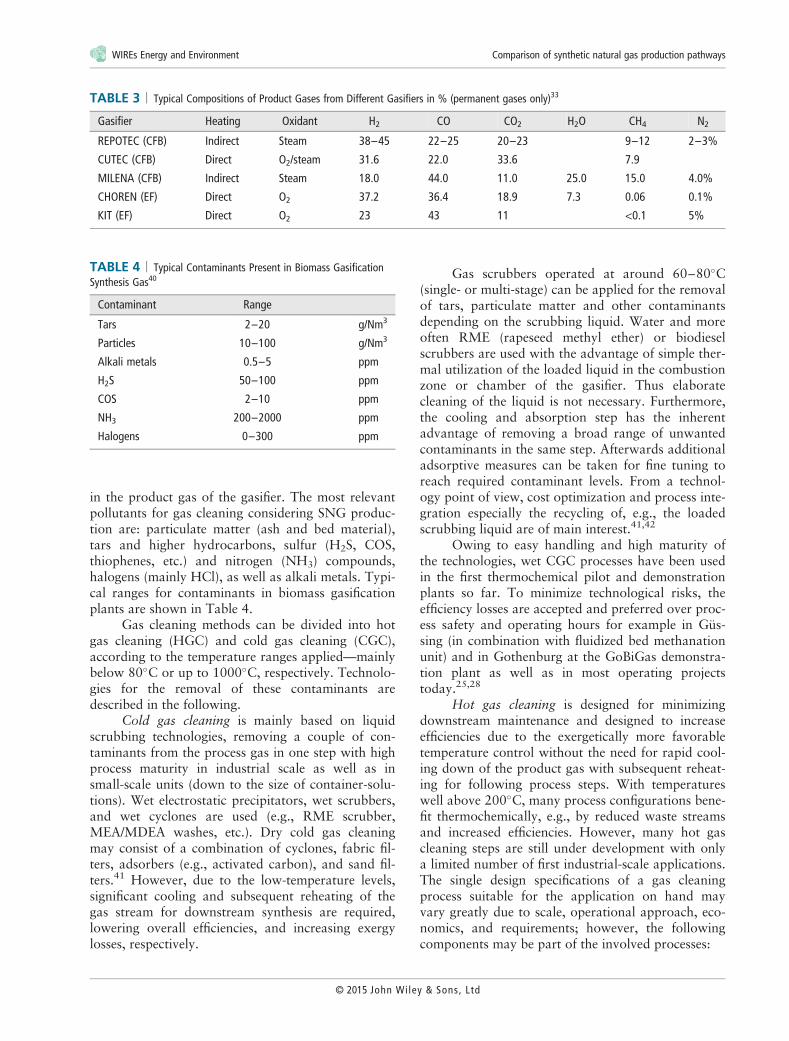
in the product gas of the gasifier. The most relevantpollutants for gas cleaning considering SNG produc-tion are: particulate matter (ash and bed material),tars and higher hydrocarbons, sulfur (H2S, COS,thiophenes, etc.) and nitrogen (NH3) compounds,halogens (mainly HCl), as well as alkali metals. Typi-cal ranges for contaminants in biomass gasificationplants are shown in Table 4.
Gas cleaning methods can be divided into hotgas cleaning (HGC) and cold gas cleaning (CGC),according to the temperature ranges applied—mainlybelow 80�C or up to 1000�C, respectively. Technolo-gies for the removal of these contaminants aredescribed in the following.
Cold gas cleaning is mainly based on liquidscrubbing technologies, removing a couple of con-taminants from the process gas in one step with highprocess maturity in industrial scale as well as insmall-scale units (down to the size of container-solu-tions). Wet electrostatic precipitators, wet scrubbers,and wet cyclones are used (e.g., RME scrubber,MEA/MDEA washes, etc.). Dry cold gas cleaningmay consist of a combination of cyclones, fabric fil-ters, adsorbers (e.g., activated carbon), and sand fil-ters.41 However, due to the low-temperature levels,significant cooling and subsequent reheating of thegas stream for downstream synthesis are required,lowering overall efficiencies, and increasing exergylosses, respectively.
Gas scrubbers operated at around 60–80�C(single- or multi-stage) can be applied for the removalof tars, particulate matter and other contaminantsdepending on the scrubbing liquid. Water and moreoften RME (rapeseed methyl ether) or biodieselscrubbers are used with the advantage of simple ther-mal utilization of the loaded liquid in the combustionzone or chamber of the gasifier. Thus elaboratecleaning of the liquid is not necessary. Furthermore,the cooling and absorption step has the inherentadvantage of removing a broad range of unwantedcontaminants in the same step. Afterwards additionaladsorptive measures can be taken for fine tuning toreach required contaminant levels. From a technol-ogy point of view, cost optimization and process inte-gration especially the recycling of, e.g., the loadedscrubbing liquid are of main interest.41,42
Owing to easy handling and high maturity ofthe technologies, wet CGC processes have been usedin the first thermochemical pilot and demonstrationplants so far. To minimize technological risks, theefficiency losses are accepted and preferred over proc-ess safety and operating hours for example in Güs-sing (in combination with fluidized bed methanationunit) and in Gothenburg at the GoBiGas demonstra-tion plant as well as in most operating projectstoday.25,28
Hot gas cleaning is designed for minimizingdownstream maintenance and designed to increaseefficiencies due to the exergetically more favorabletemperature control without the need for rapid cool-ing down of the product gas with subsequent reheat-ing for following process steps. With temperatureswell above 200�C, many process configurations bene-fit thermochemically, e.g., by reduced waste streamsand increased efficiencies. However, many hot gascleaning steps are still under development with onlya limited number of first industrial-scale applications.The single design specifications of a gas cleaningprocess suitable for the application on hand mayvary greatly due to scale, operational approach, eco-nomics, and requirements; however, the followingcomponents may be part of the involved processes:
TABLE 3 | Typical Compositions of Product Gases from Different Gasifiers in % (permanent gases only)33
Gasifier Heating Oxidant H2 CO CO2 H2O CH4 N2
REPOTEC (CFB) Indirect Steam 38–45 22–25 20–23 9–12 2–3%
CUTEC (CFB) Direct O2/steam 31.6 22.0 33.6 7.9
MILENA (CFB) Indirect Steam 18.0 44.0 11.0 25.0 15.0 4.0%
CHOREN (EF) Direct O2 37.2 36.4 18.9 7.3 0.06 0.1%
KIT (EF) Direct O2 23 43 11 <0.1 5%
TABLE 4 | Typical Contaminants Present in Biomass GasificationSynthesis Gas40
Contaminant Range
Tars 2–20 g/Nm3
Particles 10–100 g/Nm3
Alkali metals 0.5–5 ppm
H2S 50–100 ppm
COS 2–10 ppm
NH3 200–2000 ppm
Halogens 0–300 ppm
WIREs Energy and Environment Comparison of synthetic natural gas production pathways
© 2015 John Wiley & Sons, Ltd
Cyclones are the most commonly used initialseparation devices for raw-gases from gasificationwith up to 99.6% separation efficiency and removallimits down to the μm-range. Simplicity of designwith no moving parts enables high-temperatureapplication limited only by the mechanical strengthof the material. Filtration in the form of barrier filters(e.g., granules, fibres, or porous monolithic struc-tures) is often used downstream of a cyclone. Fabricor rigid filters (e.g., ceramic and metallic candle fil-ters) as well as fixed and moving bed granular filtersor sintered metal filters are applied in many cases,while the filtration effect can be enhanced by pre-coating of the particles (for example with CaO).Recent developments also focus on the incorporationof catalytic active materials into various filter con-structions or the use of electrostatic precipitators(ESPs) at elevated temperatures.42
Alkali components have to be separated eitherby co-removal with other contaminants through con-densation mechanisms (usual condensation rangearound 600–650�C) or with the help of better mate-rials (e.g., natural minerals like bauxite or kaolinite).Tars can be removed (if no sufficient in situ removalwas applied within the gasifier) by thermal or cata-lytic reforming/cracking. In contrast to the CGCoption, the chemical energy content does not leavethe system, resulting in efficiency advantages. Sulfurand chlorine components are removed in most casesby adsorption (in combination with an upstreamhydro desulfurisation unit if necessary).41,42
Depending on the scale, the operation condi-tions and the feedstock of the process, there might bethe need for a CO-shift (water gas shift reaction)upstream of the methanation to adjust the H2/COratio (target for the H2/CO ratio is a stoichiometricvalue of three). Equation (2) shows the water gasshift reaction:
CO+H2O!CO2 +H2 ΔH0R = − 41 kJ=mol: ð2Þ
However, the CO-shift also runs in in situ, parallel tomethanation, which is why it is not regarded sepa-rately in this overview.
MethanationAfter gas cleaning, the methane content has to beincreased to meet grid injection levels. This isachieved by the heterogeneous catalytic methanationprocess where carbon oxides are hydrogenated tomethane. The exothermic reaction is usually cata-lyzed by commercial nickel catalysts, with possiblealternative metals being: Ru, Rh, Pt, Fe, and Co.
CO- and CO2-methanation reactions are givenin Eqs (3) and (4):
3H2CO+CO!CH4 +H2O ΔH0R = −206kJ=mol: ð3Þ
4H2CO+CO2!CH4 +2H2O ΔH0R = −165kJ=mol: ð4Þ
CO2-methanation reaction can also be described bylinear combination of the CO-methanation (Eq. (3))and the reverse water gas shift reaction (back reac-tion of Eq. (2)). In case of a stoichiometric value ofthree or more in the synthesis gas, only CO-methanation (Eq. (3)) will occur, but under normalcircumstances there is a lack of hydrogen in the syn-thesis gas and H2/CO ratios are between 0.3 and2. Thus part of the CO is converted by Eq. (2) toCO2 and additional H2.
Furthermore, the Boudouard reaction (Eq. (5))is important for methanation since carbon deposi-tions are crucial during methanation in two ways:carbon depositions in the form of gum (polymericcarbon) and whisker formation cause catalyst deacti-vation by blocking of the surface and by encapsula-tion of Ni crystallites respectively. However, carbonalso is a necessary intermediate on the catalyst sur-face during hydrogenation.43
2CO!C+CO2 ΔH0R = −173kJ=mol: ð5Þ
As all reactions are exothermic, heat removal is ofgreat importance, influencing thermodynamics, reac-tion mechanisms, and kinetics. For high methaneyields, low temperatures, and high pressures arefavored due to the law of le Chatelier. Deactivationand poisoning of the catalyst (especially Ni catalysts)with regard to, e.g., sulfur species (H2S, COS, thio-phenes, organic sulfur) and chlorine components aswell as other aging and degradation processes haveto be considered.
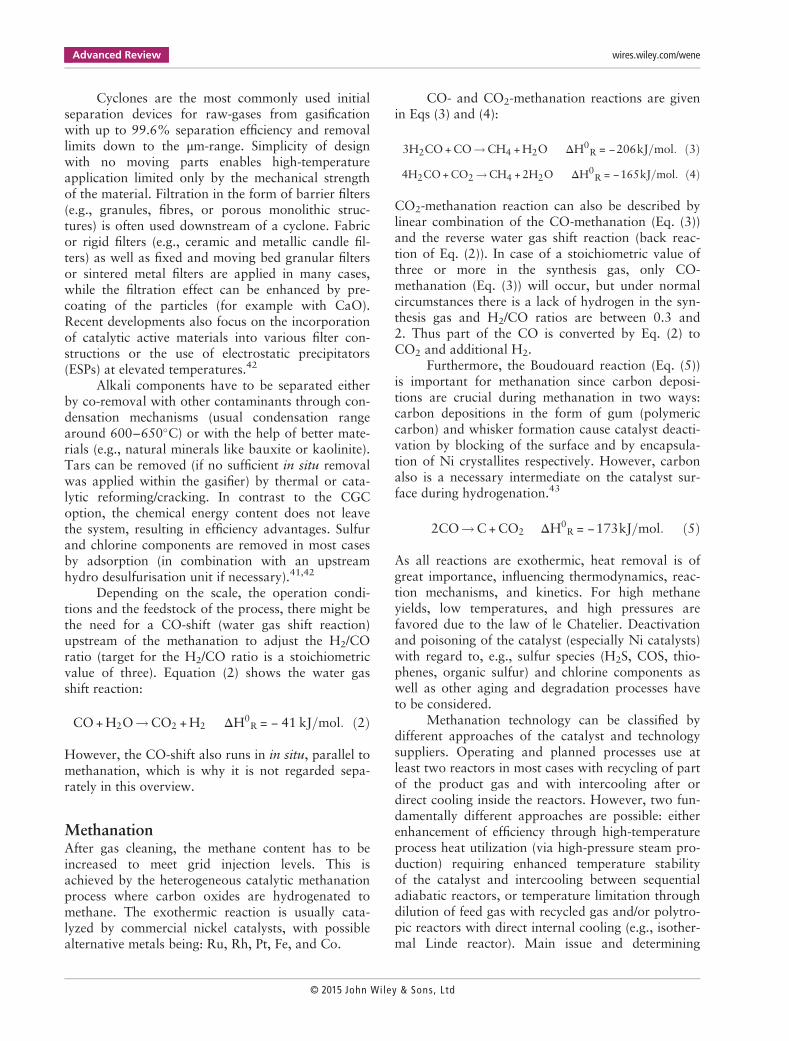
Methanation technology can be classified bydifferent approaches of the catalyst and technologysuppliers. Operating and planned processes use atleast two reactors in most cases with recycling of partof the product gas and with intercooling after ordirect cooling inside the reactors. However, two fun-damentally different approaches are possible: eitherenhancement of efficiency through high-temperatureprocess heat utilization (via high-pressure steam pro-duction) requiring enhanced temperature stabilityof the catalyst and intercooling between sequentialadiabatic reactors, or temperature limitation throughdilution of feed gas with recycled gas and/or polytro-pic reactors with direct internal cooling (e.g., isother-mal Linde reactor). Main issue and determining
Advanced Review wires.wiley.com/wene
© 2015 John Wiley & Sons, Ltd
factor in each case is the development of the appro-priate Ni-catalyst with the required thermal stabilityand performance as well as design of the heatremoval. Methanation process technologies dateback to the 1960s and ‘70s and can be separatedaccording to the applied reactor types: fixed bedmethanation, fluidized bed methanation, liquid-phasemethanation (or three-phase methanation). Favoringfixed bed methanation, the Lurgi methanation proc-ess (Figure 9) and the TREMP process developed byHaldor Topsøe are the most relevant and prominentexamples for fixed bed methanation processes. Flui-dized bed methanation research was carried out, e.g.,by the Bureau of Mines (US), BCR (Bituminous CoalResearch Inc., US), and Thyssengas GmbH(Germany) leading to the different fluidized bed reac-tor concepts with the COMFLUX process(by Thyssengas, University of Karlsruhe and DidierEngineering GmbH) as one of the more well-knownprocesses. Liquid-phase methanation was proposedby ChemSystem Inc. (US) as a promising process dueto enhanced temperature control and easy removal ofprocess heat, but the development activities were ter-minated after a few years.43
The Bio-TREMP methanation technology byHaldor Topsøe (Figure 10) is the only applied tech-nology in combination with biomass gasification(‘Güssing’-type dual fluidized bed gasifier supplied byRepotec), dealing with the specific problems causedby biomass feedstock such as organic sulfur impuri-ties and smaller scale.
However, there are various other research insti-tutes and companies working on different methana-tion technologies and reactor designs in varyingstages of development (see Refs 29,31,43).
Gas Upgrade and Grid InjectionAfter methanation water vapor has to be separatedfrom the product gas which is usually done by con-densation and cooling down of the raw-SNG fromthe methanation unit. Furthermore, surplus CO2 andif required also H2 have to be separated from theproduct gas stream. Technologies for final gasupgrade can vary due to product gas specificationsafter methanation. Membrane technology, scrubbingsystems or adsorption technologies (e.g., PSA) maybe applied (see Biochemical section). Last step in theprocess is the grid injection and the required legalcontrol systems. With no industrial application sofar, exact layout of the necessary measures will mostlikely be similar to those applied for biochemicalSNG injection.
ELECTROCHEMICAL SNGPRODUCTION
Beside the biomass-based options, the electrochemi-cal generation of hydrogen using water electrolysisoffers the possibility of also using wind and solarenergy as feedstock for renewable SNG production.The carbon source in this case is carbon dioxide. Inrecent years, the concept has become popular as apossible long-term energy storage option, balancingdemand and fluctuating supply of wind and solar ina future renewable energy system. A simplifiedscheme of the electrochemical SNG production routealso known as Power-to-Gas concept (PtG) is shownin Figure 11.
Electrical energy from renewable energy sourceslike wind and solar is converted via water electrolysisto hydrogen. In a subsequent step, H2 and CO2 areconverted to CH4. The SNG can be fed into the NGgrid after a final gas upgrade which is mainly waterremoval by condensation and surplus H2 removal bymembrane. The required CO2 can be sequestratedfrom several CO2-neutral sources like biogas produc-tion, biomass gasification, waste incineration, orrecycling from fossil power plants. In addition, theutilization of CO2 from the air has been tested.45
Owing to the utilization of CO2, this technology canbe regarded as alternative to the intensively discussedcarbon capture and sequestration (CCS) technologyefficiently using the CO2 instead of sequestratingit. CO2 and H2 buffer storages allow a decoupling ofthe electrolyser as well as CO2 sequestration fromthe methanation process. The additional conversionstep from H2 to SNG offers the advantages of three-fold higher energy density and an unlimited utiliza-tion of the existing NG infrastructure through feed-in
Water
SNG
Recycle
compressor
Feed R1 R2
FIGURE 9 | Lurgi methanation process flowsheet (adapted fromRef 43).
WIREs Energy and Environment Comparison of synthetic natural gas production pathways
© 2015 John Wiley & Sons, Ltd

of the SNG. While the key processes of the electro-chemical SNG production are well established, thedynamic operation and interaction between the pro-cesses represent a major technical challenge.
ElectrolysisAvailable processes for the electrochemical decompo-sition of water into O2 and H2 are alkaline electroly-sis (AEL) with a concentrated aqueous solution ofKOH (25–30 wt%) as electrolyte, proton exchangemembrane electrolysis (PEMEL) with a polymer elec-trolyte and high-temperature electrolysis (HTEL)with a solid oxide electrolyte (also known as solidoxide electrolysis).
In contrast to the HTEL operation temperatureof 700–1000�C, AEL and PEMEL are operated attemperatures below 100�C. While alkaline and PEMelectrolysis are state-of-the-art technologies (Table 5),HTEL is still in the fundamental research statewith lab-scale systems in the kW-range, sufferingfrom high degradation rates to the order of 3–5%/1000 h.49 AEL is the most mature electrolysistechnology with several industrial-scale plants con-structed especially in the mid of the 20th century.Examples are the plants located in Aswan (Egypt)with a capacity of 32,400Nm3/h (160MW) installedby DEMAG in 1939, in Nangal (India) with a capac-ity of 30,000Nm3/h (142MW) installed by DeNorain 1961 or in Rjukan (Norway) with a capacity of27,000Nm3/h (142MW) commissioned in 1929(decommissioned in 1971) manufactured by Norsk
Feed CO2wash
R1
HP boiler HP boilerSuper-
heater
SNG
Water
Cooling
train
R2 R3 R4
PremethanatorShift
FIGURE 10 | Typical process flowsheet of the Bio-TREMP process by Haldor Topsøe (adapted from Ref 44).
Electricity(excess power)
Electrolysis
Methanation
Gas upgrade
Grid injection
FIGURE 11 | Simplified process scheme for electrochemical SNGproduction.
Advanced Review wires.wiley.com/wene
© 2015 John Wiley & Sons, Ltd
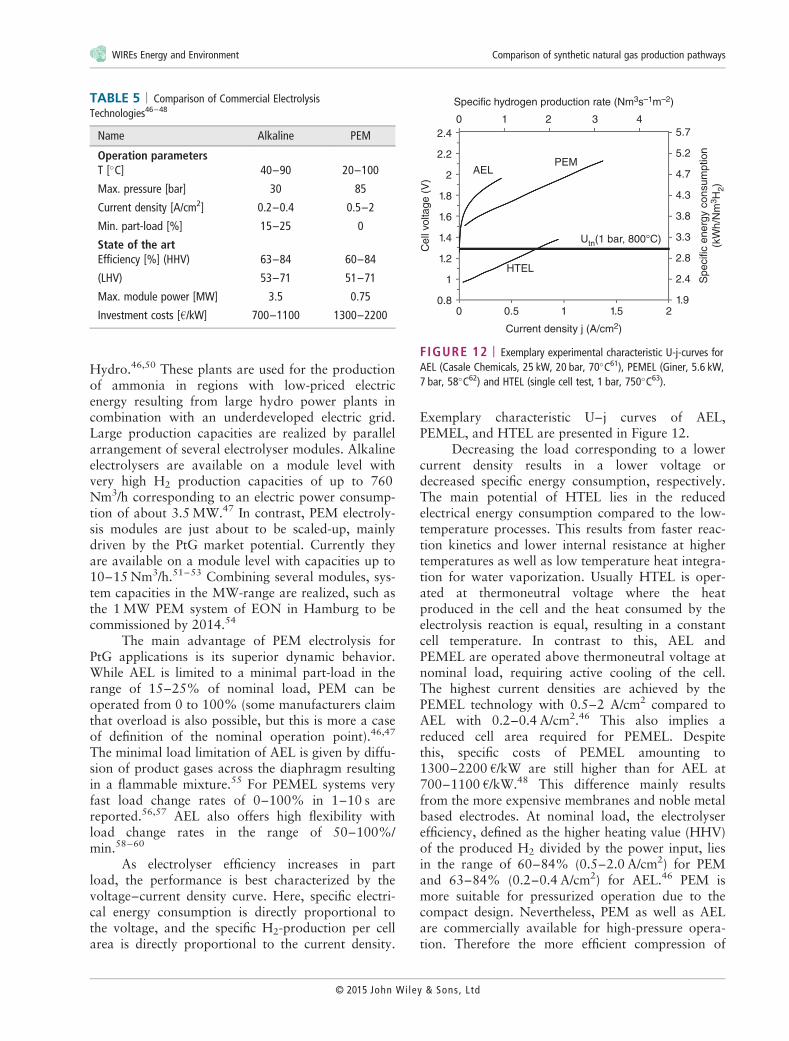
Hydro.46,50 These plants are used for the productionof ammonia in regions with low-priced electricenergy resulting from large hydro power plants incombination with an underdeveloped electric grid.Large production capacities are realized by parallelarrangement of several electrolyser modules. Alkalineelectrolysers are available on a module level withvery high H2 production capacities of up to 760Nm3/h corresponding to an electric power consump-tion of about 3.5MW.47 In contrast, PEM electroly-sis modules are just about to be scaled-up, mainlydriven by the PtG market potential. Currently theyare available on a module level with capacities up to10–15Nm3/h.51–53 Combining several modules, sys-tem capacities in the MW-range are realized, such asthe 1MW PEM system of EON in Hamburg to becommissioned by 2014.54
The main advantage of PEM electrolysis forPtG applications is its superior dynamic behavior.While AEL is limited to a minimal part-load in therange of 15–25% of nominal load, PEM can beoperated from 0 to 100% (some manufacturers claimthat overload is also possible, but this is more a caseof definition of the nominal operation point).46,47
The minimal load limitation of AEL is given by diffu-sion of product gases across the diaphragm resultingin a flammable mixture.55 For PEMEL systems veryfast load change rates of 0–100% in 1–10 s arereported.56,57 AEL also offers high flexibility withload change rates in the range of 50–100%/min.58–60
As electrolyser efficiency increases in partload, the performance is best characterized by thevoltage–current density curve. Here, specific electri-cal energy consumption is directly proportional tothe voltage, and the specific H2-production per cellarea is directly proportional to the current density.
Exemplary characteristic U–j curves of AEL,PEMEL, and HTEL are presented in Figure 12.
Decreasing the load corresponding to a lowercurrent density results in a lower voltage ordecreased specific energy consumption, respectively.The main potential of HTEL lies in the reducedelectrical energy consumption compared to the low-temperature processes. This results from faster reac-tion kinetics and lower internal resistance at highertemperatures as well as low temperature heat integra-tion for water vaporization. Usually HTEL is oper-ated at thermoneutral voltage where the heatproduced in the cell and the heat consumed by theelectrolysis reaction is equal, resulting in a constantcell temperature. In contrast to this, AEL andPEMEL are operated above thermoneutral voltage atnominal load, requiring active cooling of the cell.The highest current densities are achieved by thePEMEL technology with 0.5–2 A/cm2 compared toAEL with 0.2–0.4 A/cm2.46 This also implies areduced cell area required for PEMEL. Despitethis, specific costs of PEMEL amounting to1300–2200 €/kW are still higher than for AEL at700–1100 €/kW.48 This difference mainly resultsfrom the more expensive membranes and noble metalbased electrodes. At nominal load, the electrolyserefficiency, defined as the higher heating value (HHV)of the produced H2 divided by the power input, liesin the range of 60–84% (0.5–2.0 A/cm2) for PEMand 63–84% (0.2–0.4 A/cm2) for AEL.46 PEM ismore suitable for pressurized operation due to thecompact design. Nevertheless, PEM as well as AELare commercially available for high-pressure opera-tion. Therefore the more efficient compression of
TABLE 5 | Comparison of Commercial ElectrolysisTechnologies46–48
Name Alkaline PEM
Operation parametersT [�C] 40–90 20–100
Max. pressure [bar] 30 85
Current density [A/cm2] 0.2–0.4 0.5–2
Min. part-load [%] 15–25 0
State of the artEfficiency [%] (HHV) 63–84 60–84
(LHV) 53–71 51–71
Max. module power [MW] 3.5 0.75
Investment costs [€/kW] 700–1100 1300–2200
2.4
AELPEM
HTEL
Utn(1 bar, 800°C)
2.2
2
1.8
1.6
1.4
1.2
1
0.80
0 1
Specific hydrogen production rate (Nm3s–1m–2)
Cell
voltage (
V)
Specific
energ
y c
onsum
ption
(kW
h/N
m3H
2)
2 3 4
Current density j (A/cm2)
0.5 1 1.5 21.9
2.4
2.8
3.3
3.8
4.3
4.7
5.2
5.7
FIGURE 12 | Exemplary experimental characteristic U-j-curves forAEL (Casale Chemicals, 25 kW, 20 bar, 70�C61), PEMEL (Giner, 5.6 kW,7 bar, 58�C62) and HTEL (single cell test, 1 bar, 750�C63).
WIREs Energy and Environment Comparison of synthetic natural gas production pathways
© 2015 John Wiley & Sons, Ltd
liquid water can replace the subsequent effort forcompression of the product gas.
CO2-methanationMethanation of CO2 and H2 basically applies thesame processes as described before in the synthesisgas methanation section. The main differences are alower reactivity of the CO2-methanation reactioncompared to CO-methanation and a reduced produc-tion of reaction heat, facilitating reactor cooling (seeEqs (3) and (4)). In multi-stage fixed bed processesexperience of CO2 methanation has already beengained from the conversion of synthesis gases. Whilethe complete CO is converted in the first stages, CO2
conversion takes place in the last stages in absence ofCO.64,65 Experiments focusing on CO2-methanationwere conducted in pilot-scale and lab-scale plants bythe Centre for Solar Energy and Hydrogen Research(ZSW) for fixed bed methanation60,66 and by theEngler-Bunte-Institute for three-phase methanation.9
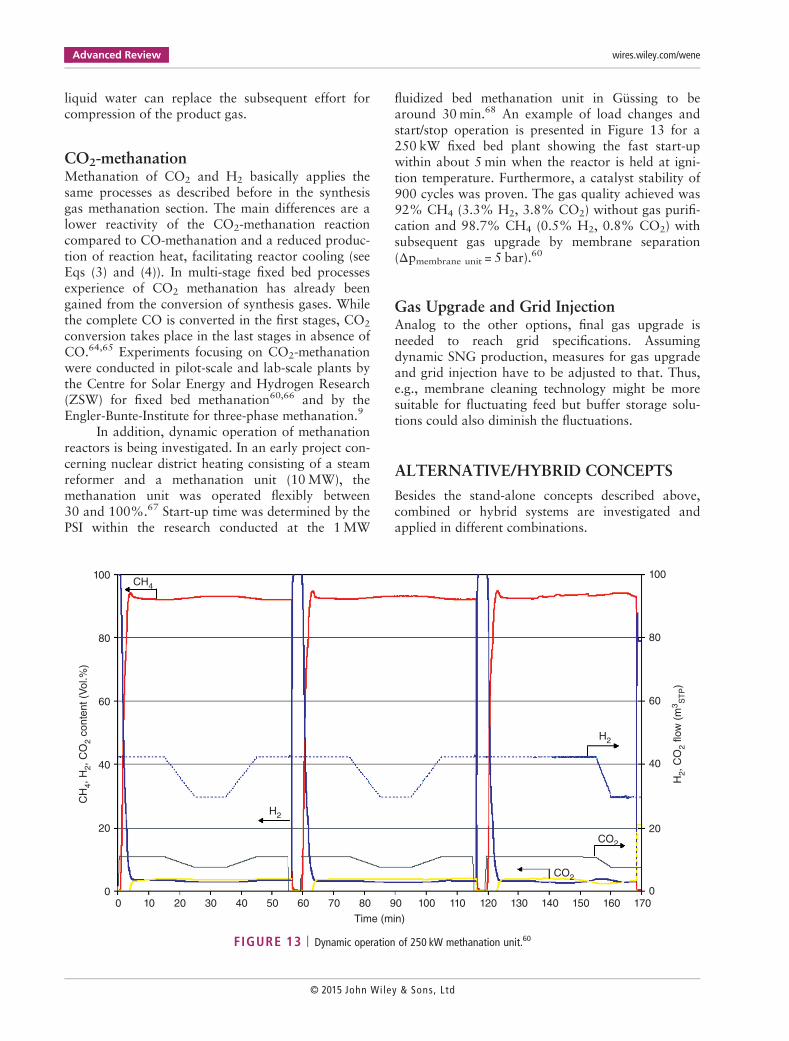
In addition, dynamic operation of methanationreactors is being investigated. In an early project con-cerning nuclear district heating consisting of a steamreformer and a methanation unit (10MW), themethanation unit was operated flexibly between30 and 100%.67 Start-up time was determined by thePSI within the research conducted at the 1MW
fluidized bed methanation unit in Güssing to bearound 30min.68 An example of load changes andstart/stop operation is presented in Figure 13 for a250 kW fixed bed plant showing the fast start-upwithin about 5 min when the reactor is held at igni-tion temperature. Furthermore, a catalyst stability of900 cycles was proven. The gas quality achieved was92% CH4 (3.3% H2, 3.8% CO2) without gas purifi-cation and 98.7% CH4 (0.5% H2, 0.8% CO2) withsubsequent gas upgrade by membrane separation(Δpmembrane unit = 5 bar).60
Gas Upgrade and Grid InjectionAnalog to the other options, final gas upgrade isneeded to reach grid specifications. Assumingdynamic SNG production, measures for gas upgradeand grid injection have to be adjusted to that. Thus,e.g., membrane cleaning technology might be moresuitable for fluctuating feed but buffer storage solu-tions could also diminish the fluctuations.
ALTERNATIVE/HYBRID CONCEPTS
Besides the stand-alone concepts described above,combined or hybrid systems are investigated andapplied in different combinations.
100CH4
H2
H2
CO2
CO2
80
60
40
CH
4, H
2, C
O2 c
onte
nt
(Vol.%
)
H2, C
O2 flo
w (
m3S
TP)
20
00 10 20 30 40 50 60 70 80 90 100
Time (min)
110 120 130 140 150 160 1700
20
40
60
80
100
FIGURE 13 | Dynamic operation of 250 kW methanation unit.60
Advanced Review wires.wiley.com/wene
© 2015 John Wiley & Sons, Ltd
Biochemical Pathway with Excess PowerIntegrationFor example, the electrochemical SNG productionpathway is usually combined with a biochemicalSNG production. Therefore the separated CO2 fromthe biogas upgrading unit can be utilized as educt gasfor the methanation unit with H2 from the electroly-sis unit. This has a great synergy effect in that it usesthe CO2 which is normally blown into the atmos-phere as a valuable, clean educt for the second proc-ess. Heat from the methanation can in return be usedfor the initial CO2 separation (e.g., in the form ofheat for the stripper column to regenerate the aminewash). This combination of biogas upgrading plantsand electrolysis unit is used in most operating andplanned PtG plants.
It is also proposed to combine the two pro-cesses in such a way that H2 from electrolysis isdirectly injected into the digester (or a seconddigester/fermenter) to hydrogenate the remainingCO2 in situ in the biogas, thus saving the subsequentseparation unit. However, this direct methanationconcept is still at the research stage, with problemssuch as the distribution and solution of H2 in the fer-menter still to be solved.69
Thermochemical Pathway with ExcessPower IntegrationThe combination of thermochemical SNG productionwith excess power integration (electrochemical SNGproduction) also has some advantages. Here both,the H2 (e.g., in the methanation unit) as well as theO2 from the electrolysis unit (e.g., as replacement forthe air separation unit or to enable catalytic tarcracking via partial oxidation) can be used in a veryefficient way within the thermochemical SNG pro-duction process.
Process simulations have shown that in small-scale applications, the integration of an electrolysisunit into the process can have efficiency synergiesdue to heat integration and reduced complexity ofboth processes. It has been shown that the integra-tion of electrolysis units into the thermochemicalroute can enhance methane yields up to nearly 98%,meaning almost full conversion of the biogenic car-bon into methane and almost no losses of carbon orCO2 respectively to the environment. Furthermore,cold gas efficiencies can be increased up to 73.8%.70
Other investigations show, that the storage effi-ciency of the combined concept can be improved by3–4%-points compared to stand-alone PtG and bio-mass gasification concepts.71
DISCUSSION AND COMPARISONOF CONCEPTS
Market Maturity and Status Quoof Technological DevelopmentThe status quo of the different concepts varies signifi-cantly regarding market maturity levels and geo-graphical extension as well as historical background.To measure and evaluate evolving technologies,Technology Readiness Levels (TRLs) have been intro-duced (see Table 6).
While biogas plants all over Europe started toincrease from the 1990s, encouraged by governmentincentives, the upgrading of biogas to SNG onlyreached broad interest within the last 10–15 years.However, upgrading technologies, mainly CO2 sepa-ration, have also proven maturity in small-scaleapplications over the last years with a capacity ofmore than 94,000Nm3/hSNG in Europe in 2012.72
Thus biochemical SNG production can be seen at thehighest TRL 9. All components are commerciallyavailable from a range of suppliers. However, besideshigh TRLs, there is research ongoing for example inthe area of alternative and problematic feedstock likesewage sludge as well as gas cleaning and upgradingof landfill gas facilities.
Technical potential of feedstock for biogas utili-zation is more limited in comparison to lignocellulo-sic biomass, and in the worst case the cultivation of
TABLE 6 | Definition of TRLs (Technology Readiness Levels) by theEuropean Commission18
TRL 0 Idea. Unproven concept, no testing has beenperformed.
TRL 1 Basic research. Principles postulated and observedbut no experimental proof available.
TRL 2 Technology formulation. Concept and applicationhave been formulated.
TRL 3 Applied research. First laboratory tests completed;proof of concept.
TRL 4 Small-scale prototype built in a laboratoryenvironment (‘ugly’ prototype).
TRL 5 Large-scale prototype tested in intendedenvironment.
TRL 6 Prototype system tested in intended environmentclose to expected performance.
TRL 7 Demonstration system operating in operationalenvironment at pre-commercial scale.
TRL 8 First of a kind commercial system. Manufacturingissues solved.
TRL 9 Full commercial application, technology availablefor consumers.
WIREs Energy and Environment Comparison of synthetic natural gas production pathways
© 2015 John Wiley & Sons, Ltd
energy crops competes with other agricultural areas.Energy density in the first place determines the maxi-mum scale of the plants which therefore should notincrease in future.
As far as thermochemical SNG production isconcerned, two trends can be identified globally: onthe one hand, mainly China is increasing efforts tobring GW-scale Coal-to-SNG plants online to use theNG grid for energy transportation from the immensecoal resources located mainly in remote areas to theurban centers for utilization.73 In contrast to theseTRL 9 type applications with a capacity of morethan 2,000,000Nm3/h in operation or under con-struction (calculated based on Refs 73,74), however,the analog biogenic pathway mainly followed byEurope in general and Scandinavia in particular stilllacks full commercial implementation. Biomass gasifi-cation and especially most downstream process unitsadapted to biogenic syngas and scale-down are stillin the research and technical demonstration phase.Thus the overall system can be incorporated at TRL4–7. The recent lighthouse project is the GoBiGasproject by Gothenborg Energy. In addition, variousresearch institutes and companies are conductingresearch and development on the process. ECN(Energy Research Centre of the Netherlands) forexample has developed a fixed bed methanationprocess in connection with the MILENA gasifier andOLGA gas cleaning technology. The ZSW in Ger-many is investigating the methanation of commercialNi-catalysts downstream of an Adsorption EnhancedReformer (AER) focusing on fixed bed methanationwith molten-salt-cooled multi-zone reactors. The PSI(Paul Scherrer Institute) in Switzerland was one ofthe first to start investigating the thermochemicalSNG production favoring fluidized bed methanationas core technology. Various research approaches arebeing carried out by TUM/IES, FAU/EVT, TUG,Agnion, KIT, GDF Suez, and many more. Today’smajor technological challenges include the commer-cial operation of the gasifier itself, tar reduction mea-sures, deactivation and poisoning of the methanationcatalysts by sulfur and carbon depositions (e.g.,from ethylene), durability issues of various processsteps, heat removal and utilization and manymore.24,43,68,75,76
The electrochemical pathway is the newest con-cept, although the technological process stepsinvolved such as electrolysis are already establishedin some other niche applications. The transformationtoward large-scale, dynamic application in the energysystem sector remains the challenge and hurdle totake in the meantime. The lighthouse project for elec-trochemical SNG production is the Power-to-Gas
plant in Wertle, Germany, initiated by a consortiumaround the automotive company Audi. It consists ofthree atmospheric operated 2MW alkaline electroly-sers with a total H2 production capacity of 1310Nm3/h and a molten-salt-cooled fixed bed reactor formethanation of the H2 and CO2 from a nearby bio-gas plant.77 The PtG technology in general is beinghighly supported in Germany in the course of the‘Energiewende’ (exit from nuclear and fossil-fuelenergy) and many similar projects and approachesare being bundled in a Power-to-Gas strategy plat-form.78 TRL can be estimated to be in the rangeof 4–6.
As far as the technical potential is concerned,the amount of excess energy production due to ahigh energy generation of the fluctuating renewablesin times of a low energy demand is very limited inthe mid-term. This will become relevant only for afew countries with ambitious goals concerning theRE share or areas with a high amount of fluctuatingrenewable energy production and an underdevelopedelectricity grid. For Germany, excess energy produc-tion in the range of 21.6–78.5 TWh/a is predicted foran RE share in the range of 75–100%.6,8,79,80
EfficienciesComparing the conversion efficiencies of the threeproduction pathways proves complex due to differentfeed streams. For the biochemical pathway, the feedconsists mainly of energy crops (e.g., corn silage) andmanure while for the thermochemical pathway drywood is the main energy input. In contrast to this,the electrochemical pathway converts electric energywhich has a higher value from an exergetic perspec-tive compared to biomass. Beside this, the efficiencyis dependent on various factors. These include systemdesign, considered products like SNG, heat andpower, system scale, injection pressure, and timehorizon. Figure 14 displays the energy outputreferred to the total energy input which enables com-parison of the energy utilization rate taking SNG,heat, power, biomass, and auxiliary substances likepropane for gas conditioning and biodiesel for gascleaning into account. The energy demand for alloca-tion and transport of the biomass is not taken intoaccount, although it becomes relevant in terms oflimiting the maximum transport distance especiallyfor raw materials with a low energy density.87 In thefollowing, efficiency is defined as products like SNGon LHV basis, electricity and heat divided by con-sumptions including biomass on LHV basis, electric-ity, and heat.
Advanced Review wires.wiley.com/wene
© 2015 John Wiley & Sons, Ltd
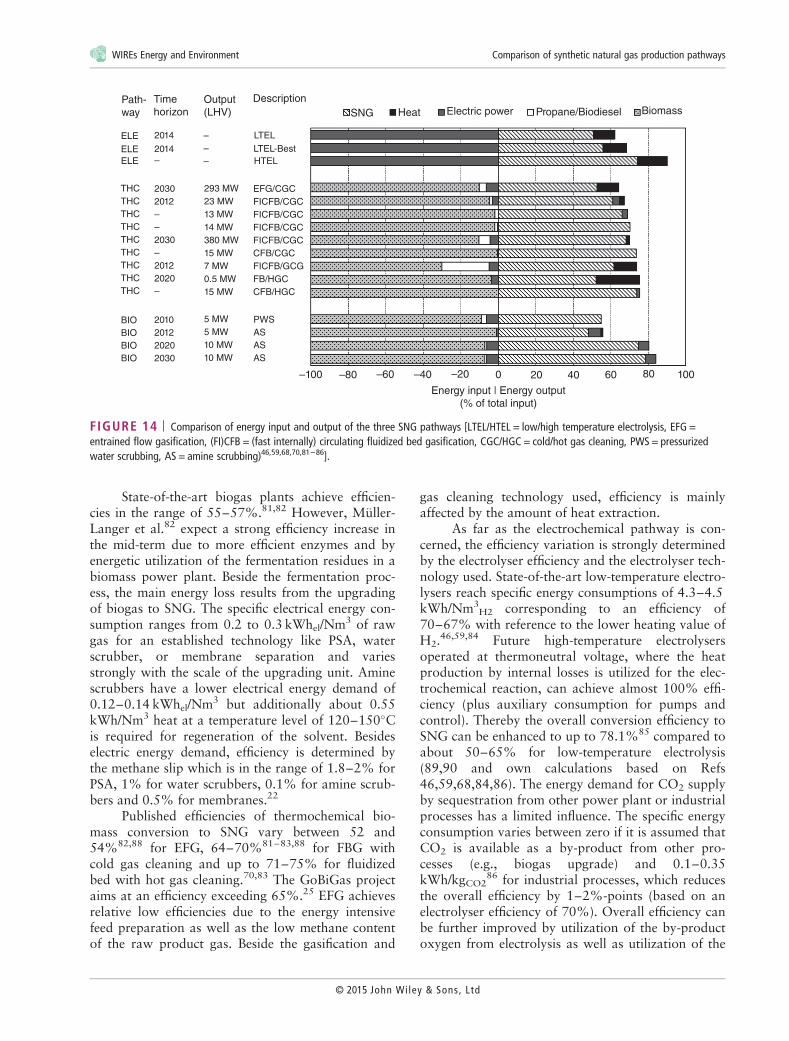
State-of-the-art biogas plants achieve efficien-cies in the range of 55–57%.81,82 However, Müller-Langer et al.82 expect a strong efficiency increase inthe mid-term due to more efficient enzymes and byenergetic utilization of the fermentation residues in abiomass power plant. Beside the fermentation proc-ess, the main energy loss results from the upgradingof biogas to SNG. The specific electrical energy con-sumption ranges from 0.2 to 0.3 kWhel/Nm3 of rawgas for an established technology like PSA, waterscrubber, or membrane separation and variesstrongly with the scale of the upgrading unit. Aminescrubbers have a lower electrical energy demand of0.12–0.14 kWhel/Nm3 but additionally about 0.55kWh/Nm3 heat at a temperature level of 120–150�Cis required for regeneration of the solvent. Besideselectric energy demand, efficiency is determined bythe methane slip which is in the range of 1.8–2% forPSA, 1% for water scrubbers, 0.1% for amine scrub-bers and 0.5% for membranes.22
Published efficiencies of thermochemical bio-mass conversion to SNG vary between 52 and54%82,88 for EFG, 64–70%81–83,88 for FBG withcold gas cleaning and up to 71–75% for fluidizedbed with hot gas cleaning.70,83 The GoBiGas projectaims at an efficiency exceeding 65%.25 EFG achievesrelative low efficiencies due to the energy intensivefeed preparation as well as the low methane contentof the raw product gas. Beside the gasification and
gas cleaning technology used, efficiency is mainlyaffected by the amount of heat extraction.
As far as the electrochemical pathway is con-cerned, the efficiency variation is strongly determinedby the electrolyser efficiency and the electrolyser tech-nology used. State-of-the-art low-temperature electro-lysers reach specific energy consumptions of 4.3–4.5kWh/Nm3
H2 corresponding to an efficiency of70–67% with reference to the lower heating value ofH2.
46,59,84 Future high-temperature electrolysersoperated at thermoneutral voltage, where the heatproduction by internal losses is utilized for the elec-trochemical reaction, can achieve almost 100% effi-ciency (plus auxiliary consumption for pumps andcontrol). Thereby the overall conversion efficiency toSNG can be enhanced to up to 78.1%85 compared toabout 50–65% for low-temperature electrolysis(89,90 and own calculations based on Refs46,59,68,84,86). The energy demand for CO2 supplyby sequestration from other power plant or industrialprocesses has a limited influence. The specific energyconsumption varies between zero if it is assumed thatCO2 is available as a by-product from other pro-cesses (e.g., biogas upgrade) and 0.1–0.35kWh/kgCO2
86 for industrial processes, which reducesthe overall efficiency by 1–2%-points (based on anelectrolyser efficiency of 70%). Overall efficiency canbe further improved by utilization of the by-productoxygen from electrolysis as well as utilization of the
Path-way
ELE LTEL
LTEL-Best
HTEL
2014
2014
2030
2012
2020
2010
2012
2020
2030
2030
2012
–
–
–
–
–
–
–
–
ELE
ELE
THC EFG/CGC
FICFB/CGC
FICFB/CGC
FICFB/CGC
FICFB/CGC
CFB/CGC
FICFB/GCG
FB/HGC
CFB/HGC
PWS
AS
AS
AS
–100 –80 –60 –40
Energy input | Energy output
(% of total input)
–20 0 20 40 60 80 100
293 MW
23 MW
13 MW
14 MW
380 MW
15 MW
7 MW
0.5 MW
15 MW
5 MW
5 MW
10 MW
10 MW
THC
THC
THC
THC
THC
THC
THC
THC
BIO
BIO
BIO
BIO
Timehorizon
Output(LHV)
Description
SNG Heat Electric power Propane/Biodiesel Biomass
FIGURE 14 | Comparison of energy input and output of the three SNG pathways [LTEL/HTEL = low/high temperature electrolysis, EFG =entrained flow gasification, (FI)CFB = (fast internally) circulating fluidized bed gasification, CGC/HGC = cold/hot gas cleaning, PWS = pressurizedwater scrubbing, AS = amine scrubbing)46,59,68,70,81–86].
WIREs Energy and Environment Comparison of synthetic natural gas production pathways
© 2015 John Wiley & Sons, Ltd

high-temperature heat of the exothermal methana-tion reaction. The first Power-to-Gas plant realizedby the company Solarfuel (now Etogas) in 2009 witha capacity of 25 kWel achieves an overall efficiencyof 40% which was improved to 54% in the 6 MWel
plant in Werlte commissioned in 2013.91
EconomicsEconomic analysis, evaluation, comparison, and dis-cussion of SNG production options prove difficultdue to the limitations caused by the different stagesof development of the technologies.
Since the biochemical pathway is already TRL9, full economic analysis can be carried out with highdata quality obtained by observing the market overthe last couple of years. Economical reviews andmarket evaluations are carried out by variousresearch groups.17,82,92,93 In the case of the thermo-chemical pathway, there are only a few projects inoperation, with almost no economic data publishedyet, leaving economic considerations to difficult pre-diction and simulation-based analysis. Single processsteps have to be analyzed separately to gain knowl-edge of possible production costs of the overall proc-ess now and predicted ones when TRL levels mightbe increased in the future. However, literature reviewshows a broad range of approaches to economicanalysis of the thermochemical pathway.29,94–96
Electrochemical SNG production with the lowestTRL can be compared to the thermochemical optionin terms of available data, although fewer and lesscomplex process steps enhance prediction accuracyand simplicity. In contrast to the other options, how-ever, economic considerations of the electrochemicalpathway heavily depend on the business modelapplied and the basic assumptions regarding, e.g., theoperating hours of the plant.4,46,59,66,84,97
In order to compare technologies reasonably,specific productions costs from input/feedstock tofeed-in SNG are used as well as specific investmentcosts based on the HHV. All data is leveled and incase of ranges, mean values are taken for further com-parison. Calculated values are based on SNG output.Missing values have been calculated based on simpli-fications (SNG output was calculated based on raw-biogas output, efficiency of the CO2 separation tech-nology and heating values). Main factors of influencefor economic evaluation are the full-load operationhours, the time horizon (projected operation year aswell as year of publication) and the scale of the plant.
Specific Production Costs SNGThe cost structure of biochemical SNG productionhas been extensively examined in several studies and
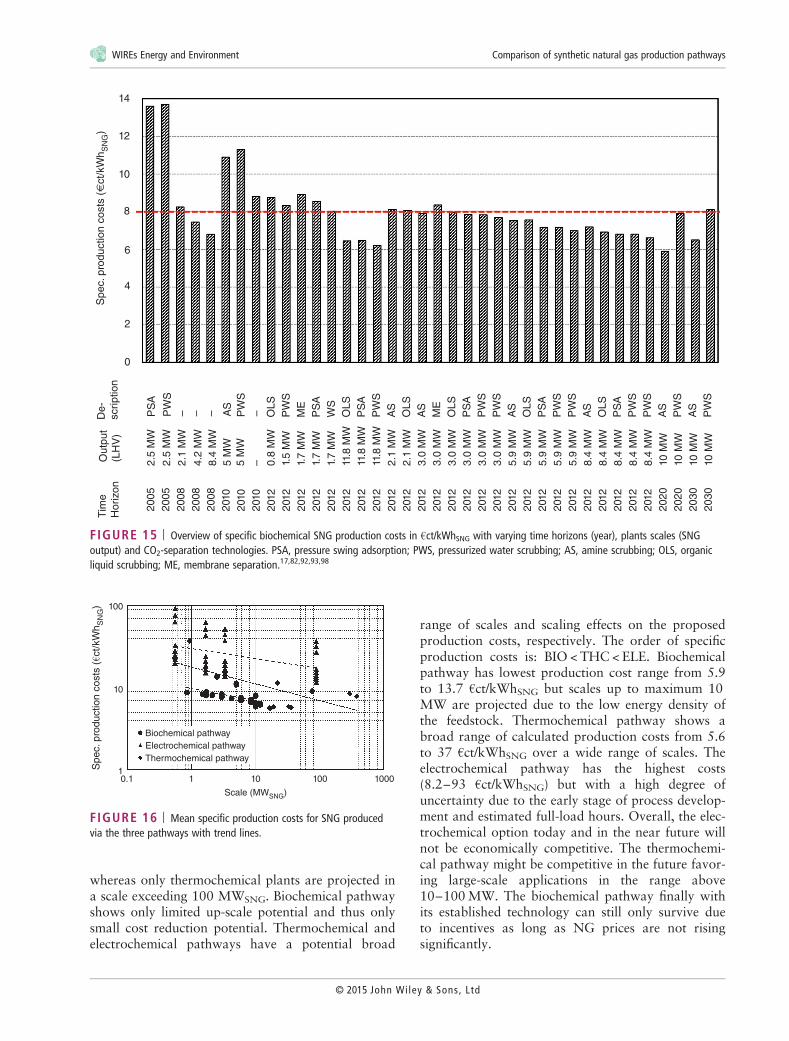
scientific papers with numerous existing commercialplants in operation in Germany and abroad.Figure 15 shows the overview of reviewed data onbiochemical SNG production.
Costs are arranged based on the year of initialoperation of the plants (projected) with no differenti-ation between data sources. Mean specific produc-tion costs vary between 5.9 and 13.7 €ct/kWhSNG
whereas good correlation and data consistency canbe found on the range and spread of productioncosts. The average value for biochemical SNG pro-duction is 8.0 €ct/kWhSNG. Highest values can beseen based on past data from 2005 to 2010. Futureprocess optimization and increase of plant size toaround 10 MWSNG leads to predicted productioncosts of approximately 6 €ct/kWhSNG. All literaturesources show good correlation and small productioncost spread. Diverse technology differences, mainlyCO2 separation technologies, account for only smalldeviations in overall production costs.
Two general trends are apparent:
• Specific production costs decrease with increas-ing plant scale (e.g., from 8.8 to 6.2 €ct/kWhSNG)
• Specific production costs decrease with consid-ered time horizon (e.g., from 13.7 to 8 €ct/kWhSNG)
Technological specifications and influencing factorslike different feedstock or special waste treatmentfacilities are not accounted for in the evaluationalthough these factors may have significant impacton production costs. For example the digestion ofmanure leads to lower feedstock costs compared toenergy crops due to their inherent lower or even neg-ative raw material costs. However, in many cases,lower feedstock costs are balanced by additionalhigher gas cleaning costs.
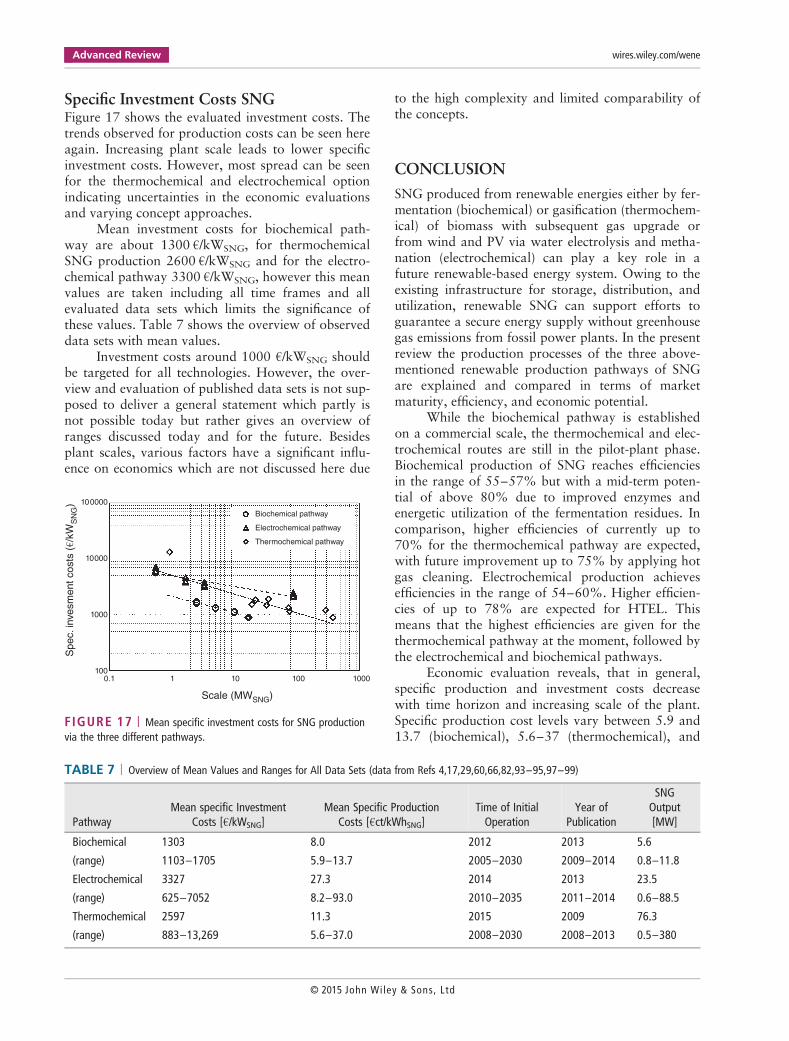
Fewer and less reliable data is available on ther-mochemical and electrochemical pathways. However,comparison of the pathways shows some significantdifferences and general trends. Figure 16 shows adouble logarithmic graph of the mean specific SNGproduction costs with plant scale (SNG outputin MW).
Following general conclusions can be drawnfrom the data evaluation: Cost regressions withincreasing plant scales are in the same order for allpathways with steepest decrease for thermochemicalpathway, which highlights the potential of scale-upfor thermochemical SNG production plants. Evalu-ated scales are in the range of 0.5–380 MWSNG,
Advanced Review wires.wiley.com/wene
© 2015 John Wiley & Sons, Ltd
whereas only thermochemical plants are projected ina scale exceeding 100 MWSNG. Biochemical pathwayshows only limited up-scale potential and thus onlysmall cost reduction potential. Thermochemical andelectrochemical pathways have a potential broad
range of scales and scaling effects on the proposedproduction costs, respectively. The order of specificproduction costs is: BIO < THC < ELE. Biochemicalpathway has lowest production cost range from 5.9to 13.7 €ct/kWhSNG but scales up to maximum 10MW are projected due to the low energy density ofthe feedstock. Thermochemical pathway shows abroad range of calculated production costs from 5.6to 37 €ct/kWhSNG over a wide range of scales. Theelectrochemical pathway has the highest costs(8.2–93 €ct/kWhSNG) but with a high degree ofuncertainty due to the early stage of process develop-ment and estimated full-load hours. Overall, the elec-trochemical option today and in the near future willnot be economically competitive. The thermochemi-cal pathway might be competitive in the future favor-ing large-scale applications in the range above10–100MW. The biochemical pathway finally withits established technology can still only survive dueto incentives as long as NG prices are not risingsignificantly.
14
12
10
8
Spec. pro
duction c
osts
(€
ct/kW
hS
NG
)
6
4
2
0
2005
2005
2008
2008
2008
2010
2010
2010
2012
2012
2012
2012
2012
2012
2012
2012
2012
2012
2012
2012
2012
2012
2012
2012
2012
2012
2012
2012
2012
2012
2012
2012
2012
2012
2020
2020
2030
2030
2.5
MW
2.5
MW
2.1
MW
4.2
MW
8.4
MW
5 M
W
5 M
W
0.8
MW
1.5 M
W
1.7 M
W
1.7 M
W
1.7 M
W
11.8
MW
11.8
MW
11.8
MW
2.1
MW
2.1
MW
3.0
MW
3.0
MW
3.0
MW
3.0
MW
3.0
MW
3.0
MW
5.9
MW
5.9
MW
5.9
MW
5.9
MW
5.9
MW
8.4
MW
8.4
MW
8.4
MW
8.4
MW
8.4
MW
10 M
W
10 M
W
10 M
W
10 M
W
–
AS
OLS
PW
S
ME
PS
A
WS
OLS
PS
A
PW
S
AS
AS
ME
OLS
PS
A
PS
A
PS
A
PW
S
PW
S
PW
S
PW
S
PW
S
PW
S
PW
S
PW
S
AS
AS
AS
AS
OLS
OLS
OLS
PW
S
–– – –PS
A
PW
S
Tim
eH
ori
zon
Outp
ut
(LH
V)
De-
scri
ption
FIGURE 15 | Overview of specific biochemical SNG production costs in €ct/kWhSNG with varying time horizons (year), plants scales (SNGoutput) and CO2-separation technologies. PSA, pressure swing adsorption; PWS, pressurized water scrubbing; AS, amine scrubbing; OLS, organicliquid scrubbing; ME, membrane separation.17,82,92,93,98
100
10
Biochemical pathway
Electrochemical pathway
Thermochemical pathway
10.1 1 10 100 1000
Scale (MWSNG)
Spec. pro
duction c
osts
(€ct/kW
hS
NG
)
FIGURE 16 | Mean specific production costs for SNG producedvia the three pathways with trend lines.
WIREs Energy and Environment Comparison of synthetic natural gas production pathways
© 2015 John Wiley & Sons, Ltd
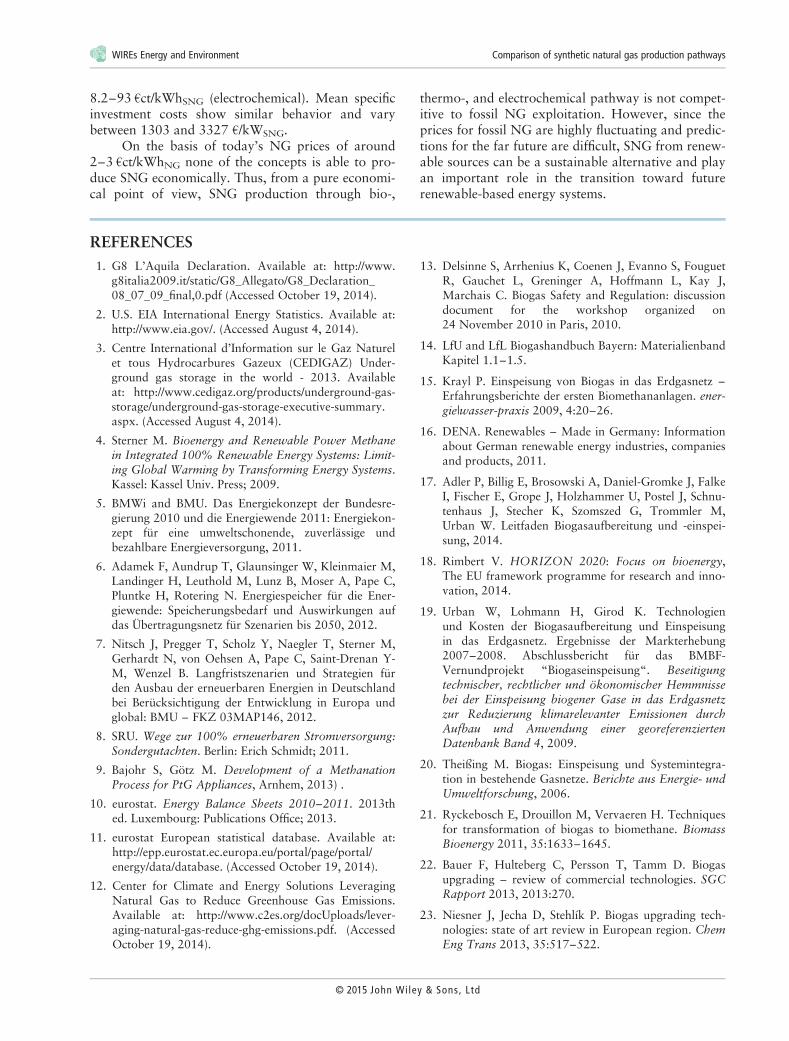
Specific Investment Costs SNGFigure 17 shows the evaluated investment costs. Thetrends observed for production costs can be seen hereagain. Increasing plant scale leads to lower specificinvestment costs. However, most spread can be seenfor the thermochemical and electrochemical optionindicating uncertainties in the economic evaluationsand varying concept approaches.
Mean investment costs for biochemical path-way are about 1300 €/kWSNG, for thermochemicalSNG production 2600 €/kWSNG and for the electro-chemical pathway 3300 €/kWSNG, however this meanvalues are taken including all time frames and allevaluated data sets which limits the significance ofthese values. Table 7 shows the overview of observeddata sets with mean values.
Investment costs around 1000 €/kWSNG shouldbe targeted for all technologies. However, the over-view and evaluation of published data sets is not sup-posed to deliver a general statement which partly isnot possible today but rather gives an overview ofranges discussed today and for the future. Besidesplant scales, various factors have a significant influ-ence on economics which are not discussed here due
to the high complexity and limited comparability ofthe concepts.
CONCLUSION
SNG produced from renewable energies either by fer-mentation (biochemical) or gasification (thermochem-ical) of biomass with subsequent gas upgrade orfrom wind and PV via water electrolysis and metha-nation (electrochemical) can play a key role in afuture renewable-based energy system. Owing to theexisting infrastructure for storage, distribution, andutilization, renewable SNG can support efforts toguarantee a secure energy supply without greenhousegas emissions from fossil power plants. In the presentreview the production processes of the three above-mentioned renewable production pathways of SNGare explained and compared in terms of marketmaturity, efficiency, and economic potential.
While the biochemical pathway is establishedon a commercial scale, the thermochemical and elec-trochemical routes are still in the pilot-plant phase.Biochemical production of SNG reaches efficienciesin the range of 55–57% but with a mid-term poten-tial of above 80% due to improved enzymes andenergetic utilization of the fermentation residues. Incomparison, higher efficiencies of currently up to70% for the thermochemical pathway are expected,with future improvement up to 75% by applying hotgas cleaning. Electrochemical production achievesefficiencies in the range of 54–60%. Higher efficien-cies of up to 78% are expected for HTEL. Thismeans that the highest efficiencies are given for thethermochemical pathway at the moment, followed bythe electrochemical and biochemical pathways.
Economic evaluation reveals, that in general,specific production and investment costs decreasewith time horizon and increasing scale of the plant.Specific production cost levels vary between 5.9 and13.7 (biochemical), 5.6–37 (thermochemical), and
1000.1 1 10
Biochemical pathway
Electrochemical pathway
Thermochemical pathway
100 1000
1000
Spec. in
vesm
ent costs
(€/k
WS
NG
)
Scale (MWSNG)
10000
100000
FIGURE 17 | Mean specific investment costs for SNG productionvia the three different pathways.
TABLE 7 | Overview of Mean Values and Ranges for All Data Sets (data from Refs 4,17,29,60,66,82,93–95,97–99)
PathwayMean specific Investment
Costs [€/kWSNG]Mean Specific Production
Costs [€ct/kWhSNG]Time of InitialOperation
Year ofPublication
SNGOutput[MW]
Biochemical 1303 8.0 2012 2013 5.6
(range) 1103–1705 5.9–13.7 2005–2030 2009–2014 0.8–11.8
Electrochemical 3327 27.3 2014 2013 23.5
(range) 625–7052 8.2–93.0 2010–2035 2011–2014 0.6–88.5
Thermochemical 2597 11.3 2015 2009 76.3
(range) 883–13,269 5.6–37.0 2008–2030 2008–2013 0.5–380
Advanced Review wires.wiley.com/wene
© 2015 John Wiley & Sons, Ltd
8.2–93 €ct/kWhSNG (electrochemical). Mean specificinvestment costs show similar behavior and varybetween 1303 and 3327 €/kWSNG.
On the basis of today’s NG prices of around2–3 €ct/kWhNG none of the concepts is able to pro-duce SNG economically. Thus, from a pure economi-cal point of view, SNG production through bio-,
thermo-, and electrochemical pathway is not compet-itive to fossil NG exploitation. However, since theprices for fossil NG are highly fluctuating and predic-tions for the far future are difficult, SNG from renew-able sources can be a sustainable alternative and playan important role in the transition toward futurerenewable-based energy systems.
REFERENCES1. G8 L’Aquila Declaration. Available at: http://www.
g8italia2009.it/static/G8_Allegato/G8_Declaration_08_07_09_final,0.pdf (Accessed October 19, 2014).
2. U.S. EIA International Energy Statistics. Available at:http://www.eia.gov/. (Accessed August 4, 2014).
3. Centre International d’Information sur le Gaz Naturelet tous Hydrocarbures Gazeux (CEDIGAZ) Under-ground gas storage in the world - 2013. Availableat: http://www.cedigaz.org/products/underground-gas-storage/underground-gas-storage-executive-summary.aspx. (Accessed August 4, 2014).
4. Sterner M. Bioenergy and Renewable Power Methanein Integrated 100% Renewable Energy Systems: Limit-ing Global Warming by Transforming Energy Systems.Kassel: Kassel Univ. Press; 2009.
5. BMWi and BMU. Das Energiekonzept der Bundesre-gierung 2010 und die Energiewende 2011: Energiekon-zept für eine umweltschonende, zuverlässige undbezahlbare Energieversorgung, 2011.
6. Adamek F, Aundrup T, Glaunsinger W, Kleinmaier M,Landinger H, Leuthold M, Lunz B, Moser A, Pape C,Pluntke H, Rotering N. Energiespeicher für die Ener-giewende: Speicherungsbedarf und Auswirkungen aufdas Übertragungsnetz für Szenarien bis 2050, 2012.
7. Nitsch J, Pregger T, Scholz Y, Naegler T, Sterner M,Gerhardt N, von Oehsen A, Pape C, Saint-Drenan Y-M, Wenzel B. Langfristszenarien und Strategien fürden Ausbau der erneuerbaren Energien in Deutschlandbei Berücksichtigung der Entwicklung in Europa undglobal: BMU – FKZ 03MAP146, 2012.
8. SRU. Wege zur 100% erneuerbaren Stromversorgung:Sondergutachten. Berlin: Erich Schmidt; 2011.
9. Bajohr S, Götz M. Development of a MethanationProcess for PtG Appliances, Arnhem, 2013) .
10. eurostat. Energy Balance Sheets 2010–2011. 2013thed. Luxembourg: Publications Office; 2013.
11. eurostat European statistical database. Available at:http://epp.eurostat.ec.europa.eu/portal/page/portal/energy/data/database. (Accessed October 19, 2014).
12. Center for Climate and Energy Solutions LeveragingNatural Gas to Reduce Greenhouse Gas Emissions.Available at: http://www.c2es.org/docUploads/lever-aging-natural-gas-reduce-ghg-emissions.pdf. (AccessedOctober 19, 2014).
13. Delsinne S, Arrhenius K, Coenen J, Evanno S, FouguetR, Gauchet L, Greninger A, Hoffmann L, Kay J,Marchais C. Biogas Safety and Regulation: discussiondocument for the workshop organized on24 November 2010 in Paris, 2010.
14. LfU and LfL Biogashandbuch Bayern: MaterialienbandKapitel 1.1–1.5.
15. Krayl P. Einspeisung von Biogas in das Erdgasnetz –
Erfahrungsberichte der ersten Biomethananlagen. ener-gie|wasser-praxis 2009, 4:20–26.
16. DENA. Renewables – Made in Germany: Informationabout German renewable energy industries, companiesand products, 2011.
17. Adler P, Billig E, Brosowski A, Daniel-Gromke J, FalkeI, Fischer E, Grope J, Holzhammer U, Postel J, Schnu-tenhaus J, Stecher K, Szomszed G, Trommler M,Urban W. Leitfaden Biogasaufbereitung und -einspei-sung, 2014.
18. Rimbert V. HORIZON 2020: Focus on bioenergy,The EU framework programme for research and inno-vation, 2014.
19. Urban W, Lohmann H, Girod K. Technologienund Kosten der Biogasaufbereitung und Einspeisungin das Erdgasnetz. Ergebnisse der Markterhebung2007–2008. Abschlussbericht für das BMBF-Vernundprojekt “Biogaseinspeisung“. Beseitigungtechnischer, rechtlicher und ökonomischer Hemmnissebei der Einspeisung biogener Gase in das Erdgasnetzzur Reduzierung klimarelevanter Emissionen durchAufbau und Anwendung einer georeferenziertenDatenbank Band 4, 2009.
20. Theißing M. Biogas: Einspeisung und Systemintegra-tion in bestehende Gasnetze. Berichte aus Energie- undUmweltforschung, 2006.
21. Ryckebosch E, Drouillon M, Vervaeren H. Techniquesfor transformation of biogas to biomethane. BiomassBioenergy 2011, 35:1633–1645.
22. Bauer F, Hulteberg C, Persson T, Tamm D. Biogasupgrading – review of commercial technologies. SGCRapport 2013, 2013:270.
23. Niesner J, Jecha D, Stehlík P. Biogas upgrading tech-nologies: state of art review in European region. ChemEng Trans 2013, 35:517–522.
WIREs Energy and Environment Comparison of synthetic natural gas production pathways
© 2015 John Wiley & Sons, Ltd
24. Held J. REGATEC 2014: Bringing technology andindustry together, Conference Proceedings. In: 1stInternational Conference on Renewable Energy GasTechnology, Malmö, May 22–23, 2014.
25. Gunnarsson I. The GoBiGas-project: Green Gas fromthe Swedish Forest, Malmö, 2014.
26. van der Drift A, Zwart RWR, Vreugdenhil BJ, Bleijen-daal LPJ. Comparing the options to produce SNGfrom biomass. In: 18th European Biomass Conferenceand Exhibition ECN-M–10-050, 2010.
27. van der Meijden C. The MILENA Gasification Tech-nology for the Production of Bio-Methane, Nurem-berg, 2013.
28. Hofbauer H, Rauch R, Fürnsinn S, Aichering C. Ener-giezentrale Güssing: Energiezentrale zur Umwandlungvon biogenen Roh- und Reststoffen einer Region inWärme, Strom, BioSNG und flüssige Kraftstoffe. Ber-ichte aus Energie- und Umweltforschung 79, 2006.
29. Girod K, Unger C. Synthesegasmethanisierung. Verfah-renstechnische und ökonomische Analyse thermoche-mischer Gaserzeugungs- und Aufbereitungsverfahren.Abschlussbericht für das BMBF-Vernundprojekt “Bio-gaseinspeisung”. Beseitigung technischer, rechtlicherund ökonomischer Hemmnisse bei der Einspeisungbiogener Gase in das Erdgasnetz zur Reduzierung kli-marelevanter Emissionen durch Aufbau und Anwen-dung einer georeferenzierten Datenbank Band 3, 2009.
30. van der Drift A, Boerrigter H, Coda B, Cieplik M,Hemmes K. Entrained flow gasification of biomass:ash behaviour, feeding issues, and system analysesECN-C–04-039, 2004.
31. Heyne S. Bio-SNG from thermal gasification – processsynthesis, integration and performance. Dissertation,Chalmers.
32. Spliethoff H. Power Generation from Solid FuelsPower Generation from Solid Fuels. Berlin Heidelberg:Springer-Verlag; 2010.
33. Taylor R, Howes J, Bauen A. Review of technologiesfor gasification of biomass and wastes: final reportNNFCC project 09/008, 2009.
34. Tremel A, Becherer D, Fendt S, Gaderer M, SpliethoffH. Performance of entrained flow and fluidised bedbiomass gasifiers on different scales. Energy ConversManage 2013, 69:95–106.
35. Zainal Alimuddin A, Zainal B, Lahijani P, Moham-madi M, Mohamed AR. Gasification of lignocellulosicbiomass in fluidized beds for renewable energy devel-opment: a review. Renew Sustain Energy Rev 2010,14:2852–2862.
36. Nexterra Systems Corp. Nexterra Systems Corp.: aglobal leader in energy-from-renewable-waste gasifica-tion systems. CORPORATE PROFILE. Available at:http://www.nexterra.ca/files/documents/20140226Cor-porateProfile_000.pdf. (Accessed October 20, 2014).
37. Schiefer E. XYLOGAS – Ökoenergie aus Holz: Inno-vation. Umwelt. Natur. Die neueste Gerneration derBiomasseverstromung, Stuttgart, 2012.
38. Weichselbaum K. Markteintritt Holzvergasung amBeispiel des Burkhardt ECO 180HV: Erfahrungsber-icht und Hintergründe, Stuttgart, 2012.
39. Bleul T. Spanner Wood Power-Systems: Electricity andHeating from Wood, 2012.
40. Bandi A. Verfahrensübersicht Gasreinigungsverfahren,22 October 2014.
41. Asadullah M. Biomass gasification gas cleaning fordownstream applications: a comparative criticalreview. Renew Sustain Energy Rev 2014, 40:118–132.
42. Woolcock PJ, Brown RC. A review of cleaning tech-nologies for biomass-derived syngas. Biomass Bioen-ergy 2013, 52:54–84.
43. Kopyscinski J, Schildhauer TJ, Biollaz SMA. Produc-tion of synthetic natural gas (SNG) from coal and drybiomass – a technology review from 1950 to 2009.Fuel 2010, 89:1763–1783.
44. Nguyen T. Topsøe´s Synthesis Technology for SNGwith Focus on Methanation in General and Bio-SNGin Particular, Malmö, 2014.
45. Specht M, Zuberbühler U, Bandi A. ExperimentalData on Renewable Methanol/Methane Generationfrom Atmospheric CO2 in Pilot Plants, Pots-dam, 2011.
46. Smolinka T, Günther M, Garche J. Stand undEntwicklungspotenzial der Wasserelektrolyse zur Her-stellung von Wasserstoff aus regenerativen Energien:Kurzfassung des Abschlussberichts, NOW-Stu-die, 2011.
47. Ursúa A, Gandía LM, Sanchis P. Hydrogen productionfrom water electrolysis: current status and futuretrends. Proc IEEE 2011, 99:1–17.
48. Dahl PI, Bünger U, Völler S, Korpas M, Moller-HolstS. Hydrogen for transport from renewable energy inMid-Norway: final report, 2012. Available at: http://www.transnova.no/wp-content/uploads/2012/07/H2iMidtNorge_Sluttrapport.pdf.
49. Brisse A, Schefold J. High temperature electrolysis atEIFER, main achievements at cell and stack level.Energy Procedia 2012, 29:53–63.
50. Yan XL, Hino R. Nuclear Hydrogen ProductionHandbook. Boca Raton: CRC Press; 2011.
51. ITM Power Company Website. Available at: http://www.itm-power.com/. (Accessed October 20, 2014).
52. CETH2 Datasheet: PEM Electrolysers: from 5 to60 Nm3/h. Available at: http://www.ceth.fr/. (AccessedSeptember 10, 2013).
53. Proton OnSite Company Website. Available at: http://protononsite.com/. (Accessed October 20, 2014).
54. Brauer T. Kompaktes 1MW – PEM – Wasserelektro-lysesystem Regenerativer Wasserstoff für Mobilitätund Energiespeicherung, Berlin, 2013.
Advanced Review wires.wiley.com/wene
© 2015 John Wiley & Sons, Ltd
55. Janssen H, Bringmann J, Emonts B, Schroeder V.Safety-related studies on hydrogen production in high-pressure electrolysers. Int J Hydrogen Energy 2004,29:759–770.
56. Tremel A. Electrolysis and chemical synthesis as keytechnologies for future power-to-product routes,München, 2014.
57. Anderson E, Ayers K, Capuano C. R&D Focus AreasBased on 60,000 hr Life PEM Water Electrolysis StackExperience, Freiburg, 2013.
58. Barisic M. Alkalische Elektrolyseure – IndustrielleAnwendungen und dynamischer Betrieb,München, 2014.
59. Jensen JO, Bandur V, Bjerrum N, Jensen S, Ebbesen S,Mogensen M, Tophoj N, Yde L. Pre-investigation ofwater electrolysis: PSO-F&U 2006-1-6287, Draft 04-02-2008 (31 January 2012), 2012.
60. Specht M. Power to Gas – zwischen Mythos undWahrheit: Teil 2: P2G® in der Praxis: Erfahrungenund Ergebnisse, Berlin, 2014.
61. Pino FJ, Valverde L, Rosa F. Influence of wind turbinepower curve and electrolyzer operating temperatureon hydrogen production in wind–hydrogen systems.J Power Sources 2011, 196:4418–4426.
62. Santarelli M, Medina P, Calì M. Fitting regressionmodel and experimental validation for a high-pressurePEM electrolyzer. Int J Hydrogen Energy 2009,34:2519–2530.
63. Schiller G, Ansar A, Patz O. High Temperature WaterElectrolysis Using Metal Supported Solid Oxide Elec-trolyser Cells (SOEC). Adv Sci Technol 2010,72:135–143.
64. Harms H, Höhlein B, Skov A. Methanisierung kohlen-monoxidreicher Gase beim Energie-Transport. ChemIng Tech 1980, 52:504–515.
65. Eisenlohr K-H, Moeller FW, Dry M. Influence of cer-tain reaction parameters on methanation of coal gas toSNG. Fuels ACS Div Preprints 1974, 19:1–9.
66. Zuberbühler U, Specht M. Power-to-Gas (P2G®):Construction and start-up of a 250 kWel researchplant, Berlin, 2012.
67. Kernforschungsanlage Jülich GmbH, RheinischeBraunkohlewerke AG. Nuklear Fernenergie: Zusam-menfassender Bericht zum Projekt Nukleare Fernener-gie (NFE). Spezielle Berichte der KernforschungsanlageJülich 303, 1985.
68. Biollaz S. Forschung & Entwicklung zum ThemaSNG/PtG am PSI, München, 2014.
69. Hofstetter D. Power-to-Gas via Biological Methana-tion, Düsseldorf, 2014.
70. Fendt S, Maschke M, Gaderer M, Spliethoff H. Con-cept Study of Small-Scale Biomass-to-Sng Systems withExcess Power Integration. In: Proceedings of the 21thEU BC&E – Copenhagen, 1335–1341, 2013.
71. Buttler A, Fendt S, Spliethoff H. Simulation-based con-cept study of an innovative small-scale biomass-to-SNG plant with excess power integration. In:Hofbauer H, Fuchs M, eds. Proceedings of the ICPS13. International Conference on Polygeneration Strate-gies 13, Vienna, Austria, 3–5 September 2013,195–205, 2013.
72. Thrän D, Billig E, Persson T, Svensson M, Daniel-Gromke J, Ponitka J, Seiffert M, Baldwin J, Kranzl L,Schipfer F, Matzenberger J, Devriendt N, Dumont M,Dahl, J., Bochmann, G. Biomethane – status and fac-tors affecting market development and trade, 2014.
73. Higman C. (2013) State of the Gasification Industry –
the Updated Worldwide Gasification Database. In:Proceedings 2013 International Pittsburg Coal Confer-ence: Proceedings, 15–18 September, 2013.
74. U.S. Department of Energy NETL U.S. DOE Gasifica-tion Plant Databases. http://www.netl.doe.gov/research/coal/energy-systems/gasification/gasification-plant-databases (22 October 2014).
75. Specht M, Zuberbühler U, Sterner M, Waldstein G.Storage of Renewable Energy in the Natural Gas Grid“Power-to-Gas-Technology”, Berlin, 2011.
76. Guerrini O. The GAYA Project: The GAYA Project“Towards industrialization of 2nd generation bioSNGpathway”, Malmö, 2014.
77. Rieke S. Erste industrielle Power-to-Gas-Anlagemit 6 Megawatt. gwf-Gas/Erdgas, September,660–664, 2013.
78. DENA Strategieplattform Power to Gas: Factsheet.Systemlösung für den Weg in das neue Energiezeitalter.(22 October 2014).
79. Klaus T, Vollmer C, Werner K, Lehmann H, MüschenK. Energieziel 2050: 100% Strom aus erneuerbarenQuellen, 2010.
80. Sterner M, Gerhardt N, Saint-Drenan Y-M, vonOehsen A, Hochloff P, Kocmajewski M, Jentsch M,Lichtner P, Pape C, Bofinger S, Rohrig K. Energie-wirtschaftliche Bewertung von Pumpspeicherwerkenund anderen Speichern im zukünftigen Stromversor-gungssystem: Endbericht. im Auftrag der Schluchsee-werk AG, 2010.
81. Wagner H, Wulf C, Kaltschmitt M. () Polygenerationof SNG, heat and power based on biomass gasificationand water electrolysis – concepts and their assessment.In: Hofbauer H, Fuchs M, eds. Proceedings of theICPS 13 International Conference on PolygenerationStrategies 13, Vienna, Austria, September 3–5, 2013,169–181, 2013.
82. Müller-Langer F, Rönsch S, Weithäuser M, Oehmi-chen K, Seiffert M, Majer S, Scholwin F, Thrän D.Erdgassubstitute aus Biomasse für die mobile Anwen-dung im zukünftigen Energiesystem, 2009.
83. Gassner M, Maréchal F. Thermo-economic processmodel for thermochemical production of Synthetic
WIREs Energy and Environment Comparison of synthetic natural gas production pathways
© 2015 John Wiley & Sons, Ltd
Natural Gas (SNG) from lignocellulosic biomass. Bio-mass Bioenergy 2009, 33:1587–1604.
84. Wenske M. Wasserstoff-Herstellung per Elektrolyse,Stralsund, 2008.
85. Hansen JB, Christiansen N, Nielsen JU. Production ofsustainable fuels by means of solid oxide electrolysis.ECS Trans 2011, 35:2941–2948.
86. Göttlicher GAH. Energetik der Kohlendioxidrückhal-tung in Kraftwerken. Düsseldorf: VDI-Verl; 1999.
87. Berglund M, Börjesson P. Assessment of energy perfor-mance in the life-cycle of biogas production. BiomassBioenergy 2006, 30:254–266.
88. van der Meijden CM, Veringa HJ, Rabou LP. The pro-duction of synthetic natural gas (SNG): a comparisonof three wood gasification systems for energy balanceand overall efficiency. Biomass Bioenergy 2010,34:302–311.
89. Krause H, Müller-Syring G. Integration von Wasserst-off in das Erdgasnetz Powert-to-Gas – die Energiespei-cherung der Zukunft, Leipzig, 2011.
90. Sterner M, Jentsch M, Holzhammer U. Energie-wirtschaftliche und ökologische Bewertung einesWindgas-Angebotes: Gutachten. im Auftrag vonGreenpeace Energy e.G, 2011.
91. Etogas company webpage. Available at: http://www.etogas.com/. (Accessed October 17, 2014).
92. Müller-Langer F. Ökonimosche und ökologische Ana-lyse von Biomethan, Leipzig, 2010.
93. Krassowski J. Biogaseinspeisung in Erdgasnetze –
Markt und Wirtschaftlichkeit. Lüneburg: LeuphanaUniversität; 2010.
94. Fendt S, Gaderer H, Spliethoff H. Synthetic NaturalGas (SNG) state-of-the-art technology and applicationreview, 2011.
95. Gassner M, Maréchal F. Thermo-economic optimisa-tion of the integration of electrolysis in synthetic natu-ral gas production from wood. Energy 2008,33:189–198.
96. Mozaffarian M, Zwart RWR. Feasibility of biomass/waste-related SNG production technologies: finalreport, 2003.
97. Müller-Syring G, Henel M, Köppel W, Mlaker H, Ster-ner M, Höcher T, Adelt M, Altfeld K, Graf F, HoppeM, Kaesler H, Linke G, Löffler T. Entwicklung vonmodularen Konzepten zur Erzeugung, Speicherungund Einspeisung von Wasserstoff und Methan insErdgasnetz: Abschlussbericht DVGW-Projekt G1-07-10, 2013.
98. Bundesnetzagentur. Biogas – Monitoringbericht 2012:Bericht der Bundesnetzagentur über die Auswirkungender Sonderregelungen für die Einspeisung von Biogasin das Erdgasnetz, 2012.
99. Röttgen KP. Der Weg zur Marktreife von Power-to-Gas – Herausforderungen und Geschäftsmodelle, Ber-lin, 2014.
Advanced Review wires.wiley.com/wene
© 2015 John Wiley & Sons, Ltd


![Computational Approaches to Design and Test Plant ...Update on Plant Synthetic Metabolic Pathways Computational Approaches to Design and Test Plant Synthetic Metabolic Pathways1[OPEN]](https://img.dokumen.tips/doc/110x75/6118a3dece051064bf699784/computational-approaches-to-design-and-test-plant-update-on-plant-synthetic.jpg)