Embed Size (px)
Citation preview

Comparison of Metabolic Pathways byConsidering Potential Fluxes
Paolo Baldan1, Nicoletta Cocco2 and Marta Simeoni2
1 Dipartimento di Matematica, Universita di Padovavia Trieste 63, 35121 Padova, Italy
email: [email protected] di Scienze Ambientali, Statistica e Informatica,
Universita Ca’ Foscari Venezia,via Torino 155, 30172 Venezia Mestre, Italy
email: [email protected],[email protected]
Abstract. Comparison of metabolic pathways is useful in phylogeneticanalysis and for understanding metabolic functions when studying dis-eases and in drugs engineering. In the literature many techniques havebeen proposed to compare metabolic pathways, but most of them focuson structural aspects, while behavioural or functional aspects are gener-ally not considered. In this paper we propose a new method for comparingmetabolic pathways of different organisms based on a similarity measurewhich considers both homology of reactions and functional aspects ofthe pathways. The latter are captured by relying on a Petri net repre-sentation of the pathways and comparing the corresponding T-invariantbases, which represent potential fluxes in the nets. The approach is im-plemented in a prototype tool, CoMeta, which allows us to test andvalidate our proposal. Some experiments with CoMeta are presented.
1 Introduction
The life of an organism depends on its metabolism, the chemical system whichgenerates the essential components - amino acids, sugars, lipids and nucleic acids- and the energy necessary to synthesise and use them. Subsystems of metabolismdealing with some specific function are called metabolic pathways. Comparingmetabolic pathways of different species yields interesting information on theirevolution and it may help in understanding metabolic functions. This is impor-tant for metabolic engineering and for studying diseases and drugs design.
In the recent literature many techniques have been proposed for comparingmetabolic pathways of different organisms. Each approach chooses a representa-tion of metabolic pathways which models the information of interest, proposes asimilarity or a distance measure and possibly supplies a tool for performing thecomparison.
Representations of metabolic pathways at different degrees of abstractionhave been considered. A pathway can be simply viewed as a set of componentsof interest, which can be reactions, enzymes or chemical compounds. In other
Proc. BioPPN 2012, a satellite event of PETRI NET 2012
- 2 -

approaches pathways are decomposed into a set of paths, leading from an initialmetabolite to a final one. The most detailed representations model a metabolicpathway as a graph. Clearly, more detailed models produce more accurate com-parison results, in general at the price of being more complex.
The distances in the literature generally focus on static, topological infor-mation of the pathways, disregarding the fact that they represent dynamic pro-cesses. In this paper we propose to take into account also behavioural aspects: werepresent the pathways as Petri nets (PNs) and compare also aspects related totheir behaviour as captured by T-invariants. Petri nets seem to be particularlynatural for representing and modelling metabolic pathways (see, e.g., [8] and ref-erences therein). The graphical representations used by biologists for metabolicpathways and the ones used in PNs are similar; the stoichiometric matrix of ametabolic pathway is analogous to the incidence matrix of a PN; the flux modesand the conservation relations for metabolites correspond to specific propertiesof PNs. In particular minimal (semi-positive) T-invariants correspond to ele-mentary flux modes [43] of a metabolic pathway, i.e., minimal sets of reactionsthat can operate at a steady state. The space of semi-positive T-invariants has aunique basis of minimal T-invariants which is characteristic of the net and we useit in the comparison. Hence we propose a similarity measure between pathwayswhich considers both homology of reactions, represented by the Sørensen indexon the multisets of enzymes in the pathways, and similarity of potential fluxes inthe pathways, obtained by comparing the corresponding T-invariant bases. Wedeveloped a prototype tool, CoMeta, implementing our proposal. Given a set oforganisms and a set of metabolic pathways, CoMeta automatically gets the cor-responding data from the KEGG database, builds the corresponding Petri nets,computes the T-invariants and the similarity measures and shows the results ofthe comparison among organisms as a phylogenetic tree. We performed severalexperiments with CoMeta and, although further investigations are definitivelyneeded, the approach appears to be promising and worth to be pursued.
The paper is organised as follows. In Section 2 we introduce metabolic path-ways and give a classification of various proposals for metabolic pathways com-parison. In Section 3 we show how a Petri net can model a metabolic pathwayand present our proposal. In Section 4 we briefly illustrate the tool CoMetaand we present some experiments. A short conclusion follows in Section 5.
2 Comparison of Metabolic Pathways
In this section we briefly introduce metabolic pathways and classify various pro-posals for the comparison of metabolic pathways in the literature.
2.1 Metabolic pathways
Biologists usually represent a metabolic pathway as a network of chemical re-actions, catalysed by one or more enzymes, where some molecules (reactants orsubstrates) are transformed into others (products). Enzymes are not consumed
Proc. BioPPN 2012, a satellite event of PETRI NET 2012
- 3 -

in a reaction, even if they are necessary and used while the reaction takes place.The product of a reaction is the substrate for other ones.
To characterise a metabolic pathway, it is necessary to identify its components(namely the reactions, enzymes, reactants and products) and their relations.Quantitative relations can be represented through a stoichiometric matrix, whererows represent molecular species and columns represent reactions. An elementof the matrix, a stoichiometric coefficient nij , represents the degree to whichthe i-th chemical species participates in the j-th reaction. By convention, thecoefficients for reactants are negative, while those for products are positive. Thekinetic of a pathway is determined by the rate associated to each reaction. Itis represented by a rate equation, which depends on the concentrations of thereactants and on a reaction rate coefficient (or rate constant) which includes allthe other parameters (except for concentrations) affecting the rate.
Information on metabolic pathways are collected in databases. In particularthe KEGG PATHWAY database [2] (KEGG stands for Kyoto Encyclopedia ofGenes and Genomes) contains the main known metabolic, regulatory and ge-netic pathways for different species. It integrates genomic, chemical and systemicfunctional information [23]. The pathways are manually drawn, curated and con-tinuously updated from published materials. They are represented as maps whichare linked to additional information on reactions, enzymes and genes, which maybe stored in other databases. KEGG can be queried through KGML (KEGGMarkup Language) [1], a language based on XML.
2.2 Comparison techniques for metabolic pathways
Many proposals exist in the literature for comparing metabolic pathways andwhole metabolic networks in different organisms. Each proposal is based on somesimplified representation of a metabolic pathway and on a related definition ofsimilarity score (or distance measure) between two pathways. Hence we cangroup the various approaches in three classes, according to the structures theyuse for representing and comparing metabolic pathways. Such structures are:
– Sets. Most of the proposals in the literature represent a metabolic pathway(or the entire metabolic network) as the set of its main components, whichcan be reactions, enzymes or chemical compounds (see, e.g., [17, 18, 29, 22,14, 13, 10, 48, 33]). This representation is simple and efficient and very usefulwhen entire metabolic networks are compared. The comparison is based onsuitable set operations.
– Sequences. A metabolic pathway is sometimes represented as a set of se-quences of reactions (enzymes, compounds), i.e., pathways are decomposedinto a set of selected paths leading from an initial component to a final one(see, e.g., [49, 30, 11, 27, 50]). This representation may provide more informa-tion on the original pathways, but it can be computationally more expensive.It requires methods both for identifying a suitable set of paths and for com-paring them.
Proc. BioPPN 2012, a satellite event of PETRI NET 2012
- 4 -

– Graphs. In several approaches, a metabolic pathway is represented as a graph(see, e.g., [20, 34, 16, 52, 28, 6, 12, 24, 31, 26, 7, 5]). This is the most informativerepresentation in the classification, as it considers both the chemical compo-nents and their relations. A drawback can be the complexity of the compar-ison techniques. In fact the graph and subgraph isomorphism problems areGI-complete (graph isomorphism complete) and NP-complete, respectively.For this reason efficient heuristics are used and simplifying assumptions areintroduced, which produce further approximations.
The similarity measure (or distance) and the comparison technique strictlydepend on the chosen representation. When using a set-based representation, thecomparison between two pathways roughly consists in determining the numberof common elements. A similarity measure commonly used in this case is theJacard index defined as:
J(X,Y ) =|X ∩ Y ||X ∪ Y |
where X and Y are the two sets to be compared. When pathways are representedby means of sequences, alignment techniques and sum of scores with gap penaltymay be used as similarity measures. In the case of graph representation, morecomplex algorithms for graph homeomorphism or graph isomorphism are usedand some approximations are introduced to reduce the computational costs.
In any case the definition of a similarity measure between two metabolicpathways relies on a similarity measure between their components. Reactionsare generally identified with the enzymes which catalyse them, and the mostused similarity measures between two reactions/enzymes are based on:
– Identity. The simplest similarity measure is just a boolean value: two enzymescan either be identical (similarity = 1) or different (similarity = 0).
– EC hierarchy. The similarity measure is based on comparing the unique ECnumber (Enzyme Commission number) associated to each enzyme, whichrepresents its catalytic activity.The EC number is a 4-level hierarchical scheme, d1.d2.d3.d4, developed by theInternational Union of Biochemistry and Molecular Biology (IUBMB) [51].For instance, arginase is numbered by EC : 3.5.3.1, which indicates thatthe enzyme is a hydrolase (EC : 3. ∗ . ∗ .∗), and acts on the “carbon nitro-gen bonds, other than peptide bonds” (sub-class EC : 3.5. ∗ .∗) in linearamidines (sub-sub-class EC : 3.5.3.∗). Enzymes with similar EC classifica-tions are functional homologues, but do not necessarily have similar aminoacid sequences.Given two enzymes e = d1.d2.d3.d4 and e′ = d′1.d
′2.d
′3.d
′4, their similarity
S(e, e′) depends on the length of the common prefix of their EC numbers:
S(e, e′) = max{i : di = d′i}/4
For instance, the similarity between arginase (e = 3.5.3.1) and creatinase(e′ = 3.5.3.3) is 0.75.
Proc. BioPPN 2012, a satellite event of PETRI NET 2012
- 5 -

– Information content. The similarity measure is based on the EC numbersof enzymes together with the information content of the numbering scheme.This is intended to correct the large deviation in the distribution in theenzyme hierarchy. For example, the enzymes in the class 1.1.1 range fromEC1.1.1.1 to EC1.1.1.254, whereas there is a single enzyme in the class5.3.4. Given an enzyme class h, its information content is defined as I(h) =−log2C(h), where C(h) denotes the number of enzymes in h. The similaritybetween two enzymes ei and ej is I(hij), where hij is their lowest commonupper class.
– Sequence alignment. The similarity measure is obtained by aligning the genesor the proteins corresponding to the two enzymes and by considering theresulting alignment score.
3 Behavioural Aspects in Metabolic PathwaysComparison
In this section we briefly discuss how to represent a metabolic pathway as aPetri net. Then we define a similarity measure between two metabolic pathwaysmodelled as Petri nets, which takes into account the flows in the pathways bycomparing their minimal T-invariants. Such measure is combined with a morestandard one which considers homology of reactions.
3.1 Metabolic pathways as Petri nets
PNs are a well known formalism introduced in computer science for modellingdiscrete concurrent systems. PNs have a sound theory and many applicationsboth in computer science and in real life systems (see [32] and [15] for surveyson PNs and their properties). A large number of tools have been developed foranalysing properties of PNs. A quite comprehensive list can be found at thePetri net World site [3].
In some seminal papers Reddy et al. [37, 35, 36] and Hofestadt [21] proposedPetri nets (PNs) for representing and analysing metabolic pathways. Since then,a wide range of literature has grown on the topic [8]. The structural representa-tion of a metabolic pathway by means of a PN can be derived by exploiting thenatural correspondence between PNs and biochemical networks. In fact placesare associated with molecular species, such as metabolites, proteins or enzymes;transitions correspond to chemical reactions; input places represent the substrateor reactants; output places represent reaction products. The incidence matrix ofthe PN is identical to the stoichiometric matrix of the system of chemical re-actions. The number of tokens in each place indicates the amount of substanceassociated with that place. Quantitative data can be added to refine the rep-resentation of the behaviour of the pathway. In particular, extended PNs mayhave an associated transition rate which depends on the kinetic law of the cor-responding reaction. Large and complex networks can be greatly simplified byavoiding an explicit representation of enzymes and by assuming that ubiquitous
Proc. BioPPN 2012, a satellite event of PETRI NET 2012
- 6 -

substances are in a constant amount. In this way, however, processes involvingthese substances, such as the energy balance, are not modelled.
Once metabolic pathways are represented as Petri nets, we consider theirbehavioural aspects as captured by the T-invariants (transition invariants) ofthe nets which, roughly, represents potential cyclic behaviours in the system.More precisely a T-invariant is a (multi)set of transitions whose execution start-ing from a state will bring the system back to the same state. Alternatively,the components of a T-invariant may be interpreted as the relative firing ratesof transitions which occur permanently and concurrently, thus characterising asteady state. Therefore presence of T-invariants in a metabolic pathway is bio-logically of great interest as it can reveal the presence of steady states, in whichconcentrations of substances have reached a possibly dynamic equilibrium.
Although space limitations prevent us from a formal presentation of nets andinvariants, it is useful to recall that the set of (semi-positive) T-invariants canbe characterised finitely, by resorting to its Hilbert basis [40].
Remark 1 (Unique basis). The set of T-invariants of a (finite) Petri net N admitsa unique basis which is given by the collection B(N) of minimal T-invariants.
The above means that any T-invariant can be obtained as a linear combi-nation (with positive integer coefficient) of minimal T-invariants. Uniqueness ofthe basis B(N) allows us to take it as a characteristic feature of the net.
The problem of determining the Hilbert basis is EXPSPACE since the sizeof such basis can be exponential in the size of the net. Still, in our experience,the available tools like INA [47] work fine on Petri nets arising from metabolicpathways.
In a PN model of a metabolic pathway, a minimal T-invariant correspondsto an elementary flux mode, a term introduced in [43] to refer to a minimalset of reactions that can operate at a steady state. It can be interpreted as aminimal self-sufficient subsystem which is associated to a function. Minimal T-invariants are important in model validation techniques (see, e.g., [19, 25]) andthey may provide insights into the network behaviour. By assuming both thefluxes and the pool sizes constants, with some further simplifying assumption,the stoichiometry of the network restricts the space of all possible net fluxes to arather small linear subspace. Such subspace can be analysed in order to capturepossible behaviours of the pathway and its functional subunits [38, 39, 41–44].
3.2 A combined similarity measure between pathways
Metabolic pathways are complex networks of biochemical reactions describingfluxes of substances. Such fluxes arise as the composition of elementary fluxes,i.e., cyclic fluxes which cannot be further decomposed. Most of the techniquesbriefly illustrated in Section 2 compare pathways on the basis of homology oftheir reactions, that is they determine a point to point functional correspon-dence. Some proposals consider also the topology of the network, but still mosttechniques are eminently static and ignore the flow of metabolites in the pathway.
Proc. BioPPN 2012, a satellite event of PETRI NET 2012
- 7 -
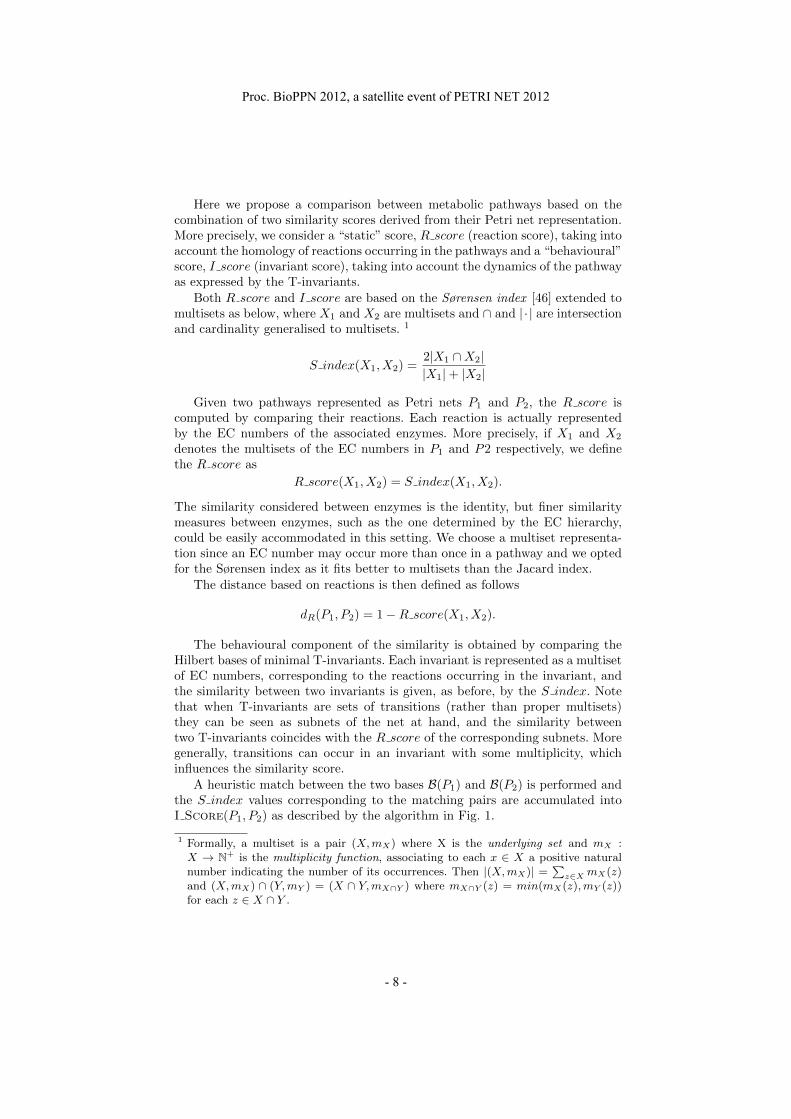
Here we propose a comparison between metabolic pathways based on thecombination of two similarity scores derived from their Petri net representation.More precisely, we consider a “static” score, R score (reaction score), taking intoaccount the homology of reactions occurring in the pathways and a “behavioural”score, I score (invariant score), taking into account the dynamics of the pathwayas expressed by the T-invariants.
Both R score and I score are based on the Sørensen index [46] extended tomultisets as below, where X1 and X2 are multisets and ∩ and | · | are intersectionand cardinality generalised to multisets. 1
S index(X1, X2) =2|X1 ∩X2||X1|+ |X2|
Given two pathways represented as Petri nets P1 and P2, the R score iscomputed by comparing their reactions. Each reaction is actually representedby the EC numbers of the associated enzymes. More precisely, if X1 and X2
denotes the multisets of the EC numbers in P1 and P2 respectively, we definethe R score as
R score(X1, X2) = S index(X1, X2).
The similarity considered between enzymes is the identity, but finer similaritymeasures between enzymes, such as the one determined by the EC hierarchy,could be easily accommodated in this setting. We choose a multiset representa-tion since an EC number may occur more than once in a pathway and we optedfor the Sørensen index as it fits better to multisets than the Jacard index.
The distance based on reactions is then defined as follows
dR(P1, P2) = 1−R score(X1, X2).
The behavioural component of the similarity is obtained by comparing theHilbert bases of minimal T-invariants. Each invariant is represented as a multisetof EC numbers, corresponding to the reactions occurring in the invariant, andthe similarity between two invariants is given, as before, by the S index. Notethat when T-invariants are sets of transitions (rather than proper multisets)they can be seen as subnets of the net at hand, and the similarity betweentwo T-invariants coincides with the R score of the corresponding subnets. Moregenerally, transitions can occur in an invariant with some multiplicity, whichinfluences the similarity score.
A heuristic match between the two bases B(P1) and B(P2) is performed andthe S index values corresponding to the matching pairs are accumulated intoI Score(P1, P2) as described by the algorithm in Fig. 1.
1 Formally, a multiset is a pair (X,mX) where X is the underlying set and mX :X → N+ is the multiplicity function, associating to each x ∈ X a positive naturalnumber indicating the number of its occurrences. Then |(X,mX)| =
∑z∈X mX(z)
and (X,mX) ∩ (Y,mY ) = (X ∩ Y,mX∩Y ) where mX∩Y (z) = min(mX(z),mY (z))for each z ∈ X ∩ Y .
Proc. BioPPN 2012, a satellite event of PETRI NET 2012
- 8 -

function I Score(P1, P2);input : two metabolic pathways P1 and P2;output : the similarity measure between B(P1) and B(P2);
beginI1 = B(P1); I2 = B(P2);score = 0;card = max{|I1|, |I2|};while (I1 6= ∅ ∧ I2 6= ∅) dobegin
(X1, X2) = Find max Sim(I1, I2); {Returns a pair of T-invariants, (X1, X2),in I1 × I2 such that S index (X1 ,X2 )is maximum}
score = score + S index(X1, X2);I1 = I1 − {X1};I2 = I2 − {X2};
end;score = score/card ;return score
end Compute I Score;
Fig. 1. Comparing bases of T-invariants
Again, pathways similarity based on minimal T-invariants induces a distance:
dI(P1, P2) = 1− I score(P1, P2)
The two distances are combined by taking a weighted sum as below, whereα ∈ [0, 1]:
dD(P1, P2) = α dR(P1, P2) + (1− α) dI(P1, P2)
The parameter α allows the analyst to move the focus between homology of reac-tions and similarity of functional components as represented by the T-invariants.
Two organisms O1 and O2 can be compared by considering n metabolicpathways P1, . . . , Pn. In this case the distances between the two organisms withrespect to the various metabolic pathways Pj , j ∈ [1, n], need to be combined.The simplest solution consists in taking the average distance:
dD(O1, O2) =
∑nj=1 dD(P 1
j , P2j )
n
When a pathway Pj occurs in one of the two organisms but not in the other,the corresponding pathway distance dD(P 1
j , P2j ) in the formula above is taken
to be 1.
4 Experimenting with CoMeta
In this section we briefly illustrate the tool CoMeta (Comparing METAbolicpathways) which implements our proposal, and we report on some experiments.
Proc. BioPPN 2012, a satellite event of PETRI NET 2012
- 9 -

CoMeta is a user-friendly tool written in Java and running under Windowsand Linux. Due to space limitation, we just list its main integrated functionali-ties:
– Select organisms and pathways: CoMeta proposes the lists of KEGG organ-isms and pathways and allows the user to select the ones to be compared.Such lists can be saved and then recovered for further processing.
– Retrieve KEGG information: the KEGG files corresponding to the selectedorganisms and pathways are automatically downloaded by CoMeta fromthe KEGG database [2].
– Translate into PNs: CoMeta automatically translates the selected organ-isms and pathways into corresponding Petri nets, by using an extension ofthe tool MPath2PN [9]. The PNML files describing the Petri nets thus ob-tained are available for further processing.
– Compute T-invariants: CoMeta uses the tool INA [47] to compute the basesof semi-positive T-invariants of the PN representations.
– Compute Distances: CoMeta automatically computes the reactions and in-variants distances as defined in Section 3.2, and allows the user to specify theparameter α used for computing the combined distance. Distance matricescan be exported as text files. Moreover, CoMeta allows the user to inspectthe details of the comparison between any pair of organisms (T-invariantsbases, matches between invariants, reactions and invariants scores, etc.).
– Show Phylogenetic trees: the combined distance matrix may be the input of aphylogenetic tree construction method. Currently CoMeta implements theUPGMA and Neighbour Joining methods, and displays the correspondingphylogenetic trees.
4.1 Experiments
In order to validate our proposal CoMeta has been applied to many sets oforganisms. We next show some interesting experiments.
Experiment 1. In the first experiment we consider the glycolysis pathwayin five eucaryotes: Homo sapiens (HSA), Rattus norvegicus (RNO), Meleagrisgallopavo (MGP), Sus scrofa (SSC), Saccharomyces cerevisiae (SCE).
The combined distance has been computed with the parameter α ranging in{0.00, 0.25, 0.50, 0.75, 1.00}. The corresponding phylogenetic trees built with theUPGMA method are shown in Figure 2.
The tree in Figure 2 (left) is built with α = 1, i.e., by considering in thecomparison only homology of reactions. In this case Homo sapiens and Rattusnorvegicus are closely classified because they have the same glycolysis pathway,but Meleagris gallopavo is incorrectly close to them. The tree does not changefor α = 0.75. The tree in Figure 2 (right) is obtained with α = 0.5, hencebesides homology of reactions, it considers also the similarity of T-invariants
Proc. BioPPN 2012, a satellite event of PETRI NET 2012
- 10 -

Fig. 2. UPGMA trees for Experiment 1, with α = 1 (left) and α ≤ 0.5 (right).
(with weigth 0.5). This modifies the classification which now matches exactlythe standard NCBI taxonomy [4]. With α smaller than 0.5, i.e., by increasingthe relevance of the T-invariants in the computation of the distance, we obtainthe same phylogenetic tree.
In this experiment the classification based on glycolysis obtained by consid-ering only the distance on reactions does not match the NCBI taxonomy and itimproves by taking into account the distance on T-invariants, i.e., the combineddistance produces a better classification. This is not always true as shown bythe next experiment.
Experiment 2 In this experiment we consider four eucaryotes − Homo sapi-ens (HSA) Rattus norvegicus (RNO) C. elegans (CEL) Drosophila melanogaster(DME) − and a bacterium − E. coli (ECO) − and three metabolic pathways,glycolysis, pyruvate metabolism and purine metabolism.
Fig. 3. UPGMA trees for experiment 2, with α = 1 (left) and α ≤ 0.75 (right).
The results obtained with α ranging in {0.00, 0.25, 0.50, 0.75, 1.00} are shownin Figure 3. The phylogenetic trees are built with the UPGMA method. Thetree on the left of Figure 3, corresponds to α = 1 and thus it considers onlysimilarity of reactions in the comparison. This classification matches exactly thestandard NCBI taxonomy [4] of the considered organisms. The tree in Figure 3(right), corresponds to consider similarity both of reactions and of T-invariants,with α = 0.75. The classification changes and it does not match any longerthe standard NCBI taxonomy. This remains true by increasing the relevance ofT-invariants i.e., with α = 0.50 or smaller.
In this experiment, by considering the distance based on reactions we get aclassification of the organisms matching the NCBI taxonomy. This is no longer
Proc. BioPPN 2012, a satellite event of PETRI NET 2012
- 11 -
true when considering also T-invariants. This could be due to the fact that thereference NCBI taxonomy considers many characteristics of the organisms, notjust a few metabolic functions as we do. In general, this shows that furtherexperiments are necessary for understanding how to use our combined distance.
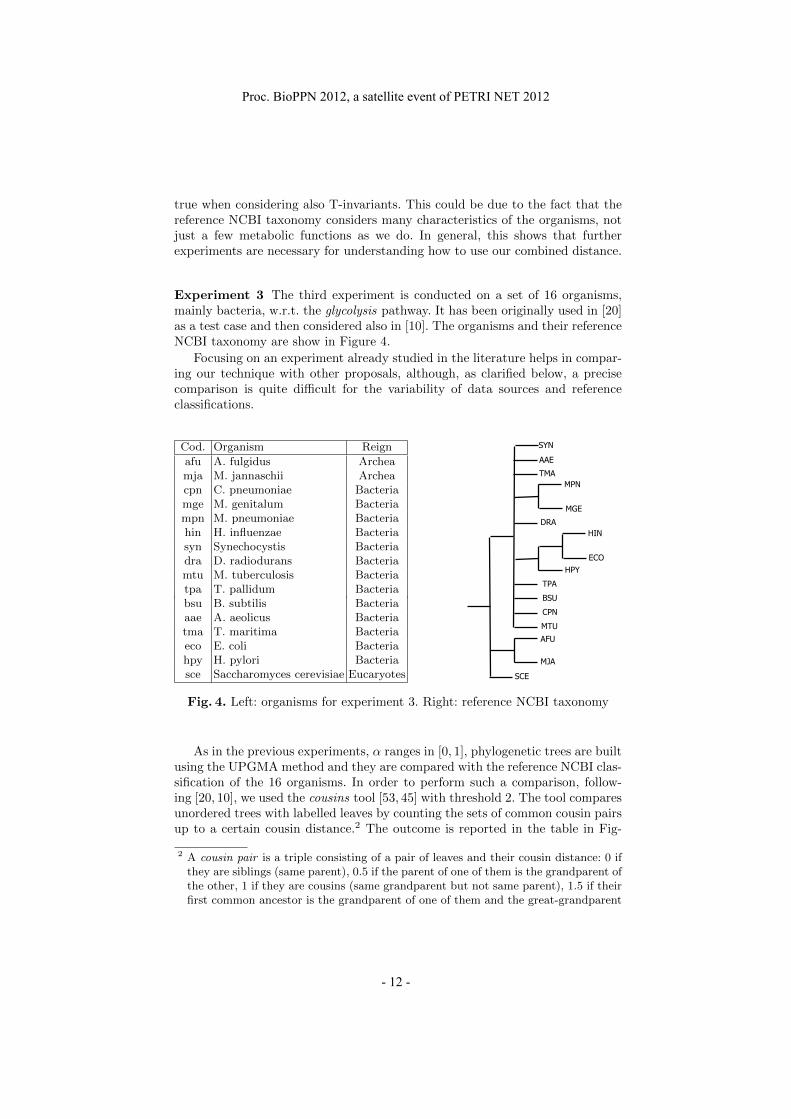
Experiment 3 The third experiment is conducted on a set of 16 organisms,mainly bacteria, w.r.t. the glycolysis pathway. It has been originally used in [20]as a test case and then considered also in [10]. The organisms and their referenceNCBI taxonomy are show in Figure 4.
Focusing on an experiment already studied in the literature helps in compar-ing our technique with other proposals, although, as clarified below, a precisecomparison is quite difficult for the variability of data sources and referenceclassifications.
Cod. Organism Reign
afu A. fulgidus Archeamja M. jannaschii Archeacpn C. pneumoniae Bacteriamge M. genitalum Bacteriampn M. pneumoniae Bacteriahin H. influenzae Bacteriasyn Synechocystis Bacteriadra D. radiodurans Bacteriamtu M. tuberculosis Bacteriatpa T. pallidum Bacteriabsu B. subtilis Bacteriaaae A. aeolicus Bacteriatma T. maritima Bacteriaeco E. coli Bacteriahpy H. pylori Bacteriasce Saccharomyces cerevisiae Eucaryotes
Fig. 4. Left: organisms for experiment 3. Right: reference NCBI taxonomy
As in the previous experiments, α ranges in [0, 1], phylogenetic trees are builtusing the UPGMA method and they are compared with the reference NCBI clas-sification of the 16 organisms. In order to perform such a comparison, follow-ing [20, 10], we used the cousins tool [53, 45] with threshold 2. The tool comparesunordered trees with labelled leaves by counting the sets of common cousin pairsup to a certain cousin distance.2 The outcome is reported in the table in Fig-
2 A cousin pair is a triple consisting of a pair of leaves and their cousin distance: 0 ifthey are siblings (same parent), 0.5 if the parent of one of them is the grandparent ofthe other, 1 if they are cousins (same grandparent but not same parent), 1.5 if theirfirst common ancestor is the grandparent of one of them and the great-grandparent
Proc. BioPPN 2012, a satellite event of PETRI NET 2012
- 12 -

ure 5 (left). Our best result, 0.3163265, corresponds to the phylogenetic tree inFigure 5 (right) and to the combined distance with α ∈ [0.50, 0.75].
α Similarityvalue
0.00 0.250.25 0.26732670.50 0.31632650.75 0.31632651.00 0.2621359
Fig. 5. Results for experiment 3. Left: similarity values computed with cousins.Right: UPGMA phylogenetic tree (α ∈ [0.50, 0.75]).
Our results cannot be immediately compared with those in [20, 10]. In fact,the reference NCBI classification of the 16 organisms (and apparently also thecorresponding KEGG data) has been changing in the meantime. Nevertheless,the experiment suggests that our technique produces results which are at leastcomparable with those in [20, 10].
In particular, in [20] a pathway is represented as an enzyme graph and adistance is defined which takes into account both the structure of the graph andthe similarity between corresponding nodes. A phylogenetic tree is built with theresulting distance matrix by using the Neighbour Joining method. According tothe authors, cousins provides a similarity value of 0.26 between their phyloge-netic tree and their reference NCBI taxonomy and this outperforms the resultsof the phylogenies obtained by NCE, 16SrRNA and [29]. Hence our results im-proves those obtained in [20]. Although space limitations prevent us to reportthe details here, this is true also when we use Neighbour Joining trees.
Instead, in [10] a heuristic comparison algorithm is proposed which computesthe intersection and symmetric difference of the sets of compounds, enzymes,and reactions in the metabolic pathways of different organisms. Their algorithmgives in output a similarity matrix which is used by a fuzzy equivalence relations-based (FER) hierarchical clustering method to compute the classification tree.The authors were not able to reproduce the experiment in [20]. In the cousinscomparison w.r.t. the reference NCBI taxonomy their best result has a similarityvalue of 0.3195876, which is very close to our best result.
5 Conclusions
Biological questions related to evolution and to differences among organisms canbe answered by comparing their metabolic pathways. In this paper we proposea new similarity measure for metabolic pathways which combines a similarity
of the other one, 2 if they are second cousins (same great-grandparent but not samegrandparent) and so on.
Proc. BioPPN 2012, a satellite event of PETRI NET 2012
- 13 -

based on reactions and a similarity based on behavioural aspects such as po-tential fluxes, which correspond to the minimal T-invariants of the Petri netrepresentation of a pathway.
We implemented a tool, CoMeta, to experiment with our proposal. It is noteasy to compare the results we obtained with those in the literature. Neverthelessexperiments made with CoMeta showed that:
– Our combined measure produces valid phylogenetic classifications.– Neither the comparison based on reactions nor the one based on T-invariants
gives always correct results. The refinement due to the introduction of thebehavioural measure can be useful, but further investigations are necessaryto determine how to combine properly the two measures.
– Measures based on more sophisticated representations of a pathway (e.g., us-ing graphs rather than sets, or considering also compounds besides enzymes)not necessarily give better results than our combined measure, as our thirdexperiment shows. However also this hypothesis needs further experimentsto be verified.
We are performing extensive studies on the distributions of the two proposeddistances. This could reveal correlations between them, and, possibly, give in-sights on the ranges for the α parameter (influence of the T-invariants on thecombined distance) providing the best results. We are also extending CoMetato deal with a more refined similarity measure on EC numbers, the hierarchicalsimilarity. We plan to add also the Tanimoto index (extended Jacard index) asan alternative to the Sørensen index. This would allow us to compare and evalu-ate different measures. When comparing organisms on large sets of pathways, afurther extension would be to associate weights to the pathways. Weights couldbe chosen by the user in order to put more emphasis on some pathways of inter-est or could be derived on the basis of characteristics of the pathways, like theirsize.
Moreover, it would be very interesting to compare different organisms by con-sidering their whole metabolic networks. This would allow one to identify moreproperly the T-invariants corresponding to functional units in the metabolic net-work. In fact, when considering single pathways some T-invariants can be notrecognisable since they might be split in different pathways. However, the addi-tional information deriving from the partitioning in well established functionalpathways would be lost. Additionally, comparing full metabolic networks couldbe not viable from a computational point of view since in the worst case Hilbertbases can be exponential in the size of the original net.
CoMeta is part of a larger project to integrate various tools for representingand analysing metabolic pathways through Petri nets. We intend to use the dis-tance matrices computed by CoMeta for different analyses. CoMeta is freelyavailable at: http://www.dsi.unive.it/∼simeoni/CometaTool.tgz.
Acknowledgements. We are grateful to Paolo Besenzon and Silvio Alaimo fortheir contribution to the implementation of the tools used for the experiments.
Proc. BioPPN 2012, a satellite event of PETRI NET 2012
- 14 -

References
1. Kegg Markup Language manual. http://www.genome.ad.jp/kegg/docs/xml.
2. KEGG pathway database - Kyoto University Bioinformatics Centre.http://www.genome.jp/kegg/pathway.html.
3. Petri net tools. http://www.informatik.uni-hamburg.de/TGI/PetriNets/tools.
4. Taxonomy - site guide - NCBI. http://www.ncbi.nlm.nih.gov/guide/taxonomy/.
5. F. Ay, M. Dang, and T. Kahveci. Metabolic network alignment in large scale bynetwork compression. BMC Bioinformatics, 13 (Suppl 3), 2012.
6. F. Ay, T. Kahveci, and V. de Crecy-Lagard. Consistent alignment of metabolicpathways without abstraction. In Int. Conf. on Computational Systems Bioinfor-matics (CSB), pages 237–248. 2008.
7. F. Ay, M. Kellis, and T. Kahveci. SubMAP: Aligning metabolic pathways withsubnetwork mappings. Journal of Computational Biology, 18(3):219–235, 2011.
8. P. Baldan, N. Cocco, A. Marin, and M Simeoni. Petri nets for modelling metabolicpathways: a survey. Natural Computing, 9(4):955–989, 2010.
9. P. Baldan, N. Cocco, F. De Nes, M. Llabres Segura, and M. Simeoni. MPath2PN- Translating metabolic pathways into Petri nets. In M. Heiner and H. Matsuno,editors, BioPPN2011 Int. Workshop on Biological Processes and Petri Nets, CEURWorkshop Proceedings, pages 102–116, 2011.
10. J. Casasnovas, J.C. Clemente, J. Miro-Julia, F. Rossello, K. Satou, and G. Va-liente. Fuzzy clustering improves phylogenetic relationships reconstruction frommetabolic pathways. In Proc. of the 11th Int. Conf. on Information Processingand Management of Uncertainty in Knowledge-Based Systems, 2006.
11. M. Chen and R. Hofestadt. Web-based information retrieval system for the pre-diction of metabolic pathways. IEEE Trans. on NanoBioscience, 3(3):192–199,2004.
12. Q. Cheng, R. Harrison, and A. Zelikovsky. MetNetAligner: a web service tool formetabolic network alignments. Bioinformatics, 25(15):1989–1990, 2009.
13. JC. Clemente, K. Satou, and G. Valiente. Reconstruction of phylogenetic rela-tionships from metabolic pathways based on the enzyme hierarchy and the geneontology. Genome Informatics, 16(2):45–55, 2005.
14. O. Ebenhoh, T. Handorf, and R. Heinrich. A cross species comparison of metabolicnetwork functions. Genome Informatics, 16(1):203–213, 2005.
15. J. Esparza and M. Nielsen. Decidability issues for Petri Nets - a survey. JournalInform. Process. Cybernet. EIK, 30(3):143–160, 1994.
16. C.V. Forst, C. Flamm, I. L. Hofacker, and P. F. Stadler. Algebraic comparisonof metabolic networks, phylogenetic inference, and metabolic innovation. BMCBioinformatics, 7(67), 2006.
17. C.V. Forst and K. Schulten. Evolution of metabolism: a new method for thecomparison of metabolic pathways using genomics information. Journal of Com-putational Biology, 6(3/4):343–360, 1999.
18. C.V. Forst and K. Schulten. Phylogenetic analysis of metabolic pathways. Journalof Molecular Evolution, 52(16):471–489, 2001.
19. M. Heiner and I. Koch. Petri Net Based Model Validation in Systems Biology.In Petri Nets and Other Models of Concurrency - ICATPN 2004, volume 3099 ofLNCS, pages 216–237. Springer, 2004.
20. M. Heymans and A. M. Singh. Deriving phylogenetic trees from the similarityanalysis of metabolic pathways. Bioinformatics, 19(1):i138–i146, 2003.
Proc. BioPPN 2012, a satellite event of PETRI NET 2012
- 15 -

21. R. Hofestadt. A Petri net application of metbolic processes. Journal of SystemAnalysis, Modelling and Simulation, 16:113–122, 1994.
22. S. H. Hong, T. Y. Kim, and S. Y. Lee. Phylogenetic analysis based on genome-scalemetabolic pathway reaction content. Appl. Microbiol. Biotechnology, 65:203–210,2004.
23. M. Kanehisa, M. Araki, S. Goto, M. Hattori, M. Hirakawa, M. Itoh, T. Katayama,S. Kawashima, S. Okuda, T. Tokimatsu, and Y. Yamanishi. KEGG for linkinggenomes to life and the environment. Nuc. Acids Research, pages 480–484, 2008.
24. G. W. Klau. A new graph-based method for pairwise global network alignment.BMC Bioinformatics, 10(Suppl 1), 2009.
25. I. Koch and M. Heiner. Petri nets. In B. H. Junker and F. Schreiber, editors,Analysis of Biological Networks, Book Series in Bioinformatics, pages 139–179.Wiley & Sons, 2008.
26. O. Kuchaiev, T. Milenkovic, V. Memisevic, W. Hayes, , and N. Przulj. Topologicalnetwork alignment uncovers biological function and phylogeny. J. R. Soc. Interface,7(50):1341–1354, 2010.
27. Y. Li, D. de Ridder, M.J.L. de Groot, and M.J.T. Reinders. Metabolic pathwayalignment between species using a comprehensive and flexible similarity measure.BMC Systems Biology, 2008.
28. Z. Li, S. Zhang, Y. Wang, X.S. Zhang, and L. Chen. Alignment of molecularnetworks by integer quadratic programming. Bioinformatics, 23(13):1631–1639,2007.
29. S. Liao, L.and Kim and J.F. Tomb. Genome comparisons based on profiles ofmetabolic pathways. In Proc. of the 6th Int. Conf. on Knowledge-Based IntelligentInformation and Engineering Systems (KES 02), pages 469–476, 2002.
30. E. Lo, T. Yamada, M. Tanaka, M. Hattori, S. Goto, C. Chang, and M. Kanehisa.A method for customized cross-species metabolic pathway comparison. In Proc. ofGenome Informatics 2004. GIW 2004 Poster Abstract: P068, 2004.
31. A. Mithani, G.M. Preston, and J. Hein. Rahnuma: Hypergraph based toolfor metabolic pathway prediction and network comparison. Bioinformatics,25(14):1831–1832, 2009.
32. T. Murata. Petri Nets: Properties, Analysis, and Applications. Proceedings ofIEEE, 77(4):541–580, 1989.
33. S. Oehm, D. Gilbert, A. Tauch, J. Stoye, and A. Goessmann. Comparative PathwayAnalyzer - a web server for comparative analysis, clustering and visualization ofmetabolic networks in multiple organisms. Nuc. Acids Research, 36:433–437, 2008.
34. R.Y. Pinter, O. Rokhlenko, E. Yeger-Lotem, and M. Ziv-Ukelson. Alignment ofmetabolic pathways. Bioinformatics, 21(16):3401–3408, 2005.
35. V. N. Reddy. Modeling Biological Pathways: A Discrete Event Systems Approach.Master’s thesis, The Universisty of Maryland, M.S. 94-4, 1994.
36. V. N. Reddy, M.N. Liebman, and M.L. Mavrovouniotis. Qualitative Analysis ofBiochemical Reaction Systems. Comput. Biol. Med., 26(1):9–24, 1996.
37. V. N. Reddy, M. L. Mavrovouniotis, and M. N. Liebman. Petri net representationsin metabolic pathways. In ISMB93: First Int. Conf. on Intelligent Systems forMolecular Biology, pages 328–336. AAAI press, 1993.
38. C. H. Schilling, D. Letscherer, and B. O. Palsson. Theory for the systemic definitionof metabolic pathways and their use in interpreting metabolic function from apathway-oriented perspective. Journal of Theoretical Biology, 203:229–248, 2000.
39. C. H. Schilling, S. Schuster, B. O. Palsson, and R. Heinrich. Metabolic path-way analysis: basic concepts and scientific applications in the post-genomic era.Biotechnol. Prog., 15:296–303, 1999.
Proc. BioPPN 2012, a satellite event of PETRI NET 2012
- 16 -
40. A. Schrijver. Theory of linear and integer programming. Wiley-Interscience seriesin discrete mathematics and optimization. Wiley, 1999.
41. S. Schuster, T. Dandekar, and D. A. Fell. Detection of elementary flux modesin biochemical networks: a promising tool for pathway analysis and metabolicengineering. Trends Biotechnology, 17(March):53–60, 1999.
42. S. Schuster, D. A. Fell, and T. Dandekar. A general definition of metabolic pathwayuseful for systematic organization and analysis of complex metabolic networks.Nature Biotechnology, 18(March):326–332, 2000.
43. S. Schuster and C. Hilgetag. On elementary flux modes in biochemical reactionsystems at steady state. Journal of Biological Systems, 2:165–182, 1994.
44. S. Schuster, T. Pfeiffer, F. Moldenhauer, I. Koch, and T. Dandekar. Exploring thepathway structure of metabolism: decomposition into subnetworks and applicationto Mycoplasma pneumoniae. Bioinformatics, 18(2):351–361, 2002.
45. D. Shasha, J. T. L. Wang, and S. Zhang. Unordered tree mining with applica-tions to phylogeny. In 20th Int. Conf. on data engineering, pages 708–719. IEEEComputer Society, 2004.
46. T. Sørensen. A method of establishing groups of equal amplitude in plant sociologybased on similarity of species and its application to analyses of the vegetation ondanish commons. Biologiske Skrifter / Kongelige Danske Videnskabernes Selskabg,5(4):1–34, 1948.
47. P.H. Starke and S. Roch. The Integrated Net Analyzer. Humbolt University Berlin,1999. www.informatik.hu-berlin.de/ starke/ina.html.
48. Y. Tohsato. A method for species comparison of metabolic networks using reactionprofile. Inf. and Media Technology, 2(1):109–114, 2007.
49. Y. Tohsato, H. Matsuda, and A. Hashimoto. A multiple alignment algorithm formetabolic pathway analysis using enzyme hierarchy. In Proc. Int. Conf. Intell.Syst. Mol. Biol., pages 376–383, 2000.
50. Y. Tohsato and Y. Nishimura. Metabolic pathway alignment based on similaritybetween chemical structures. Inf. and Media Technology, 3(1):191–200, 2008.
51. E. C. Webb. Enzyme nomenclature 1992: recommendations of the NomenclatureCommittee of the International Union of Biochemistry and Molecular Biology onthe nomenclature and classification of enzymes. San Diego: Published for the Inter-national Union of Biochemistry and Molecular Biology by Academic Press, 1992.
52. S. Wernicke and F. Rasche. Simple and fast alignment of metabolic pathways byexploiting local diversity. Bioinformatics, 23(15):1978–1985, 2007.
53. K. Zhang, J.T.L. Wang, and D. Shasha. On the editing distance between undirectedacyclic graphs. Int. Journal of Foundations of Computer Science, 3(1):43–57, 1996.
Proc. BioPPN 2012, a satellite event of PETRI NET 2012
- 17 -