Embed Size (px)
Citation preview

Comparison of CTD vs XBT Data
LCDR John Whelan
OC3570 - Operational Oceanography and Meteorology
23-30 January, 2007

2
INTRODUCTION
The two most common methods in use today of determining
ocean temperature profiles with depth are via a Conductivity,
Temperature, and Depth (CTD) profiler or via an Expendable
Bathythermograph (XBT) probe. CTD profilers are regarded as
highly accurate and are used by the scientific community for
research purposes. Using the measured temperature values and
derived salinity values from a given CTD cast, the sound
velocity profile over depth for a sampled location can be
computed. The sound velocity profile can then be used to
describe the local acoustic environment and predict naval
acoustic sensor performance. Unfortunately, the CTD profiler has
certain limitations that render it impractical for operational
naval applications. First, in order to take a CTD sample a
vessel must be at a standstill. Depending on the depth of the
water column to be sampled this may require the vessel to remain
in place for up to 45 minutes or more, as the CTD is first
lowered to depth and then raised to the surface. This
requirement is rarely compatible with typical naval operations.
Second, the CTD profiler is lowered to depth via a winch system
using an electrical conducting cable. Naval vessels are not
configured to employ such a system and would require
modifications to host a CTD profiler. And third, CTD profiler
systems are expensive to operate and maintain.
3
An XBT probe is a less sophisticated instrument than the
CTD profiler, only measuring temperature as it descends through
the water column. Depth is computed based on a standard fall
rate and a constant, standard salinity is assumed during
processing. The XBT is more compatible with naval operations
since it does not require the vessel to be at a standstill; XBT
probes can be launched at speeds of up to 15 knots. Because the
XBT does not have to be retrieved and only measures temperatures
on the downcast, data is available sooner than with a CTD. The
XBT is deployed either via a handheld launcher or from a small,
hull-mounted launch tube. The XBT system is cheaper to operate
and maintain than the CTD profiler. Because of its versatility,
simplicity, cost, and smaller footprint, the XBT is the method
of choice for determining sound velocity profiles for naval
operations. However, there is a concern with the accuracy and
bias of the XBT probe which would then impact the computation of
sound velocity profiles.
The Naval Postgraduate School’s winter quarter 2007
Operational Oceanography class (OC3570) conducted a two-leg
research cruise aboard the RV Point Sur from 23-30 January,
2007. Leg I departed from Moss Landing, CA on 23 January with
half the student class, spent two days in Monterey Bay and then
transited along the coast to San Francisco, CA; arriving on 26
January. The second half of the class met the ship in San
4
Francisco and relieved the students from Leg I. Leg II surveyed
San Francisco Bay from 27-28 January and then transited to
Monterey Bay; arriving at Moss Landing, CA on 30 January. During
the cruise, various different environmental measurements were
taken in support of student projects including several CTD and
XBT casts.
The aim of this project is to compare the temperature
versus depth profiles collected by XBT probes with those
measured by the CTD profiler in order to discern any differences
or biases which may then in turn impact sound velocity profiles.
DATA COLLECTION
CTD profiles were obtained using the Sea Bird
911+CTD/Rosette (12 position) with standard sensor suite. XBT
profiles were obtained using the Sippican Mark 12 XBT system
which included the LM-3A Hand Held Launcher. Sippican T-7 XBT
probes were used which have a maximum operational depth of
760 m.
During Legs I and II, XBT probes were dropped in the
vicinity of selected CTD casts. To make full use of the T-7’s
maximum operational depth, XBTs were only deployed when the
corresponding CTD cast exceeded 760 m. Therefore, XBT launches
were confined to Monterey Bay Canyon and offshore stations and
none were made within the shallow water areas of Monterey Bay or
5
in San Francisco Bay. Over the course of the cruise, 25 pairs of
CTD/XBT profiles were identified.
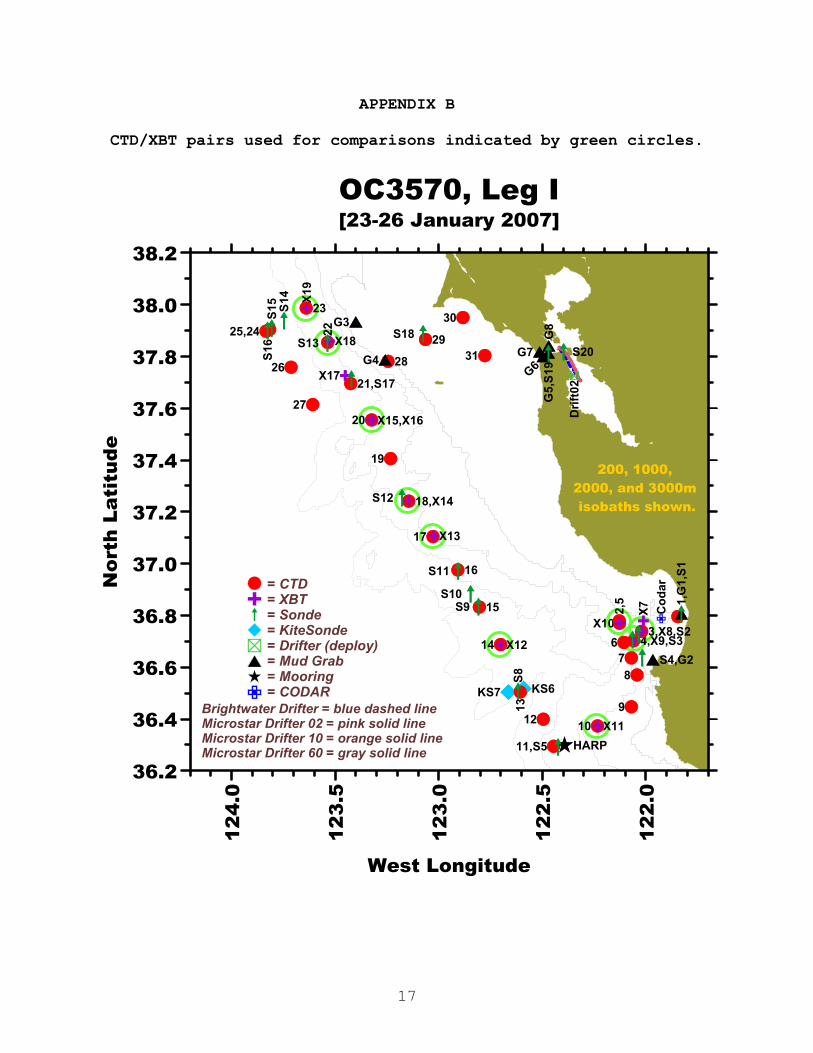
Appendix A contains the location of each CTD/XBT pair.
Appendix B contains a graphical depiction of the location of
each CTD/XBT pair.
DATA QUALITY CONTROL
Once the 25 available pairs of CTD/XBT profiles were
identified, the raw data for each cast was examined. CTD data is
recorded in ASCII text format (.asc) while XBT data is recorded
in European data format (.edf). It should be noted that CTD
depth data is recorded in dbars while XBT depth data is recorded
in meters and must be adjusted accordingly when processing the
data.
Using the final cruise report and looking at the raw data
files, it was found that one XBT was erroneously processed as a
T-6 vice T-7 XBT (data was recorded to only 460 m), one XBT
failed during deployment, one CTD cast failed due to an
electrical short, and one pairing was over 4 km apart and deemed
not representative of the same water column. These four pairings
were not used in the data comparisons, leaving 21 viable CTD/XBT
pairs.
Using MATLAB 6.5, temperature vs depth was plotted for each
of the 21 CTD/XBT pairs and then visually inspected. The first
6
immediate error noted was a temperature jump at the end of some
of the XBT files. When an XBT reaches maximum depth, a jump in
temperature is observed as the copper conducting wire breaks and
the electrical signal spikes. These temperature jumps were
removed from all XBT files. In addition, CTD cast 23 revealed a
decibar measurement of 0.000 at approximately 336 m which was
readily evident when plotted. A default value was inserted for
the missing reading by interpolating between the readings above
and below this depth.
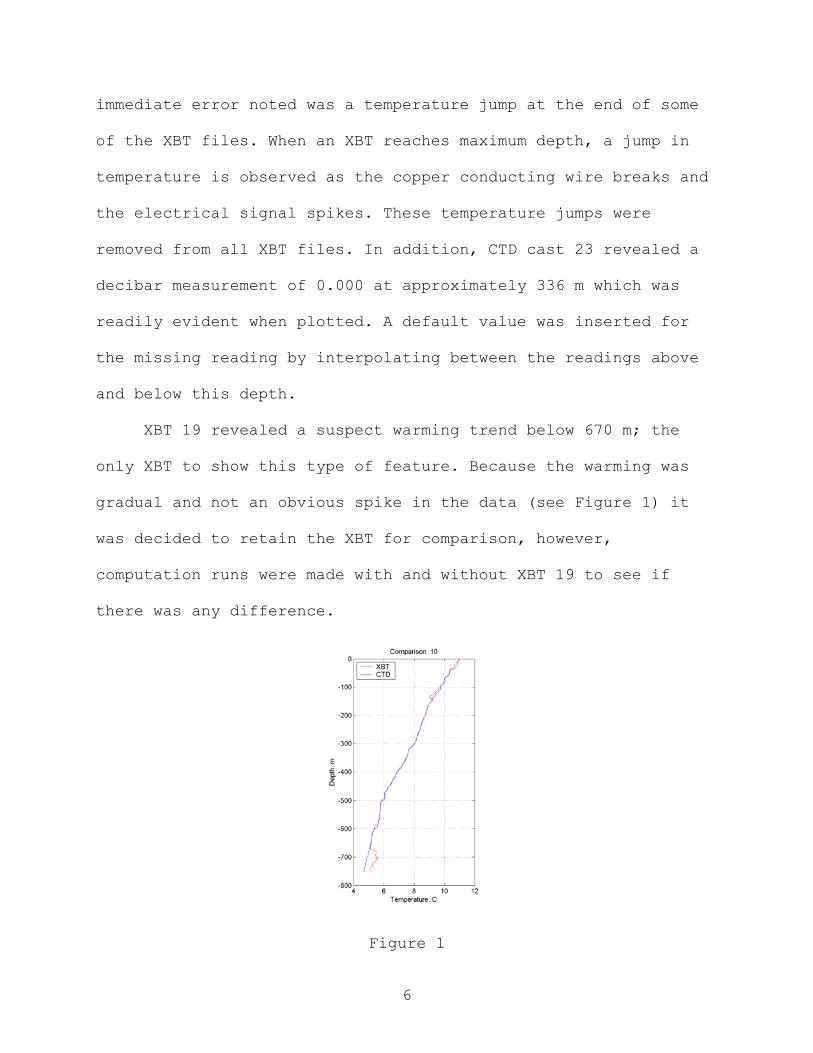
XBT 19 revealed a suspect warming trend below 670 m; the
only XBT to show this type of feature. Because the warming was
gradual and not an obvious spike in the data (see Figure 1) it
was decided to retain the XBT for comparison, however,
computation runs were made with and without XBT 19 to see if
there was any difference.
Figure 1

7
In addition to plotting the data and observing any visual
differences, the horizontal separation distance between each CTD
and XBT pairing was computed from the recorded latitude and
longitude for each cast. Five pairings were flagged due to being
over 1 km apart.
Figure 2
A visual inspection of the data and comparison of the
CDT/XBT temperature plots for pairings 11, 16, 17, 19, and 20
did not indicate substantial differences and thus were included
with the remaining pairs. However, when the data was processed
two runs were made for comparison - one which included all 21
pairs and one with the above five flagged pairs excluded.
METHODS OF DATA PROCESSING
Because of the high accuracy and known calibration of the
Sea Bird CTD profiler, the CTD profiler is considered to
CTD vs XBT Drop Separation Distance
0
0.5
1
1.5
2
2.5
3
1 2 3 4 5 6 7 8 9 10 11 12 13 14 15 16 17 18 19 20 21
CTD / XBT Pair
Dis
tanc
e k
Series1

8
represent the true temperature and salinity depth profile for
the stations sampled during this cruise. Temperature comparisons
were made between the CTD and XBT for the same depth and any
differences were assumed to be due to the inaccuracy of the XBT.
Because the XBT probe measures depth in meters and the CTD
profiler measures depth in decibars, the first necessary step
was to convert the CTD pressure readings to meters to allow for
direct comparisons. A MATLAB routine was used to extract the CTD
pressure values and convert them to depth in meters.
The second step was to adjust for sampling rates between
the CTD and XBT. In order to compare the temperature values
between the CTD and XBT, the temperature values from each data
set must be at the same depth. The CTD profiler took temperature
readings approximately every meter as it descended, while the
XBT probe took temperature readings approximately every 0.64
meters. An interpolation routine was run in MATLAB to allow for
temperature comparisons at equal depths.
Once the above adjustments were made to the data, a direct
comparison could be made between CTD and XBT temperature
readings. As mentioned previously, the CTD temperature was
assumed to represent truth against which the XBT was compared.
XBT temperatures for each depth were subtracted from the CTD
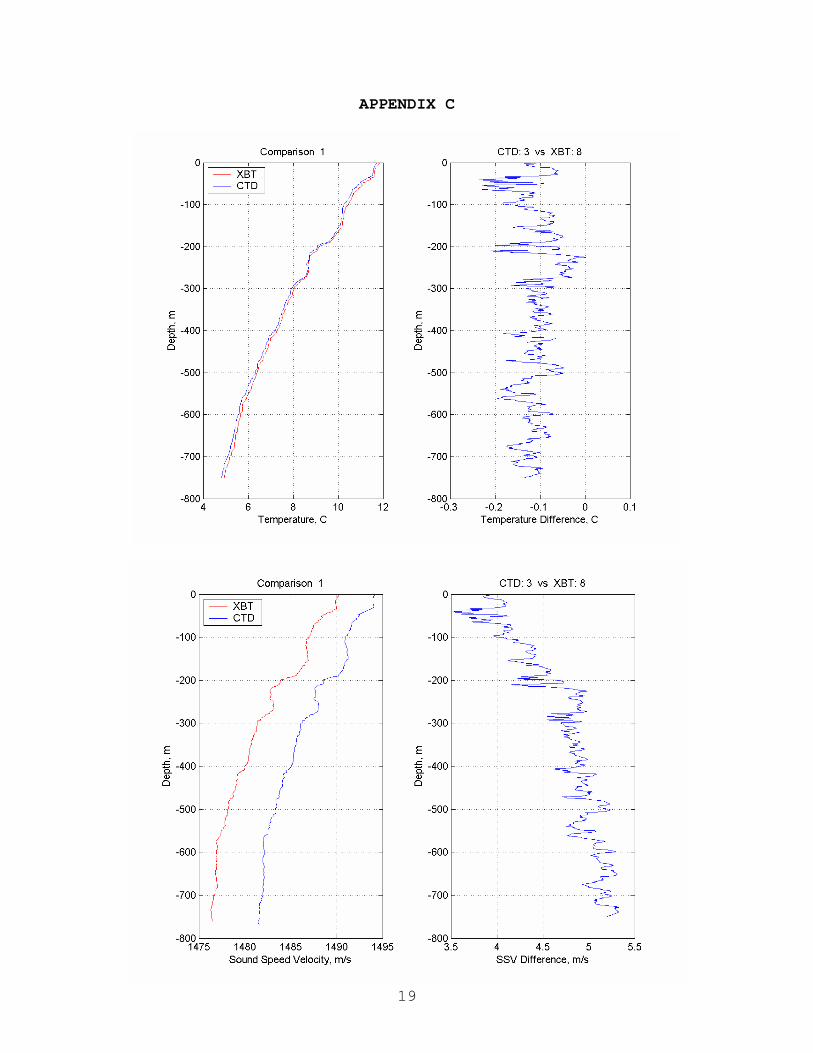
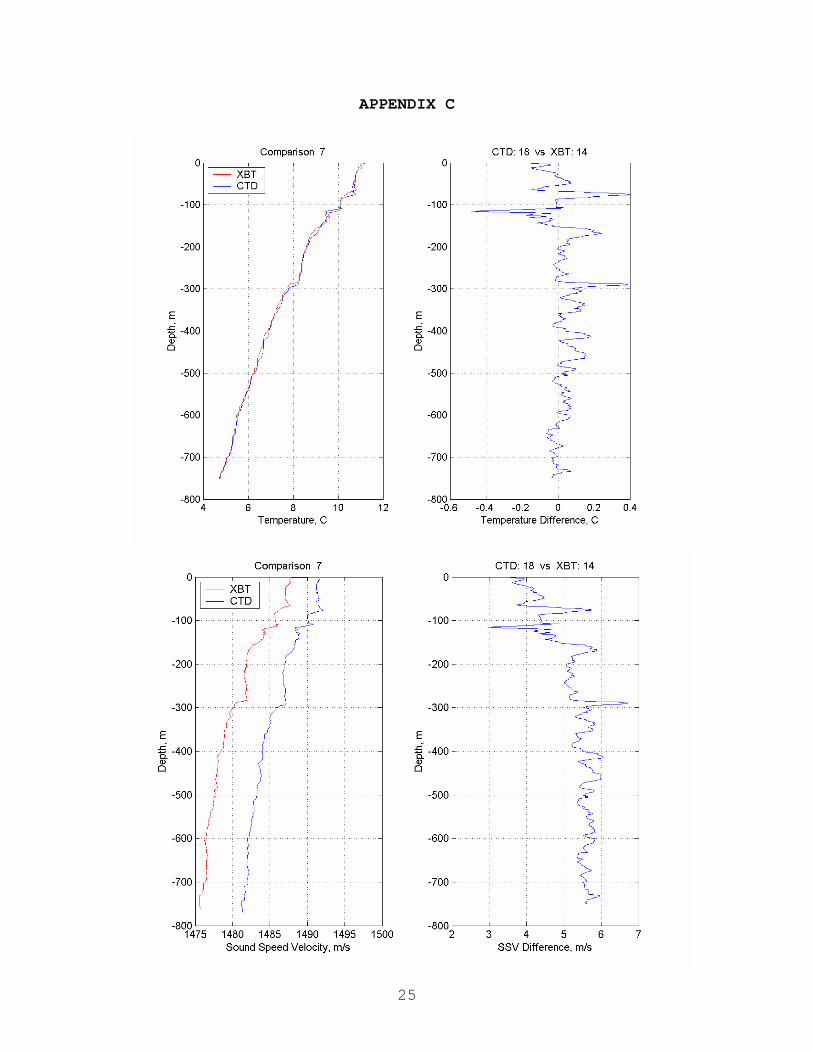
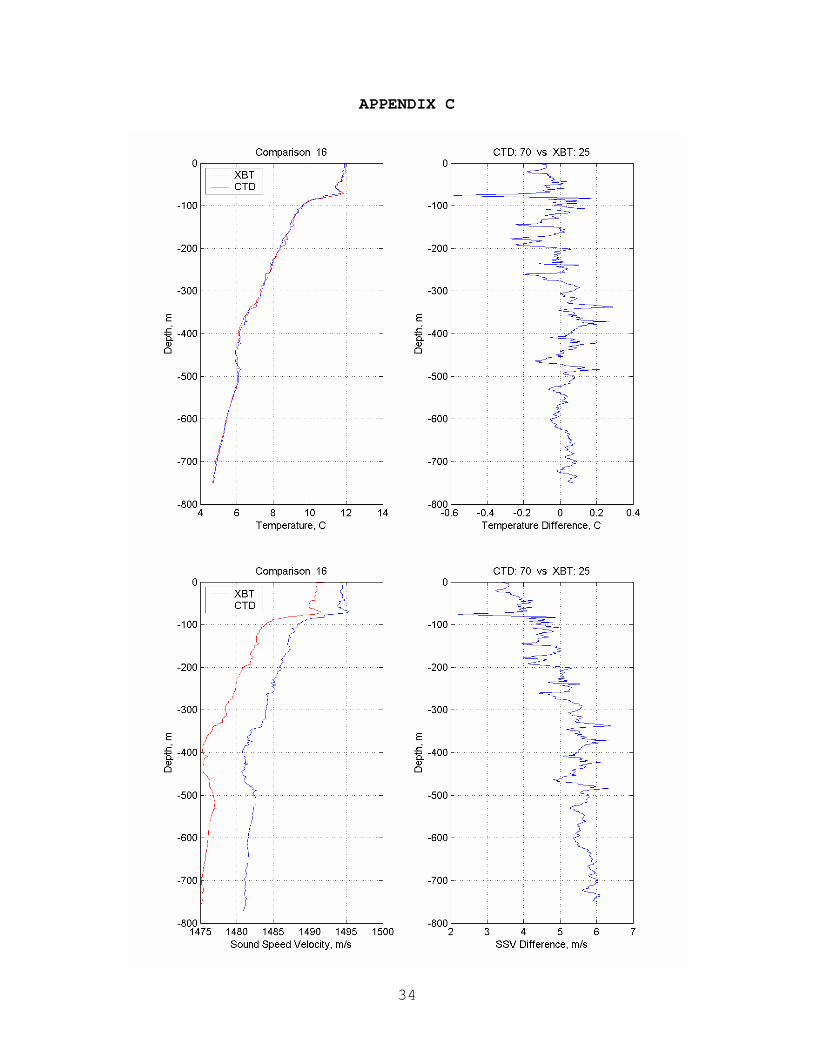
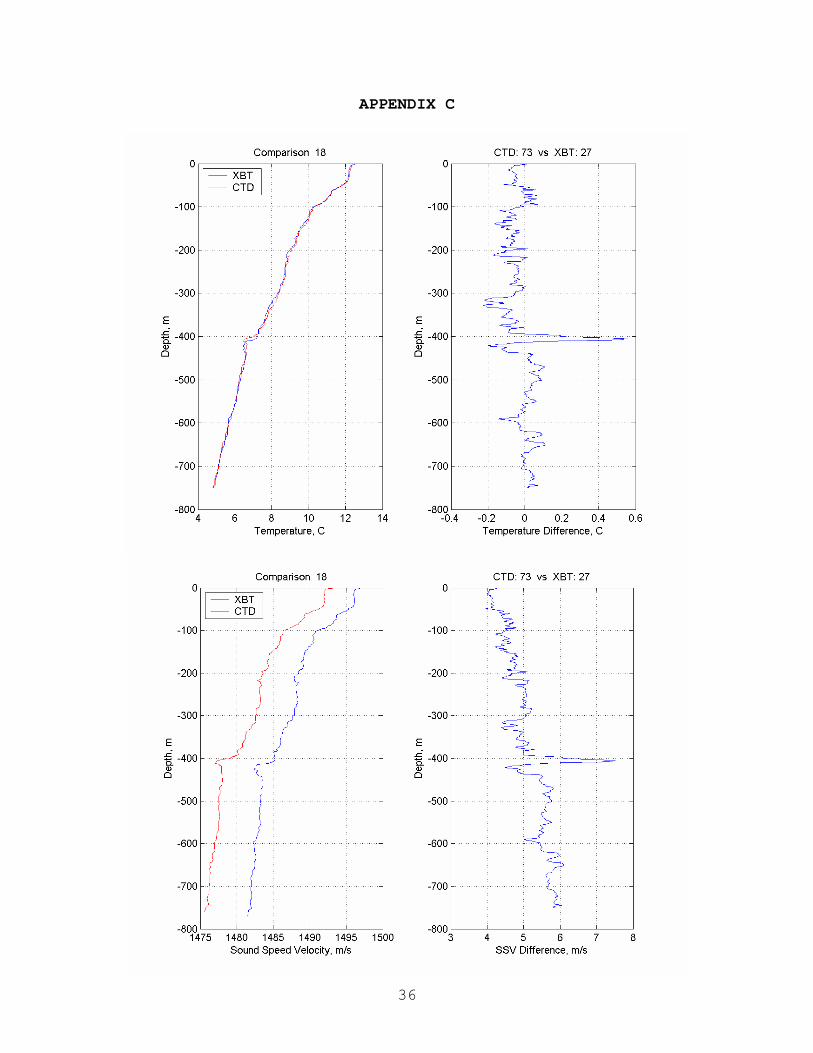
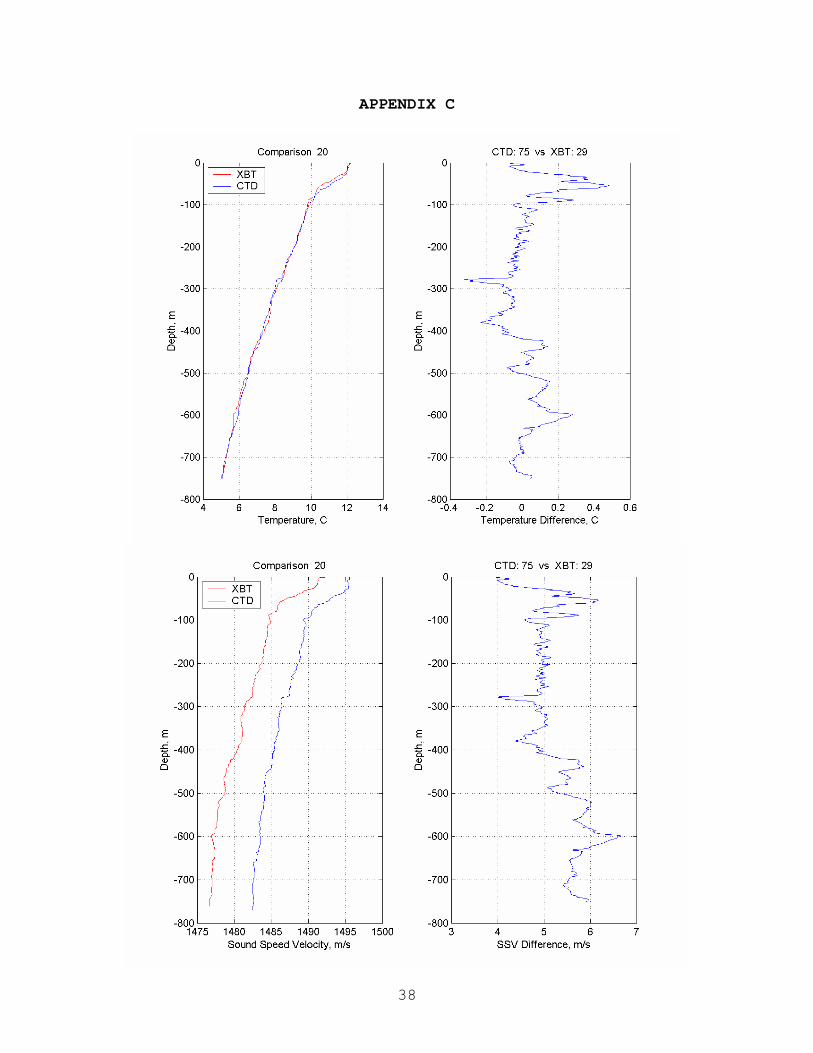
temperature values. Appendix C contains the plots of each pair

9
of CTD/XBT temperature readings along with the temperature
difference between the two instruments.
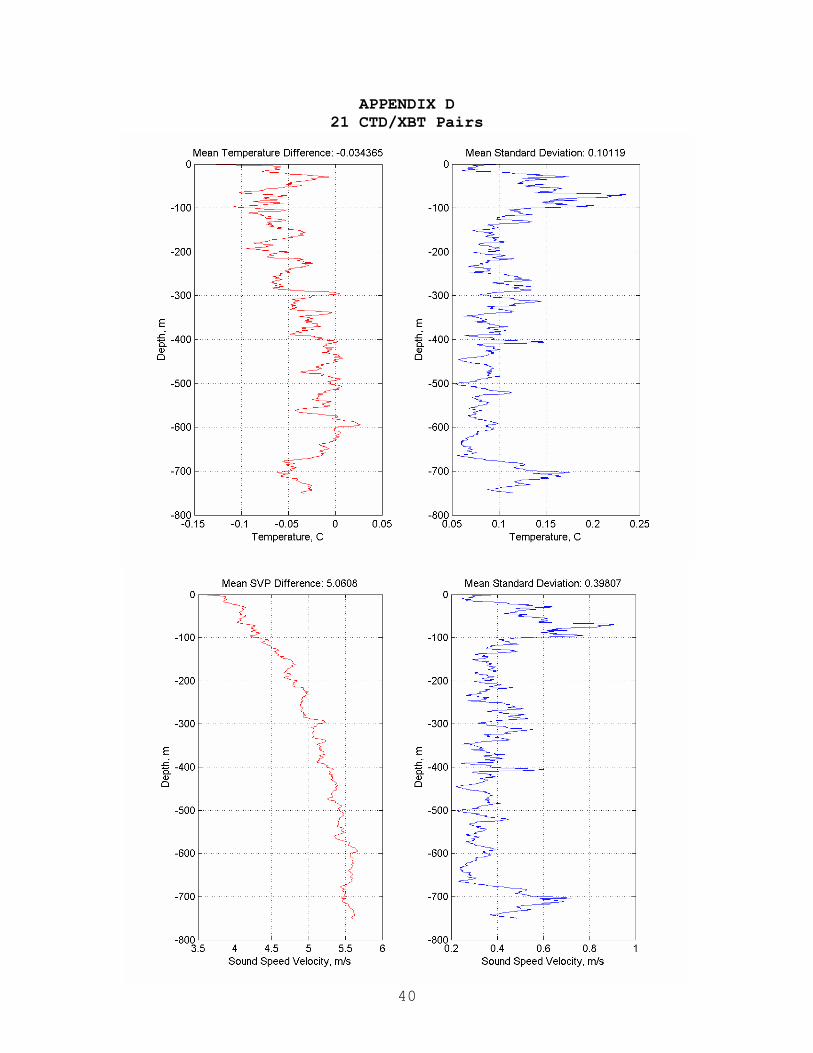
For each CTD/XBT pair, the mean and standard deviation was
calculated for each depth, which was then incorporated into an
overall mean and standard deviation for the entire data set.
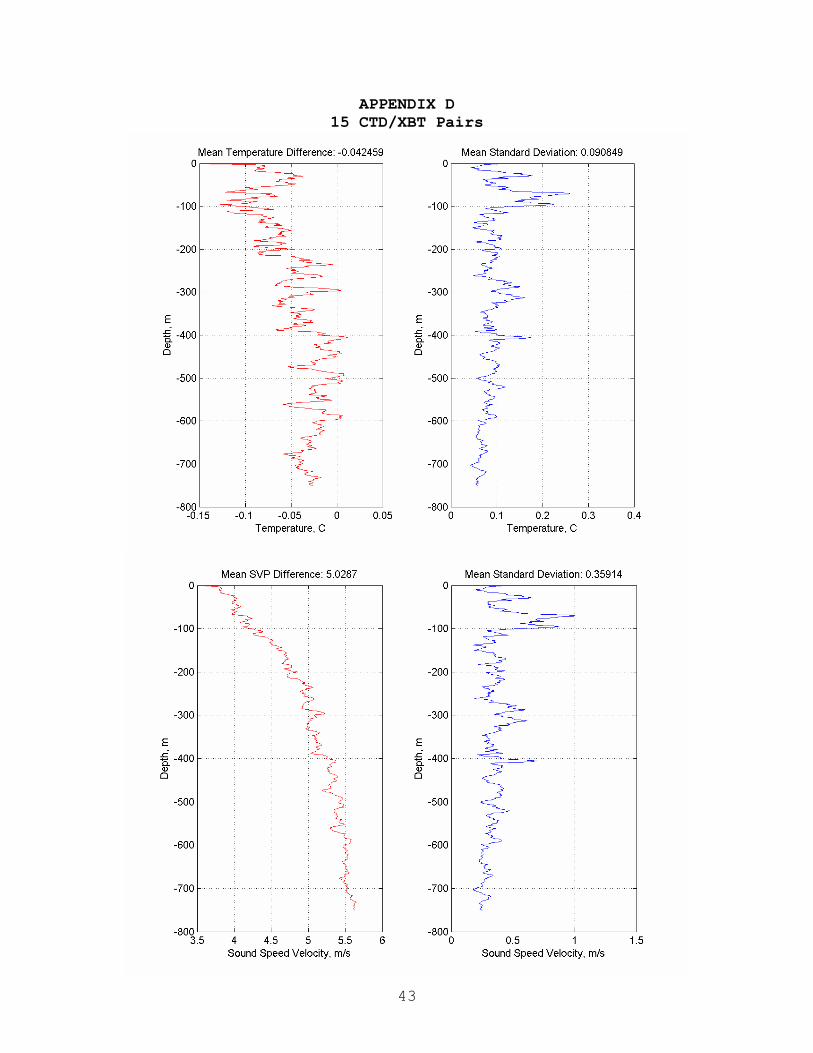
Appendix D contains the mean and standard deviation results.
The XBT extraction program calculates sound velocity based
on the obtained temperature vs depth readings and an assumed
salinity of 30 psu. The seawater sound velocity m-file
(sw-svel.m) was used in MATLAB to compute sound velocity from
the CTD data using the measured temperature, salinity, and
pressure values obtained during the cast. The sound velocity
profile for each sample and the difference for each pair was
plotted in MATLAB. Appendix C contains the plots for each pair.
In addition, the mean and standard deviation of the sound
velocity calculations for the entire set is included in
Appendix D.
It was noted earlier that five of the CTD/XBT pairs had
separation distances within each pair over 1 km apart. In order
to see if these five pairs had any significant impact on the
overall mean and standard deviation, the comparisons were re-run
excluding these suspect CTD/XBT pairs – resulting in 16 useable
pairs. In addition, XBT 19 exhibited a temperature deviation at
depth (see Figure 1) and was also considered suspect. The
10
comparisons were then re-run excluding the CTD23/XBT19 pair –
resulting in 20 and 15 useable pairs. Appendix D contains the
mean and standard deviation results for temperature and sound
velocity from these alternate data sets.
As a last comparison, empirical orthogonal functions were
computed for the 21 pairs of CTD, XBT, temperature difference
and sound velocity differences to analyze the variation in the
principle components. The results are contained in Appendix E.
RESULTS
The results of the CTD/XBT temperature and sound velocity
comparisons are summarized in Tables 1 & 2. Over the depth of
the water column the 21 XBT probes ranged from 0.0271 0C colder
to 0.1270 0C warmer than measured CTD temperatures, with an
overall average value of 0.0344 0C warmer. The coldest XBT
readings occurred at depths greater than 400 m, while the
warmest readings were all at the surface. The standard deviation
ranged from 0.2351 0C to 0.0257 0C with an overall mean standard
deviation of 0.1012 0C. The greatest variation occurred in the
upper 70 m of water while the least variation typically occurred
at 500 m. From the plots in Appendix C these results can be seen
visually with the greatest variability seen from the surface to
100 m and below 700 m, while the middle of the water column
yields the most stable results. The differences in sound

11
velocity are included in Table 2. Sound velocity differences
varied from a maximum of 5.665 m/s at approximately 600 m to a
minimum of 3.63 m/s at the surface, corresponding to the maximum
and minimum temperature measured differences. The warm bias of
the XBT probes resulted in an average sound velocity 5.06 m/s
slower than that computed by the CTD profiler.
When comparing the full data set of 21 CTD/XBT pairs to the
reduced data sets, the standard deviation improved however the
warm temperature bias increased from 0.0344 to 0.0425 0C. The
results were similar enough, however, that no reason to exclude
the full data set of 21 CTD/XBT pairs was justified.
21 Pairs 20 pairs 16 pairs 15 pairs
Mean T diff (0C) -0.034365 -0.034342 -0.041981 -0.042459
Max cold XBT (0C)
Depth level (m)
0.0271
593
0.0208
594
0.0150
590
0.0122
404
Max warm XBT (0C)
Depth level (m)
-0.1270
1
-0.1354
1
-0.1271
1
-0.1383
1
Mean T StdDev 0.10119 0.095355 0.098326 0.090849
Max T StdDev
Depth level
0.2351
68
0.2403
68
0.2522
69
0.2602
69
Min T StdDev
Depth level
0.0527
499
0.0517
499
0.0499
260
0.0420
9
Table 1
CTD/XBT Temperature Differences

12
21 Pairs 20 pairs 16 pairs 15 pairs
Mean SSV diff (m/s) 5.0608 5.0628 5.0282 5.0287
Max SVP diff (m/s)
Depth level (m)
5.6653
593
5.7080
732
5.6141
590
5.6456
731
Min SVP diff (m/s)
Depth level (m)
3.6301
1
3.6035
1
3.6473
1
3.6129
1
Mean SSV StdDev 0.39807 0.37427 0.38898 0.35914
Max SVP StdDev
Depth level
0.9049
68
0.9255
69
0.9726
69
1.0027
69
Min SVP StdDev
Depth level
0.2207
445
0.2189
449
0.1920
260
0.1752
702
Table 2
CTD/XBT Sound Velocity Differences
COMPARISON WITH PREVIOUS STUDENT STUDIES
Previous student comparisons obtained similar results. All
showed a warm bias in the XBT measured temperatures as compared
to the temperatures measured by the CTD profiler and each study
obtained similar standard deviations. Table 3 summarizes the
mean temperature and standard deviations from this study and
previous studies. The Sippican corporation claims an accuracy of
±0.1 0C in their XBT probe product brochure which this study
verified, but is slightly outside the average deviation when
combined with the results of the six previous student studies.
Some of the previous studies also explored in further depth the

13
warm bias in the upper 100 m of the water column, however this
study did not separate the data in this manner.
Author, Yr (sample size) Mean T diff(0C) Std Dev (0C)
Schmeiser, 2000 (18) -0.1549 0.2151
Roth, 2001 (9) -0.0783 0.1047
Boedeker, 2001 (27) -0.0882 0.2147
Fang, 2002 (28) -0.1074 0.1546
Dixon, 2003 (24) -0.1275 0.0598
Laird, 2006 (13) -0.0407 0.0936
Whelan, 2007 (21) -0.0344 0.1012
Average -0.0902 0.1348
Table 3
Previous Student Results
DISCUSSION
The results and conclusions of this study are consistent
with the six previous studies in the measurement of the CTD/XBT
temperature differences and standard deviation. However, the
previous studies claim sound velocity differences on the order
of 0.163 ~ 0.51 m/s based on the calculation in Schmeiser
(2000), where it was calculated that a bias of 0.4 °C would
change the computed sound speed by 1.6 m/s or approximately 0.1%
of the average 1500 m/s sound velocity of sea water. Based on

14
this calculation the measured sound velocity differences from
the current study should be on the order of 0.14 m/s. This study
however, used the sound velocity program in MATLAB to compute
sound velocity based on the CTD and XBT data collected during
this cruise. The average sound velocity differences based on CTD
and XBT temperature differences were on the order of 5.06 m/s
vice 0.163 ~ 0.51 m/s. Despite the large discrepancy between
this study and previous studies on the computed effect of
CTD/XBT temperature differences on sound velocity, the overall
impact of this difference results in changes on the order of
only 0.34% of the 1500 m/s average value of sound speed in sea
water.
The warm bias in XBT measurements is of concern to
scientific research and must be accounted for in any studies
that use XBT data in conjunction with CTD data. However, as
concluded in previous student studies, this warm bias is not
significant to naval operations and XBT probes remain a viable
method for quickly and cheaply determining the sound velocity
profile for a given operating area.
15
REFERENCES Boedeker, S., (2001) “Comparison of CTD and XBT Temperature Profiles”, Paper submitted for OC3570. Dixon, J.S., (2003) “A Comparison of Expendable Bathythermograph and Conductivity Temperature Depth Profiles” Paper submitted for OC3570. Fang, C., (2002) “XBT/CTD Comparisons” Paper submitted for OC3570. Heinmiller, R.H., et al. (1983) “Instruments and Methods: Systematic Errors in Expendable Bathythermograph (XBT) Profiles.” Deep-Sea Research, Vol 30, No. 11A, pp. 1185 - 1197. Great Britain: Pergamon Press Ltd. Laird, A., (2006) “XBT and CTD Temperature Measurement Comparison and XBT and GDEM Sound Velocity Profile Comparison” Paper submitted for OC3570. Sea_Bird Electronics, Inc, CTD Profiling Systems, http://www.seabird.com/products/spec_sheets/911data.htm Sippican, Inc., “Expendable Bathythermograph Expendable Sound Velocimer (XBT/XSV) Expendable Profiling Systems”, http://www.sippican.com/stuff/contentmgr/files/0dad831400ede7b5f71cf7885fdeb110/sheet/xbtxsv92005.pdf Valeport http://www.valeport.co.uk/Notes/CTD%20vs%20SV%20040915%20.htm Windows to the Universe, CTD Instruments http://www.windows.ucar.edu/tour/link=/earth/Water/CTD.html&edu=high

APPENDIX A
16
Comparison Probe Latitude Longitude Depth XBT/CTD – m/dbar
Distance (m)
1 XBT 8 CDT 3
36-44.28 36-44.30
122-01.24 122-01.26
760.4 1010.9
47
2 XBT 9 CDT 4
36-42.15 36-42.15
122-03.52 122-03.54
760.4 1423.0
30
3 XBT 10 CDT 5
36-46.18 36-46.18
122-07.66 122-07.68
760.4 1010.0
30
4 XBT 11 CDT 10
36-22.37 36-22.39
122-13.96 122-14.02
760.4 1012.3
97
5 XBT 12 CDT 14
36-41.19 36-41.24
122-42.05 122-42.10
760.4 1011.0
119
6 XBT 13 CDT 17
37-06.41 37-06.26
123-01.45 123-01.67
760.4 1011.7
428
7 XBT 14 CDT 18
37-14.56 37-14.48
123-08.72 123-08.71
760.4 1011.3
149
8 XBT 16 CDT 20
37-33.25 37-33.28
123-19.39 123-19.44
760.4 1010.0
92
9 XBT 18 CDT 22
37-51.57 37-51.25
123-31.66 123-32.16
760.4 1011.0
941
10 XBT 19 CDT 23
37-59.14 37-59.22
123-38.24 123-38.38
760.4 1011.0
252
11 XBT 20 CDT 64
37-28.98 37-28.23
123-28.62 123-30.25
760.4 1012.0
2769
12 XBT 21 CDT 66
37-10.89 37-11.01
123-17.91 123-18.01
760.4 1011.8
267
13 XBT 22 CDT 67
37-02.24 37-02.28
123-11.67 123-11.83
760.4 1011.0
248
14 XBT 23 CDT 68
36-53.54 36-53.60
123-05.24 123-05.34
760.4 1013.3
185
15 XBT 24 CDT 69
36-44.76 36-44.85
122-59.04 122-59.04
760.4 1011.5
166
16 XBT 25 CDT 70
36-34.95 36-36.18
122-52.09 122-52.78
760.4 1011.0
2498
17 XBT 26 CDT 71
36-26.20 36-27.52
122-46.52 122-46.33
760.4 1010.0
2461
18 XBT 27 CDT 73
36-29.08 36-29.13
122-19.07 122-19.23
760.4 1010.9
256
19 XBT 28 CDT 74
36-36.85 36-37.62
122-24.66 122-25.19
760.4 1012.0
1629
20 XBT 29 CDT 75
36-45.54 36-46.20
122-30.88 122-31.23
760.0 1011.0
1328
21 XBT 30 CDT 78
36-38.57 36-38.56
122-07.26 122-07.35
760.4 2126.7
135
APPENDIX B
CTD/XBT pairs used for comparisons indicated by green circles.
17
678
910
11,S5
12
KS7
14
S9S10
S11
17
S12
19
20
X17
S13
G325,24
26
27
G4
S1830
31 G7
X10 3,X8,S24,X9,S3
S4,G2
X11HARP
KS6
X12
15
16
X13
18,X14
X15,X16
21,S17
23
28
29S20
X18
1,G
1,S1
X72,5
S8
22
X19
S14
S15
G8
Cod
ar
13
S16
G5,
S19
Drif
t02
G6
124.
0
123.
5
123.
0
122.
5
122.
0
West Longitude
OC3570, Leg I
36.2
36.4
36.6
36.8
37.0
37.2
37.4
37.6
37.8
38.0
38.2
Nor
th L
atit
ude
= CTD= XBT= Sonde= KiteSonde= Drifter (deploy)= Mud Grab= Mooring= CODAR
Brightwater Drifter = blue dashed lineMicrostar Drifter 02 = pink solid lineMicrostar Drifter 10 = orange solid lineMicrostar Drifter 60 = gray solid line
200, 1000, 2000, and 3000m isobaths shown.
[23-26 January 2007]

APPENDIX B
CTD/XBT pairs used for comparisons indicated by green circles.
18
S25
63,64
S26
X21
X22
X23
X24
70
S27X26
X27
74
75
S28
7778
59
60
61
62
X20
65
66
67
68
69
X25
71
72
73
X28
X2976
X30
79
80
S29
OC3570, Leg II
36.4
36.6
36.8
37.0
37.2
37.4
37.6
Nor
th L
atit
ude
123.
6
123.
4
123.
2
123.
0
122.
8
122.
6
122.
4
122.
2
122.
0
121.
8
West Longitude
ADCP (for AUV)
200, 1000, 2000, and 3000m
isobaths shown.
= CTD= XBT= Sonde
[Ocean work, 29-30 January 2007]
APPENDIX C
19

APPENDIX C
20

APPENDIX C
21

APPENDIX C
22

APPENDIX C
23

APPENDIX C
24
APPENDIX C
25

APPENDIX C
26

APPENDIX C
27

APPENDIX C
28

APPENDIX C
29

APPENDIX C
30

APPENDIX C
31

APPENDIX C
32

APPENDIX C
33
APPENDIX C
34

APPENDIX C
35
APPENDIX C
36

APPENDIX C
37
APPENDIX C
38

APPENDIX C
39
APPENDIX D 21 CTD/XBT Pairs
40

APPENDIX D 20 CTD/XBT Pairs
41

APPENDIX D 16 CTD/XBT Pairs
42
APPENDIX D 15 CTD/XBT Pairs
43

APPENDIX E 21 XBT EOF
44

APPENDIX E 21 CTD EOF
45

APPENDIX E 21 CTD/XBT Temperature Difference EOF
46

APPENDIX E 21 CTD/XBT Sound Velocity Difference EOF
47