Embed Size (px)
Citation preview

HAL Id: jpa-00244739https://hal.archives-ouvertes.fr/jpa-00244739
Submitted on 1 Jan 1980
HAL is a multi-disciplinary open accessarchive for the deposit and dissemination of sci-entific research documents, whether they are pub-lished or not. The documents may come fromteaching and research institutions in France orabroad, or from public or private research centers.
L’archive ouverte pluridisciplinaire HAL, estdestinée au dépôt et à la diffusion de documentsscientifiques de niveau recherche, publiés ou non,émanant des établissements d’enseignement et derecherche français ou étrangers, des laboratoirespublics ou privés.
Comparison of costs for solar electric sources with dieselgenerators in remote locations
F.K. Manasse
To cite this version:F.K. Manasse. Comparison of costs for solar electric sources with diesel generators in remote loca-tions. Revue de Physique Appliquée, Société française de physique / EDP, 1980, 15 (3), pp.369-376.�10.1051/rphysap:01980001503036900�. �jpa-00244739�

369
Comparison of costs for solar electric sources withdiesel generators in remote locations
F. K. Manasse
Vice-President, AETA Corporation and Associate Director, Integrated Energy Systems Division,Center for Industrial and Institutional Development, University of New Hampshire, U.S.A.
(Re.çu le 10 septembre 1979, accepté le 18 octobre 1979)
Abstract. 2014 This paper looks specifically at three alternative sources for generating power in remote regions of theworld. These include diesel electric, photovoltaic and solar thermal electric devices. Fuel cost, and more specifically,transportation costs of that fuel, dramatically change which device will be most cost effective over a ten yearperiod under specific conditions. In areas where fuel is readily available, diesel still appears to be the best alternativefinancially. Even today, however, solar thermal generators appear to make sense in a number of realistic scenarios,especially those involving LDCs. Photovoltaics do not yet seem to be competitive, but technical advances mayin fact change this in the future. Cultural factors must also be taken into account when choosing a device. Thesecomparisons are all represented graphically and numerically in the body of this paper.
Revue Phys. Appl. 15 (1980) 369-376 MARS 1980,
1. Introduction. - The focus of this paper is toexamine the relative merits of various devices capableof producing power in the 10 and 20 kWe range forremote regions all over the world. Factors such as
reliability, maintenance, and comparative costs areused to help determine precisely which deviceswould be of the most value under various conditions.These conditions would include availability anddistances from supplies of conventional fuels, localtechnical expertise, climate, power needs, and alter-natives available. All financial comparisons takeinto account the time value of money, a commonbusiness technique described briefly in this paper.This information is intended to clarify the market,specifically for small power stations in Lesser Deve-loped Countries (LDCs) so that R and D organiza-tions can better direct their efforts in these areas
and private corporations can focus the marketingof their products more clearly., Cultural factorsmust also be taken into account when choosinga device for a given situation. These factors includesuch basic considerations as general acceptanceby the people in question, and the availability ofskilled technicians for maintenance requirements.
2. Background. - Saudi Arabia currently has amajor program with the U.S. to assist them in solarenergy development and deployment. Egypt, Kuwait,and other Arab countries as well as numerous Africanand Asian nations have major efforts currentlydevoted to small and large solar electric applicationssuch as irrigation, desalination, and rural electrifi-
cation. The major competing non-solar power sourcesfor typical 200 family-sized villages which the spon-soring govemment plans to electrify in the next
5-10 years are gasoline or diesel generators [1].This merely touches the surface of the worldwideinterest in solar energy especially in third worldcountries. Traditionally, since the European countriesonce colonized these areas, they have retainedconsiderable influence in selling to government,commercial, and private clients. Thus, to gain a
market foothold in Africa and Asia, U.S. manu-facturers must provide better, more reliable andcost effective solutions.
3. The rationale and methodology. - The previousdiscussion suggests that markets already exist forsolar thermal electric products. However, such
questions as to how large and how economicallyviable is the demand, where to place the emphasison size and function of equipment, what timetableand approach to use for sales efforts, and others,must be answered before most U.S. manufacturerswill proceed to invest their time, talent, and moneyto effect device development and production. Anumber of recent studies have focused on solar
energy alternatives for this country but these merelyhint at their relevance to foreign markets. Whilethe U.S. potential for solar electric appears to besubstantial only beyond the year 2000, it is our
contention that fossil fuel costs and lack of anyother inexpensive energy alternative, in most LDCs,already make that substantial market attractive
Article published online by EDP Sciences and available at http://dx.doi.org/10.1051/rphysap:01980001503036900

370
for solar powered sources, even within the next
10-20 years. This is illustrated by figure 1 which istaken from a recent JPL study [2]. This figure showingequivalent bus bar electric costs vertically versus
market size, illustrates the relative value of aimingfor the LDC and non-U.S. island market in the near
Fig. 1. - Potential market size and energy cost goals 1990-2000.
and mid-term. A second study, recently concludedby the author for JPL [3], attempts to identify targetsof opportunities among the LDCs. For the 16 suchtypical countries selected, when cultural, social,economic and other factors are considered, the
relative rankings are shown in chart 1 extracted fromthat report. These indicate that several countriessuch as Brazil, India and the West Indies are alreadybetter candidates than Califomia in terms of similarindicators.To evaluate this market accurately will require
comparing all suitable solar related small electric
power sources including wind, small-scale hydroand photovoltaic as well as thermal electric to themore conventional gasoline or diesel powered gene-rators. We must do this on a common basis to assure
meaningful results. Such considerations as capitalcosts, financing charges, maintenance fees, depre-ciation, life, inflation, fuel costs, special siting require-ments, etc. must all be assessed fairly. For example,small-scale hydro requires extensive ponding andwater containment structures to be built althoughannual generation and maintenance costs are quitelow. On the other hand, diesel generators are inex-pensive but annually consume substantial and costlyfuel, require extensive and expensive maintenance,and produce pollutants.
4. Overall comparison of technologies selected. -4. 1 DIESEL. - 4.1.1 Positive. - Relatively inex-
pensive in areas where fuel is readily available.- Sizing is easy.- Portable.
Chart 1. - Relative LDC rankings for solar thermal.
(*) Equivalent rank.

371
- Time proven and tested.- Many manufacturers.- Maintenance uses standard tools and tech-
niques.4.1.2 Negative. - Frequent and costly main-
tenance of diesel generating systems by skilledmechanics.- Diesel engine replacement every five to seven
years.- Non-availability of skilled diesel generator
mechanics in developing countries.- The need for automatic transfer switches and
starting equipment, adding significantly to the cost.
4.2 THERMAL ELECTRIC. - 4 . 2 .1 Positive. - Largesizes possible.- Collectors are durable.- Mechanical portions are standard.- Shaft Horse Power available.- Steam or air as working fluids.- Energy storage means are simpler.- Reasonably transportable.4.2.2 Negative. - Small sizes are uneconomical
« 10 kW).- Expensive.- Maintenance on mechanical and optical parts
necessary.- Technology unproven in commercial sense.- Potential hazard to humans.
4.3 PHOTOVOLTAIC. - 4.3.1 Positive. - Lowmaintenance.- Small yearly operational cost.- No fuel transportation necessary.- Power requirements may be exactly adjusted.- Long life.- Quiet.- Environmentally adaptable.4.3.2 Negative. - Very large initial expense.- Solar array must be oversized due to reduced
effectiveness caused by wind, dust, or yearly climaticvariations.- Harsh environmental conditions may cause
cells to delaminate.- Very large battery arrays are necessary for
storage during periods of unfavorable weather, greatlyincreasing the cost of this form of energy.The method we have chosen is often used by
business managers in large industrial companieswho must generally compare alternative technologiesand products for a given application. The methodis known as Net Present Value (NPV) Analysisand is briefly described in the following section.
Through its use we will be able to compare all costson an equivalent basis and thereby formulate somegeneral conclusions that could be used for marketanalysis by any manufacturer. Using this NPV
methodology, we will specifically compare three
equivalent sources from the energy viewpoint at
2 power levels : (1) two small solar thermal electricgenerators, one Steam/Rankine @ 10 kWe, the
other, a more advanced Air/Brayton @ 20 kWe ;(2) Photovoltaic Generators (P/V) @ 12 and
24 kWe ; (3) Diesel Generators @ 10 and 20 kWe.All sources are sized to provide essentially the samenumber of kilowatt hours/years namely :
The systems being compared all provide energyin electrical forms. However, diesel and thermal
engines can also provide shaft horsepower. Thethermal generator can also provide useful heatin the form of waste air or steam. Thus, any stricteconomic comparison should also be assessed withthese added benefits for any given LDC application.
5. Assumptions. - Although the specific assump-tions made are stated on the attached charts, costof money and inflation rates of 10 % are generallyconsidered. The fuel transportation charges shownin table 1 were obtained from several sources includingthe Commerce Department, Postal Service, andcommercial shipping and trucking firms. A 10 yearsassessment period was chosen for all systems as
being typical, minimal value for life expectancy ofsolar technologies.
Table I. - Fuel transportation costs.
6. Net présent value analysis. - An investor
prefers to have a dollar today as opposed to a dollara year from now. If he receives the dollar today,he can invest the dollar and have more than a dollarreturned at the end of the year. If he foregoes thedollar today, an opportunity cost is involved - theopportunity represented by the earnings he coldhave received on his dollar. This opportunity costleads to the time value of money ; that is, the realvalue of a cash flow is determined not only by theamount of the cash, but also by the time at whichit is received. Conversely, the real cost of moneyspent is also determined by the time at which this
372
expenditure occurs. Money spent earlier during a
period of cash outflows will thus have a greateropportunity cost at the end of a given period oftime than will money spent later. Opportunity costsare very real expenses in doing business, and anyanalysis that does not take this factor into accountin examining cash flows is simply not correct. Table IIshows this more clearly.
Table II. -
As an example then, $9 000 received in year onewould be worth $21222 ($9 000 x 2 358) in yearten. Conversely, receiving $21 222 in ten years is
totally equivalent to receiving $9 000 today if a 10 %opportunity cost is assumed [4].
This methodology is consequently used in this
report to compare remote power sources whichhave drastically different cash outflow patterns overthe life of the device’s operation. Accumulated Valueand Net Present Value accomplish almost exactlythe same task when comparing a stream of cashflows. Accumulated Value simply looks at the totalvalue of the cash flows at the end of the period inquestion, whereas Net Present Value discounts thestream of cash flows back into today’s dollars. Wehave chosen to look at the Accumulated Value ofall cash flows after 10 years.
7. Parametric analysis of alternatives. - Cal-culations for the thermal electric and photovoltaicdevices were fairly simple. Initial capital expendi-tures and maintenance costs were determined frocmanufacturer’s estimâtes ; the Accumulated Valueof these cash flows were then determined directly.The following formulas show how this may be done :
In general :
Where :
A V = accumulated value,P = annual payment or expenditure,i = interest rate,N = number of years.
In this case :
where :
F = pounds of fuel consumed per day,Xl = cost of transport (1),G = gallons of fuel consumed per day,X2 = cost of fuel (1).Also for this case, using 10 % interest for 10 years ;
reduces to (1.594) (10 years)
so the final equation becomes :
AV = (FX, + GX2) (365) (1.594) (10) .
In the case of diesel electric devices, many morevariables had to be calculated. These included fuel
consumption for given levels of power output,fuel cost and inflation rates, and transportationcosts by air, land and sea. The following formulasand information should help document these cal-
culations, all of which were then of course discountedto determine the Accumulated Value in Year 10.
Diesel facts and formulas. - kVA = kilovoltamperes,kW = kilowatts,HP = horsepower
gallons/hour =
HP x 0.42(fuel consumption Ibs/brake HP hour)7.2 pounds/gallon
’
Thus, a 10 kW plant would use :
(10 kW) 1.5 x 0.421bsjHP - 0.9 g allons hour(10 kW) 1.5 x 0.42 Ibs/HP - 0 .9 gallons/houror about 6.5 pounds/hour.The following charts give a numerical analysis of
the costs associated with the various alternativesfor power generation in remote areas. Chart II isa detailed analysis of NPV totals for a 20 kW dieselsystem with 1 000 miles of transportation for fuel
necessary. This chart can be summarized and thetotals used to obtain additional numerical summarycharts of incremental costs for different distancesand types of transport as illustrated in chart III.A similar analysis can be made for 10 kW systems.These and other more detailed assessments can befound in reference [3]. One such comparison providesa useful example and is given for a specific scenario
(’) For a constant inflation rate R over 10 years in either transportcost or fuel the following calculation can be made and was in factused in this report :

373
of a Sahara desert location and is illustrated in table III.This clearly demonstrates the importance of fueland its transportation costs as time advances on
Table III. - Typical scenario : Sahara desert.1000 miles. Air plus 500 miles. Land.
opportunity capital demands. Figures 2 and 3 showthis also.To use this type of information for comparison
then, we will use a standard 1 000 mile distance in
Fig. 2. - Sahara desert scenario, 10 kW.
Chart II. - 20 kW diesel.
(All figures in thousands.)
(1) See accompanying explanation.(2) 10 % inflation.(3) 10 % inflation, 1000 miles average transport.
Chart III. - Incremental costs.

374
Years
Fig. 3. - Sahara desert scenario, 20 kW.
the analysis that follows. Chart IV summarizesthe 10 and 20 kW diesel findings. This is followed
by summary charts for each of the other systemstaking into account such factors as initial cost,maintenance requirements, inflation and the timingof each cash expenditure. Calculations for the thermalelectric and photovoltaic devices were fairly simple.Initial capital expenditures and maintenance costswere determined from manufacturer’s estimâtes ; theAccumulated Value of these cash flows was thendetermined directly. These results are then shown
Chart IV.
(*) All figures equal K$.
Chart V. - Solar thermal electric summary.
(AU figures in K$).
in charts V and VI. Using all these summaries, weobtain a comparison chart for A V and equivalentcost/kWh of all options considered shown as
chart VII [5]. From this chart it is evident that
costs/kWh can vary substantially but that solarthermal electric devices are already quite competitiveeven at 1 000 mile distances.To give a more easily absorbed visual comparison
we compare the costs of the various systems underdiscussion graphically. Figures on the vertical axisrepresent the Accumulated Value of cash flows foreach system after ten years. The horizontal axisdescribes the number of miles that fuel must be
transported. Systems that have no fuel to transportwill obviously show a line parallel to the horizontalaxis. Points of intersection represent systems of equalcost under the conditions represented by that pointon the graph. Figure 4 gives a 10 kW comparisonwhich indicates that the solar thermal electric schemeis more cost effective only if air transport greater
Fig. 4.
Chart VI.
(1) Assumes $10/Wp and 60 kWh/day.(2) All figures for 24 kWp = 2(12 kWp), assumes 120 kWh/day.(3) Compares total accumulated value of cash flows over 10 years.

375
Chart VII. - Comparison of alternatives.
(*) Indicates AV over 10 years.( +) Indicates cost/kWh over 10 years.Assumes 22 000 kWh/yr for 10 kW systems.Assumes 44 000 kWh/yr for 20 kW systems.
than 1 300 miles is required. Similarly figure 5 indi-cates that even at distances as short as 500 milessolar thermal electric is best.
Fig. 5.
Various scenarios involving fuel transport werealso considered simply as working examples. Morework needs to be done to determine real situationsmore precisely, but the following order of preferenceis obtained from the analysis above for typical possi-bilities (Table IV).
Table IV. - Scenarios and optimal choices.
A further graphical comparison can be made whichit appears [6] can provide some interesting future
Device
marketing strategies for the industry. Here we haveplotted the Net Present Values directly rather thanthe Accumulated NPV after 10 years. These curvesdemonstrates that for a given distance and type offuel delivery the cost equivalency for using nondiesel or solar electric sources already occurs at
a reasonable payback period which is considerablyless than the 10 years system life anticipated. Consi-derably more such analysis and scenario develop-ment with more up to date discount rates, fuel,equipment and labor costs should be performed tosolidify the findings (Figs. 6-8).
Accumulated value comparisonFig. 6.
Fig. 7. -10 kW diesel transport comparison, 1 000 miles.
376
Years
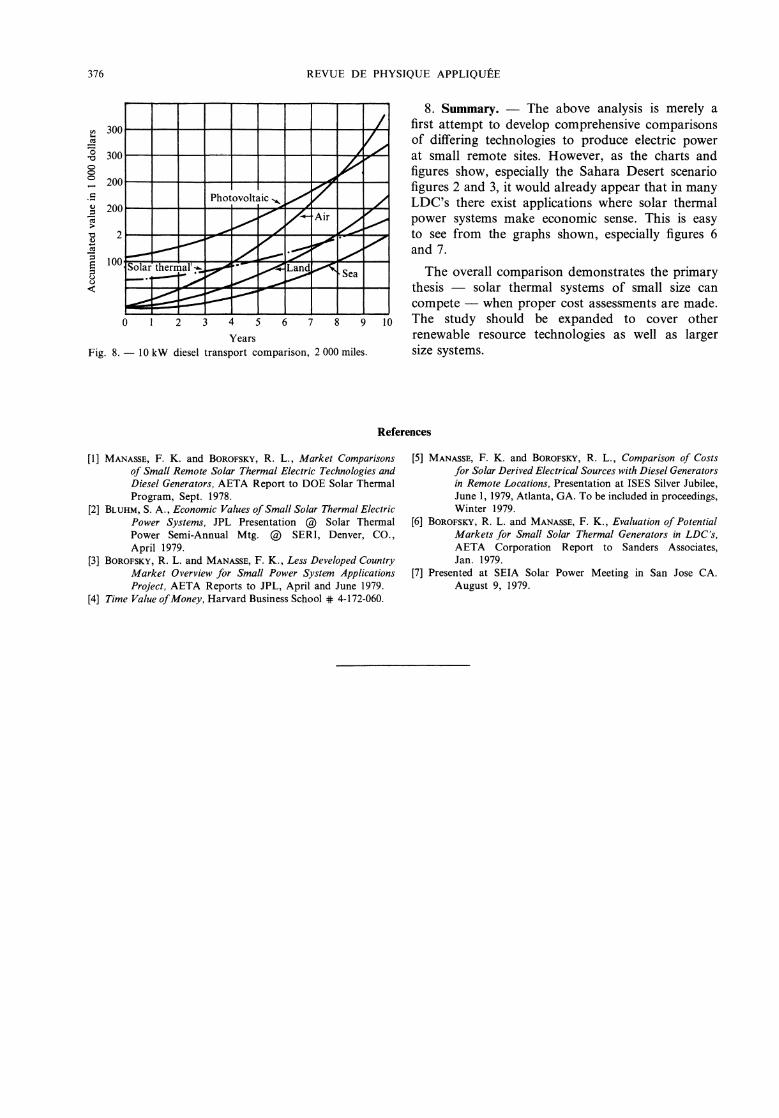
Fig. 8. -10 kW diesel transport comparison, 2 000 miles.
8. Summary. - The above analysis is merely afirst attempt to develop comprehensive comparisonsof differing technologies to produce electric powerat small remote sites. However, as the charts andfigures show, especially the Sahara Desert scenariofigures 2 and 3, it would already appear that in manyLDC’s there exist applications where solar thermalpower systems make economic sense. This is easyto see from the graphs shown, especially figures 6and 7.
The overall comparison demonstrates the primarythesis - solar thermal systems of small size can
compete - when proper cost assessments are made.The study should be expanded to cover otherrenewable resource technologies as well as largersize systems.
References
[1] MANASSE, F. K. and BOROFSKY, R. L., Market Comparisonsof Small Remote Solar Thermal Electric Technologies andDiesel Generators, AETA Report to DOE Solar ThermalProgram, Sept. 1978.
[2] BLUHM, S. A., Economic Values of Small Solar Thermal ElectricPower Systems, JPL Presentation @ Solar ThermalPower Semi-Annual Mtg. @ SERI, Denver, CO.,April 1979.
[3] BOROFSKY, R. L. and MANASSE, F. K., Less Developed CountryMarket Overview for Small Power System ApplicationsProject, AETA Reports to JPL, April and June 1979.
[4] Time Value of Money, Harvard Business School # 4-172-060.
[5] MANASSE, F. K. and BOROFSKY, R. L., Comparison of Costsfor Solar Derived Electrical Sources with Diesel Generatorsin Remote Locations, Presentation at ISES Silver Jubilee,June 1, 1979, Atlanta, GA. To be included in proceedings,Winter 1979.
[6] BOROFSKY, R. L. and MANASSE, F. K., Evaluation of PotentialMarkets for Small Solar Thermal Generators in LDC’s,AETA Corporation Report to Sanders Associates,Jan. 1979.
[7] Presented at SEIA Solar Power Meeting in San Jose CA.
August 9, 1979.