Embed Size (px)
Citation preview

Comparison of Analytical Techniques for Quantification of 8-iso-PGF2α Using HPLC-MS-MS and
Enzyme Immunoassay
A Thesis Presented in Partial Fulfillment of the Requirements for the Degree Bachelor of Science with Distinction in the Ohio State University
By
Owen G. Jones
*****
The Ohio State University
Honor’s Examination Committee: Approved by
Dr. Steven J. Schwartz, Advisor Dr. Yael Vodovotz Dr. Luis Rodriguez _________________________
Advisor Professor in Food Science and Nutrition

Abstract
In short, analysis of spiked urine samples by immunoassay and HPLC-MS-MS revealed that there is no significant difference in the recoveries obtained, however, a tendency for higher values obtained through immunoassay analysis was observed. HPLC-MS-MS offers good precision and analysis, given that enough time is spent to optimize the instrument conditions to its full potential and especially when including internal standards. Deuterated standards have shown to be a valuable tool for this purpose. Enzyme immunoassay methods do not require sophisticated instrumentation, but the precision can not be improved beyond its existing parameters. Liquid and solid phase extractions are a necessity for the HPLC-MS-MS analysis, while unpurified urine samples seem to yield good recoveries by immunoassay. Urine, as a matrix, seemingly can influence results in both ways. Urine may create higher recoveries in immunoassay methods due to cross-reactivity, while precipitation and entrapment of the analyte seems a more predominant factor for HPLC-MS-MS assays. Ultimately, the decision between using HPLC-MS-MS and immunoassay would have to be decided by familiarity, cost, and personal preference.
I. Introduction 1
II. Objectives 2
III. Materials and Methods 2 A. Overview 2
B. Samples 3
C. Purification Methods 3
D. HPLC-MS-MS Methods 4
E. Enzyme Immunoassay methods 5
F. Statistical Methods 6
IV. Results 7
V. Discussion 9
1

Introduction Coronary heart disease is the leading cause of death in many western countries such as the United States of America. The research for early indicators of risk factors associated with this disease is therefore of increasing interest. One possible cause under investigation is oxidative damage caused by free-radical damage. This radical oxidative damage has been associated with various health conditions such as atherosclerosis (Meagher and Rader, 2001), ischaemia, inflammation (Cracowski et al., 2002), Alzheimer’s Disease, and Parkinson’s Disease (Pratico et al., 2001). Formation of free radicals in vivo may result in damage to DNA, proteins, and lipids. Accurate identification and analysis of markers of oxidative damage can provide insight into the mechanism(s) of action for development and progression of these diseases. Free-radical non-enzymatic oxidation of arachidonic acid (20:4), especially in situ on phospholipids bilayers, can lead to the production of 4 sets of 16 regioisomeric compounds each, termed F2-isoprostanes (Pratico, 1999). One class of isoprostanes (see Fig. 1), consisting of 16 isomers referred to as Class III F2-Isoprostanes, has been suggested to be an excellent biomarker of in vivo oxidative stress (i.e. levels of F2-isoprostanes in human tissue, plasma, and urine are highly correlated with the amount of oxidative stress occurring in vivo). In addition, F2-isoprostanes retrieved from biological samples remain stable when stored at –80ºC (Morrow & Roberts, 1997). Of the F2-isoprostane isomers, 8-iso-PGF2α has been found to have one of the highest concentrations in urine and plasma and is detectable when extracted from biological systems (Cracowski et al., 2002). These isoprostanes occur both esterified to plasma proteins and free in plasma but only in the free form in urine. 8-iso-PGF2α levels have been analyzed in human studies using either gas chromatography/mass spectroscopy (GC/MS) or immuno-assay techniques (ELISA=enzyme linked immunoassay), revealing elevated levels in urine samples of cigarette smokers, diabetic patients, and patients with acute myocardial infarction (Pratico et al., 2001).
Fig 1: Chemical Structure of 8-iso-PGF2α (15-F2t-isoprostane, top left) with some Isomers Interestingly, 8-iso-PGF2α has also been shown to possess potent vasoconstrictive properties in rats (Morrow et al., 1990) and increased levels in patients were found after acute coronary angioplasty (Reilly et al., 1997). Higher levels of urinary 8-iso-PGF2α found in patients with coronary heart disease, along with C-receptor protein, indicate that this compound can be used as a reliable indicator for this condition (Schwedhelm et al., 2004). In one study, urinary levels were 129 +/- 17 pg/mL in normal healthy patients, while levels were 342 +/- 5 pg/mL in patients under physical stress (McKinney et al., 2000).
2

In addition to GC/MS and ELISA techniques, quantification of isoprostanes using HPLC-MS techniques has garnered interest as a useful method of oxidative stress measurement. Detection of the F2 isoprostane isomers has been investigated using HPLC coupled to electrospray ionization Mass spectrometry since the beginning of isoprostane research (Waugh and Murphy, 1996). Advances in mass spectrometry, especially in the interface designs (e.g. atmospheric pressure ionization) and tandem MS (e.g. triple quadrupoles), have allowed for sensitivity and precision comparable to GC-MS methods (Lawson & FitzGerald, 2002). Mass spectrometry offers great selectivity and sensitivity, but does require long workup procedures and a heavy investment in capital (Morrow, 2005). While GC-MS-MS requires an additional esterification process to detect isoprostanes, LC –MS-MS methods do not, significantly reducing the workup time required per sample. Enzyme Immunoassays theoretically allow for very rapid analysis of blood or urine samples. However, high levels of workup are usually assumed to be required to reduce cross-reactivities and increase precision. A current study comparing an EIA method to GC/MS has shown a greater than 30-fold increase in detected 8-iso-PGF2α levels by immunoassay, with essentially no correlation to results found using GC/MS (Il’yasova et al., 2004). Immunoassay methods, while showing discrimination against most isomers, may not have safeguards against cross-reactivities with certain isomers or metabolites (Lawson & FitzGerald, 2002). Studies have suggested that cross-reactivities are only 1% in recent EIA kits, leading researchers to speculate on structurally unrelated compounds showing cross-reactivity (Schwedhelm & Boger, 2003). Immunoassay techniques are easily approachable for research groups familiar with them and offer a lower cost, albeit less accurate, alternative. A recent review concluded that more studies are required comparing immunoassay methods to mass spectrometry in determining isoprostane levels (Morrow, 2005)
Over the period of this project, urine samples were analyzed by EIA and HPLC-MS-MS using varying purification methods to explore the benefits and disadvantages of both techniques. This information could be applied later towards practical clinical use.
Objectives The main goal of this project was to compare accuracy, precision, and amount of sample preparation needed for assays analyzing levels of F2 alpha isoprostane in urine using both enzyme immunoassay and HPLC-MS-MS. To achieve this goal, different purification procedures were tested for necessity and efficiency by obtaining recoveries through each method. In addition, the sensitivity of each method was determined. Different chromatographic conditions were verified to optimize results with HPLC-MS-MS.
Material and methods
Experimental Procedures In short, the Experimental Procedures Performed were: To…
1. Determine the recovery of urinary 8-iso-PGF2α using HPLC-MS/MS based on spiked urine samples.
3

2. Determine the recovery of urinary 8-iso-PGF2α using Enzyme Immunoassay based on spiked urine samples.
3. Determine the recovery of urinary 8-iso-PGF2α based on spiked water samples using both Enzyme Immunoassay and HPLC-MS-MS.
4. Correlate recoveries against purification levels achieved through differing extraction methods and the associated matrix-effect.
5. Compare the recoveries of urinary 8-iso-PGF2α between HPLC-MS/MS and Enzyme Immunoassay methods in terms of accuracy and reproducibility.
An overall visual representation of methods used is given in Figure II, below.
Samples and Standard
For all experiments, several urine spot samples from the same subject were pooled and stored at -20oC for several weeks. 8-iso-PGF2α Standard was obtained from Cayman (Ann Arbor, MI). All chemicals used for this analysis were of analytical grade or superior and were obtained from Sigma Aldrich (St. Louis, MO). Workup procedures were optimized starting from previous reported methods (Liang et al., 2003). Most samples were spiked individually with 8-iso-PGF2α standard (66.7 ng) directly before the purification procedures used (see Table II).
Purification of 8-iso-PGF2α from Urine
Urine samples (2.5 mL) were centrifuged (DAMON, IEC HN-SII, 400 g) at 2800 rpm for 10 minutes to remove sediments. Supernatant portions were then extracted with ethyl acetate (2 x 3 mL) and dried under a stream of nitrogen. An aliquot of those samples was then reconstituted in 5% ethanol at pH 3 (2 x 1 mL) and purified by Solid Phase Extraction (Supelco Envi-Chrom P, 6mL; Bellefonte, PA). Some of the samples were processed without purification, some with only liquid phase extraction, and some with full purification (See Table II).
Solid Phase Extraction
Columns were preconditioned with methanol (3 mL) followed by 1 mM HCl (3 mL). Samples were loaded onto the columns and drained to the adsorbent phase by a slight vacuum. 1mM HCl (3 mL) followed by hexane (2.5 mL) were used for washing. Ethyl acetate containing 1% methanol (4.5 mL) was used as the eluent. This ethyl acetate fraction was collected, dried under a stream of nitrogen, and stored at -20oC until analysis.
4

Fig 2: Visual Representation of General Purification and Analytical Methods
HPLC-MS-MS Analysis of 8-iso-PGF2α
Dried samples were reconstituted in acetonitrile (600 uL) and filtered through 0.2 um nylon syringe filters (Waters, Milford, MA). HPLC separation was achieved by a Waters 2695 HPLC, using a Xterra MS C18 column (Waters, 2.5 um, 3.0x20 mm, IS). 15 uL of each sample was injected into a gradient mobile phase, described below in Table I. Column conditions
5

were as follows: 0.700 mL/min flow rate, 20oC column temperature, and 15 minute total sample run time. Detection of the 8-iso-PGF2α was performed by a Quattro Ultima Triple Quadrupole Mass Spectrometer (Micromass Ltd., Manchester, UK) using negative ion mode. Selective Reaction Monitoring (SRM) was used for selecting the deprotonated molecular ion (353.5 m/z), allowing observance of the daughter ion of highest abundance (193 m/z), as reported in previous experiments (Liang et al., 2003).
Table I: Gradient Eluent Method for HPLC-MS-MS Analysis of Samples 0 - 7 minutes 7 - 9 minutes 9 - 15 minutes
0.1% Acetic Acid 80% 35% 80% Acetonitrile 20% 65% 20%
Enzyme Immunoassay (EIA) Analysis of 8-iso-PGF2α
Dried samples (Groups A, B, and D in Table II) were reconstituted in ethyl acetate and diluted 1:300. These were then dried under nitrogen, and reconstituted in EIA buffer (Cayman). Fresh urine samples (Group C in Table II) used in this test were only given a 1:145 dilution with EIA buffer (Cayman). Enzyme Immunoassay was performed following instructions by the manufacturer (8-Isoprostane EIA Kit, Cayman). Specifically, standards, blanks, and samples were injected into individual wells coated with Anti-Rabbit IgG. Antiserum is injected to allow binding of the isoprostanes, along with an 8-iso-PGF2α –acetylcholinesterase conjugate tracer. Added Ellman’s reagent is chemically altered by the acetylcholinesterase, producing a yellow pigmentation. Absorbance readings were read at 405 nm and 414 nm on an automated plate reader, and the wavelength yielding maximum difference between maximum binding – of antiserum – wells and blanks was used for quantification of isoprostanes. Isoprostane concentrations were determined through external calibration curves.
Comparison of HPLC-MS-MS and EIA Techniques for Determination of Urinary 8-iso-PGF2α among Different Purification Levels and Matrices.
Pooled urine spot samples were used to assess accuracy and precision of HPLC-MS-MS and EIA techniques in relation to the number of purification steps. Samples were prepared identically and simultaneously using the techniques described above and were then divided for testing using HPLC-MS-MS and EIA. Further subdivision among these samples was done as follows – performed on both sets of samples: One group of samples was given both liquid extraction and solid phase extraction before analysis (Group A, Table II), another group was given only liquid phase extraction (Group B, Table II), while yet another was not given any purification at all (Group C, Table II). Samples without purification were only analyzed by EIA due to the possibility of damage and contamination to the HPLC-MS instrumentation. See Table II below for a complete breakdown of samples.
Another sample of pooled urine was split into 12 sample allotments. HPLC grade water was also split into 12 sample allotments to test for matrix differences between urine (Group E, Table II) and water (Group F, Table II). All urine and water samples were spiked with 667 ng/mL 8-iso-PGF2α Standard (0.100 mL). Liquid and solid phase extraction procedures were performed on all samples. Urine and water samples, six each, were analyzed
6

using the EIA analysis procedure listed above. Remaining urine and water samples were analyzed by HPLC-MS-MS by the procedure listed above.
Table II: Sample Design for Analysis of Purification Effects on Accuracy and Precision Using HPLC-MS-MS and EIA
Sample Group Nx Matrix Spike* Work-Up Procedure Analysis Performed**
A 2x5 Urine 66.7 ng Liquid & Solid Phase Extraction HPLC & EIA
B 2x6 Urine 66.7 ng Liquid Phase Extraction HPLC & EIA
C 1x6 Urine 66.7 ng None EIA only
D 2x6 Urine 0 ng Liquid & Solid Phase Extraction HPLC & EIA
E 2x6 Urine 66.7 ng Liquid & Solid Phase Extraction HPLC & EIA
F 2x6 Water 66.7 ng Liquid & Solid Phase Extraction HPLC & EIA x: N = Number of sample preparations * Spike: Amount of 8-iso-PGF2α standard added for recovery purposes ** HPLC: High Pressure Liquid Chromatography w/ Mass Spectrometry EIA: Enzyme Immunoassay
Analysis of D4-8-iso-PGF2α Recovery in Urine Matrix Using HPLC-MS-MS
Six urine samples were spiked with D4-8-iso-PGF2α (Cayman) and processed by liquid and solid phase extractions to test for absolute recovery of 8-iso-PGF2α compound using the described methods. Analysis performed by HPLC-MS-MS was followed as above, selecting the ion transition 357m/z to 197m/z instead of 353m/z and 193m/z. Recoveries found for the deuterated standard can be used to determine the true losses in recovery expected after each processing method and analytical technique. Analysis was not performed by EIA.
Statistical Treatment of Data
Data obtained by HPLC-MS-MS and EIA were transferred to data sheets (Microsoft Excel 2002, v. 10.2614.2625). Standard curves and linear regression analysis of those curves were used to determine the concentrations of eluted samples. Statistical analyses were performed by SPSS 13.0 (SPSS Inc., Chicago, IL). Data values were reported as mean +/- standard deviation, and t-test p-values were considered significant if less than or equal to 0.05. Detection and quantification limits for the HPLC-MS-MS method were found by making 6 injections of very dilute standard dilutions (13 ng/mL). The standard deviation was multiplied by 3 to obtain the detection limit and multiplied by 6 for the quantification limit (Berthouex, 1994). All data obtained through HPLC-MS-MS and EIA assays were compared using a linear mixed model. This model kept an overall p-value of 0.05, avoiding multiple comparisons. Fixed factors were amount of purification (full, half, or none), amount of spike (whether deuterated or normal isoprostane standard), type of analysis (MS vs. EIA) and matrix used (urine vs. water). The observed parameter was the % recovery, while the day of analysis was a random parameter. A Bonferroni post hoc test was used afterward to test for differences of purification.
7

Results Quantification and Recovery by HPLC-MS-MS. Urine samples were treated with an 8-iso-PGF2α spike (66.7 ng). Untreated urine samples were quantified by HPLC-MS-MS to determine baseline concentration, which was found to be 1.841 +/- 0.569 ng/mL (Table III). Urine samples purified by liquid and solid phase extractions possessed an average recovery of 77.95 +/- 7.67%, while those purified only by liquid phase extraction had an average recovery of 54.01 +/- 19.97% (Table III). Statistical analysis, performed using an unpaired two-tailed Student T-test, did not show a significant difference between values associated with full purification or partial purification (P=0.104) for the HPLC-MS-MS comparison. A standard curve found for one of the HPLC-MS-MS runs is given below in Fig IV.
Fig III: Standard Curve for EIA Analysis
y = -0.3225x + 0.9737R2 = 0.9763
0
0.1
0.2
0.3
0.4
0.5
0.6
0.7
0.8
0.9
0 0.5 1 1.5 2 2.5
log(conc) in pg/mL
% B
ound
Ana
lyte
ove
r Max
imum
B
ound
3
Fig IV: Standard Curve for MS Analysis of 8-iso-F2a
y = 200.22138x + 12.45351R2 = 0.99992
0
5000
10000
15000
20000
25000
30000
0.00 20.00 40.00 60.00 80.00 100.00 120.00 140.00
Concentration (ng/mL)
Peak
Are
a (A
U)
8

Table III: Recoveries of Urine and Water Samples Spiked with 8-iso-PGF2α Using Different Purification Procedures and Analyzed by Both EIA and HPLC-MS-MS Mean Recoveries Sample Group N Matrix Spike* Purification** HPLC-MS-MS EIA
A 10 Urine 66.7 ng Full 77.95 +/- 7.67 96.02 +/- 17.1 B 12 Urine 66.7 ng Half 54.01 +/- 19.97 43.32 +/- 26.8 C 6 Urine 66.7 ng None N/A 98.98 +/- 7.2 D 12 Urine 0 ng Full 1.841 +/- 0.569A 0.651 +/- 0.105A E 12 Urine 66.7 ng Full 22.22 +/- 1.42 70.29 +/- 5.3 F 12 Water 66.7 ng Full 77.02 +/- 10.53 53.56 +/- 3.9
* Spike: Amount of 8-iso-PGF2α standard added for recovery purposes ** Full: Both Liquid and Solid Phase Extraction Performed; Half: Only Liquid Phase Extraction Performed; None: No purification was performed before analysis A These samples were not spiked – these values are the baseline 8-iso-PGF2α levels detected, given in ng/mL
Fig V: Comparison of HPLC-MS-MS and EIA Samples by Recovery
Full Purification
Half Purification
Water Matrix Samples
0
20
40
60
80
100
120
0 20 40 60 80 100 120EIA (%Recovery)
HPL
C-M
S-M
S (%
Rec
over
y)
Data points represent mean +/- standard deviation for select sample groupings. Full purification = liquid and solid phase extraction during purification. Half Purification = only liquid phase extraction during purification. Water matrix samples = water was used in lieu of urine for the matrix, followed by full purification and analysis. X-axis represents the recovery obtained through Immunoassay analysis, while the Y-axis represents the recovery obtained through HPLC-MS-MS analysis. Error bars not including the diagonal line may indicate significantly different recoveries between the two techniques. Detection limits by HPLC-MS-MS. Detection limits were determined using a 13 ng/mL standard and quantifying this by HPLC-MS-MS. By the 8-iso-PGF2α method used in this
9

laboratory, the detection limit was 8.813 ng/mL, and the quantification limit was 17.626 ng/mL. Recovery of D4-8-iso-PGF2α by HPLC-MS-MS. Peak areas obtained by HPLC-MS-MS analysis of urine samples spiked with D4-8-iso-PGF2α indicated an average recovery of 86.02 +/- 5.69%. When compared to the 8-iso-PGF2α standards, there was no significant difference in recovery (P<0.001, see Table III for 8-iso-PGF2α standard data). Quantification and Recovery by Enzyme Immunoassay. Most urine samples were spiked with 8-iso-PGF2α (66.7 ng). Untreated Urine samples were quantified by the EIA method described by the manufacturer (8-isoprostane EIA kit, Cayman Chemical) to have a baseline concentration of 0.651 +/- 0.105 ng/mL (Table III). Unpurified samples possessed a recovery of 98.98 +/- 7.2%; urine purified with liquid phase extraction, 43.32 +/- 26.8%; urine purified with liquid phase and solid phase extractions, 96.02 +/- 17.1% (Table III). A standard curve found for one of the plate developments is found in Fig. III, above. Matrix Effect Analysis by EIA and HPLC-MS-MS. Urine samples spiked with standard gave EIA recoveries of 70.29 +/- 5.27% at 414 nm and HPLC-MS-MS recoveries of 22.22 +/- 1.42%. Water samples spiked with standard gave EIA recoveries of 53.56 +/- 3.85% at 414 nm and HPLC-MS-MS recoveries of 77.02 +/- 10.53%. Recoveries among both methods are found in Table III, above. Overall Statistical Comparison of Data. Data subjected to the linear mixed model suggested significant effects in the extent of purification performed and the matrix utilized. However, no significant effect was discovered for the type of analysis (HPLC-MS-MS vs. EIA, P=0.602) or the type of spike used (D4-8-iso-PGF2α vs. 8-iso-PGF2α , P=0.254). The Bonferroni post hoc test comparison revealed that half-processed samples (samples without solid phase extraction) had significantly lower recoveries when compared to fully processed or unprocessed samples (P<0.001). Fully processed and unprocessed samples were not significantly different (P=0.643).
Discussion Exploration of HPLC-MS-MS and Enzyme Immunoassay methods for urinary 8-iso-PGF2α
analysis can lead to powerful tools in oxidative stress research. Ease of use, precision, accuracy, and the amount of required labor are all important factors when analyzing this marker. Overall, recoveries from the urine samples obtained in this procedure were acceptable. Purification by solid phase extraction appeared to be a valuable procedure. HPLC-MS-MS appears to possess more versatility in the number of related compounds it is able to analyze and can be optimized for greater reproducibility by including internal standards. Enzyme Immunoassay methods give adequate results quickly and with little calibration, but recoveries obtained were often greater than 100%. These observations will be explained in more detail below. Statistically, there was no significant difference found between the HPLC-MS-MS and Immunoassay techniques in the overall comparison.
10

HPLC-MS-MS analysis of the urine samples yielded desirably consistent results for samples with full purification. Among the samples run by HPLC-MS-MS, standard deviation of recovery tends to increase for those not utilizing solid phase extraction. Samples processed with solid phase extraction (SPE) were recovered at 77.95 +/- 7.67%, while those without SPE were recovered at only 54.01 +/- 19.97%. Even though there was not a significant difference among the values obtained (P=0.104) these inconsistencies should be sufficient to suggest that SPE provided a much more competent analysis. However, spikes used in this procedure were at higher concentrations than levels typically found in human urine, which implies that these differences might be even more crucial at normal 8-iso-PGF2α concentrations.
EIA analysis of the urine samples gave desirable results with a slightly larger variance compared to HPLC-MS-MS. Urine samples with full purification had a mean recovery of 96.02 +/- 17.1%. Interestingly, urine without purification had a mean recovery of 98.98 +/- 7.2%, giving both the value closest to 100% and with the lowest standard deviation among all samples. Samples with only liquid phase extraction had significantly lower recoveries compared to samples with the full purification (P=0.004). This result was unexpected, as less purified samples were expected to have higher recoveries due to smaller losses during sample processing and due to the higher chance of cross-reactivities. Both HPLC-MS-MS and immunoassay methods experienced losses in recovery for samples processed with only liquid extraction. As explained in full below, it was postulated that precipitations formed following drying procedures and subsequent frozen storage may have trapped the analyte, making it unavailable for the assay.
As stated above, the best recovery and lowest deviation within results was obtained through enzyme immunoassay analysis without any urine purification, followed by HPLC-MS-MS and enzyme immunoassay with full purification. To assume, however, that enzyme immunoassay techniques are superior is not directly evident. These results could be misleading due to cross-reactivities and procedural errors during the injection of samples into the plate wells and wash steps during the Immunoassay. Preventing cross-contamination of injected wells during the development and wash steps requires caution and experience. Also, it has been postulated that biological components within urine may interfere with the binding of 8-iso-PGF2α to antibodies residing on EIA plate wells. Similarly, biological components may actually bind to the antibodies themselves. This assertion was justified by the presence of recoveries that were as high as 107% for the EIA method, which was not observed for the HPLC-MS-MS method, even though both sample sets were processed in parallel. Furthermore, the slightly higher recoveries found in the unpurified urine sample at least indicate that there were no inhibitive effects of extra urine components on the analysis. Difficulties with the EIA method were various. As noted, the procedure for the urine purification was nearly identical to that for the HPLC-MS-MS. Time associated with plate development and the number of pipetting procedures reduces the advantages of enzyme immunoassay as a quantification method. Possible benefits of this method are the low cost and the ability to process numerous samples in series – but this benefit is marred by the high amount of time and complexity of setup required to process, wash, and develop the plates. In the first assay attempted for this experiment, plate readings did not develop consistently, indicating potential deviation between kits. Also, Immunoassay kits can generally analyze
11

only one compound per assay, as they do not possess the ability to quantify closely related isomers or deuterated internal standards. HPLC-MS-MS, on the other hand, can perform such actions by using different retention times and ion selection pathways. Seeding immunoassay wells manually does allow some versatility and control, but can be time consuming and requires experience. Finally, the possibility of cross-reaction with biological components is an important consideration.
It is important to mention that the detection limit for the HPLC-MS-MS method used here was relatively high (8.813 ng/mL). This limit would translate into levels normally found in human urine samples. The immunoassay method required a 1:300 dilution of the spiked samples, reflecting the much greater sensitivity of the immunoassay method. Such a difference reflects a weakness in the HPLC-MS-MS method used, indicating the need for further optimization. It is apparent that immunoassay methods are in fact very sensitive. It is suggested that the detection limit assay used in this exercise for HPLC-MS-MS is likely an overestimate compared to other methods, such as measuring the baseline noise.
Analysis of 8-iso-PGF2α in urine using HPLC-MS with and without standards has shown that other metabolites exist – such as F2-isoprostane classes IV, V, and VI – that have very similar properties to 8-iso-PGF2α (Liang et al., 2003). Tandem mass spectrometry removes this source of potential error by selecting further among the compounds with parent ions at 353 m/z and fragmented ions at 193 m/z. HPLC-MS-MS methods are still exposed to the risk of detecting diastereomers and other F2-isoprostanes with identical fragmentation pathways, which would need to be explored in further studies. Compared to the supposed cross-reactivities in EIA methods, this risk is believed to be small. Immunoassay methods, while showing discrimination against most isomers, may not have safeguards against cross-reactivities with isomers or metabolites (Lawson & FitzGerald, 2002). It has been postulated that 8-iso-PGF2α is produced in vivo in lower amounts when compared to iPF2α –VI (Adiyaman et al., 1998), among others. High specificity of the antibody used in enzyme immunoassay is required in order to prevent such cross-reaction. Studies comparing GC-MS to EIA assert that such cross-reaction is minimal with regards to isomers and metabolites (O’Sullivan et al., 1999). Since cross-reactivity among the isomers of the F2-isoprostanes are supposedly around 1% according to recent enzyme immunoassay kits, structurally unrelated compounds in biological samples have shown a greater possibility for error (Schwedhelm & Boger, 2003). As indicated in the results, many of the urine samples analyzed by EIA (Groups A and C, Table III) possessed recoveries over 100%. This may be an indication of isomers or biological materials in the urine causing cross-reactivity. Further testing is needed to explore the extent of EIA cross-reactivity.
Overall statistical comparisons, using the linear mixed model and Bonferroni post hoc comparisons, indicated a significant difference in recovery obtained when performing solid phase and liquid phase extractions as opposed to merely performing liquid phase extraction (P<0.001). In addition, large standard deviations were evident in the spiked urine samples purified by liquid extractions only. This pattern was noticeable for both enzyme immunoassay and HPLC-MS-MS, with average recoveries 52.7% and 23.9% lower than solid phase extraction methods, respectively. Due to the good yield and low standard deviation found in unpurified urine with EIA, the explanation could not lie in the necessity of higher
12
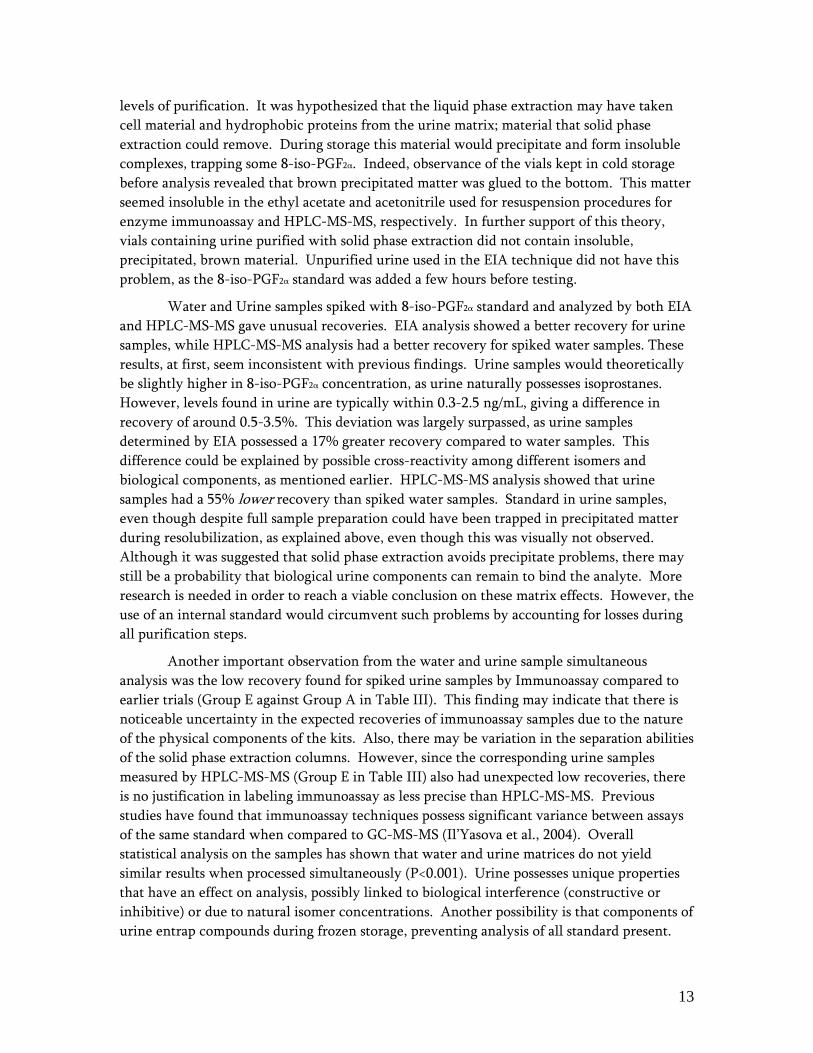
levels of purification. It was hypothesized that the liquid phase extraction may have taken cell material and hydrophobic proteins from the urine matrix; material that solid phase extraction could remove. During storage this material would precipitate and form insoluble complexes, trapping some 8-iso-PGF2α. Indeed, observance of the vials kept in cold storage before analysis revealed that brown precipitated matter was glued to the bottom. This matter seemed insoluble in the ethyl acetate and acetonitrile used for resuspension procedures for enzyme immunoassay and HPLC-MS-MS, respectively. In further support of this theory, vials containing urine purified with solid phase extraction did not contain insoluble, precipitated, brown material. Unpurified urine used in the EIA technique did not have this problem, as the 8-iso-PGF2α standard was added a few hours before testing.
Water and Urine samples spiked with 8-iso-PGF2α standard and analyzed by both EIA and HPLC-MS-MS gave unusual recoveries. EIA analysis showed a better recovery for urine samples, while HPLC-MS-MS analysis had a better recovery for spiked water samples. These results, at first, seem inconsistent with previous findings. Urine samples would theoretically be slightly higher in 8-iso-PGF2α concentration, as urine naturally possesses isoprostanes. However, levels found in urine are typically within 0.3-2.5 ng/mL, giving a difference in recovery of around 0.5-3.5%. This deviation was largely surpassed, as urine samples determined by EIA possessed a 17% greater recovery compared to water samples. This difference could be explained by possible cross-reactivity among different isomers and biological components, as mentioned earlier. HPLC-MS-MS analysis showed that urine samples had a 55% lower recovery than spiked water samples. Standard in urine samples, even though despite full sample preparation could have been trapped in precipitated matter during resolubilization, as explained above, even though this was visually not observed. Although it was suggested that solid phase extraction avoids precipitate problems, there may still be a probability that biological urine components can remain to bind the analyte. More research is needed in order to reach a viable conclusion on these matrix effects. However, the use of an internal standard would circumvent such problems by accounting for losses during all purification steps.
Another important observation from the water and urine sample simultaneous analysis was the low recovery found for spiked urine samples by Immunoassay compared to earlier trials (Group E against Group A in Table III). This finding may indicate that there is noticeable uncertainty in the expected recoveries of immunoassay samples due to the nature of the physical components of the kits. Also, there may be variation in the separation abilities of the solid phase extraction columns. However, since the corresponding urine samples measured by HPLC-MS-MS (Group E in Table III) also had unexpected low recoveries, there is no justification in labeling immunoassay as less precise than HPLC-MS-MS. Previous studies have found that immunoassay techniques possess significant variance between assays of the same standard when compared to GC-MS-MS (Il’Yasova et al., 2004). Overall statistical analysis on the samples has shown that water and urine matrices do not yield similar results when processed simultaneously (P<0.001). Urine possesses unique properties that have an effect on analysis, possibly linked to biological interference (constructive or inhibitive) or due to natural isomer concentrations. Another possibility is that components of urine entrap compounds during frozen storage, preventing analysis of all standard present.
13

Regardless, larger scale studies are required comparing HPLC-MS-MS to Immunoassay techniques so that further conclusions on precision can be reached.
Deuterated standards were found to have similar recoveries as non-deuterated 8-iso-PGF2α standards. Analysis of the deuterated 8-iso-PGF2α standards by HPLC-MS-MS resulted in an average recovery of 86.02 +/- 5.69%. Thus, approximately 14% of the recovery is lost due to the full purification methods. This assumes that there was no exchange of deuterons and protons during the purification and analysis procedures. Also, since the mean recovery for standards by HPLC-MS-MS (Group A in Table III) was 77.95 +/- 7.67%, there is a close resemblance between recoveries of deuterated and normal standards. Comparison indicates that there is no significant difference between D4-8-iso-PGF2α and 8-iso-PGF2α analytes using this method (P=0.254). Such relatively high recovery indicated that very little of the isoprostane standard was lost during full purification procedures. Therefore, deuterated standards seem to be a valuable tool to correct for varying sample recovery. These deuterated standards can be taken to reveal the true amount of recovery using the full processing method followed by HPLC-MS-MS.
Conclusion In short, analysis of spiked urine samples by immunoassay and HPLC-MS-MS revealed that there is no significant difference in the recoveries obtained, however, a tendency for higher values obtained through immunoassay analysis was observed. HPLC-MS-MS offers good precision and analysis, given that enough time is spent to optimize the instrument conditions to its full potential and especially when including internal standards. Deuterated standards have shown to be a valuable tool for this purpose. EIA methods do not require sophisticated instrumentation, but the precision can not be improved beyond its existing parameters. Liquid and solid phase extractions are a necessity for the HPLC-MS-MS analysis, while unpurified urine samples seem to yield good recoveries by immunoassay. Urine, as a matrix, seemingly can influence results in both ways. Urine may create higher recoveries in immunoassay methods due to cross-reactivity, while precipitation and entrapment of the analyte seems a more predominant factor for HPLC-MS-MS assays. Ultimately, the decision between using HPLC-MS-MS and immunoassay would have to be decided by familiarity, cost, and personal preference.
Acknowledgements
Special thanks to Torsten Bohn and Qingguo Tian, whose assistance and patience allowed this project to be completed. Thanks are also due to the Haas Chair Lab, headed by Dr. Schwartz, for laboratory work-space.
14

References:
1. Adiyaman, M.; Lawson, J.A.; Khanapure, S.P.; FitzGerald, G.A.; Rokach, J. (1998). Total Synthesis of 17,17,18,18-d4- iPF2α –VI and Quantification of iPF2α –VI in Human Urine by Gas Chromatography/Mass Spectrometry. Analytical Biochemistry, 262: 45-56
2. Berthouex, P.M., and Brown, L.C. (1994). The Limit of Detection. CRC Press, Boca Raton, 1994, pp. 71-79.
3. Cracowski, J., Durand, T., and Bessard, G. (2002). Isoprostanes as a Biomarker of Lipid Peroxidation in Humans: Physiology, Pharmacology and Clinical Implications. Trends Pharmacol Sci. 23(8):360-366.
4. Il’yasova, D; Morrow, J.D.; Ivanova, A.; Wagenknecht, L.E. (2004). Epidemiological Marker for Oxidant Status: Comparison of the ELISA and the Gas Chromatography/Mass Spectrometry Assay for Urine 2,3-dinor-5,6-dihydro-15-F2t-isoprostane. Ann Epidemiol, 14: 793-797
5. Lawson, J.A. and FitzGerald, G.A. (2002). Analysis of Isoprostanes. Eur. J. Lipid Sci. Technol. 104: 429-435.
6. Liang, Y.; Wei, P.; Duke, R.W.; Reaven, P.D.; Harman, S.M.; Cutler, R.G.; Heward, C.B. (2003). Quantification of 8-Iso-Prostaglandin-F2α and 2,3-Dinor-8-Iso-Prostaglandin-F2α in Human Urine Using Liquid Chromatography-Tandem Mass Spectrometry. Free Radical Biology & Medicine, 34 (4): 409-418.
7. McKinney, E.T.; Shouri, R.; Hunt, R.S.; Ahokas, R.A.; and Sibai, B.M. (2000). Plasma, Urinary, and Salivary 8-epi-prostaglandin f2alpha levels in Normotensive and Preeclamptic Pregnancies. Am J Obstet Gynecol. 183(4): 874-7.
8. Meagher, E., and Rader, D.J. (2001). Antioxidant Therapy and Atherosclerosis: Animal and Human Studies. Trends Cardiovasc Med. 9(3-4):162-165.
9. Morrow, J.D.; Hill, K.E.; Burk, R.F.; Nammour, T.M.; Badr, K.F.; Roberts II, L.J. (1990). A Series of Prostaglandin F2-like Compounds are Produced in Vivo in Humans by a Non-cyclooxgenase, Free Radical-catalyzed Mechanism. Proc. Natl. Acad. Sci., 87: 9383-9387.
10. Morrow, J.D., and Roberts, L.J. (1997). The Isoprostanes: Unique Bioactive Products of Lipid Peroxidation. Prog Lipid Res. 36(1):1-21.
11. Morrow, J.D. (2005). Quantification of Isoprostanes as Indices of Oxidant Stress and the Risk of Atherosclerosis in Humans. Arterioscler Thromb Vasc Biol., 25: 279-286.
12. Ohashi, N., and Yoshikawa, M. (2000) Rapid and sensitive quantification of 8-isoprostaglandin F2α in human plasma and urine by liquid chromatography-electrospray ionization mass spectrometry. J Chromatogr B Biomed Sci Appl. 746:17-24.
13. O’Sullivan, O.; Mueller, M.J.; Dahlen, S.-E.; Kumlin, M. (1999). Analyses of Prostaglandin D2 Metabolites in Urine: Comparison Between Enzyme Immunoassay and Negative Ion Chemical Ionization Gas Chromatography-Mass Spectrometry. Prostaglandins and Other Lipid Mediators, 57: 149-165
14. Pratico, D. (1999). F2-isoprostanes: Sensitive and Specific Non-invasive Indices of Lipid Peroxidation in Vivo. Atherosclerosis 147:1-10.
15. Pratico, D., Lawson, J.A., Rokach, J., and Fitzgerald, G.A. (2001). The Isoprostanes in Biology and Medicine. Trends Endocrinol Metab.12(6):243-247.
16. Reilly, M.P.; Delanty, N.; Roy, L.; Rokach, J.; Callaghan, P.O.; Crean, P.; Lawson, J.A.; FitzGerald, G.A. (1997). Increased Formation of the Isoprostanes IPF2α–I and 8-Epi-Prostaglandin F2α in Acute Coronary Angioplasty. Circulation, 96: 3314-3320
17. Schwedhelm, E. & Boger, R.H. (2003). Application of Gas Chromatography-Mass Spectrometry for Analysis of Isoprostanes: Their Role in Cardiovascular Disease. Clin Chem Lab Med, 41(12): 1552-1561
18. Schwedhelm, E.; Bartling, A.; Lenzen, H.; Tsikas, D.; Maas, R.; Brummer, J.; Gutzki, F; Berger, J.; Frolich, J.C.; Boger, R.H. (2004). Urinary 8-iso-Prostaglandin F2α as a Risk Marker in Patients with Coronary Heart Disease. Circulation, 109: 843-848.
15

19. Waugh, R.J. and Murphy, R.C. (1996). Mass Spectrometric Analysis of Four Regioisomers of F2-isoprostanes formed by Free Radical Oxidation of Arachidonic Acid. Am. Soc. Mass Spectrom. 7: 490-499.
16