Embed Size (px)
Citation preview

Comparing the Outcomes
of Direct Entrants and Transfer Students
Using Multiple Data Sources
Final Report
prepared by Eric Lichtenberger
Illinois Education Research Council
May 2013
2
The purpose of this proof of concept project was to determine the potential benefits and limitations associated with merging student-level information traditionally maintained by higher education institutions with outside data sources. The institutional data parallels Illinois Higher Education Consortium (IHEC) data submissions, while the outside data sources provide the following information for students: 1) academic preparation and demographics; 2) national postsecondary enrollment and degree completion; and 3) Illinois-specific earnings and employment. Linking together such data would ultimately allow researchers and policymakers to examine the progress of individuals through high school, into college, and into the workforce, while demonstrating the types of research projects that can be scaled-up as the state’s longitudinal data system is fully implemented.
Many, if not most, four-year colleges lack information on the high school academic preparation (i.e., standardized test scores, high school class rank) of the students transferring into their institutions, while that same information is systematically collected for their traditional first-time freshman or direct entrants. Because of this informational void, the researchers felt focusing on transfer students along with direct entrants would provide evidence of the value-added associated with a comprehensive longitudinal data system. To provide a context for this project, research questions were developed centering on differences in pre-college characteristics and outcomes between direct four-year college entrants and transfer students. Two four-year institutions were used as points of reference. Both of these institutions are members of IHEC, and one is public while the other is private not-for-profit. The current study seeks to address both the flow of transfers into the institutions of reference as well as the flow of all students—transfers and direct entrants alike— out of the institutions of reference.
The two four-year colleges agreed to provide student-level data to researchers at the Illinois Education Research Council (IERC) that would parallel current IHEC submission requirements (first tier data elements). After shared data agreements were in place and institutional review board permission was granted, researchers from each college’s Office of Institutional Research matched the Illinois High School Class of 2003 file against their undergraduate enrollment and degree completion records. Once matched, this information was provided to IERC researchers. The Illinois High School Class of 2003 file was initially provided to the IERC under shared data agreements with the Illinois Board of Higher Education and ACT. These shared data agreements were amended to reflect the research objectives of the current study. This file will be referred to as the HS Class of 2003 file. The HS Class of 2003 files includes students who graduated from Illinois public and private high schools in 2003 who took the ACT and provides key information regarding student high school academic preparation and demographics.
Introduction
This research was funded by a grant from the Illinois Board of Higher Education to DePaul University. It was awarded to the IERC to enhance the value of institutional participation in the Illinois Longitudinal Data System and the Illinois Higher Education Consortium (IHEC). The views and conclusions expressed are solely the perspectives of the author.

3
Figure 1 illustrates the relationship between the institutional sources of data, the HS Class of 2003 file, and two additional outside sources of information: 1) National Student Clearinghouse enrollment and degree completion information, and 2) Illinois Department of Employment Security unemployment insurance (UI) wage records. In instances where there was a match between the HS Class of 2003 file and the institutional records from one of the two colleges, the two additional data sources were potentially linked. As shown in Figure 1, the HS Class of 2003 file served as a bridge between the institutional sources of information and NSC and IDES records. In the end, the sample included only the students with enrollment records at one of the institutions of reference from both the institutional source and the NSC. That is, the individual was required to have an NSC record indicative of enrollment at the given institution of reference combined with a parallel institutional record of enrollment. The rationale for this was to be able to use the NSC data to track enrollment and degree completion outcomes outside of the two institutions of reference. Without such an overlap, the NSC data could not be used in such a manner.
Finally, identifiers (social security numbers and names) for all students included in the HS Class of 2003 file were shared with the Illinois Department of Employment Security (IDES) to be matched against their unemployment insurance (UI) wage record system. A valid social security number (SSN) was included for approximately 81% of the records in the HS Class of 2003 file.
As previously mentioned, the HS Class of 2003 file also includes information for private high school graduates from Illinois who took the ACT. This provides a premium or value-added in that high school course-taking patterns for private high school students will not be included in the future Illinois Longitudinal Data System.
HS Class of 2003
NationalStudent
Clearninghouse
Illinois Department of Employment
Security
File for Analysis
Institutionof
Reference 1
Institutionof
Reference 2
Figure 1:Relationship between the Various Informational Sources

4
National Student Clearinghouse
In August 2010, the HS Class of 2003 file was sent to the National Student Clearinghouse (NSC) to be matched against their postsecondary enrollment and degree completion records. The NSC is a national collaborative that covers 92% of all postsecondary enrollments in America. The HS Class of 2003 file was matched to NSC records providing enrollment and degree completion coverage from fall semester of 2001 though the end of the spring semester of 2010. These data were originally obtained for use in another project focusing on the postsecondary outcomes of the HS Class of 2003.
Illinois Department of Employment Security
The third additional outside sources of data was unemployment insurance (UI) wage records from the IDES. This information was used to create measures of post-graduation earnings information for both direct entrants (traditional first-time freshmen from the 2003 cohort who enrolled at each institution of reference) and transfer students (students from the 2003 cohort who enrolled at other institutions prior to transferring to one of the institutions that were used as reference points in the study). For individuals with valid social security numbers who had reportable wages in Illinois, earnings and employment were tracked from the third quarter of 2003 through the second quarter of 2012.
Matching to Outside Data Sources1
National Student Clearinghouse. IERC researchers were able to analyze how well the HS Class of 2003 file matched to National Student Clearinghouse enrollment records. This was done by comparing the NSC matches indicative of enrollment at the private four-year institution of reference with actual enrollment records from the private institution of reference. The assumption was that the enrollment records from the private four-year of reference were accurate. From the perspective of the NSC enrollment data, potential false positive matches and potential false negatives were then identified. False positive matches, or Type I error, were instances where NSC records indicated enrollment at the private four-year institution of reference but there was no corresponding institutional record of enrollment. False negatives, or Type II error, were instances where no there was no NSC-based record of enrollment at the private four-year of reference, but enrollment records from the private four-year indicated otherwise.
After eliminating duplicate records and students with relatively short first semester enrollments based on NSC data, 2,596 of records from the Class of 2003 file had a record of enrollment at the private institution of reference as indicated by NSC Student Tracker. These NSC-based records were indicative of at least one semester of enrollment at the private institution during the study period. Of these NSC-based enrollment records, 2,537 or 97.7% also had record of enrollment stemming from the private four-year institution during the same time-frame. It should be noted that all 59 of the HS Class of 2003 records (false positives) had an ID number assigned to them by the private four-year of reference, but no record of enrollment. The main file from the private four-year institution of reference included all individuals in the Class of 2003 file who applied, enrolled, matriculated, or graduated from the private four-1 Data were not available to match the institutional records to the NSC records for the public four-year of reference.

5
year until the end of AY 2011-2012. In other words, although they lacked a definitive record of enrollment from the private four-year, all of the false positives had some sort of relationship with the institution as evidenced by their being assigned an institutional ID number. Further, representatives from the private four-year of reference indicated that this is not uncommon as files are sent to the NSC several times a year and they may not correspond perfectly with what ends up being the enrollment census.
False negatives—or cases where an individual lacked an NSC-based record of enrollment at the private four-year, but had a record of enrollment record from the private four-year of reference—presented a larger issue. Three thousand four hundred sixty seven (3,467) of the students in the Class of 2003 file were matched to institutional enrollment records from the private four-year, of which 2,537 also had an NSC-based record of enrollment at the private four-year. This equates to 930 false negatives. However, 352 of the false negatives had first enrolled at the private four-year of reference outside the scope of the time frame of the NSC match, which ended at Spring semester 2010.
After eliminating the 352 private-four-year based enrollment records that occurred strictly outside the scope of the NSC match, 578 potential false negatives remained. This equated to 18.5% of 3,144 private four-year-based enrollments. A majority of these records (355 of the 578 or 61%) had parallel information in the fields that were sent to the NSC for matching (first name, last name, middle initial, gender, date of birth) in the HS Class of 2003 file and the enrollment records from the private four-year. Of the 223 records that did not contain parallel information across the HS Class of 2003 and private four-year enrollment records, 137 had a different first name, last name, or birthdate across the private four-year and HS Class of 2003 file. These differences were usually because of data entry errors, such as transpositions or the use of nicknames in one file but not the other. The remaining non-matched records included 86 records with a middle initial missing in one of the files.

6
First-Time Native Students. In terms of false positives, things improved when focusing solely on first-time freshmen who enrolled at the private four-year during the fall semester of 2003. From the perspective of the NSC-based enrollment records, there were only nine records indicative of a false positive match. However, 259 records or 17.8% of the enrollment records from the private four-year institution of reference were missed by the NSC. This was indicative of a false-negative or a non-match when a match should have occurred. The rate of false negative error for first-time students was slightly lower than when examining all enrollment.
As shown in Figure 3, the false negative error rate for the transfer students was slightly higher than it was for direct entrants, 19.5% as opposed to 17.8%.
High School Class of 2003 & Private 4-Year
n=875
High School Class of 2003& NSCn=704
171 704
Figure 3:Overlap between Data Sources for Students Transferring to the Private Four-Year College of Reference
High School Class of 2003 & Private 4-Year
n=1,458
High School Class of 2003& NSCn=1,208
259 91,199
Figure 2:Overlap between Data Sources for Direct Entrants at the Private Four-Year College of Reference
7
The NSC appears to take a rather conservative approach in their matching process as evidenced by the near lack of false positive matches and significantly higher overall rate of false negatives (18.5%). That is, when the NSC errs, it appears to do so by not matching. As a result, researchers can be confident that matched records of enrollment from the NSC are accurate, but also that the enrollment information is likely incomplete. It should be noted that the NSC does not provide information on their matching process other than that it uses the name fields and date of birth.
In summary, matching the Class of 2003 file to enrollment records from the private four-year of reference provided additional enrollment coverage compared to using the NSC student tracker and, further, only a handful of enrollment records were lost. A larger issue is when the NSC data are used to track enrollment and degree completion outside the institutions of reference, or outside the scope of the state’s longitudinal data system, and the false negatives are systematically biased. This could potentially impact the outcomes being measured (see Goldrick-Rab & Harris, 2010). However, in the current study both an NSC enrollment match and a match to institutional enrollment records were required to be included in the sample. While many cases were excluded in the analyses because of this approach, it was the only way to ensure that the outcomes were not being negatively affected by variations in match rates across different groups (e.g., if one group was more likely than another to match to NSC records).
Overlap between the Institutions of Reference. It should also be noted that there were three individuals who had records of enrollment at both institutions of reference. Separate records were created for each individual per institution to allow for the student-level perspective at each college. For example, one of the students was a direct entrant at the private four-year, but later transferred to the public four-year and it was not possible to capture the information from both perspectives in a single record. That is, at the private four-year institution of reference the individual was a direct entrant, but at the public four-year institution of reference the same individual was a lateral transfer student. For similar studies, it would be helpful to have a decision rule to deal with this situation, such as a single record per individual per institution.

8
Methods
One of the main purposes of this project was to demonstrate the types of research topics that can be addressed using multiple information sources. The findings are organized in the following manner:
1) Overview of the Study Groups 2) Differences in Academic and Background Characteristics by Entry Status a. ACT and High School Grade Point Average b. Demography c. Transfer hours among the transfer students 3) Bachelor’s Degree Completion in Nine Years after 2003 HS Graduation a. Completion at either the institution of reference or elsewhere b. Covariates associated with completion (entry status, transfer hours, college
readiness in math, churn among direct entrants) c. Time to degree completion 4) Degrees by Entering Student Status (2-digit CIP code) 5) Earnings among Bachelor’s Completers a. Transfer status b. Math college readiness c. Degree type (2-digit CIP code)
Analyses
Descriptive statistics were calculated using SPSS. Chi-Square Automatic Interaction Detection (CHAID) analyses were also used. CHAID is a classification and modeling technique that produces a graphical tree to visually depict the relationship between a set of categorically coded covariates and the dependent variable (Cameron, Filkins, & Kehoe, 2012). It helps determine how different categorical covariates interact to best explain variation in the given outcome variable. Scaled data can also be used in CHAID analyses as the algorithm finds natural breaking points within a given variable and creates categories. According to Dudley, DiIirio, and Soet (1999) “CHAID is a data analysis tool that can be very useful both in the interpretation of interaction effects and in making decisions about how to combine categories within a variable to arrive at the most parsimonious model” p.54. Cumulative time to bachelor’s degree completion was plotted using the “life tables” function in SPSS. Life tables are a form of survival analysis and, since the outcome (graduation) was positive in nature, (1-survival) was plotted. Both CHAID and life tables have traditionally been used in medical and epidemiology research.

9
Data
The sample includes 3,972 cases from the HS Class of 2003 file that were merged with enrollment records from both NSC and institutional sources. Fifty-four percent of the cases were from the public four-year institution of reference (n=2,146), while the remaining 46% of the cases were from the private four-year institution of reference (n=1,826). Only transfer students who transitioned to their four-year institution of reference prior to the end of the fall semester of 2008 were included in the sample to allow for at least two academic years for bachelor’s degree completion based on NSC records.
Definitions
Direct entrants: Members of the Illinois high school class of 2003 graduating from either a public or private high school that initially enrolled at either the public or private four-year reference institutions the fall semester of 2003.
Transfer students: Members of the Illinois high school class of 2003 graduating from either a public or private high school that initially enrolled at any other two-year or four-year institution during the fall semester of 2003 and later transferred as undergraduate students to either the public or private four-year college of reference.
Lateral transfer students: The subgroup of the transfer student group defined above that initially enrolled at another four-year college prior to enrolling at the public or private four-year college of reference.
Vertical transfer students: The subgroup of the transfer student group defined above that initially enrolled at a community college or other two-year institution prior to enrolling at the public or private four-year college of reference.
Vertical/lateral transfer students: The subgroup of the transfer student group defined above that initially enrolled at a community college or other two-year institution prior to enrolling in another four-year institution before enrolling at the public or private four-year college of reference.
Reverse/vertical transfer students: The subgroup of the transfer student group defined above that initially enrolled at another four-year institution prior to reverse transferring to a community college before enrolling at the public or private four-year college of reference.
Bachelor’s degree completion: The completion of a bachelor’s degree based on either NSC students tracker or degree completion records from one of the institutions of reference.
Middle quarter wages: The measure was created for bachelor’s degree earners factoring in the semester of degree completion. After discounting the quarter after degree completion, individuals with employment during the subsequent three quarters were identified. This measure is the second quarter in that three quarter block.

10
Findings
Overview of the Study Groups
As illustrated in Figure 4, the sample included 3,972 students. Overall, 62% of the sample were direct entrants and the other 38% were transfer students. The transfer students were classified into one of four separate categories based on their enrollment patterns prior to transitioning to either the public or private four-year of reference (see definitions). The largest transfer category included members of the sample taking the direct community college to four-year pathway (vertical transfer students). The vertical transfers comprised roughly 20% of the sample and the group was slightly more than twice the size of the next largest group, the lateral transfers at 10%. An additional 6% of the sample initially enrolled at another four-year institution, reverse transferred to a community college, and later enrolled at either the public or private four-year college of reference (vertical/lateral transfers). The remaining 2% of the sample, enrolled at a community college and then enrolled at another four-year institution prior to transferring to either the public or private four-year college of reference (reverse/vertical transfers).
Differences in Academic and Background Characteristics by Entry Status
ACT. As shown in Table 1, relative to all other groups, the lateral transfers had the highest ACT scores. They were followed by the other groups enrolling at four-year colleges upon high school graduation, the reverse/vertical transfer students and then the direct entrants. Transfer students starting at community colleges had relatively lower ACT scores, with traditional vertical transfer students having a slightly higher scores than vertical/lateral transfers.
Figure 4:Entry Status (n=3,972)
62% 20% 10% 6% 2%
0% 20% 40% 60% 80% 100%
Direct Entrant
Vertical Transfer
Lateral Transfer
Total Transfer (38%)
Reverst/Vertical Transfer
Vertical/Lateral Transfer
Transfer Status English Math Reading ScienceComposite
Score
Direct Entrant 22.48 22.16 22.83 21.97 22.49Vertical Transfer 19.99 20.18 20.61 20.57 20.47Lateral Transfer 23.43 23.11 23.91 22.77 23.46Reverse/Vertical Transfer 22.51 22.66 22.95 22.68 22.84Vertical/Lateral Transfer 19.62 20.60 20.02 20.14 20.25Total 22.02 21.85 22.44 21.78 22.16
Table 1:ACT Scores and Entry Status

11
The academic profiles of the transfer students were fairly similar across the public and private institutions of reference (Table 2). The composite ACT scores were nearly identical across the two institutions among the vertical transfers, lateral transfers, and the reverse/vertical transfers. The main differences between the two institutions was in terms of the direct entrants, as the direct entrants from the private four-year had a mean composite ACT score that was approximately one point higher than that of the public four-year college (23.02 to 21.99).
As shown in Table 3, in terms of HS GPA, lateral transfers had the highest proportion in the 3.5 or higher category (33%). They were followed by direct entrants and reverse/vertical transfers (both at 28%). Vertical transfer students had the lowest proportion in the 3.5 or higher category (16%) and the proportion was less than half of the lateral transfers. Once again, students starting at community colleges (vertical and vertical/lateral) had relatively weaker academic profiles than their counterparts starting at four-year colleges.
Table 2:ACT Scores and Entry Status by Institution of Reference
Institution Transfer Status English Math Reading ScienceComposite
Score
Public 4-Year Direct Entrant 21.68 21.80 22.10 21.86 21.99Vertical Transfer 19.97 20.07 20.64 20.72 20.49Lateral Transfer 23.28 23.08 23.66 23.13 23.45Reverse/Vertical Transfer 22.15 22.78 22.78 22.53 22.70Vertical/Lateral Transfer 19.92 21.65 20.65 20.23 20.77Total 21.40 21.52 21.89 21.70 21.76
Private 4-Year Direct Entrant 23.34 22.54 23.61 22.10 23.02Vertical Transfer 20.04 20.39 20.54 20.24 20.43Lateral Transfer 23.60 23.15 24.19 22.35 23.46Reverse/Vertical Transfer 22.75 22.58 23.06 22.78 22.94Vertical/Lateral Transfer 19.41 19.86 19.57 20.08 19.89Total 22.76 22.24 23.09 21.86 22.62
Table 3:High School Grade Point Average and Entry Status
Transfer StatusHS GPA:
<2.5HS GPA: 2.5-2.9
HS GPA: 3.0-3.4
HS GPA: 3.5+
HS GPA Missing
Direct Entrant 6% 13% 28% 28% 25%Vertical Transfer 14% 18% 26% 16% 25%Lateral Transfer 5% 11% 27% 33% 25%ReverseVertical Transfer 7% 20% 23% 28% 22%Vertical/Lateral Transfer 14% 13% 27% 22% 24%Total 8% 14% 27% 26% 25%

12
Differences in Demography by Entry Status
Gender. In total, 43% of the sample were male, however, the gender composition of most of the transfer groups varied quite a bit (Table 4). Overall, a substantially lower proportion of the direct entrants were male (40%) as opposed to female (60%). Relative to direct entrants, slightly more of the vertical transfer students (46%) and lateral transfer students (42%) were male; however all three groups were predominantly comprised of female students. On the other hand, males made up a majority of the reverse/vertical transfer group (53%) and the vertical/lateral transfer group (60%). This indicated that higher proportions of the transfer groups enrolling at more than one institution prior to enrolling at their institution of reference were male.
Race. Direct entrants and vertical/lateral transfers were the most racially diverse groups with roughly one out of every five members categorized within the underserved minority category. Vertical transfers were the least racially diverse group with only 12% falling within one of the underserved minority categories and they were closely followed by lateral transfers (14%).
High School. Proportionally, a greater share of the students who initially enrolled at a community college, as opposed to a four-year college, were graduates of public high schools. Relative to the other groups, vertical transfers had the highest proportion graduating from public high schools at 92%, closely followed by vertical/lateral transfers at 90%.
Transfer Hours
As shown in Table 5, lateral transfer students generally transitioned to one of the institutions of reference with the fewest credit hours. This was evidenced by both their mean number of transferred credits (46) and their relatively low percentage transferring with more than two years of credit (26%). The vertical/lateral transfer students had significantly more transfer hours on average (67) than the other groups, as well as the highest proportion with more than two years of credit (56%). They were followed by the reverse/vertical transfer groups and those transferring directly from community colleges. Slightly more than half of the reverse/vertical transfer group transferred in with more than two years’ worth of credit and their mean number of transferred credits was 61. The community college transfer students had the same percentage with more than two years of credit (51%), but a slightly lower mean number of transfer hours (57).
Table 4:Demographics and Entry Status
Transfer StatusGender (Male)
White and
AsianTraditionally Underserved
Race Missing Public HS
Direct Entrant 40% 73% 20% 7% 84%Vertical Transfer 46% 79% 12% 9% 92%Lateral Transfer 42% 79% 14% 7% 84%Reverse/Vertical Transfer 53% 76% 18% 5% 81%Vertical/Lateral Transfer 60% 75% 21% 5% 90%Total 43% 75% 18% 7% 86%

13
Bachelor’s Degree Completion in Nine Years after 2003 HS Graduation
In this section, bachelor’s degree completion is explored in a few different ways. First, bachelor’s completion at the end of the study is examined dichotomously (yes/no) using both descriptive and inferential analyses. In the descriptive analysis, information with regards to where the degree was awarded is provided (i.e., at the institution of reference or elsewhere). Next, the decision tree analyses (CHAID) are presented to show the association between select covariates and bachelor’s degree completion. Finally, the survival analyses are combined with mean time to degree completion and presented to add a “how long” or “time to” aspect to the study.
Institution of Reference. In terms of bachelor’s degree completion at one of the institutions of reference, direct entrants had the lowest rate (60%) and they were closely followed by the vertical/lateral transfer students (62%). The other three transfer groups had substantially higher rates of bachelor’s completion at the institution of reference, ranging from 67% for community college transfers to 69% for those taking the reverse/vertical pathway (see Figure 5 on p. 14). Keep in mind however, that many of the transfer students entered their four-year institution of reference with nearly two years worth of credit. Therefore, their point of entry is much later in their academic careers relative to direct entrants, who enter with little or no college credit. Further, the issues associated with first and second year retention are no longer pertinent for those transferring in with two-years worth of credit. As argued in Lichtenberger and Dietrich (2013), to make the comparisons between transfer students and direct entrants more compatible, researchers need to control for the point of entry for the transfer students. In several studies, direct entrants who have persisted until their junior year are compared to transfer students with roughly 60 hours of transferred credit.
In total, an additional nine percent of the sample earned a bachelor’s degree after transferring to another four-year institution (outside of their institution of reference). An additional 10% of the direct entrants and lateral transfer students earned bachelor’s degrees elsewhere. This shows that, from the perspective of the institution of reference, even a fair number of their transfer students leave and eventually complete their degrees at other four-year colleges.
Table 5:Transfer Hours by Transfer Status
Transfer Status
Mean Number of Transfer Hours
Less than 1 Year
Between 1 and 2 Years
More than 2 Years
Vertical Transfer 57 11% 38% 51%Lateral Transfer 46 29% 44% 26%Reverse/Vertical Transfer 61 8% 41% 51%Vertical/Lateral Transfer 67 3% 41% 56%

14
As shown in Figure 5, in looking at the combined rates of bachelor’s degree completion, lateral transfer students had the highest rate at 78%, followed by the reverse/vertical transfers at 75%. The transfer students who took the vertical/lateral route had the lowest combined rate of bachelor’s degree completion at 67%.
Figure 5:Bachelor’s Degree Completion by Entry Status
Earned BA at Instution of Reference Earned BA Elsewhere No degree
62%
69%
68%
67%
60%
5%
6%
10%
6%
10%
33%
25%
22%
27%
30%
0% 20% 40% 60% 80% 100%
Vertical/Lateral Transfer
Reverse/Vertical Transfer
Lateral Transfer
Vertical Transfer
Direct Entrant
70% Combined
73% Combined
78% Combined
75% Combined
67% Combined

15
Figure 6:College Readiness in Mathematics, Entry Status, and Bachelor’s Degree Completion
Node 0
Category % n
28 .3 1124No Bachelor’s71 .7 2848Bachelor’s
Total 100 .0 3972
Math College Ready
Node 1
Category % n
22 .2 446No Bachelor’s77 .8 1561Bachelor’s
Total 50 .5 2007
Math College Ready
Node 2
Category % n
34 .5 678No Bachelor’s65 .5 1287Bachelor’s
Total 49 .5 1965
Entry Status
Missed Math Benchmark
Node 3
Category % n
29 .6 243No Bachelor’s70 .4 578Bachelor’s
Total 20 .7 821
All Transfers
Node 4
Category % n
38 .0 435No Bachelor’s62 .0 709Bachelor’s
Total 28 .8 1144
Direct Entrant
No Bachelor’sBachelor’s
College Readiness in Mathematics
Next, the association between entry status and bachelor’s degree completion was examined, taking into consideration other factors such as transfer hours and the college readiness benchmarks established by ACT. As established by Bettinger, Evans, and Pope (2011) and echoed by Lichtenberger and Dietrich (2012) performance on ACT Math appears to be strongly associated with positive college outcomes. When examining the impact of pre-college characteristics, this held partially true for the current study. As shown in Figure 6, college readiness in mathematics2 was an important predictor of bachelor’s degree completion for some groups. Those who met the college readiness benchmark on the ACT had a bachelor’s degree completion rate of nearly 77.8%, while those missing the benchmark had a rate of nearly 65.5%. However, missing the math benchmark appeared to have a much larger negative impact on bachelor’s degree completion for direct entrants (62.0%) when compared with transfer students (70.4%).
_______________2 College readiness in mathematics is defined as attaining a 22 or higher on the mathematics subject test on the ACT.

16
Figure 7:College Readiness in Mathematics, Transfer Hours, and Bachelor’s Degree Completion
Node 0
Category % n
28 .3 1124No Bachelor’s71 .7 2848Bachelor’s
Total 100 .0 3972
Math College Ready
Node 1
Category % n
22 .2 446No Bachelor’s77 .8 1561Bachelor’s
Total 50 .5 2007
Transfer Hours Category
Math College Ready
Node 2
Category % n
34 .5 678No Bachelor’s65 .5 1287Bachelor’s
Total 49 .5 1965
Transfer Hours Category
Missed Math Benchmark
Node 3
Category % n
16 .5 54No Bachelor’s83 .5 274Bachelor’s
Total 8.3 328
More than 2 years
Node 4
Category % n
34 .4 33No Bachelor’s65 .6 63Bachelor’s
Total 2.4 9 6
Less than 1 year
Node 5
Category % n
22 .7 359No Bachelor’s77 .3 1224Bachelor’s
Total 39 .9 1583
One to 2 years; Direct Entrant
Node 6
Category % n
20 .6 71No Bachelor’s79 .4 274Bachelor’s
Total 8.7 345
More than 2 years
Node 7
Category % n
37 .5 607No Bachelor’s62 .5 1013Bachelor’s
Total 40 .8 1620
Less than 1 year; One to 2 years;
Direct Entrant
No Bachelor’sBachelor’s
As illustrated in Figure 7, including transfer hour category in the model suggests the impact of college readiness in mathematics, or the lack thereof, is more of a function credit hours transferred, as the relationship only holds true for those transferring in with more than two-year’s worth of credit. In fact, such transfer students do almost as well as their counterparts who were college ready in mathematics and outperform those who were college ready in math who transferred in with less than one year’s worth of credit. However, once again, point of entry needs to be taken into consideration.
Exploring Churn among Direct Entrants as It Relates to Bachelor’s Degree Completion
The enrollment patterns of direct entrants at other institutions also played a significant role in bachelor’s degree completion. First and foremost, the results demonstrate how reverse transferring to a community college (without taking into consideration concurrent and summer enrollment) is negatively associated with bachelor’s degree completion. This finding is similar to Lichtenberger (2011), Goldrick-Rab and Pfeffer (2009), and Kalogrides and Grodsky (2011). Among reverse transfer students who do not make the transition to another four-year college, the rate of degree completion is only 13.2%. This suggests that relatively few reverse transfer students are returning to their original institution of reference and completing a bachelor’s degree. Among the reverse transfer students who eventually transition to another four-year college (lateral transfers), the rate of degree completion is substantially higher at 44.6%.

17
Figure 8:The Impact of Institution Churn on Bachelor’s Degree Completion for Direct Entrants
Node 0
Category % n
29 .9 739No Bachelor’s70 .1 1732Bachelor’s
Total 100 .0 2471
Native Lateral Transfer
Node 1
Category % n
27 .6 561No Bachelor’s72 .4 1469Bachelor’s
Total 82 .2 2030
Native Reverse Transfer
Did not Laterally Transfer
Node 2
Category % n
40 .4 178No Bachelor’s59 .6 263Bachelor’s
Total 17 .8 441
Native Reverse Transfer
Lateral Transfer
Node 3
Category % n
14 .8 246No Bachelor’s85 .2 1421Bachelor’s
Total 67 .5 1667
Community College Summer Sessioner
Did Not Reverse Transfer
Node 4
Category % n
86 .8 315No Bachelor’s13 .2 48Bachelor’s
Total 14 .7 363
Community Summer Sessioner
Undergraduate Reverse Transfer
Node 5
Category % n
27 .6 66No Bachelor’s72 .4 173Bachelor’s
Total 9.7 239
Communty Summer Sessioner
Did Not Reverse Transfer
Node 6
Category % n
55 .4 112No Bachelor’s44 .6 90Bachelor’s
Total 8.2 202
Undergraduate Reverse Transfer
Node 7
Category % n
17 .0 229No Bachelor’s83 .0 1122Bachelor’s
Total 54 .7 1351
No Summer Enrollment
Node 8
Category % n
5.4 1 7No Bachelor’s94 .6 299Bachelor’s
Total 12 .8 316
Summer Sessioner
Node 9
Category % n
88 .9 264No Bachelor’s11 .1 33Bachelor’s
Total 12 .0 297
No Summer Enrollment
Node 10
Category % n
77 .3 51No Bachelor’s22 .7 15Bachelor’s
Total 2.7 6 6
Summer Sessioner
Node 11
Category % n
31 .4 58No Bachelor’s68 .6 127Bachelor’s
Total 7.5 185
No Summer Enrollment
Node 12
Category % n
14 .8 8No Bachelor’s85 .2 46Bachelor’s
Total 2.2 5 4
Summer Sessioner
No Bachelor’sBachelor’s
Enrolling at a community college over the summer was generally associated with higher rates of bachelor’s degree completion. Nearly all (94.6%) of the direct entrants who did not reverse transfer but enrolled at a community college over summer completed a bachelor’s degree. A similar summer enrollment benefit was also evident for lateral transfers who did not reverse transfer (85.2%).
Direct entrants who laterally transferred to another four-year college without reverse transferring had a somewhat lower rate of degree completion (72.4%) in comparison to those who did not laterally transfer and did not reverse transfer (85.2%).
As illustrated in Figure 8, including transfer hour category in the model suggests the impact of college readiness in mathematics, or the lack thereof, is more of a function credit hours transferred, as the relationship only holds true for those transferring in with more than two-year’s worth of credit. In fact, such transfer students do almost as well as their counterparts who were college ready in mathematics and outperform those who were college ready in math who transferred in with less than one year’s worth of credit. However, once again, point of entry needs to be taken into consideration.

18
Figure 9:Combined Time to Bachelor’s Degree Completion by Entry Status*
Combined Time to Bachelor’s Degree Completion
9876543210
Cum
ulat
ive
% E
arni
ng D
egre
e
80%
60%
40%
20%
0%
Vertical/Lateral Transfer
Reverse/Vertical Transfer
Lateral Transfer
Vertical TransferDirect Entrant
Entry Status
Mean Years to Bachelor’s Degree CompletionDirect Entrant 4.42Vertical Transfer 5.11Lateral Transfer 4.69Reverse/Vertical Transfer 5.36Vertical/Lateral Transfer 5.62
Time to Bachelor’s Degree Completion
After combining the NSC degree completion data with institutional records, we were able to track students nine years after initial enrollment in the fall semester of 2003. Time to degree completion is from initial entry during the fall semester of 2003 combined with their time at all other colleges from the National Student Clearinghouse.
Direct entrants generally maintained a relative advantage over the transfer groups in the early parts of the study, with a small advantage over lateral transfer students. However, five years into the study, the lateral transfer students catch up to the direct entrants and have higher rates of degree completion throughout the remainder of the study. Around seven years out, the community college transfer students and the reverse/vertical transfers catch up with direct entrants in terms of degree completion and eventually surpass the direct entrants. The vertical/lateral transfers had the lowest cumulative rates of degree completion throughout the study. In terms of mean time to degree completion, direct entrants had a relative advantage over the transfer groups. However, the difference between the direct entrants and lateral transfer students was fairly small.
*Starts the fall semester of 2003.

19
Figure 10:Combined Time to Bachelor’s Degree Completion by Transfer Hours Category
Combined Time to Bachelor’s Degree Completion
9876543210
Cum
ulat
ive
% E
arin
g a
Deg
re
100%
80%
60%
40%
20%
0%
Transfer Hours Category
Less than 1 year
1 to 2 years
More than 2 years
Mean Years to Bachelor’s Degree Completion
Less than 1 year 4.81One to 2 years 5.00More than 2 years 5.16
Among transfer students, those transferring in with more credit had a significantly higher cumulative rate of degree completion. Further, as shown in Figure 10 transferring in with more credit provided only a slightly higher mean number of years to degree completion compared to those transferring with two or fewer years of credit.
20
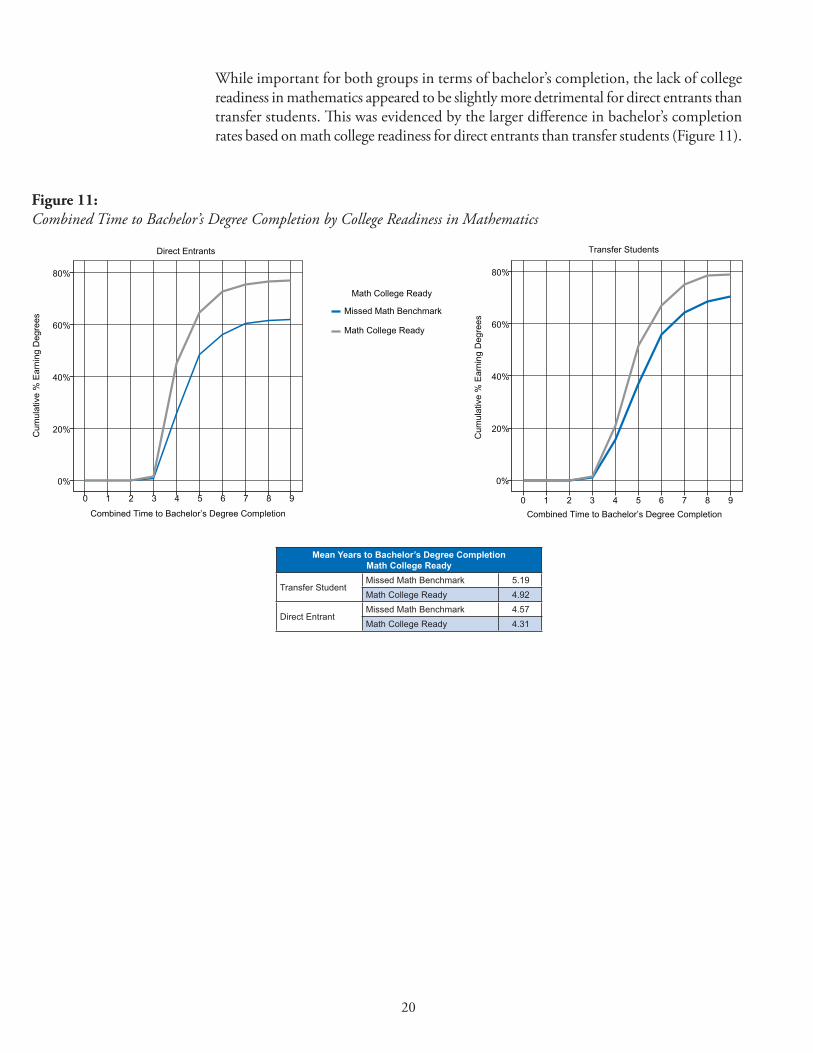
While important for both groups in terms of bachelor’s completion, the lack of college readiness in mathematics appeared to be slightly more detrimental for direct entrants than transfer students. This was evidenced by the larger difference in bachelor’s completion rates based on math college readiness for direct entrants than transfer students (Figure 11).
Figure 11:Combined Time to Bachelor’s Degree Completion by College Readiness in Mathematics
Combined Time to Bachelor’s Degree Completion
9876543210
Cum
ulat
ive
% E
arni
ng D
egre
es
80%
60%
40%
20%
0%
Direct Entrants
Math College Ready
Missed Math Benchmark
Math College Ready
Combined Time to Bachelor’s Degree Completion9876543210
Cum
ulat
ive
% E
arni
ng D
egre
es
80%
60%
40%
20%
0%
Transfer Students
Mean Years to Bachelor’s Degree CompletionMath College Ready
Transfer StudentMissed Math Benchmark 5.19Math College Ready 4.92
Direct EntrantMissed Math Benchmark 4.57Math College Ready 4.31

21
Degrees by Entry Status
Focusing on the majors of bachelor’s degree completers, the differences between direct entrants and transfer students were fairly small. As illustrated in Figure 12, relative to direct entrants, slightly more transfer students earned degrees in communication/journalism (8.2% to 6.8%), engineering (3.6% to 2.6%), English (5.0% to 3.4%), and history (2.8% to 1.6%). Slightly more direct entrants earned degrees in biological sciences (5.9% to 3.6%), social science (9.0% to 7.8%), visual and performing arts (6.5% to 3.5%) and business (31.7% to 29.5%).
Figure 12:Degree CIP Code (2-digit) by Entry Status
2.8%
2.8%
29.5%
3.8%
3.5%
7.8%
1.4%
2.6%
8.3%
1.0%
1.8%
1.2%
3.6%
5.0%
1.3%
3.6%
9.2%
2.5%
8.2%
3.6%
1.6%
31.7%
4.1%
6.5%
9.0%
0.7%
1.4%
7.6%
1.1%
0.8%
0.6%
5.9%
3.4%
1.0%
2.6%
8.8%
2.9%
6.8%
0% 10% 20% 30% 40%
Other
History
Business
Health
Visual and Performing Arts
Social Science
Public Administration
Security
Psychology
Physical Sciences
Parks and Recreation
Math
Biological Sciences
English
Foreign Language
Engineering
Education
CIS
Communication/Journalism
Direct Entrant Transfer Student

22
Earnings among Bachelor’s Completers
Among the 2,849 bachelor’s degree completers, 1,370 (just under 50%) had reportable wages in Illinois the quarter following graduation and maintained employment for three consecutive quarters.3 The earnings information is for the 2nd quarter during the first three quarter block of employment to better ensure the individual worked an entire quarter, since individuals may have begun employment mid-way through the first quarter or exited mid-way through the last quarter.
As shown in Figure 13, direct entrants had somewhat higher middle quarter wages upon degree completion ($7,417) relative to the transfer groups. Lateral transfers and community college transfers had quarterly wages of roughly $7,000, followed by those taking the other four-year to community college route at $6,859. The transfer students who originally enrolled at a community college and transferred to another four-year college prior to enrolling at the four-year college of reference had the lowest quarterly wages at $6,400.
Figure 13:Middle Quarter Wages by Entry Status
$6,400
$6,859
$7,043
$7,013
$7,417
$5,500 $6,000 $6,500 $7,000 $7,500
Vertical/Lateral Transfer
Reverse/Vertical Transfer
Lateral Transfer
Vertical Transfer
Direct Entrant
_______________3 This should not be confused with an employment rate, as members of the sample may have gained employment outside the state of Illinois, may have worked for an employer in Illinois that does not have to report to the unemployment insurance system, may have been self-employed, or worked as a contractor. Also, individuals in the sample may have had reportable earnings outside the scope of the definition (only two quarters of consecutive employment) or later in the study (past the first three quarters being measured). Also, graduate school enrollment was not considered, as members of the sample may have been working part-time and attending school. Further, not everyone is the sample had a social security number which was required for a match.

23
As shown in Figure 14, graduates who were college ready in math had higher middle quarter wages relative to their counterparts who missed the ACT college readiness benchmark in mathematics. Mean middle quarter wages for graduates who were college ready in math were nearly $1,100 higher (over 16%) relative to graduates missing the benchmark.
Figure 14:Middle Quarter Wages by College Readiness in Mathematics
$6,688
$7,783
$6,000 $6,500 $7,000 $7,500 $8,000
Missed Math Benchmark
Math College Ready

24
Figure 15:Mean Second Quarter Wages by Two-Digit CIP Code
$3,628$3,969
$4,711$4,739$4,897
$5,402$5,430
$5,610$5,871$5,988
$6,265$6,327$6,359$6,392$6,434
$6,653$6,670$6,785
$6,991$7,510
$8,243$8,678$8,840$8,983
$9,281$9,444
$10,702$11,450
$0 $2,000 $4,000 $6,000 $8,000 $10,000 $12,000
Liberal ArtsPhilosophy
Biological SciencesVisual and Performing Arts
HistoryPsychology
Foreign LanguageFamily and Consumer Sciences
EnglishPublic Administration
Comm./JournalismSocial Science
SecurityMath and Statistics
Parks and RecreationPhysical Sciences
ArchitectureEducation
InterdisciplinaryEthnic and Racial Studies
Mechanical RepairHealth
Construction TradesBusiness
Legal StudiesComputer Information Systems
EngineeringEngineering Technology
Variation in middle quarterly wages based on major was substantially larger than it was for transfer status. As shown in Figure 15, students earning degrees in an engineering field had the highest reported middle quarter wages upon graduation. Students with a bachelor’s degree in engineering technology had mean wages of $11,450, while those majoring in engineering had wages of $10,702. These were the only two CIP codes over the $10,000 threshold. Those with degrees in liberal arts and philosophy had the lowest second quarter wages upon graduation, $3,628 and $3,969, respectively.

25
• Securely Transferring the Data: A primary method for securely transferring the data should be established and contingency plans should be developed in the event the primary transfer method does not work. Researchers should understand that it takes significant energy and effort to establish protocols for securely transferring files; fortunately, once the procedures and protocols are established they can be used again in the future.
• Merging: Researchers using multiple reference points in their analyses should consider creating a separate case for each individual for each institution of reference. This will not only help in merging the data, but also help simplify the analysis. Further, merging files can take much longer than anticipated.
• National Student Clearinghouse: When matched to other data sources, such as the HS Class of 2003 file, the college enrollment information provided by the National Student Clearinghouse is most likely an underestimate of actual enrollment. However, researchers can be confident that the matches they do receive from the NSC are true matches.
• Wage Records: Earnings information is extremely useful for examining overall employment patterns among the students with valid social security numbers who matched to IDES records. As used in the current study, the wage information provided an initial glance at the short-term employment outcomes for various groups of bachelor’s degree completers. However, researchers should use caution when making generalizations and clearly state the limitations of the data. In other words, the information is only pertinent in establishing the earnings and employment patterns of those who matched, but a lack of a match does not equate to unemployment or underemployment. Also, institutional context needs to be considered when using such data. For example, if a college is located near another state and many of its graduates cross state borders for employment, it would impact match rates and potentially earnings and employment for those who do match. Also, self-employment and graduate enrollment need to be considered in interpreting findings.
• Using a point of reference to explain transfer patterns: When exploring transfer patterns it is useful to use a point of reference to better define the patterns of the students transferring into and out of a given institution. For institutional researchers, this is not an issue since their college would generally be the reference point. However, as state longitudinal data systems are developed this is something to consider because transferring means different things depending on the perspective.
• Bachelor’s degree completion at other institutions: The analyses demonstrate the utility of using outside data sources, namely the NSC, to expand traditional institutional measures of bachelor’s degree completion. Many of the direct entrants (an additional ten percent) completed their bachelor’s degree elsewhere. To a slightly lesser extent this also held true for the transfer students (particularly
Lessons Learned

26
lateral transfer students), as many transferred again and completed their bachelor’s degree program elsewhere. The combined rate of degree completion demonstrates the utility of taking a more student-centered approach, as opposed to an institutional-centered approach, when tracking bachelor’s degree completion.
• Extending the traditional length of time to degree completion: These analyses demonstrate the benefit of moving beyond the traditional 150% of normal time to better capture degree completion for transfer students. When measured past 150% of normal time, the transfer students generally catch up and some of the transfer groups surpass the direct entrants. However, the cumulative rate of bachelor’s degree completion flattens out between years 8 and 9, suggesting 200% of normal time (combining time spent at previous institutions) would be sufficient in most cases.
• Time to degree and survival are complementary measures: When looking at time to degree completion, multiple measures should be used. Mean time to degree is conditional upon degree completion, so it does not provide an overarching view of the proportion of individuals who are completing, nor does it provide information related to exactly when they are completing. It would be beneficial to use both the conditional approach and survival, such as cumulative rates of degree completion, as complementary outcome measures.
• Transfer hours and degree completion: Transfer hours provide some useful information specifically in terms of its association with bachelor’s degree completion. However, as argued earlier, one must be careful in making comparisons between transfer students and direct entrants, as those who transfer to another institution with 60 credit hours have arguably bypassed the problems generally associated with first and second year retention. A better comparison would be direct entrants that have a parallel number of credit hours in addition to similar class status. The rising junior compared to transfer junior approach is one example.
• Decision tree analyses: The form of decision tree analysis employed in this study was useful for providing a simplified examination of the relationship between select covariates and bachelor’s degree completion.

27
This proof of concept project demonstrated that institutional data sources can successfully be merged with outside sources of data to address numerous research questions. Yet, merging several informational sources is time consuming, requires careful planning, and even more careful execution. Further, given the technical nature of the matching procedures and security concerns, obtaining data from outside sources, even when shared data agreements are fully executed, can take significantly more time than what is generally anticipated. As a result, researchers should consider similar projects as a pilot or as a means to rectify issues in obtaining and merging the data sets. Once those issues are resolved, the purpose of future projects can evolve to focus more on the analyses and modeling. Ideally, the Illinois longitudinal data system would help facilitate research by making the process of merging several sources of data somewhat easier or more seamless. However, while building comprehensive longitudinal databases would help to facilitate research, it does not completely eliminate all of the barriers to analyzing the data.
This research can inform efforts to integrate data, as the state of Illinois develops its longitudinal data system bringing together informational sources spanning the P-20 to workforce spectrum. First and foremost, valuable information is potentially provided when outside sources are used to augment institutional sources of data. From the institutional perspective, many students are utilizing outside institutions as a means to persist in college, such as during summer session or concurrently with the institution of reference, and a surprisingly high proportion are completing their bachelor’s degree elsewhere (up to ten percent depending on transfer status). While this enrollment and degree completion information is not currently being captured via traditional reporting mechanisms, such as IPEDS, it could be made available through the state’s longitudinal data system or NSC data.
The study presents a vision of the types of research topics that can be addressed as the Illinois longitudinal data system is developed, while demonstrating the benefits to the higher education institutions and the education policy community alike. Current and potential Illinois Higher Education Consortium (IHEC) members can take into consideration some of the benefits a P-20 to workforce longitudinal data system would provide, as demonstrated through this project. Above and beyond being able to better track the enrollment and degree completion patterns of their students at outside institutions, there is value-added associated with gaining access to pre-college information for transfer students. As stated earlier in this report, many institutions lack pre-college information on the students transferring into their colleges, which would be available for most Illinois students through K-12 informational sources. This information could help institutions provide better support services to their transfer students.
Employment and earnings information from IDES would also be a potential benefit for current and future IHEC members, assuming IHEC membership would provide greater access to the state’s longitudinal data system as a whole. This information would allow institutions to analyze the Illinois-specific employment patterns of their current
Summary

28
and former students/graduates, and provide important evidence about the economic impact of their programs.
This project contributed to both our understanding of the methodological ramifications of merging multiple data sources and longitudinally tracking outcomes. In addition, the project provided some interesting substantive findings specific to the differences between direct entrants and transfer students and between the subgroups of transfer students. Generally, the direct entrants had a shorter time to degree completion; however, in terms of cummulative rate of degree completion, many of the transfer students catch up to and surpass the direct entrants towards the end of the study (lateral transfer somewhat earlier than vertical transfers). The manner in which direct entrants utilize other institutions had an impact on bachelor’s degree completion. Reverse transferring was negatively associated with degree completion, while enrolling at a community college over the summer was positively associated with degree completion. Missing the college readiness benchmark in mathematics was more detrimental in terms of bachelor’s completion for direct entrants than it was for transfer students. Direct entrants maintained a slight advantage over transfer students in terms of earnings upon gradation. However, there was significantly more variation in earnings based on degree type than entry status.
As with any comprehensive research, the longitudinal methodology that was employed in the current study raises several issues for future investigation. For example, it would be interesting to determine how math college readiness interacts with the selection of majors and the impact that interaction has on future earnings. Another research area would be to establish the predictors of graduate school enrollment and completion, as well as the role graduate education has on earnings. Future research can be enhanced with input and guidance from groups of educators and policymakers, such as IHEC and its member institutions, along with other key stakeholders—including students.

29
References
Bettinger, E.P., Evans, B., & Pope, D.G. (2011). Improving college performance and retention the easy way: Unpacking the ACT exam. Retrieved from http://faculty.chicagobooth.edu/devin.pope/research/pdf/Final%20AEJ%20Paper.pdf
Cameron, J., Filkins, J., & Kehoe, L. (2012). Modeling transfer student outcomes: Insights from private 4-year institutions. Paper presented at Association for Institutional Research Annual Forum. New Orleans, LA. Retrieved from http://prezi.com/qjgijihpozaw/air-2012-presentationmodeling-transfer-outcomes/
Dudley, W.N., DiIorio, C., & Soet, J. (1999) Detecting and explicating interactions in categorical data. Nursing Research (48), 53.56.
Goldrick-Rab, S. & Harris, D. (2010). Observations on the use of NSC data for research purposes (White paper). Chicago: The Spencer Foundation (http://www.spencer.org). Retrieved from http://www.finaidstudy.org/documents/NSC%20Dear%20colleagues%20letter.pdf
Goldrick-Rab, S. & Pfeffer, F.T. (2009). Beyond access: Explaining socioeconomic difference in college transfer. Sociology of Education, 82(2), 101-125.
Kalogrides, D. & Grodsky, E. (2011). Something to fall back on: Community colleges as a safety net. Social Forces, 89(3), 853-877.
Lichtenberger, E. (2011). Reverse transfer students and postsecondary outcomes: A potential opportunity (IERC 2011-5). Edwardsville, IL: Illinois Education Research Council.
Lichtenberger, E. & Dietrich, C. (2012). College readiness and the postsecondary outcomes of Illinois high school students (IERC 2012-1). Edwardsville, IL: Illinois Education Research Council.
Lichtenberger, E. & Dietrich, C. (2013). The community college penalty and bachelor’s degree completion: Fact or fiction? (IERC-2013-1). Edwardsville, IL: Illinois Education Research Council.