Embed Size (px)
Citation preview
Impacts of Conditional Cash Transfer Programs on Educational Outcomes in Developing Countries A Meta-analysis
JUAN ESTEBAN SAAVEDRA AND SANDRA GARCIA
WR-921-1
February 2012
This paper series made possible by the NIA funded RAND Center for the Study of Aging (P30AG012815) and the NICHD funded RAND Population Research Center (R24HD050906).
WORK ING P A P E R
This product is part of the RAND Labor and Population working paper series. RAND working papers are intended to share researchers’ latest findings and to solicit informal peer review. They have been approved for circulation by RAND Labor and Population but have not been formally edited or peer reviewed. Unless otherwise indicated, working papers can be quoted and cited without permission of the author, provided the source is clearly referred to as a working paper. RAND’s publications do not necessarily reflect the opinions of its research clients and sponsors.
is a registered trademark.

1
Impacts of Conditional Cash Transfer Programs on Educational Outcomes
in Developing Countries: A Meta-analysis
Juan Esteban Saavedra*
Sandra García**
February 2012
Abstract
We meta-analyze enrollment, attendance and dropout effect estimates from forty two
references of conditional cash transfer program evaluations in fifteen developing countries.
Average effect sizes for all outcomes in primary and secondary schooling are statistically
different from zero. Average effect sizes for secondary enrollment, attendance and dropout are
larger than those for primary. For all outcomes and schooling levels, there is considerable
heterogeneity in effect sizes. Programs with more generous transfers have larger primary and
secondary enrollment effects. Programs that condition benefit receipt on achievement and pay
transfers less frequently than monthly, exhibit larger enrollment and attendance effects. Effect
sizes are no different in programs with random assignment. We find evidence in support of
publication bias and selective reporting.
_______________________ * Corresponding author. RAND Corporation, 1776 Main Street, Santa Monica, CA, 90407. Email: [email protected] ** School of Government, Los Andes University, Carrera 1 # 19-27. Bogotá, Colombia. Email: [email protected] We thank Felipe Alvarez, Omar Herrera, Isabella Sinisterra and especially Tatiana Velasco for research assistance. Saavedra acknowledges financial support from RAND Corporation and Universidad de los Andes. García acknowledges financial support from Los Andes University. All errors are our own.

2
I. Introduction
Conditional cash transfer (CCT) programs have spread rapidly over the last decade in the
developing world. CCT programs provide cash transfers to poor families that are contingent on
children’s educational and health investments, typically school attendance and regular medical
checkups, with the goal of breaking the intergenerational cycle of poverty. As of 2010, all but
two countries in Latin America and over 15 countries in Asia and Africa had a CCT program as
part of their social protection systems. In Latin America alone, CCT programs benefit over one
hundred and ten million people (The Economist, 2010).
In most of these countries, a rigorous impact evaluation – typically a treatment/control
experimental or observational setup – has accompanied CCT program implementation. In fact,
the positive results on schooling and health outcomes of early impact evaluations of pioneer
programs such as Oportunidades in Mexico and Bolsa Escola in Brazil helped paved the way for
the rapid expansion of these programs elsewhere.
Recent qualitative review studies of CCT evaluations (IEG, 2011; Fiszbein et al., 2009;
Rawlings and Rubio, 2005) conclude that, on the whole, these programs have positive effects on
schooling (enrollment, attendance, dropout) and health (vaccinations, medical check-up)
outcomes. These reviews also indicate that there is substantial variation in effect sizes between
countries and among different population groups within countries (for example gender, age or
urban vs. rural residence).
While the basic structure of CCTs is essentially the same, specific design features vary
considerably across programs and countries. Transfer amounts – even after accounting for
differences in purchasing power – vary widely across programs. In Bangladesh, for example, the
average household transfer is about one percent of household expenditures while in Nicaragua it
is about twenty-nine percent (Fiszbein, et al., 2009). Programs also differ in how much they pay
to different groups and when. While Mexico’s Oportunidades pays students differently
depending on school grade and gender, Brazil’s Bolsa Escola makes no such differentiation.
Some countries, recognizing potential educational resource constraints, complement household
transfers with a supply-side intervention such as grants school construction or school grants,
teachers bonuses or textbook provision.
Individual evaluations suggest that program design features such as transfer amounts (Filmer
and Schady, 2009a), timing of payments (Barrera-Osorio, Bertrand, Perez-Calle and Linden,

3
2009) or whether there is a supply-side intervention (Filmer and Schady, 2009b; Glewwe and
Olinto, 2004) explain certain patterns of treatment effect heterogeneity. No study to date,
however, integrates quantitatively and in a systematic manner the available evidence on the
effects of CCT programs on schooling outcomes nor attempts to statistically understand the
factors and program characteristics that mediate the heterogeneity in reported program effects.
The closest available study in scope is Manley, Gitter and Slavchevska (2011), which meta-
analyzes the impact of CCT programs on nutritional status. Our main contribution to the CCT
literature is, therefore, to integrate in a rigorous and systematic way the available evidence on
CCT effects on educational outcomes, and shed light on which factors mediate heterogeneity in
treatment effects.
From a literature search of over 25 electronic databases conducted in the spring of 2010, we
surveyed 2,931 initial references containing the words “conditional cash transfer” or “conditional
cash transfers” in either title, keyword or abstract (introduction if abstract not available). After
screening out duplicate references, references that did not report effects on school enrollment,
attendance or dropout and references that where either summary of other reports, reviews or
commentaries, we narrowed down our sample to forty-two references covering CCT programs in
fifteen developing countries, twenty-eight of which report effects on enrollment, nineteen on
attendance and nine on dropout (some references report effects in more than one of these
outcomes.) Two independent coders coded reference (such as authors, type of publication,
sample size, effects, standard errors) and program (such as transfer amounts, conditions)
characteristics. We computed inter-rater reliabilities for separate coding-protocol modules
(program characteristics, study characteristics, enrollment effects, attendance effects, dropout
effects) and in all cases obtained reliabilities of 85% or higher. We cross-validated each
discrepancy by referring back to the corresponding reference. To statistically combine and
analyze effect sizes we use various random and mixed effects models.
We find five key results. First, CCT average effect sizes on enrollment, attendance and
dropout are all positive and statistically significant and larger in magnitude for secondary than
for primary schooling. For instance, our primary schooling enrollment average effect size
estimates are of around five percentage points. Relative to the average primary enrollment at
baseline – which in our sample of studies is 84% – the average effect size represents a six-
percent enrollment increase. In contrast, the average effect size for secondary enrollment – close

4
to six percentage points – represents a ten percent enrollment effect. For attendance outcomes
the difference is even more drastic. Relative to baseline attendance, the average effect size in
primary is about three percent while for secondary is close to twelve percent. We find that CCTs
reduce dropout rates by twice as much in secondary that in primary schooling. Also consistent
with the observation that schooling effects might be larger in settings with lower initial
conditions (see for example, Fiszbein et al., 2009) we find that, for both primary and secondary,
effects on attendance are statistically larger when attendance baseline levels are lower.
Second, for all outcomes (enrollment, attendance and dropout) in all levels (primary and
secondary) we find high levels of heterogeneity – in excess of seventy percent – in reported
effects. Perhaps unsurprisingly, most of the heterogeneity stems from variation in effects across
programs rather than within program.
Third, we find systematic patterns of bivariate associations between effects sizes and
program characteristics. We find that more generous program transfer amounts (measured as
percent of PPP-adjusted GDP per capita) are positively and significantly associated with larger
primary and secondary enrollment effects (and in some models with larger secondary attendance
effects as well), which suggests that more generous transfers might better compensate for the
opportunity cost of sending children to school. This result challenges previous single-country
evidence from Cambodia suggesting decreasing returns to transfer amount (Filmer and Schady,
2009a).
In both primary and secondary levels and for both enrollment and attendance outcomes, we
find that the frequency of payment (monthly vs. less frequently) is negatively associated with the
size of effects. Programs in which transfer payment is bi-monthy or quarterly tend to report
larger effects than those in which payment is monthly. This result is consistent with single-
program evidence from Bogotá (Barrera-Osorio, Bertrand, Perez-Calle and Linden, 2009) and
with the idea that limited attention (Karlan, McConnell, Mullainathan and Zinman, 2011) or
limited self-control (Ashraf, Karlan and Yin, 2006) can constrain families from saving.
Imposing conditions on achievement (such as not failing grades) beyond the standard
attendance conditions is positively associated with larger secondary enrollment and attendance
effects. This finding resonates with recent literature highlighting the importance of incentives in
education (see for example Duflo, Hanna and Ryan, forthcoming; Bettinger, Kremer and
Saavedra, 2010; Kremer, Miguel and Thornton, 2009).
5
We find significantly larger primary enrollment effects in programs that also attempt to
expand supply through grants, infrastructure or other resources for schools. This result is
consistent with single-program evidence from the Mexico’s Oportunidades suggesting that
school enrollment impacts were larger in areas with better school infrastructure and lower pupil-
teacher ratios (Berhman, Parker and Todd, 2005) and with evidence from Colombia highlighting
the importance of resource constraints in education (Saavedra, in press). We also find that
secondary enrollment and attendance effect sizes are larger for CCT programs in Asia or Africa
relative to those in Latin America. This finding is driven very large – of the order of twenty
percentage points – secondary effect sizes for Cambodia’s CESSP and JFPR programs.
Fourth, we find no systematic association between effect sizes and whether benefits were
randomly assigned. All CCT programs target benefits to underprivileged groups. Such negative
selection would suggest that observational evaluations might understate program impacts relative
to evaluations that deal with selection through randomization. While we find that random
assignment is positively, although statistically insignificantly associated with primary enrollment
and attendance effect sizes, we also find that it is negatively associated with secondary
enrollment (statistically insignificantly) and attendance (statistically significantly). This finding
corroborates previous qualitative evidence by IGN (2011) indicating that among comparable
CCT programs there are little differences between effects reported by experimental and
observational evaluations.
Finally, we find some evidence indicative of publication bias and selective reporting.
Published papers report larger effects for secondary enrollment and attendance. We find large
heterogeneity in the number of effect estimates that each reference reports, with the median
reference reporting between six and eleven effect estimates depending on the outcome and some
references reporting more than twenty effect estimates. With the exception of primary
enrollment estimates, funnel plots for all other outcomes and corresponding linear regression
(Egger) tests also suggest asymmetry in reported effects.
We conclude that CCT programs are more effective in contexts in which initial enrollment
and attendance conditions are relatively poor and for that reason, particularly effective in
improving secondary schooling outcomes. When offered to primary school students, offering a
more generous transfer amount and coupling transfers with additional resources such as
infrastructure, textbook or teachers is associated with larger program effects. The relative

6
effectiveness of CCTs for secondary schooling outcomes and additional costs related to transfer
generosity and supply-side resources suggest that under tight budgetary conditions, targeting
CCT investments to secondary level pupils is one simple way improve program cost-
effectiveness.
In terms of design, we conclude that programs that impose conditions on school achievement
such as not failing grades and that pay transfers less frequently are more effective than programs
that simply condition on attendance. Methodologically we conclude by i) highlighting the
similarities in effect sizes reported by experimental and observational evaluations, yielding
credence to recent developments in the econometrics of program evaluation literature (see for
example, Imbens and Wooldridge, 2009) and ii) advocating – as Duflo, Glennerster and Kremer
(2007) do for randomized evaluations in development economics – for the importance of setting
clear reporting standards for CCT impact evaluations given the popularity of these programs
worldwide.
II. Literature Search
We search published and gray literature to find all available studies that report estimates of
the impact of CCT programs on school enrollment, school attendance and/or school dropout.
We carried out the literature search in the spring of 2010. To minimize exclusion errors we
began by searching for “conditional cash transfer” or “conditional cash transfers” in reference
titles, abstracts or keywords in the following electronic databases: African Healthline, CAB
Direct, Database of Abstracts of Reviews of Effectiveness, EBSCO, EconLit, Effective Practice
and Organization of Care Group (EPOC), Eldis, British Library for Development Studies
(BLDS), EMBASE, FRANCIS, Google Scholar, Healthcare Management Information
Consortium, ID21, International Bibliography of the Social Sciences (IBSS), Internet Documents
in Economics Access Service (Research Papers in Economics- IDEAS[Repec]), Inter-Science,
Latin American and Caribbean Health Sciences Literature (LILACS), MEDCARIB, Medline,
Pan American Health Organization (PAHO), POPLINE, ProQuest, Scielo, ScienceDirect, Social
Science Research Network (SSRN), The Cochrane Central Register of Controlled Trials, Virtual
7
Library in Health (ADOLEC), WHOLIS (World Health, Organization Library Database) and
World Bank.1
We retrieved all references in English or Spanish language regardless of geographic focus.
We limited our search to published and unpublished studies, including refereed and non-refereed
journals, working papers, conference proceedings, book chapters, dissertations, government
reports, non-governmental reports and other technical reports. We did not include published
comments, op-eds, summaries or media briefings.
To confirm that we had not left out studies, we cross-validated the initial literature search
with the reference lists of Fiszbein et al.’s (2009) CCT review book and Milazzo’s (2009)
annotated bibliography on CCT programs. If we found a new reference from these two sources,
we included it as long as it met the language and publication type restrictions above. This initial
search procedure yielded 2,921 references, of which 1,341 were duplicate references (i.e.
identical references) retrieved from more than one search engine (Table 1).
In the second stage, we asked two research assistants to independently flag studies that in the
title, abstract (or introduction if no abstract was available) contained any of the following words:
education, school, schools, enrollment, attendance, achievement, attainment, test-scores / test
scores, drop-out/dropout/drop out, graduation, persistence, performance, retention, advancement,
fail/ failing, pass/passing. The two principal investigators resolved any arising discrepancies
from this process. With this filter we eliminated 342 references, keeping 1,248 for additional
screening.
In the third stage, the two principal investigators independently read the abstract,
introduction, methodological sections and tables of these 1,248 remaining and only retained
references that met the following criteria:
1. Intervention specification: Reference must report CCT program effects on school
enrollment, attendance or dropout. We understand CCT programs to be programs that
provide monetary (i.e. not in kind) transfers to participant households in exchange of
1 The complete list of search dates and articles retrieved from each database is available upon request.

8
compliance with program requirements (i.e. not unconditional), which may include health
visits and school enrollment/attendance.
2. Outcome variables: Reference must report at least one impact and its associated standard
error or t-statistic on school enrollment, attendance or dropout.
3. Geographic focus: Study must report impacts on a CCT implemented in a developing
country (i.e. studies from the United States are excluded).
4. Research design: Study must use a treatment-comparison research design. The
comparison group can be wait-list, or no treatment. One group pre-post designs are not
eligible. Non-randomized studies are eligible only if they report relevant pre-treatment
characteristics of treatment and comparison groups.
Inconsistencies – the bulk of which were errors on inclusion rather than exclusion – between the
two researchers were then discussed and resolved by looking at the details of the manuscripts.
We retained from this filter 48 references, 6 of which were an older version of a retained
reference. Our sample of analysis therefore comprises 42 references, and closely matches the
sample of CCT references in IGN (2011). Appendix Table A provides details of the references
in the final analysis sample.
III. Coding of References in Analysis Sample
We created a coding protocol (available upon request) to capture in a hierarchical structure
(i.e. effects in references, references in programs) the following information:
Program descriptors
Program targeting (both geographic and household targeting criteria); type of assignment to
conditions (simple random assignment, random assignment after matching, stratification or
blocking, nonrandom assignment); nature of the control group (whether the control group
receives nothing from program or is on a waiting list); schooling conditionality (whether
schooling conditionality is based on school enrollment, school attendance, grade promotion
and/or other); school attendance conditionality (minimum school attendance required for
schooling subsidy receipt); health conditionality (children attendance to regular health visits,
children immunizations up to date, health visits for pregnant and breastfeeding women, mother’s
attendance to health education workshops or other); whether or not there is verification of school

9
attendance and health conditions; member of the household that receives the subsidy (child,
mother, father or both parents); amount of schooling and health subsidies (both in US dollars
and/or domestic currency); frequency of payment of both schooling and health subsidies;
whether the subsidy amounts vary by gender, grade, age or other characteristic. We also
collected data on whether or not the program provides supply incentives for education and
health.
Reference descriptors
Type of publication (journal article, book chapter, book, working paper, thesis or doctoral
dissertation, conference paper/proceeding, government report, or technical report); publication
year; country and language (English or Spanish); source of data; sample sizes at baseline and
follow-up of both treatment and control groups; attrition rates for both treatment and control
groups; whether or not baseline data were collected before households began receiving benefits;
whether or not there is balance between treatment and control groups in all reported baseline
characteristics.
Effects
Effect for school enrollment, school attendance and school drop-out, separately for primary
and secondary schooling, unless effect sizes are reported for primary and secondary overall. For
each outcome, we extracted information on mean and standard deviation at baseline, effect size
(value, methodology of estimation, subgroup and sample size), standard error or t-statistic of the
estimated effect, and time where the effect is measured.
We coded references as follows. Two trained research assistants (A and B) independently
coded 17 of the 42 references in the sample using separate paper versions of the coding protocol.
During this coding stage, coders where allowed to talk to each other and PIs to resolve questions.
For the remaining 25 references, the principal investigators randomized the order in which to
code them and coders where not allowed to talk to each other. We then randomly assigned
research assistants C and D to separately input in Excel the 42 protocols of either assistant A or
B.
With two separate versions of sample descriptors and effects information, we estimated
various inter-rater reliabilities (IRR) for program-, reference- and effect-level variables, defined
as the percent of coincidences over the total number of variables in the set. Reassuringly, we
computed IRR’s of 84.8% for program-level variables, 89.5% for reference-level variables,

10
91.3% for enrollment effect sizes, 87.4% for attendance effect sizes and 96.9% for dropout effect
sizes.
A principal investigator with the help of research assistant C, referred to the
corresponding reference document for variables with detected inconsistencies and retrieved the
correct response. Once we solved discrepancies one a case-by-case basis, we created a unified
dataset for analysis.
IV. Sample Description
Programs in Sample
Table 2 presents a summary of CCT programs in our analysis sample. Our sample contains
42 references reporting effects for 19 programs in 15 countries. Sixty-three percent of programs
(12 of them) are from Latin America, 32% are from Asian (6) and one is from Africa.
Table 2 demonstrates the degree of heterogeneity in program characteristics. For example,
68% of programs condition transfer-receipt on school attendance – which is typically 80% or
more of the schooling reference period, while 32% impose additional conditions on school
achievement such as grade promotion or school achievement as a requirement. In most
programs, school officials verify student attendance.
There is also variation in payment frequency and whether transfer amounts vary for different
target groups. Fifty two percent of programs pay educational transfers on a monthly basis and
over forty percent pay transfers less frequently, either bi-monthly, quarterly or bi-annually. In
almost 60% of programs all children regardless of age, grade or gender are entitled to the same
transfer amount. In 30% of programs, however, transfers for girls differ from boys’ or transfer
amounts vary by grade or age.
We were interested in exploring the association between transfer amount and effect sizes,
motivated by the finding in Filmer and Schady (2009) for Cambodia suggesting non-increasing
returns to transfer amounts. To do so across countries, we opted to construct measures of
monthly-equivalent average transfer amounts relative to PPP-adjusted GDP per capita.2 This
2 Another alternative would have been to use the transfer amount as a fraction of total household expenditures in the sample. Very few references reported expenditures, which is why we opted for transfer as a fraction of PPP-adjusted GDP per capita.

11
measure of transfer amount displays considerable variation across programs and across schooling
levels. In the typical program, monthly schooling transfers for primary are 2.3% of PPP-adjusted
GDP per capita, and the standard deviation is 2 percentage points. For secondary school,
average transfer amount is 4% of PPP-adjusted-GDP per capita.
In over 70% of CCT programs, the demand-side transfer is unaccompanied by any sort of
supply side intervention. In over 20% of programs in the sample, however, schools receive some
form of support ranging from grants to infrastructure construction to textbook and other school
inputs.
In most programs, assignment to treatment is not random and beneficiaries are usually
selected using a variety of means tests. In 30% of programs, on the other hand, beneficiaries are
selected randomly, most commonly after screening on the basis of geography or poverty. In close
to 80% of programs the control group receives nothing, and in close to 20% controls are wait-
listed.
Reference Characteristics
Table 3 shows reference-level characteristics of references in our analysis sample. Over fifty
percent of references are working papers, less than 25% are journal articles and the remaining
25% are either government or technical reports and unpublished manuscripts/dissertations.
Seventy six percent of references in our sample use program survey data to estimate program
impacts, and the remaining use either census or household survey data or other data sources.
Sixty-seven percent of references in our analysis sample report effects on enrollment,
primary, secondary or both. Forty-five percent report effects on attendance and 21% report
effects on school dropout. (Some references report effects on more than one type of outcome.)
We provide extensive details of each program and reference in our sample in Appendix Tables A
and B, respectively.
Figure 1 shows the distribution of number of effects that each paper reports, separately by
outcome and school level. For all outcomes and all levels, there is considerable heterogeneity in
effect reporting, and all distributions have a long right tail. For primary enrollment, for example,
conditional on reporting for the outcome, the median paper reports six effects, but the average
12
reports ten, because four paper report 20 or more effects (different subgroups by age, grade,
location or methodology). For secondary enrollment, the distribution is more symmetric
conditional on reporting effects for this outcome: the median paper reports eleven effects and the
average reports twelve, with four papers reporting more than twenty effects. For attendance,
distributions of reported effects are fairly symmetrical, conditional on reporting. Conditional on
reporting primary attendance outcomes, the median reference reports eight effects and the
average nine, with two references reporting twenty-four or more effects. Conditional on
reporting secondary attendance effects, median and mean number of reported effects is seven,
with one reference reporting twenty-four effects. For primary dropout, conditional on reporting,
the median paper reports six effects and the mean reports eight effects. One reference reports
twenty-two primary dropout effects. Conditional on reporting secondary dropout effects, the
median reference reports three effects, the mean reference reports five and one reference reports
eighteen effects.
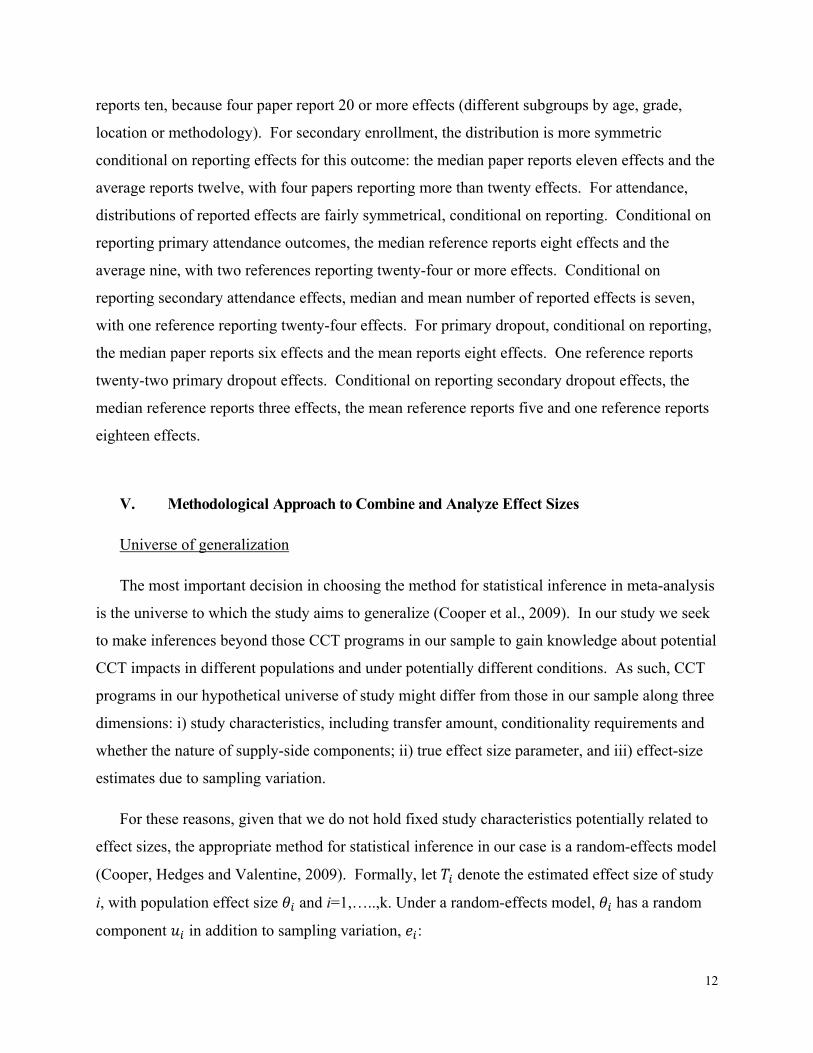
V. Methodological Approach to Combine and Analyze Effect Sizes
Universe of generalization
The most important decision in choosing the method for statistical inference in meta-analysis
is the universe to which the study aims to generalize (Cooper et al., 2009). In our study we seek
to make inferences beyond those CCT programs in our sample to gain knowledge about potential
CCT impacts in different populations and under potentially different conditions. As such, CCT
programs in our hypothetical universe of study might differ from those in our sample along three
dimensions: i) study characteristics, including transfer amount, conditionality requirements and
whether the nature of supply-side components; ii) true effect size parameter, and iii) effect-size
estimates due to sampling variation.
For these reasons, given that we do not hold fixed study characteristics potentially related to
effect sizes, the appropriate method for statistical inference in our case is a random-effects model
(Cooper, Hedges and Valentine, 2009). Formally, let denote the estimated effect size of study
i, with population effect size and i=1,…..,k. Under a random-effects model, has a random
component in addition to sampling variation, :

13
(1)
The variability of – ∗ – stems from variability arising from sampling variation and
variation of around its population mean . In a fixed effects model 0.
∗ (2)
Estimating effect sizes
All educational outcome measures we focus on are dichotomous: enrollment, attendance and
dropout. Estimates of in our study are therefore either the post-treatment difference in the
corresponding probability between treatment and comparison groups, , or a double
difference (treatment v. control, before v. after).
Treatment-control contrasts are a natural measure in our context, and the way in which
almost all references report program effects.3 One potential concern with using mean contrasts to
estimate average effect sizes with equations (1) and (2) is that mean contrasts tend to overstate
-- the amount of heterogeneity arising from variation in effect sizes – in the sample because
the possible values of the contrast when the group means are close to 0.5 is larger than those
when the means are close to 0 or 1 (Fleiss and Berlin, 2009). The upward bias in ̂ from using
mean contrasts is empirically is inconsequential. For primary schooling, for example, baseline
enrollment levels are quite similar across references in the sample, ranging from 71% to 98%.
For secondary schooling, the range is larger, from 24% to 97%. Our heterogeneity estimate
is, however, only slightly larger for secondary than for primary enrollment effect sizes.
Combining estimates of effect sizes
We pursue two approaches to combine effects sizes. We apply both approaches to estimate
average effect sizes separately for each outcome and schooling level. In the first approach, we
combine all of a reference effects in one reference-level average effect under a fixed-effects
3 The only exceptions are Davis et al. (2002) which reports probit coefficients that we convert to (approximate) marginal effects by dividing the probit coefficient by 2.5 (Wooldridge, 2005), and Raymond and Sadoulet (2003) that report hazard ratios for dropout that we convert to percentage points using baseline hazards for each grade.
14
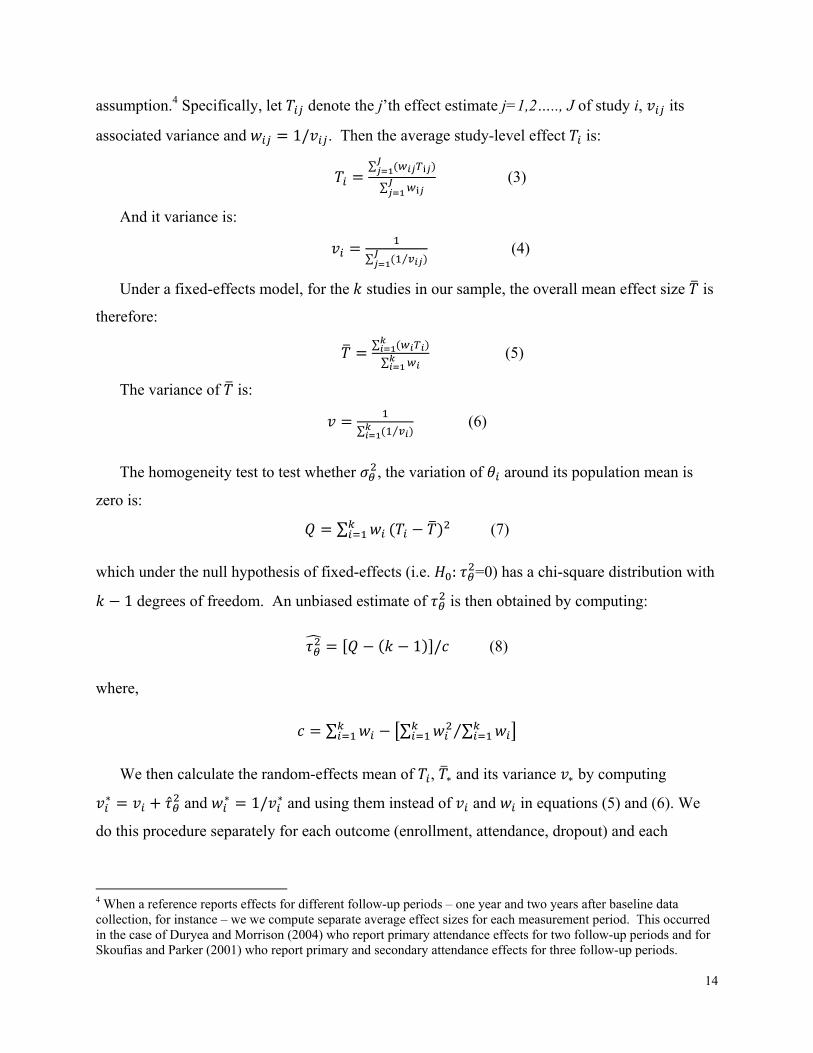
assumption.4 Specifically, let denote the j’th effect estimate j=1,2….., J of study i, its
associated variance and 1/ . Then the average study-level effect is:
∑
∑ (3)
And it variance is:
∑ ⁄ (4)
Under a fixed-effects model, for the studies in our sample, the overall mean effect size is
therefore:
∑
∑ (5)
The variance of is:
∑ ⁄ (6)
The homogeneity test to test whether , the variation of around its population mean is
zero is:
∑ (7)
which under the null hypothesis of fixed-effects (i.e. : =0) has a chi-square distribution with
1 degrees of freedom. An unbiased estimate of is then obtained by computing:
1 / (8)
where,
∑ ∑ ∑⁄
We then calculate the random-effects mean of , ∗ and its variance ∗ by computing ∗ ̂ and ∗ 1/ ∗ and using them instead of and in equations (5) and (6). We
do this procedure separately for each outcome (enrollment, attendance, dropout) and each
4 When a reference reports effects for different follow-up periods – one year and two years after baseline data collection, for instance – we we compute separate average effect sizes for each measurement period. This occurred in the case of Duryea and Morrison (2004) who report primary attendance effects for two follow-up periods and for Skoufias and Parker (2001) who report primary and secondary attendance effects for three follow-up periods.

15
schooling level (primary and secondary). We estimate (5) and (6) using Restricted Maximum
Likelihood and Method of Moments estimators.
In the second approach to estimate overall average effect sizes for each outcome and school
level, we take all estimates from all papers and combine them directly in a random effects model.
The second approach is useful for two reasons. The second approach allows us to test the
sensitivity of the average effect size estimate to the fixed effects assumption. Although the
fixed-effects assumption is arguably justified in our context by the fact that all effects in a given
study correspond to the same underlying population and thus share the same institutional
characteristics, it is important to test how it affects our estimates.
The second approach of directly combining all effect sizes in a random effects model also
allows us to test for selective reporting using funnel plots and Egger linear regression tests that
we explain in detail in the “analyzing effect sizes” section of the methodology, below.
Dealing with hierarchical dependence of effects
The effect size estimates in our application are not necessarily independent from each other
because the random effects in our sample of studies are clustered. The clustered structure of the
random effects arises from the nesting of more than one reference within a program, sharing the
same program characteristics. We deal with this type of hierarchical dependence following the
methods of Hedges, Tipton and Johnson (2010).
Specifically, we assume that our sample of ⋯ effect sizes is obtained by
sampling m clusters of estimates (e.g. programs) and then sampling 1 estimates within the
lth cluster. The vector of true effect sizes may depend on a set of p=1,…,P <m covariates with
a vector of associated coefficients , … . , ′, so that:
(9)
Because random effects from the same cluster are correlated, the covariance matrix of is a
block-diagonal matrix of non-diagonal matrices:
Σ Σ ,… , Σ (10)
Each cluster-specific covariance matrix l has a between-clusters variance component and a
between-studies-within-cluster variance component :

16
Σ (11)
with a identity matrix, a matrix of 1’s and a diagonal matrix with
the error variance for each of the studies in cluster l. Note that the covariance structure need
not be known a priori. Hedges, Tipton and Johnson (2010) propose to estimate and via
method of moments and to use and ̂ to compute efficient weights for study i as follows:
(12)
Allowing for the hierarchical structure, we then compute the overall random-effects mean
effect size as:
∑ ∑
∑ ∑ (13)
with robust variance given by (8): ∑
∑ (14)
where is the unweighted mean of the estimates in the lth cluster, is the total weight given
to estimates in cluster l, and is the estimate of the overall mean from (13).
Analyzing effect sizes
To explore how study characteristics explain variability in effect sizes, we estimate bivariate
random effects and robust (hierarchical) random-effects models in which the dependent variable
is an effect (one per paper or all effects directly) and the explanatory variable is a program or
reference characteristic, for instance, subsidy amount or whether the reference is published. We
focus on bivariate associations because as we show in the following section, many program
characteristics are highly collinear with each other and we have no a priori reason to include
some of them and not others.
We employ two techniques to assess the extent to which publication bias and selective
reporting are issues of potential concern in the CCT evaluation literature: funnel plots and Egger
linear regression tests. The first is funnel plots in which we plot each impact estimate against the
sample size used to calculate it. The intuition behind this test is straightforward. When sample
sizes are small, there is likely a lot of variation in estimated effects around the overall (random

17
effects) average effect size. As sample sizes increase, estimates on both sides of the overall
effect will gradually converge to the overall effect, rendering a funnel-shaped plot of effect
estimates. In the absence of publication bias and selective reporting, the funnel plot should look
symmetrical and the number of effects should be evenly distributed around the overall effect
(Sutton, 2009). The suppression of some effects that is associated with publication bias and
selective reporting results in the plot being asymmetrical, with patchy spots of “missing effects.”
Egger linear regression tests are a statistical formalization of the intuition behind funnel
plots. In Egger tests, we regress standardized effect sizes against the reciprocal of the standard
errors and a constant term. The constant provides a measure of asymmetry and thus we can test
the null hypothesis of no asymmetry using a standard t-test on the constant term. None of these
tests are “magic bullets,” however. The funnel plot might be asymmetric if, for example, smaller
studies take place under less rigorous conditions. Similarly, Egger’s regression analysis has
inflated type I errors in meta-analyses with dichotomous outcome variables. Moreover,
asymmetry might be due to heterogeneity in effect sizes. For these reasons, we take the results
from these tests as suggestive, not conclusive (Sutton, 2009.)
VI. Results
School Enrollment Average Effect Sizes
Figures 2 and 3 show the forest plots (distribution) of average effect sizes from all studies
reporting enrollment effects on primary and secondary school, respectively. In all forest plot
figures we report the average effect size per reference, combining all estimates into one using a
fixed-effects model. In Table 4 we report primary and secondary average effect sizes both using
one effect per reference and all effects directly.
We highlight three aspects of Figure 2. First, the overall random-effects average primary
enrollment effect size is 5.1 percentage points, with a 95% confidence interval between 3.7 and
6.6 percentage points. Relative to the mean baseline primary enrollment of 84%, the average
effect size represents a 6 percent enrollment increase. Second, with the exception of one
reference reporting effects from the SRMP CCT program in Turkey, all reference-level average
effects are positive and most are statistically distinguishable from zero. Third, there is ample

18
variation in estimated effects across references, although most of it is across programs rather
than within-program and across references. Reference-level effect sizes for Nicaragua’s Red de
Protección Social are an exception, however, ranging from close to 8 to 29 percentage points,
and statistically positive. For Colombia’s Familias en Acción and Brazil’s Bolsa Escola,
reference-level effects are, on the other hand, consistently small and generally statistically
positive.
Panel A of Table 4 shows primary enrollment average effect size estimates under different
modeling choices. Importantly, average effect size estimates are very similar – between 5 and
seven percentage points – whether we use one estimate per reference or all estimates, validating
the fixed-effects methodology to compute a reference-level. Allowing for clustering of effects
within program increases slightly the estimated standard error of the average effect size. Method
of moments random-effects estimates – whether or not they account for clustering of estimates
within programs – are more stable than Restricted Maximum Likelihood estimates. Under all
model choices, we strongly reject the null hypothesis that the between-study variance component
is zero and estimate that a very large share of variation in effect sizes, close to 90% or more,
is due to “true” heterogeneity rather than sampling variation.
In the final column of Panel A of Table 4 we also include estimates of the within-program
variance component, when we estimate the random-effects model allowing for arbitrary
clustering of effects within program. Consistent with the visual evidence of Figure 2, this
variance component is negligible, supporting the hypothesis that most of the variation in effect
sizes is across rather than within program.
Figure 5 displays the forest plot of secondary enrollment average effect sizes, with one effect
per reference that we estimate under a fixed-effects model. The average secondary enrollment
effect is remarkably similar in percentage points to that of primary enrollment – 6 percentage
points – although as a fraction of baseline enrollment it is notably larger, representing a 10-
percent secondary enrollment increase.
The conclusion that CCT programs are more effective at increasing secondary than at
increasing primary enrollment resonates with previous CCT review findings in Fiszbein et al.
(2009). Like the primary enrollment forest plot, the secondary enrollment plot displays

19
considerable effect-size variation, most of which is across CCT programs. While some CCT
programs such as Ecuador’s Bono de Desarrollo Humano show modest secondary enrollment
improvements – around two percentage points – others like Cambodia’s JFPR Scholarship and
CESSP programs report average secondary enrollment impacts of close to twenty percentage
points.
Panel B of Table 4 validates the main forest plot conclusions under different modeling
assumptions. Estimates using one effect per reference or all effects are very comparable ranging
between five and six percentage points. This result yields additional support to the fixed-effects
assumption in combining multiple estimates from a single reference. For secondary enrollment
we strongly reject the null hypothesis that variation is effect sizes is entirely attributed to
sampling error and also estimate that most of this variation stems from variation across programs
(in than within programs across references (in ).
School Attendance Average Effect Sizes
Figure 4 displays the primary attendance effect size distribution (one effect per paper).
Fewer references report primary attendance effects relative to those reporting primary
enrollment. The average random-effects primary attendance effect is 2.5 percentage points –
which off of a baseline attendance of 80% represents a three percent attendance effect – and is
statistically significantly different from zero. A clear outlier is Nicaragua’s Red de Proteccion
Social, with reported average attendance effect of thirteen percentage points. For this program,
as we noted earlier, primary enrollment effects are also notoriously large. With the exception of
Uruguay’s Ingreso Ciudadano, all primary attendance reference-level effects are positive and the
majority statistically different from zero.
In Panel A of Table 5 we validate primary attendance effect estimates to modeling choices
and conclude that the main reference-level random-effects estimate is robust to estimation
methodology, and to the fixed-effects assumption since average effect sizes are quite similar
whether we use one or all estimates per reference. In all cases, the average CCT primary
attendance effect is positive and statistically different from zero and as is the case for enrollment,
we: i) reject that variation in effect sizes is simply due to sampling variation and ii) most of this
variation stems from between rather than within program across study sources.

20
Figure 5 displays the secondary attendance forest plot with one effect per reference computed
using a fixed effects model. The CCT average secondary attendance effect is 8 percentage
points. This effect represents a 12% increase in attendance relative to the average baseline
secondary attendance level of 68%.
Figure 5 indicates that there is considerable heterogeneity in secondary attendance effects
across programs. At one extreme stands Cambodia’s CESSP with average secondary attendance
effect sizes of twenty to thirty percentage points. (This program’s evaluation also reports
notoriously high secondary enrollment effects.) At the other extreme we find Malawi’s CCT
program with average secondary attendance effect sizes that although positive and statistically
significant are small – close to half of a percentage point.
Panel B of Table 5 shows average secondary attendance effect sizes under different modeling
choices; these results indicate that estimates of average secondary attendance effects are robust
to modeling strategies including the fixed-effects assumption for combining reference estimates
and whether or not we account for the hierarchical (clustering) structure of effects, which yields
slightly larger standard errors for the average effect size. We strongly reject the null hypothesis
that variation is effect sizes is simply sampling variation, and attribute more than ninety percent
of variation to effect heterogeneity. As before, we conclude that the bulk of the heterogeneity is
across programs as the estimate for in the last column is negligible relative to the estimate of
between-program heterogeneity.
School Dropout Average Effect Sizes
Compared to enrollment and attendance, few CCT references report dropout effects: nine for
primary and six for secondary. This relatively low number of references reflects on the
uncertainty with which we calculate average effects.
Figure 6 shows primary dropout’s forest plot. The overall average dropout effect size for
primary is negative one percentage point and statistically different from zero, although the 95%
confidence interval is relatively wide. Nicaragua’s Red de Proteccion Social and Brazil’s Bolsa
Escola have the largest effects on dropout reduction, while the evaluation of Ecuador’s Bono de
Desarrollo Humano suggests, if any, increases in dropout as a consequence of program
participation.

21
Unlike enrollment and attendance, only two papers report baseline dropout rates so we opted
for not reporting an average to avoid potential issues of sample selection in converting effect
sizes to relative magnitudes. Average effect sizes are similar across different model
specifications – ranging from negative one to negative two percentage point reductions – and are
all distinguishable from zero, as Panel A of Table 6 suggests. Most of the variation in effect
sizes is due to heterogeneity across programs.
The average secondary dropout effect of negative four percentage points is three times larger
(in percentage points) than that for primary dropout, as Figure 7 indicates. Although we estimate
the average secondary dropout effect with a high degree of uncertainty due to the fact that only
six references report effects for this outcome, we still reject the null hypothesis that CCT
programs do not affect secondary dropout outcomes. All reported secondary dropout effects are
negative and statistically different from zero and those from Brazil’s Bolsa Escola and Mexico’s
Progresa stand out as the largest effects in secondary dropout reduction, close to eight
percentage points. Average effect size estimates for secondary dropout for Progresa, however,
differ drastically across references.
In Panel B of Table 6 we estimate the overall secondary dropout effect size and conclude that
the estimate is insensitive to model choices. All estimates of the overall dropout effect size are
between negative three and four percentage points and all are statistically different from zero.
Moreover, we strongly reject the hypothesis that variation in effect sizes is due to sampling
variation and estimate that the majority of such variation is due to heterogeneity across
programs.
Meta-regression results
Before we analyze the relationship between effect size estimates and mediator characteristics
such as subsidy amount or frequency of payment, we report in Table 7 pairwise correlations
between these possible mediators of effect size heterogeneity.
As Table 7 indicates, some program characteristics are highly correlated with each other.
Not surprisingly, for example, the correlation between primary and secondary subsidy amounts is
0.89, suggesting that programs that provide generous transfers for primary schooling are also
generous for secondary schooling. Similarly, there is a strong and negative correlation (-0.55)

22
between paying transfers monthly (as opposed to less frequently) and whether the program
conditions transfer on achievement in addition to attendance.
CCT programs that pay transfers to the mother of the household are programs that also vary
subsidy amounts by grade or age. Latin American CCT programs rarely condition transfers on
achievement as suggested by the strong negative correlation between these two attributes (-0.65).
Interestingly, programs in which control-group units are on a waitlist to receive benefits in the
future (as opposed to receiving nothing) are also programs that provide supply-side supplements
such as grants to schools, infrastructure or teaching materials (correlation is 0.68).
Due to the high degree of collinearity between program characteristics, we pursue a bivariate
meta-regression approach to analyzing effect sizes. We only pursue a meta-regression analysis
for enrollment and attendance outcomes. We do not analyze in a meta-regression framework
dropout effect size due to the small number of studies reporting effects for this outcome. Tables
8 through 11 reports bivariate correlations between effect sizes and effect mediators that we
classify as program (e.g. subsidy amount), reference (e.g published) or contextual (e.g. Latin
American) characteristics. For all outcomes we report results using, as before, variations of
random-effects models including using the fixed-effect reference-level effect size or all effect
sizes and accounting for the hierarchical dependence of effect sizes within programs.
Table 8 reports meta-regression results for primary enrollment effect sizes. Conditioning
transfer receipt on achievement is not associated enrollment effect sizes. Primary enrollment
effect sizes are significantly larger in programs with more generous transfer amounts. Primary
enrollment effect sizes are larger in programs in which transfers are paid less periodically than
monthly (statistically significant in specifications that use all estimates). Primary enrollment
effect sizes are larger in programs that provide supplement school services with grants,
infrastructure or other inputs. If elementary schools are operating at nearly-full capacity, as
baseline enrollment rates indicates, it is not surprising that expanding supply might be a pre-
condition to increase enrollment.
Programs that target beneficiaries geographically by using community-level proxy means
tests have larger primary enrollment effects that non-targeted ones; the difference is statistically
significant in specifications using all estimates from all references. The magnitude of the

23
association, however, is comparable to that of specifications using the fixed-effects average per
reference, suggesting that the latter approach might be slightly underpowered for this particular
targeting mediator.
Programs in which control group members are placed in a waitlist to receive benefits in the
future – as opposed to receiving nothing from the program – shows more positive effects, and the
difference is statistically significant. For the case of primary school enrollment at least, this
results challenges previous evidence indicating that anticipation bias – the change in behavior
among control group members in anticipation of future benefit receipt – might lead to
underestimating program effects (Attanasio et al., 2010).
Programs that select participants at random from a pool of eligible households display
slightly larger primary enrollment effects, although differences in effect sizes with non-random
assignment programs are insignificant and fairly small in magnitude in specifications that
employ all estimates. Reference and contextual characteristics, such as whether the paper is
published or whether the program is Latin American do not show systematic associations with
primary enrollment effect sizes.
Table 9 shows meta-regression results for secondary enrollment. Programs that in addition to
the usual attendance conditions also condition transfers on achievement (e.g. not failing a grade)
are more effective at increasing secondary enrollment than programs that just condition on
attendance. As is the case with primary enrollment, secondary enrollment effect sizes are larger
in programs that provide more generous educational transfers, and the association is statistically
significant in specifications that include all estimates.
Secondary enrollment effect sizes are smaller in programs that give the subsidy to the mother
only and that vary subsidy amounts by grade or age. For secondary schooling we find no
difference in effect sizes between programs that select beneficiaries at random and those that do
not. In contrast with results for primary schooling, secondary effect sizes are smaller in
programs that place control group units in a wait list. This result suggests that anticipation bias
might be more of a concern, for the secondary enrollment margin.
Secondary enrollment effects are larger in published references. At the same time, effect
sizes are negatively associated with the number of effects that a reference reports: papers that

24
report more effects tend to report smaller effects, on average. Latin American programs are less
effective than the rest at increasing secondary enrollment. Consistent with the forest plot
evidence, Cambodian programs are highly effective at increasing secondary enrollment.
For primary attendance effect sizes, we the pattern of associations is less clear, in part
because for this outcome our meta-analysis might be underpowered: only ten references in our
sample report primary attendance effects (Table 10). As is the case with primary enrollment,
however, we find some supporting evidence that programs in which transfers are paid less
frequently than monthly also exhibit larger effect sizes. Similarly, primary attendance effect
sizes are larger in contexts with lower baseline attendance levels (association is statistically
significant).
Table 10 shows meta-regression results of secondary attendance average effect sizes. As is
the case with secondary enrollment, conditioning transfer receipt on achievement is associated
with larger secondary attendance effect sizes. Providing subsidies on a monthly basis (compared
to less frequent) is associated with smaller effect sizes for both enrollment and attendance (in
secondary). As is also the case with secondary enrollment effect sizes, secondary attendance
effects are smaller in programs in which only the mother is entitled to receive the transfer.
Programs with random assignment yield larger secondary attendance effects than programs
with non-random assignment of benefits. This result suggests that – at least for secondary
attendance – it is not necessarily the case that effects are downward biased (relative to estimates
based on random assignment) due to potential negative selection of beneficiaries.
Secondary attendance effects are significantly larger in published impact evaluation results
and effects tend to increase over time. As is the case with secondary enrollment effect sizes,
effects from Latin American CCT programs are smaller than those from programs elsewhere and
the two CCT programs in Cambodia are notoriously effective at increasing secondary
attendance, just as they are as increasing secondary enrollment.
Publication Bias and Selective Reporting
We have already reported some suggestive evidence of publication bias and selective
reporting in CCT impact evaluation reports. For instance, effect sizes for both secondary

25
enrollment and secondary attendance are significantly larger in published references than in
unpublished ones. Similarly, we noted the wide degree of heterogeneity in the number of effects
that references report: median number of reported effects ranges from six to eleven across
outcomes and levels and some references report more than twenty effects.
In this section we report graphical and linear regression results from additional publication
bias and selective reporting tests. We use two tests: funnel plots and linear regression Egger-
type tests. Figures 8 through 13 display funnel plots separately for each outcome. Table 12
reports Egger tests for each outcome and level separately. Effects for primary enrollment do
converge to the overall random effects average effect size, but the density of effects is not
symmetric around the overall mean. Column 1 of Table 12 confirms this asymmetry: we
strongly reject the null hypothesis that the constant is zero. Effects for secondary enrollment are
also converge to the overall mean as sample size increases, but the funnel plot is considerably
more symmetric than that for primary enrollment (Figure 9). Results in column 2 of Table 12
support the symmetry conclusion for secondary enrollment effects, as we cannot reject the null
hypothesis that the constant is different from zero.
Effects for primary attendance converge to the overall mean as sample size increases (Figure
10). The funnel plot is visibly asymmetric, with a large patch of missing effects to the left of the
overall mean. The funnel plot for secondary attendance effect sizes is also visibly asymmetric
(Figure 11). Statistical analysis in columns 3 and 4 of Table 12 reject the hypothesis of funnel
plot symmetry for both of these outcomes.
Figures 12 and 13 display funnel plots for primary and secondary dropout effects. Effects for
both levels tend to converge to the overall effect size as sample size increases, but the are both
visibly asymmetrical, with patches of missing positive effects (for instance, smaller reductions in
dropout than the overall effect size). Results in columns 5 and 6 confirm the visual inspection of
the funnel plots and for the case of primary dropout reject the null hypothesis of funnel plot
symmetry. For secondary dropout, the magnitude of the constant is large (in standard deviation
units) but the test is underpowered due to the small number of effects. Overall we conclude that
for most outcomes – perhaps with the exception of secondary enrollment – there is suggestive
evidence in support of publication bias and/or selective reporting. The heterogeneity in the
number of effects that each paper reports provides additional support to this conjecture.

26
VII. Conclusion
We find that CCT programs appear to be more effective for secondary than for private
schooling. Relative to baseline enrollment, the average effect size for secondary enrollment is
ten percent, while for primary it is six percent relative to baseline enrollment. For attendance
outcomes the difference is even more drastic. Relative to baseline attendance, the average effect
size in primary is about three percent while for secondary is close to twelve percent. We find
that CCTs reduce dropout rates by twice as much in secondary that in primary schooling.
We also find that effect sizes for all outcomes (enrollment, attendance and dropout) in all
levels (primary and secondary) exhibit high degree of heterogeneity. Most of the heterogeneity
stems from variation in effect estimates across programs rather across references of the same
program.
We find that more generous program transfer amounts are positively and significantly
associated with larger primary and secondary enrollment effects which, in particular, previous
single-country evidence from Cambodia suggesting decreasing returns to transfer amount
(Filmer and Schady, 2009a). We find that the frequency of payment (monthly vs. less
frequently) is negatively associated with the size of effects. Programs in which transfer payment
is bi-monthy or quarterly tend to report larger effects than those in which payment is monthly.
Imposing conditions on achievement (such as not failing grades) beyond the standard
attendance conditions is positively associated with larger secondary enrollment and attendance
effects. This finding resonates with recent literature highlighting the importance of incentives in
education (see for example Duflo, Hanna and Ryan, forthcoming; Bettinger, Kremer and
Saavedra, 2010; Kremer, Miguel and Thornton, 2009).
Consistent with previous evidence on country-level CCT impact evaluations (Berhman,
Parker and Todd, 2005), programs that complement cash transfers with supply-side interventions
have statistically larger effects on primary enrollment, but not for secondary enrollment. We

27
hypothesize that this finding is driven by supply constraints being more binding in primary
schooling where baseline enrollment levels are already quite high – over 80%.
We find no systematic association between effect sizes and whether benefits were randomly
assigned. While we find that random assignment is positively, although statistically
insignificantly associated with primary enrollment and attendance effect sizes, we also find that
it is negatively associated with secondary enrollment (statistically insignificantly) and attendance
(statistically significantly). This finding corroborates previous qualitative evidence by IGN
(2011) indicating that among comparable CCT programs there are little differences between
effects reported by experimental and observational evaluations.
Finally, we find some evidence indicative of publication bias and selective reporting.
Published papers report larger effects for secondary enrollment and attendance. We find large
heterogeneity in the number of effect estimates that each reference reports, with the median
reference reporting between six and eleven effect estimates depending on the outcome and some
references reporting more than twenty effect estimates. With the exception of primary
enrollment estimates, funnel plots for all other outcomes and corresponding linear regression
(Egger) tests also suggest asymmetry in reported effects.
We conclude that CCT programs are more effective in contexts in which initial enrollment
and attendance conditions are relatively poor and for that reason, particularly effective in
improving secondary schooling outcomes. When offered to primary school students, offering a
more generous transfer amount and coupling transfers with additional resources such as
infrastructure, textbook or teachers is associated with larger program effects. The relative
effectiveness of CCTs for secondary schooling outcomes and additional costs related to transfer
generosity and supply-side resources suggest that under tight budgetary conditions, targeting
CCT investments to secondary level pupils is one simple way improve program cost-
effectiveness.
In terms of design, we conclude that programs that impose conditions on school achievement
such as not failing grades and that pay transfers less frequently are more effective than programs
that simply condition on attendance. Methodologically we highlight the similarities in effect
sizes reported by experimental and observational evaluations. From an impact evaluation policy
28
perspective we advocate for setting clear reporting standards for CCT impact evaluations given
the popularity of these around the world.

29
References Ahmed, A., Gilligan, D., Kudat, A., Colasan, R., Tatlidil, H., & Ozbilgin, B. (2006). “Interim Impact Evaluation of the conditional cash transfers program in Turkey: A Quantitative Assesment”. Washington, D.C.: International Food Policy Research Institute Attanasio, O., Meghir, C., & Santiago, A. (2005). “Education choices in Mexico: using a structural model and a randomised experiment to evaluate Progresa”. Institute for Fiscal Studies Working Paper EWP05/01, London: IFS. Attanasio, O., Fitzsimons, E., Gomez, A., Gutiérrez, M. I., Meghir, C., & Mesnard, A. (2010). Children’s schooling and work in the presence of a conditional cash transfer program in rural Colombia. Economic Development and Cultural Change, 58(2), 181-210. Attanasio, O., & Gómez, L. (2004). “Evaluación del impacto del programa Familias en Acción - Subsidios condicionados de la red de apoyo social”. Bogotá D.C.: National Planning Department. Attanasio, O., Syed, M., & Vera-Hernandez, M. (2004). “Early evaluation of a new nutrition and education programme in Colombia”. Institute for Fiscal Studies Briefing Note No. 44. London: IFS. Ashraf, N., Karlan, D., & Yin, W. (2006). Tying Odysseus to the mast: Evidence from a commitment savings product in the Philippines. The Quarterly Journal of Economics, 121(2): 635-672. Baird, S., McIntosh, C., & Ozler, B. (2009). “Designing cost-effective cash transfer programs to boost schooling among young women in Sub-Saharan Africa”. World Bank Policy Research Working Paper 5090. Washington D.C: World Bank. Baird, S., McIntosh, C., & Ozler, B. (2010). “Cash or condition ? evidence from a randomized cash transfer program”. Policy Research Working Paper 5259. Washington D.C: World Bank. Barrera-Osorio, F., Bertrand, M., Linden, L., & Perez-Calle, F. (2009). “Improving the design of conditional transfer programs: Evidence from a randomized education experiment in Colombia”. Unpublished manuscript. Barrera, F., Bertrand, M., Linden, L. L., & Perez-Calle, F. (2008). Conditional cash transfers in education: Design features, peer and sibling effects. Evidence from a randomized experiment in Colomiba. Policy Research Working Paper 4580. Washington D.C: World Bank. Behrman, J., Gallardo-Garc a, J., Parker, S., Todd, P., & Vélez-Grajales, V. (2005). “How conditional cash transfers impact schooling and working behaviors of children and youth in urban Mexico”. Unplished manuscript.

30
Behrman, J., Parker, S., & Todd, P. (2004). “Medium-Term effects of the Oportunidades Program package, including nutrition, on education of rural children Age 0-8 in 1997”. Technical Document No. 9. Instituto Nacional de Salud Publica (INSP) and the Mellon Foundation/Population Studies Center (PSC)/University of Pennsylvania. Behrman, J., Sengupta, P., & Todd, P. (2005). Progressing through PROGRESA: An impact assessment of a school subsidy experiment in rural Mexico. Economic Development and Cultural Change, 54(1), 237. Bettinger, E., Kremer, M. and Saavedra, J. (2010). “Are Educational Vouchers Only Redistributive? The Economic Journal, vol. 120, no. 546, pp. F204-F228.
Borraz, F., & González, N. (2009). Impact of the Uruguayan conditional cash transfer program. Cuadernos de economía, 46, 243-271. Cameron, L. (2009). Can a public scholarship program successfully reduce school drop-outs in a time of economic crisis? Evidence from Indonesia. Economics of Education Review, 28(3), 308-317. Cardoso, E., & Souza, A. (2004). The impact of cash transfers on child labor and school attendance in Brazil: Department of Economics, Vanderbilt University. CEPAL. (2010). Base de datos de programas de protección social no contributiva en América Latina y el Caribe. http://dds.cepal.org/bdptc/contacto.php Chaudhury, N., & Parajuli, D. (2006). “Conditional cash transfers and female schooling : the impact of the female school stipend program on public school enrollments in Punjab, Pakistan”. Policy Research Working Paper 4102. Washington D.C.: World Bank. Coady, D., & Parker, D. (2002). “A cost-effectiveness analysis of demand- and supply-side education interventions: the case of PROGRESA in Mexico” Discussion Paper 127. Washington D.C: International Food Policy Research Institute. Cooper, H., Hedges, L. & Valentine, J., editors. (2009). Handbook of research synthesis and meta-analysis. New York, NY: Russell Sage. Dammert, A. (2009). Heterogeneous impacts of conditional cash transfers: evidence from Nicaragua. Economic Development and Cultural Change, 58(1), 53-83. Davis, B., Handa, S., Ruiz-Arranz, M., Stampini, M., & Winters, P. (2002). “Conditionality and the impact of programme design on household welfare: Comparing two diverse cash transfer programmes in rural Mexico”. Unpublished manuscript. De Janvry, A., Sadoulet, E., Solomon, P., & Vakis, R. (2006). “Evaluating Brazil’s Bolsa Escola program: Impact on schooling and municipal roles”. Berkeley: University of California at Berkeley.
31
De Souza, P. (2005). “An impact evaluation of the conditional cash transfers to education under PRAF: An experimental approach”. Rio de Janeiro: Fundacao Getulio Vargas. Duflo, E., Glennerster, R. & Kremer, M. (2007). “Using randomization in development economics research: A toolkit.” CEPR Discussion Paper No. 6059. Duflo, E., Hanna, R. & Ryan, S. (forthcoming). “Incentives work: getting teachers to come to school” American Economic Review. Duryea, S., & Morrison, A. (2004). “The effect of conditional transfers on school performance and child labor: Evidence from an ex-post impact evaluation in Costa Rica”. Inter-American Development Bank Working Paper 505. Washington, D.C: IDB. Filmer, D., & Schady, N. (2008). Getting girls into school: Evidence from a scholarship program in Cambodia. Economic Development and Cultural Change, 56(3), 581-617. Filmer, D., & Schady, N. (2009a). “Are There Diminishing Returns to Transfer Size in Conditional Cash Transfers?” Policy Research Working Paper 4999. Washington D.C: World Bank. Filmer, D., & Schady, N. (2009b). “School Enrollment, Selection and Test Scores” Policy Research Working Paper 4998. Washington D.C: World Bank. Fiszbein, A., Schady, N., Ferreira, F., Grosh, M., Kelleher, N., Olinto, P., & Skoufias, E. (2009). Conditional cash transfers:Reducing present and future poverty. Washington D.C.: World Bank. Ford, D. (2007). “Household schooling decisions and conditional cash transfers in rural Nicaragua”. Washington, D.C.: Georgetown University Gitter, S. R., & Barham, B. (2009). Conditional cash transfers, shocks, and school enrolment in Nicaragua. The Journal of Development Studies, 45(10), 1747-1767. Glewwe, P., & Kassouf, A. (2008). “The impact of the Bolsa Escola/Familia conditional cash transfer program on enrollment, grade promotion and drop out rates in Brazil: ANPEC”. Brazilia: Associação Nacional dos Centros de Pósgraduação em Economia [Brazilian Association of Graduate Programs in Economics]. Glewwe, P., & Olinto, P. (2004). “Evaluating the impact of Conditional Cash Transfers on Schooling: An experimental Analysis of Honduras' PRAF Program”. Unpublished manuscript. Hasan, A. (2010). “Gender-targeted conditional cash transfers : enrollment, spillover effects and instructional quality”. Policy Research Working Paper 5257. Washington D.C: World Bank. Hedges, L., Tipton, E. & Johnson, M. (2010). “Robust variance estimation in meta-regression with dependent effect size estimates.” Research Synthesis Methods, 2010-1, 39-65.

32
IEG. (2011). Evidence and lessons learned from impact evaluations on social safety nets. Washington D.C.: Independent Evaluation Group, World Bank. Imbens, G. & Wooldridge, J. (2009). “Recent Developments in the Econometrics of Program Evaluation.” Journal of Economic Literature, Vol 47(1), 5-86. Karlan, D., McConnell, M., Mullainathan, S. & Zinman, J. (2011). Getting to the top of mind: How reminders increase saving. Mimeo, Yale University. Khandker, S., Pitt, M., & Fuwa, N. (2003). “Subsidy to promote girls’ secondary education: The Female Stipend Program in Bangladesh”. Unpublished manuscript. Kremer,M., Miguel, E. & Thornton, R. (2009). “Incentives to Learn.” Review of Economics and Statistics, 91 (3):437-456. Levy, D., & Ohls, J. (2007). Evaluation of Jamaica’s PATH program: final report. Washington D.C.: Mathematica Policy Research. Maluccio, J., Murphy, A., & Regalia, F. (2009). “Does supply matter? Initial supply conditions and the effectiveness of conditional cash transfers for grade progression in Nicaragua”. Middlebury College Economics Discussion Paper 0908. Middlebury: Middlebury College. Maluccio, J. A., & Flores, R. (2005). “Impact Evaluation of a Conditional Cash Transfer Program”. Research Report 141. Washington D.C.: International Food Policy Research Institute. Milazzo, A. (2009). Conditional cash transfers: An annotated bibliography. Retrieved from http://siteresources.worldbank.org/SAFETYNETSANDTRANSFERS/Resources/281945-1131738167860/CCT_Biblio_6Feb2009.pdf Morley, S., & Coady, D. (2003). From Social Assistance to Social Development: Targeted Education Subsidies in Developing Countries. Washington, DC: Center for Global Development - International Food Policy Research Institute. NPD. (2006). Programa Familias en Acción: Condiciones iniciales de los beneficiarios e impactos preliminares. Bogota, D.C.: National Planning Department. Oosterbeek, H., Ponce, J., & Schady, N. (2008). “The impact of cash transfers on school enrollment: evidence from Ecuador”. Policy Research Working Paper 4645. Washington D.C: World Bank. Parker, S., Todd, P., & Wolpin, K. (2006). “Within-family treatment effect estimators: The impact of Oportunidades on schooling in Mexico”. Unpublished manuscript. Ponce, J. (2006). “The impact of conditional cash transfer programs on achievement test scores: An impact evaluation of the "Bono de Desarrollo Humano" of Ecuador”. Working Paper 06/302. Quito: Facultad Latinoamerica de Ciencia Sociales - Sede Ecuador.

33
Rawlings, L. B., & Rubio, G. M. (2005). Evaluating the impact of conditional cash transfer programs. The World Bank Research Observer, 20(1), 29-55. Raymond, M., & Sadoulet, E. (2003). “Educational grants closing the gap in schooling attainment between poor and non-poor”. Unpublished manuscript. Saavedra, J. (in press). “Resource Constraints and Educational Attainment in Developing Countries: Colombia 1945-2005” Journal of Development Economics. Schady, N., & Araujo, M. (2008). Cash transfers, conditions, and school enrollment in Ecuador. Economia, 8(2), 43. Schultz, T. P. (2004). School subsidies for the poor: evaluating the Mexican Progresa poverty program. Journal of Development Economics, 74 199– 250. Skoufias, E., & Parker, S. W. (2001). “Conditional cash transfers and their impact on child work and schooling: Evidence from the PROGRESA Program in Mexico”. International Food Policy Research Institute Discussion Paper 123. Washington D.C: IFPRI. Sparrow, R. (2007). Protecting education for the poor in times of crisis: An evaluation of a scholarship programme in Indonesia. Oxford Bulletin of Economics and Statistics, 69(1), 99-122. Sutton, A. (2009). “Publication bias,” in Cooper, H., Hedges, L. & Valentine, J., (eds.) Handbook of research synthesis and meta-analysis. New York, NY: Russell Sage. The Economist. (2010). “Societies on the move.” The Economist, U.S. edition September 11, 2010. Todd, P., E., Gallardo-Garcia, J., Behram, J. R., & Parker, S. W. (2005). “Impacto de Oportunidades sobre la educación de niños y jóvenes de áreas urbanas después de un año de participación en el programa”. In Hernández-Prado, B & Hernández-Ávlia, M (Eds.), Evaluación externa de impacto del Programa Oportunidades. Mexico D.F. : Instituto Nacional de Salud Pública.

34
Table 1. Reference screening procedure to obtain analysis sample Phase 1 Total references 2,931 Duplicates 1,341 No education-related words in abstract or title 342 Total eligible references phase 1 1,248 Phase 2 Articles that did not meet inclusion criteria Intervention specification (unconditional transfer, scholarships, in-kind transfers) 24 Outcomes variables not related to education 146 Research design does not meet requirements 15 Other topic or type of document (policy briefs, comments, descriptive reports, reviews, etc)
1,015
Total ineligible references 1,200
Phase 3 Old version of an eligible paper 6
Total eligible references 42

35
Table 2. Characteristics of CCT Programs in analysis sample
Freq % n Total number of programs 100 Region a Latin America 12 63.2 Asia 6 31.6 Africa 1 5.3 Education conditionality requirements School attendance only 5 26.3 School enrollment and attendance 8 42.1 Grade promotion or achievement 6 31.6
Minimum school attendance for subsidy receipt b (mean, sd) 82.5 .04 14
Verification of school attendance Yes 9 47.4 No 2 10.5 No information reported 8 42.1 Payment frequency Monthly 10 52.6 Bimonthly 4 21.1 Other 4 21.1 No information reported 1 5.3 Monthly average subsidy amount as a % of PPP- adjusted GDP per capita (mean, sd)
Primary 2.3 2.0 13 Secondary 4.2 4.3 17 School subsidy amount varies by Gender 3 15.8 Grade or age 3 15.8 None 11 57.9 Other c 2 10.5 Supply incentives for education Yes 4 21.1 No 14 73.7 No information 1 5.3 Type of assignment to conditions Random 6 31.5 Non-random 13 68.4 Nature of the control group Receives nothing from program 15 79.0 Wait list, delayed entry 4 21.0
a Programs that have changed their name are counted as different program because in some cases these changes were accompanied with changes in the program (these cases are: Bolsa Familia and Bolsa Escola in Brazil; Progresa and Oportunidades in Mexico; and CESSP and JFPR Scholarship Program in Cambodia. b Percentage of time in school (month, every two months or school year). c Dropout risk (CESSP program in Cambodia) and random (CCT for Schooling program in Malawi)

36
Table 3. Characteristics of references in analysis sample
Total number of references 42 Publication type Journal article 10 23.8 Working paper 22 52.4 Government/technical reports 7 16.7 Unpublished 3 7.1 Source of data Program survey 32 76.2 National household survey 3 7.1 Census data 4 9.5 Other 3 7.1 Reports effects on Enrollment 28 66.7 Attendance 19 45.2 Dropout 9 21.4
See notes to Table 1 for reference screening procedure and Appendix Tables A and B for reference details.
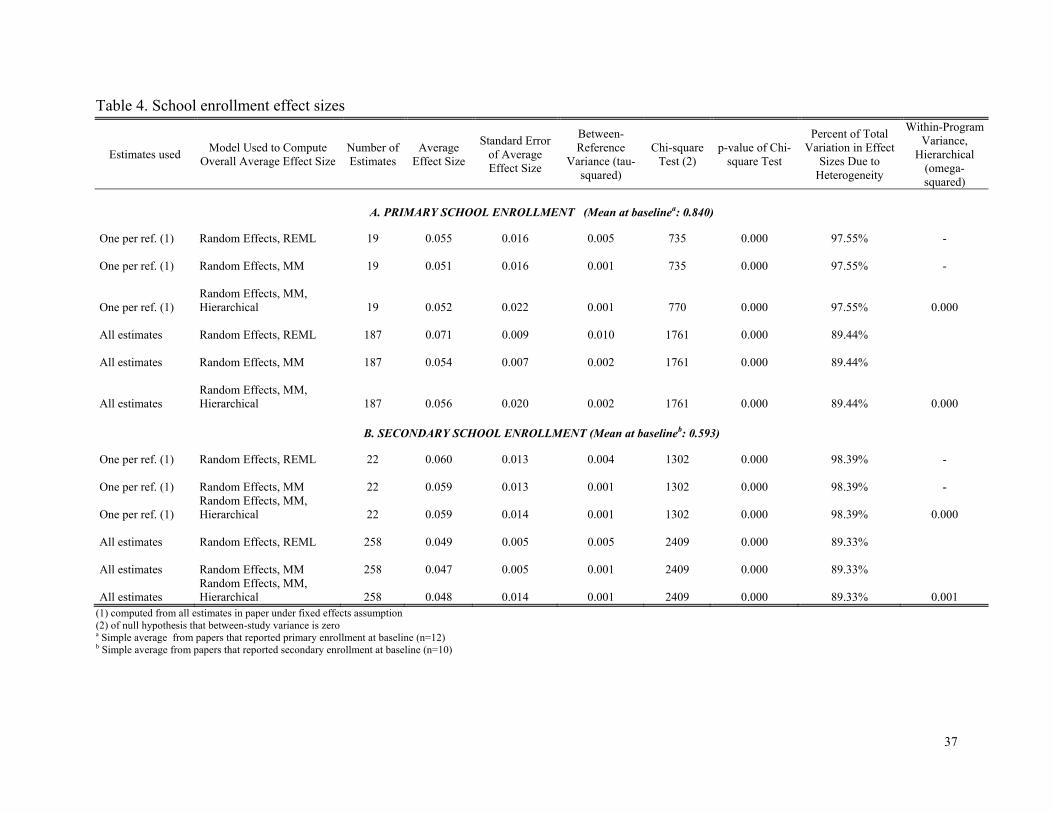
37
Table 4. School enrollment effect sizes
Estimates used Model Used to Compute Overall Average Effect Size
Number of Estimates
Average Effect Size
Standard Error of Average Effect Size
Between-Reference
Variance (tau-squared)
Chi-square Test (2)
p-value of Chi-square Test
Percent of Total Variation in Effect
Sizes Due to Heterogeneity
Within-Program Variance,
Hierarchical (omega-squared)
A. PRIMARY SCHOOL ENROLLMENT (Mean at baselinea: 0.840)
One per ref. (1) Random Effects, REML 19 0.055 0.016 0.005 735 0.000 97.55% - One per ref. (1) Random Effects, MM 19 0.051 0.016 0.001 735 0.000 97.55% -
One per ref. (1)
Random Effects, MM, Hierarchical 19 0.052 0.022 0.001 770 0.000 97.55% 0.000
All estimates Random Effects, REML 187 0.071 0.009 0.010 1761 0.000 89.44% All estimates Random Effects, MM 187 0.054 0.007 0.002 1761 0.000 89.44%
All estimates
Random Effects, MM, Hierarchical 187 0.056 0.020 0.002 1761 0.000 89.44% 0.000
B. SECONDARY SCHOOL ENROLLMENT (Mean at baselineb: 0.593)
One per ref. (1) Random Effects, REML 22 0.060 0.013 0.004 1302 0.000 98.39% - One per ref. (1) Random Effects, MM 22 0.059 0.013 0.001 1302 0.000 98.39% -
One per ref. (1) Random Effects, MM, Hierarchical 22 0.059 0.014 0.001 1302 0.000 98.39% 0.000
All estimates Random Effects, REML 258 0.049 0.005 0.005 2409 0.000 89.33% All estimates Random Effects, MM 258 0.047 0.005 0.001 2409 0.000 89.33%
All estimates Random Effects, MM, Hierarchical 258 0.048 0.014 0.001 2409 0.000 89.33% 0.001
(1) computed from all estimates in paper under fixed effects assumption (2) of null hypothesis that between-study variance is zero a Simple average from papers that reported primary enrollment at baseline (n=12)
b Simple average from papers that reported secondary enrollment at baseline (n=10)

38
Table 5. School attendance effect sizes
Estimates used Model Used to Compute Overall Average Effect Size
Number of Estimates
Average Effect Size
Standard Error of Average Effect Size
Between-Reference
Variance (tau-squared)
Chi-square Test (2)
p-value of Chi-square
Test
Percent of Total Variation in Effect
Sizes Due to Heterogeneity
Within-Program Variance,
Hierarchical (omega-squared)
A. PRIMARY SCHOOL ATTENDANCE (Mean in sample= 0.804)a
One per ref. (1) Random Effects, REML 10 0.029 0.011 0.001 113.4 0.000 92.07% - One per ref. (1) Random Effects, MM 10 0.025 0.009 0.0002 113.4 0.000 92.07% -
One per ref. (1)
Random Effects, MM, Hierarchical 10 0.025 0.008 0.0002 113.4 0.000 92.07% 0.000
All estimates Random Effects, REML 86 0.023 0.003 0.0003 317.8 0.000 73.25% - All estimates Random Effects, MM 86 0.022 0.002 0.0002 317.8 0.000 73.25% -
All estimates
Random Effects, MM, Hierarchical 86 0.023 0.003 0.000 317.8 0.000 73.25% 0.0003
B. SECONDARY SCHOOL ATTENDANCE (Mean in sample=0.676)b
One per ref. (1) Random Effects, REML 18 0.082 0.021 0.007 4050 0.000 99.58% - One per ref. (1) Random Effects, MM 18 0.081 0.021 0.0008 4050 0.000 99.58% -
One per ref. (1)
Random Effects, MM, Hierarchical 18 0.081 0.026 0.002 4050 0.000 99.58% 0.000
All estimates Random Effects, REML 131 0.095 0.010 0.012 4713 0.000 97.24% - All estimates Random Effects, MM 131 0.079 0.008 0.0007 4713 0.000 97.24% -
All estimates
Random Effects, MM, Hierarchical 131 0.086 0.028 0.002 4713 0.000 97.24% 0.000
(1) computed from all estimates in paper under fixed effects assumption (2) of null hypothesis that between-study variance is zero a Simple average from papers that reported primary attendance at baseline (n=9), b Simple average from papers that reported secondary attendance at baseline (n=9)

39
Table 6. School dropout effect sizes
Estimates used Model Used to Compute Overall Average Effect
Size
Number of Estimates
Average Effect Size
Standard Error of Average Effect Size
Between-Reference
Variance (tau-squared)
Chi-square Test (2)
p-value of Chi-square
Test
Percent of Total Variation in Effect
Sizes Due to Heterogeneity
Within-Program Variance,
Hierarchical (omega-squared)
A. PRIMARY DROPOUT EFFECTS
One per ref. (1) Random Effects, REML 9 -0.013 0.008 0.001 3603 0.000 99.78% - One per ref. (1) Random Effects, MM 9 -0.013 0.008 0.0002 3603 0.000 99.78% -
One per ref. (1)
Random Effects, MM, Hierarchical 9 -0.013 0.008 0.0002 3603 0.000 99.78% 0.000
All estimates Random Effects, REML 72 -0.024 0.005 0.0010 4283 0.000 98.34% - All estimates Random Effects, MM 72 -0.023 0.004 0.0001 4283 0.000 98.34% -
All estimates
Random Effects, MM, Hierarchical 72 -0.024 0.012 0.0002 4283 0.000 98.34% 0.000
B. SECONDARY DROPOUT EFFECTS
One per ref. (1) Random Effects, REML 6 -0.036 0.014 0.001 1238 0.000 99.60% - One per ref. (1) Random Effects, MM 6 -0.037 0.017 0.002 1238 0.000 99.60% -
One per ref. (1)
Random Effects, MM, Hierarchical 6 -0.037 0.012 0.000 1238 0.000 99.60% 0.005
All estimates Random Effects, REML 31 -0.039 0.009 0.002 1290 0.000 97.68% - All estimates Random Effects, MM 31 -0.036 0.008 0.001 1290 0.000 97.68% -
All estimates
Random Effects, MM, Hierarchical 31 -0.038 0.011 0.001 1290 0.000 97.68% 0.0004
(1) computed from all estimates in paper under fixed effects assumption (2) of null hypothesis that between-study variance is zero

40
Table 7. Pairwise correlation coefficients between program characteristics
Conditioned on
achievement
Primary subsidy
amt.
Secondary subsidy
amt.
Payment made
monthly
Subsidy age or grade
variation
Subsidy paid to mother
Supply Baseline prim.
enrollment
Baseline sec.
enrollment
Geographic targeting
Latin America
Random Wait list
Conditioned on achievement
1.0
Primary subsidy amt.
-0.33 1.0
Secondary subsidy amt.
-0.11 0.89*** 1.0
Payment made monthly
-0.55** 0.29 0.13 1.0
Subsidy age or grade variation
-0.07 -0.42 -0.18 -0.33 1.0
Subsidy paid to mother
-0.49 -0.04 -0.19 -0.15 1.0*** 1.0
Supply -0.09 0.11 -0.19 0.25 0.04 0.11 1.0 Baseline prim. enrollment
0.30 -0.27 0.87 -0.05 0.29 0.24 -0.45 1.0
Baseline sec. enrollment
-0.57 0.28 0.57 -0.34 -0.34 -0.34 1.0
Geographic targeting
-0.28 -0.29 0.21 -0.20 0.41* 0.58** 0.40 -0.38 -0.34 1.0
Latin America -0.65*** 0.33 -0.31 0.20 0.12 0.58* 0.15 -0.30 -0.57 0.13 1.0 Random assign. -0.22 0.16 0.31 0.15 -.07 -0.00 0.47** -0.29 -0.32 0.42* 0.28 1.0 Wait list -0.07 0.03 -0.17 -0.06 0.34 0.56* 0.68*** 0.31 -0.34 0.41* 0.13 0.21 1.0 *** p<0.01, ** p<0.05, * p<0.1

41
Table 8. Bivariate regressions for primary enrollment effect sizes One estimate per paper All estimates
REML MM MM REML MM MM no clustering no clustering clustering n no clustering no clustering clustering n
Program design characteristics Conditional on achievement (1=yes) -0.036 -0.031 -0.031 19 -0.015 -0.001 -0.002 187
(0.054) (0.053) (0.046) (0.030) (0.027) (0.028) Monthly subsidy in primary (% of ppp-GDP/capita) 0.028 *** 0.028 *** 0.028 ** 18 0.033 *** 0.024 *** 0.025 185
(0.008) (0.008) (0.009) (0.005) (0.005) (0.017) Payment is given monthly (vs. less frequent) -0.043 -0.040 -0.040 19 -0.075 *** -0.057 *** -0.058 * 187
(0.033) (0.032) (0.038) (0.016) (0.014) (0.030) Subsidy varies by grade or age (1=yes) -0.054 -0.051 -0.052 19 -0.049 *** -0.031 ** -0.032 187
(0.031) (0.031) (0.042) (0.017) (0.015) (0.038) Only mother receives the subsidy (1=yes) -0.019 -0.023 -0.023 10 -0.020 -0.023 -0.023 97
(0.030) (0.031) (0.020) (0.027) (0.028) (0.019) Supply component (1=yes) 0.071 ** 0.07 ** 0.071 18 0.082 *** 0.054 *** 0.061 186
(0.031) (0.031) (0.046) (0.018) (0.017) (0.066) Geographic targeting (1=yes) 0.056 0.052 0.053 19 0.06 *** 0.045 *** 0.047 187
(0.036) (0.035) (0.032) (0.018) (0.016) (0.027) Random assignment (1=yes) 0.048 0.044 0.045 19 0.024 0.006 0.007 187
(0.032) (0.031) (0.041) (0.018) (0.015) (0.035) Waiting list for control group (1=yes) 0.065 ** 0.061 * 0.062 19 0.064 *** 0.046 *** 0.048 187
(0.030) (0.030) (0.040) (0.017) (0.014) (0.033)Reference characteristics Published (1=Yes) -0.016 -0.015 -0.015 19 -0.036 * -0.023 -0.025 187
(0.038) (0.037) (0.026) (0.019) (0.016) (0.029) Number of reported effects 0.002 0.002 0.002 19 0.003 ** 0.002 0.002 187
(0.002) (0.002) (0.002) (0.001) (0.001) (0.002) Months between follow-up and baseline (/100) -0.036 -0.033 -0.033 16 -0.089 -0.082 -0.083 127
(0.056) (0.051) (0.038) (0.057) (0.053) (0.049)Contextual characteristics Latin American country (1=yes) 0.036 0.031 0.031 19 0.015 0.001 0.002 187
(0.054) (0.053) (0.046) (0.030) (0.027) (0.028) Primary enrollment rate at baseline -0.020 -0.013 -0.015 12 0.014 0.025 0.023 144
(0.146) (0.144) (0.139) (0.096) (0.091) (0.118)Standard errors in parentheses *** p<0.01, ** p<0.05, * p<0.1

42
Table 9. Bivariate regressions for secondary enrollment effect sizes One estimate per paper All estimates
REML MM MM REML MM MM no clustering no clustering clustering n no clustering no clustering clustering n
Program design characteristics Conditional on achievement (1=yes) 0.057 ** 0.062 ** 0.062 22 0.048 *** 0.048 *** 0.049 258
(0.027) (0.027) (0.040) (0.013) (0.012) (0.051) Monthly subsidy in secondary (% of ppp- GDP/capita) 0.004 0.004 0.004 20 0.01 *** 0.009 *** 0.009 * 252
(0.003) (0.002) (0.003) (0.002) (0.001) (0.005) Payment is given monthly (vs. less frequent) -0.024 -0.025 -0.025 22 -0.013 -0.017 * -0.016 258
(0.026) (0.026) (0.038) (0.011) (0.010) (0.029) Subsidy varies by grade or age (1=yes) -0.032 -0.032 -0.032 22 -0.029 *** -0.024 ** -0.025 258
(0.026) (0.026) (0.025) (0.011) (0.010) (0.021) Only mother receives the subsidy (1=yes) -0.049 -0.050 -0.050 17 -0.052 *** -0.045 *** -0.048 201
(0.029) (0.029) (0.030) (0.014) (0.012) (0.031) Supply component (1=yes) -0.001 -0.002 -0.002 21 -0.016 -0.015 -0.016 257
(0.032) (0.032) (0.021) (0.016) (0.014) (0.028) Geographic targeting (1=yes) -0.018 -0.019 -0.019 22 -0.016 -0.012 -0.013 258
(0.026) (0.026) (0.029) (0.011) (0.010) (0.023) Random assignment (1=yes) -0.027 -0.029 -0.028 22 -0.011 -0.016 -0.014 258
(0.026) (0.026) (0.028) (0.011) (0.010) (0.024) Waiting list for control group (1=yes) -0.025 -0.025 -0.025 22 -0.041 *** -0.036 *** -0.038 * 258
(0.027) (0.027) (0.025) (0.011) (0.010) (0.022)Reference characteristics Published (1=Yes) 0.038 0.039 0.039 22 0.06 *** 0.06 *** 0.060 258
(0.033) (0.033) (0.051) (0.013) (0.012) (0.042) Number of reported effects -0.002 -0.002 -0.002 22 -0.002 *** -0.002 *** -0.002 ** 258 (0.001) (0.001) (0.001) (0.001) (0.001) (0.001) Months between follow-up and baseline (/100) -0.040 -0.039 -0.039 15 -0.053 -0.064 -0.062 157
(0.077) (0.076) (0.031) (0.037) (0.036) (0.048)Contextual characteristics Latin American country (1=Yes) -0.056 ** -0.059 ** -0.059 * 22 -0.057 *** -0.055 *** -0.056 * 258
(0.024) (0.023) (0.028) (0.011) (0.010) (0.032) Cambodia 0.178 *** 0.179 *** 0.179 *** 22 0.176 *** 0.185 *** 0.185 *** 258
(0.024) (0.024) (0.018) (0.017) (0.016) (0.010) Secondary enrollment at baseline -0.001 -0.001 -0.001 9 0.001 0.001 0.001 126
(0.002) (0.002) (0.001) (0.001) (0.001) (0.001)
Standard errors in parentheses. *** p<0.01, ** p<0.05, * p<0.1
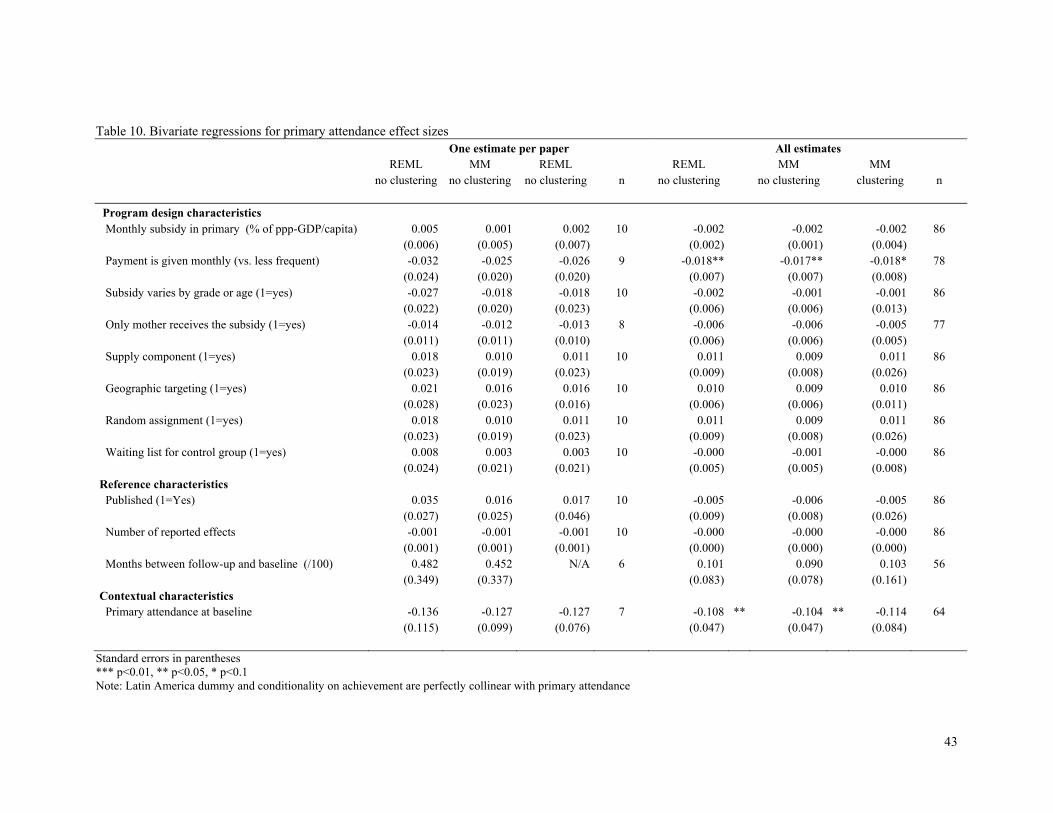
43
Table 10. Bivariate regressions for primary attendance effect sizes One estimate per paper All estimates
REML MM REML REML MM MM no clustering no clustering no clustering n no clustering no clustering clustering n
Program design characteristics Monthly subsidy in primary (% of ppp-GDP/capita) 0.005 0.001 0.002 10 -0.002 -0.002 -0.002 86
(0.006) (0.005) (0.007) (0.002) (0.001) (0.004) Payment is given monthly (vs. less frequent) -0.032 -0.025 -0.026 9 -0.018** -0.017** -0.018* 78
(0.024) (0.020) (0.020) (0.007) (0.007) (0.008) Subsidy varies by grade or age (1=yes) -0.027 -0.018 -0.018 10 -0.002 -0.001 -0.001 86
(0.022) (0.020) (0.023) (0.006) (0.006) (0.013) Only mother receives the subsidy (1=yes) -0.014 -0.012 -0.013 8 -0.006 -0.006 -0.005 77
(0.011) (0.011) (0.010) (0.006) (0.006) (0.005) Supply component (1=yes) 0.018 0.010 0.011 10 0.011 0.009 0.011 86
(0.023) (0.019) (0.023) (0.009) (0.008) (0.026) Geographic targeting (1=yes) 0.021 0.016 0.016 10 0.010 0.009 0.010 86
(0.028) (0.023) (0.016) (0.006) (0.006) (0.011) Random assignment (1=yes) 0.018 0.010 0.011 10 0.011 0.009 0.011 86
(0.023) (0.019) (0.023) (0.009) (0.008) (0.026) Waiting list for control group (1=yes) 0.008 0.003 0.003 10 -0.000 -0.001 -0.000 86
(0.024) (0.021) (0.021) (0.005) (0.005) (0.008)Reference characteristics Published (1=Yes) 0.035 0.016 0.017 10 -0.005 -0.006 -0.005 86
(0.027) (0.025) (0.046) (0.009) (0.008) (0.026) Number of reported effects -0.001 -0.001 -0.001 10 -0.000 -0.000 -0.000 86 (0.001) (0.001) (0.001) (0.000) (0.000) (0.000) Months between follow-up and baseline (/100) 0.482 0.452 N/A 6 0.101 0.090 0.103 56
(0.349) (0.337) (0.083) (0.078) (0.161)Contextual characteristics Primary attendance at baseline -0.136 -0.127 -0.127 7 -0.108 ** -0.104 ** -0.114 64
(0.115) (0.099) (0.076) (0.047) (0.047) (0.084)
Standard errors in parentheses *** p<0.01, ** p<0.05, * p<0.1 Note: Latin America dummy and conditionality on achievement are perfectly collinear with primary attendance

44
Table 11. Bivariate regressions for secondary attendance effect sizes One estimate per paper All estimates
REML MM MM n REML MM MM n no clustering no clustering clustering no clustering no clustering clustering
Program design characteristics Conditional on achievement (1=yes) 0.108 ** 0.109 ** 0.109 18 0.118 *** 0.092 *** 0.097 131
(0.039) (0.038) (0.062) (0.019) (0.016) (0.062) Monthly subsidy in secondary (% of ppp- GDP/capita) 0.001 0.001 0.001 16 0.007 *** 0.002 0.004 121
(0.004) (0.004) (0.006) (0.002) (0.002) (0.006) Payment is given monthly (vs. less frequent) -0.097 ** -0.1 ** -0.099 * 18 -0.092 *** -0.078 *** -0.08 * 131
(0.035) (0.035) (0.045) (0.019) (0.016) (0.041) Subsidy varies by grade or age (1=yes) -0.014 -0.016 -0.015 18 -0.048 ** -0.028 -0.032 131
(0.045) (0.046) (0.043) (0.020) (0.018) (0.040) Only mother receives the subsidy (1=yes) -0.042 -0.042 -0.042 14 -0.079 *** -0.051 *** -0.059 113
(0.052) (0.052) (0.058) (0.022) (0.019) (0.053) Supply component (1=yes) -0.043 -0.042 -0.043 17 -0.057 ** -0.042 * -0.046 125
(0.057) (0.057) (0.034) (0.026) (0.023) (0.032) Geographic targeting (1=yes) -0.063 -0.068 -0.064 18 -0.079 *** -0.066 *** -0.070 131
(0.039) (0.040) (0.048) (0.019) (0.016) (0.050) Random assignment (1=yes) -0.076 * -0.077 * -0.077 * 18 -0.083 *** -0.072 *** -0.075 * 131
(0.041) (0.040) (0.038) (0.020) (0.016) (0.038) Waiting list for control group (1=yes) -0.020 -0.023 -0.022 18 -0.043 * -0.028 -0.031 131
(0.051) (0.052) (0.038) (0.024) (0.022) (0.030)Reference characteristics Published (1=Yes) 0.035 0.036 0.036 18 0.087 *** 0.066 *** 0.070 131
(0.056) (0.056) (0.088) (0.025) (0.024) (0.093) Number of reported effects 0.003 0.003 0.003 18 0.001 0.001 0.001 131 (0.004) (0.004) (0.005) (0.001) (0.001) (0.003) Months between follow-up and baseline (/100) 2.358 *** 2.446 *** 2.374 *** 10 2.338 *** 2.445 *** 2.407 *** 62
(0.227) (0.225) (0.213) (0.262) (0.194) (0.216)Contextual characteristics Latin American country (1=yes) -0.072 * -0.072 * -0.072 18 -0.126 *** -0.094 *** -0.106* 131
(0.040) (0.040) (0.062) (0.019) (0.017) (0.056) Cambodia 0.206 *** 0.211 *** 0.209 *** 18 0.217 *** 0.218 *** 0.218 *** 131
(0.023) (0.021) (0.026) (0.016) (0.012) (0.020) Secondary attendance at baseline -0.05 * -0.049* -0.042 8 -0.055 *** -0.057 *** -0.048 70
(0.024) (0.024) (0.018) (0.017) (0.017) (0.028)
Standard errors in parentheses. *** p<0.01, ** p<0.05, * p<0.1
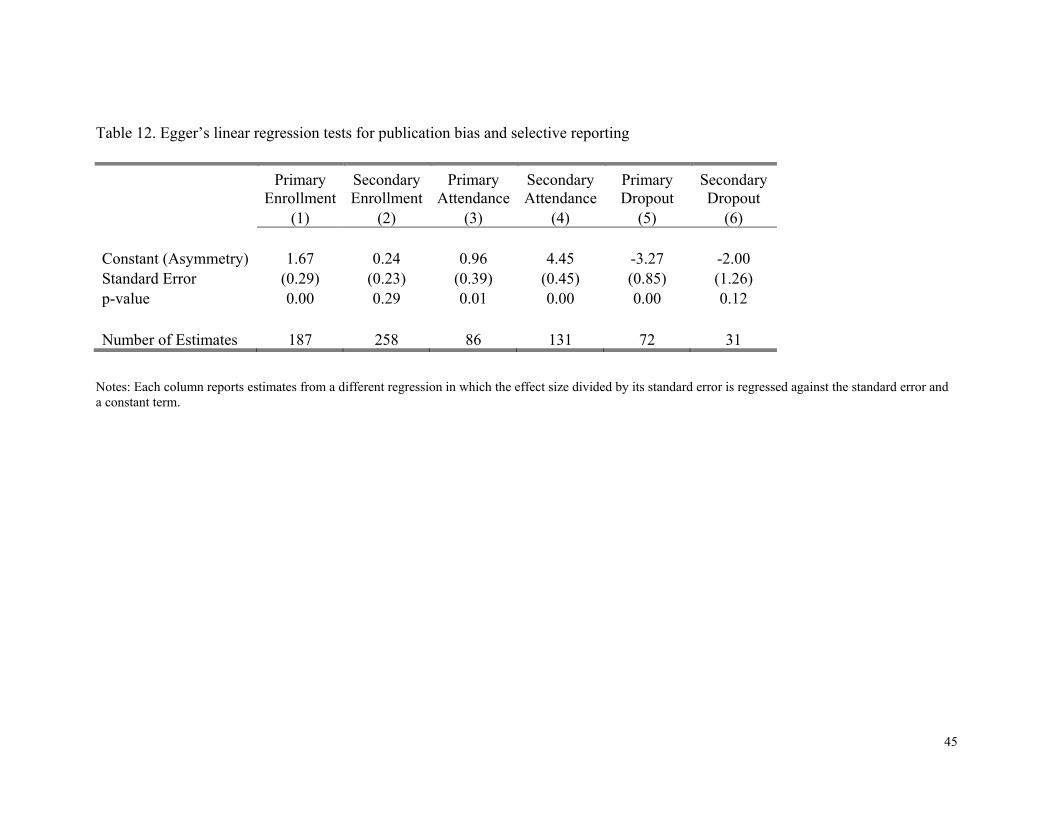
45
Table 12. Egger’s linear regression tests for publication bias and selective reporting
Primary
EnrollmentSecondary Enrollment
Primary Attendance
Secondary Attendance
Primary Dropout
Secondary Dropout
(1) (2) (3) (4) (5) (6) Constant (Asymmetry) 1.67 0.24 0.96 4.45 -3.27 -2.00 Standard Error (0.29) (0.23) (0.39) (0.45) (0.85) (1.26) p-value 0.00 0.29 0.01 0.00 0.00 0.12 Number of Estimates 187 258 86 131 72 31
Notes: Each column reports estimates from a different regression in which the effect size divided by its standard error is regressed against the standard error and a constant term.

46
Figure 1. Distribution of effects reported in each reference in sample, by outcome and level
23
2 31
3 2 13
13
0
5
10
15
20
25
0 1 2 3 4 6 12 16 20 24
Pape
rs
Number of reported effects in paper
A. Reported Effect Sizes for Primary Enrollment
21
1 1 1
5
1 1 1 13 2 1 2 2
0
5
10
15
20
25
0 1 2 3 4 9 10 11 12 15 16 18 24 32
Pape
rs
Number of reported effects in paper
B. Reported Effect Sizes for Secondary Enrollment
33
13
13
1 1 1
0
5
10
15
20
25
30
35
0 1 2 3 8 12 24 30
Pape
rs
Number of reported effects in paper
C. Reported effect sizes for primary attendance

47
Figure 1. (cont.)
27
35
15
1 1 1 1
0
5
10
15
20
25
30
35
0 2 4 6 8 9 12 15 24
Pape
rs
Number of reported effects in paper
D. Reported effect sizes for secondary attendance
33
2 1 1 1 1 1 1 1
0
5
10
15
20
25
30
35
0 2 3 4 6 9 10 16 22
Pape
rs
Number of reported effects in paper
E. Reported effect sizes for primary dropout
1 1 2 1 1
0
5
10
15
20
25
30
35
0 1 2 3 4 18
Pap
ers
Number of reported effects in paper
F. Reported effect sizes for secondary dropout

48
Figure 2. Forest plot of effect sizes on primary enrollment (one effect per paper)
Notes: For each reference we compute one average effect size using a fixed effects model to combine all estimates in the reference. Mean baseline primary enrollment is 84%.
NOTE: Weights are from random effects analysis
Overall
RED DE PROTECCION SOCIAL
OPORTUNIDADES
OPORTUNIDADES
BONO DE DESARROLLO HUMANO
FAMILIAS EN ACCION
OPORTUNIDADES
RED DE PROTECCION SOCIAL
RED DE PROTECCION SOCIAL
PROGRESA
SRMP
FAMILIAS EN ACCION
PROGRESA
JPS
PROGRESA
Program
BONO DE DESARROLLO HUMANO
BOLSA ESCOLA/BOLSA FAMILIA
PRAF II
BONO DE DESARROLLO HUMANO
RED DE PROTECCION SOCIAL
Nicaragua
Mexico
Mexico
Ecuador
Colombia
Mexico
Nicaragua
Nicaragua
Mexico
Turkey
Colombia
Mexico
Indonesia
Mexico
Country
Ecuador
Brazil
Honduras
Ecuador
Nicaragua
Maluccio, J
Todd, P
Behrman, J
Oosterbeek, H
Attanasio, O
Behrman, J
Ford, D
Maluccio, J
Schultz
Ahmed, A
Attanasio, O
Davis, B
Sparrow, R
Attanasio, O
Author
Schady, N
Glewwe, P
de Souza
Ponce, J
Gitter, S
First
5.13 (3.70, 6.56)
28.64 (26.07, 31.20)
9.37 (8.09, 10.65)
3.13 (2.50, 3.75)
2.14 (1.30, 2.99)
1.69 (0.65, 2.73)
-0.04 (-1.05, 0.97)
10.46 (8.22, 12.71)
16.08 (10.58, 21.57)
1.37 (0.94, 1.80)
-2.33 (-4.53, -0.12)
0.59 (-0.53, 1.71)
9.66 (5.95, 13.37)
6.99 (5.09, 8.89)
1.64 (0.97, 2.32)
ES (95% CI)
3.99 (2.83, 5.15)
2.82 (2.47, 3.17)
2.90 (-1.02, 6.82)
0.52 (-0.62, 1.67)
8.16 (2.80, 13.53)
0-10 0 10 20 30
Percentage points

49
Figure 3. Forest plot of effect sizes on secondary enrollment (one effect per paper)
Notes: For each reference we compute one average effect size using a fixed effects model to combine all estimates in the reference. Overall random-effects average effect size is estimated using method of moments not accounting for hierarchical nesting of effects within programs. Mean baseline secondary enrollment is 59%.
NOTE: Weights are from random effects analysis
Overall
BONO DE DESARROLLO HUMANO
JPS
BONO DE DESARROLLO HUMANO
FAMILIAS EN ACCION
Program
PUNJAB
BONO DE DESARROLLO HUMANO
PROGRESA
PROGRESA
OPORTUNIDADES
CESSP
PROGRESA
OPORTUNIDADES
PROGRESA
OPORTUNIDADES
SRMP
CCT FOR SCHOOLING IN MALAWI
PUNJAB
CCT FOR SCHOOLING IN MALAWI
CAMBODIA JFPR SCHOLARSHIP PROGRAM
BOLSA ESCOLA/BOLSA FAMILIA
SUBSIDIOS CONDICIONADOS BOGOTA
FEMALE STIPEND PROGRAM IN BANGLADESH
Ecuador
Indonesia
Ecuador
Colombia
Country
Pakistan
Ecuador
Mexico
Mexico
Mexico
Cambodia
Mexico
Mexico
Mexico
Mexico
Turkey
Malawi
Pakistan
Malawi
Cambodia
Brazil
Colombia
Bangladesh
Ponce, J
Sparrow, R
Oosterbeek, H
Attanasio, O
Author
Chaudhury, N
Schady, N
Coady, D
Schultz
Behrman, J
Filmer, D
Davis, B
Behrman, J
Attanasio, O
Todd, P
Ahmed, A
Baird, S
Hasan, A
Baird, s
Filmer, D
Glewwe, P
Barrera, F
Khandker, S
First
5.87 (4.44, 7.30)
0.52 (-0.62, 1.67)
6.35 (2.72, 9.98)
2.14 (1.30, 2.99)
8.81 (3.79, 13.82)
ES (95% CI)
9.05 (7.51, 10.59)
3.99 (2.83, 5.15)
8.62 (5.60, 11.64)
1.89 (1.10, 2.68)
2.50 (0.89, 4.11)
19.63 (16.36, 22.90)
9.66 (5.95, 13.37)
0.26 (-1.10, 1.61)
3.14 (1.77, 4.51)
2.55 (0.89, 4.22)
-0.41 (-6.19, 5.37)
3.54 (1.42, 5.66)
3.21 (3.04, 3.39)
9.69 (7.90, 11.49)
24.07 (22.38, 25.77)
3.20 (2.59, 3.81)
2.53 (1.74, 3.32)
7.26 (6.92, 7.59)
0-10 0 10 20 30
Percentage points

50
Figure 4. Forest plot of effect sizes on primary attendance (one effect per paper)
Notes: For each reference we compute one average effect size using a fixed effects model to combine all estimates in the reference. Skoufias and Parker (2001) (First Author Skoufias for Progresa) reports effects for three post-treatment periods and we compute one effect size per measurement period. Overall random-effects average effect size is estimated using method of moments not accounting for hierarchical nesting of effects within programs. Mean baseline primary attendance in sample is 80%.

51
Figure 5. Forest plot of effect sizes on secondary attendance (one effect per paper)
Notes: For each reference we compute one average effect size using a fixed effects model to combine all estimates in the reference. Duryea and Morrison (2004) reports effects for two post-treatment periods and we compute one effect size per measurement period. Skoufias and Parker (2001) (First Author Skoufias for Progresa) reports effects for three post-treatment periods and we compute one effect size per measurement period. Overall random-effects average effect size is estimated using method of moments not accounting for hierarchical nesting of effects within programs. Mean baseline secondary attendance in sample is 68%.

52
Figure 6. Forest plot of effect sizes on primary dropout (one effect per paper)
Notes: For each paper we compute one average effect size using a fixed effects model to combine all estimates in the paper. Overall random-effects average effect size is estimated using method of moments not accounting for hierarchical nesting of effects within programs.
NOTE: Weights are from random effects analysis
Overall
PROGRESA
BOLSA ESCOLA/BOLSA FAMILIA
PRAF II
PROGRESA
Program
JPS
BOLSA ESCOLA
OPORTUNIDADES
RED DE PROTECCION SOCIAL
BONO DE DESARROLLO HUMANO
Mexico
Brazil
Honduras
Mexico
Country
Indonesia
Brazil
Mexico
Nicaragua
Ecuador
Behrman, J
Glewwe, P
de Souza, P
Raymond, M
Author
First
Cameron, L
De Janvry, A
Todd, P
Maluccio, J
Ponce, J
-1.31 (-2.28, -0.34)
-0.58 (-1.00, -0.15)
-0.31 (-0.39, -0.23)
-1.09 (-2.45, 0.26)
-0.50 (-0.66, -0.34)
ES (95% CI)
-0.00 (-0.01, 0.00)
-5.88 (-6.08, -5.68)
0.13 (-1.17, 1.42)
-4.26 (-5.13, -3.39)
1.09 (-0.04, 2.22)
-1.31 (-2.28, -0.34)
-0.58 (-1.00, -0.15)
-0.31 (-0.39, -0.23)
-1.09 (-2.45, 0.26)
-0.50 (-0.66, -0.34)
ES (95% CI)
-0.00 (-0.01, 0.00)
-5.88 (-6.08, -5.68)
0.13 (-1.17, 1.42)
-4.26 (-5.13, -3.39)
1.09 (-0.04, 2.22)
0-8 -6 -4 -2 0 2Percentage points

53
Figure 7. Forest plot of effect sizes on secondary dropout (one effect per paper)
Notes: For each paper we compute one average effect size using a fixed effects model to combine all estimates in the paper. Overall random-effects average effect size is estimated using method of moments not accounting for hierarchical nesting of effects within programs.
NOTE: Weights are from random effects analysis
Overall
OPORTUNIDADES
Program
PROGRESA
JPS
PROGRESA
BOLSA ESCOLA
BOLSA ESCOLA/BOLSA FAMILIA
Mexico
Country
Mexico
Indonesia
Mexico
Brazil
Brazil
Todd, P
First
Author
Behrman, J
Cameron, L
Raymond, M
De Janvry, A
Glewwe, P
-3.66 (-7.02, -0.29)
-2.89 (-4.83, -0.94)
ES (95% CI)
-8.36 (-10.87, -5.84)
-1.42 (-2.20, -0.65)
-1.94 (-2.76, -1.12)
-7.40 (-7.79, -7.01)
-0.27 (-0.37, -0.17)
-3.66 (-7.02, -0.29)
-2.89 (-4.83, -0.94)
ES (95% CI)
-8.36 (-10.87, -5.84)
-1.42 (-2.20, -0.65)
-1.94 (-2.76, -1.12)
-7.40 (-7.79, -7.01)
-0.27 (-0.37, -0.17)
0-10 -8 -6 -4 -2 0 2
Percentage points

54
Figure 8. Funnel plot of standard error of effect on reported primary enrollment effect size (all effects from all references)
Random EffectsAverage Effect Size
010
000
2000
030
000
4000
0S
ampl
e S
ize
0 .2 .4 .6 .8Primary Enrollment Effect - Percentage Points/100

55
Figure 9. Funnel plot of standard error of effect on reported secondary enrollment effect size (all effects from all references)
Random EffectsAverage Effect Size
020
000
4000
060
000
8000
010
0000
Sam
ple
Siz
e
-.5 0 .5 1Secondary Enrollment Effect - Percentage Points/100

56
Figure 10. Funnel plot of standard error of effect on reported primary attendance effect size (all effects from all references)
Random EffectsAverage Effect Size
020
000
4000
060
000
8000
0S
ampl
e S
ize
-.02 0 .02 .04 .06 .08Primary Attendance Effect - Percentage Points/100
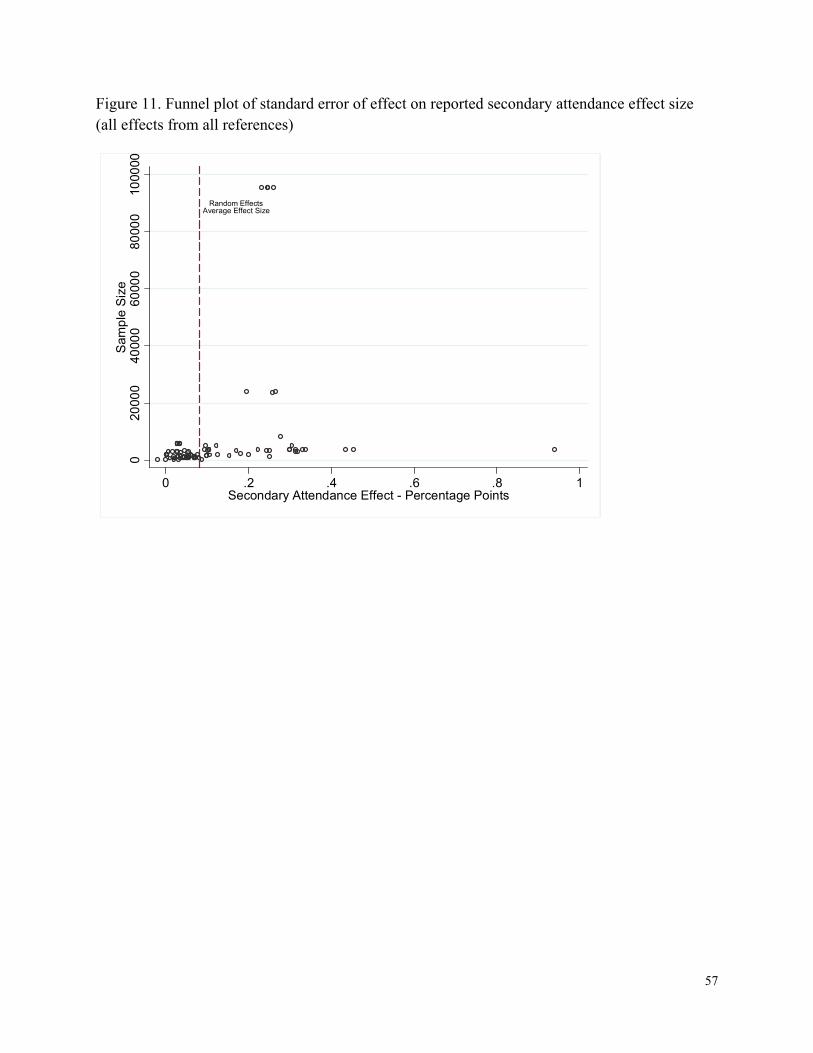
57
Figure 11. Funnel plot of standard error of effect on reported secondary attendance effect size (all effects from all references)
Random EffectsAverage Effect Size
020
000
4000
060
000
8000
010
0000
Sam
ple
Siz
e
0 .2 .4 .6 .8 1Secondary Attendance Effect - Percentage Points
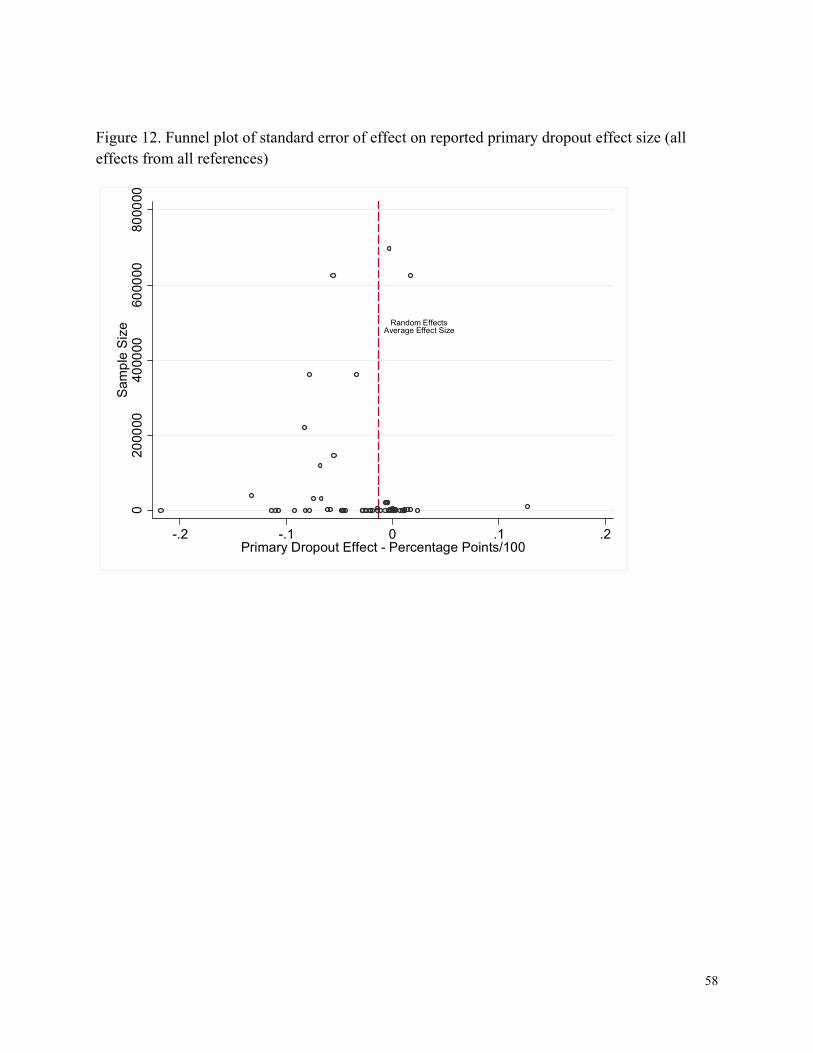
58
Figure 12. Funnel plot of standard error of effect on reported primary dropout effect size (all effects from all references)
Random EffectsAverage Effect Size
020
0000
4000
0060
0000
8000
00S
ampl
e S
ize
-.2 -.1 0 .1 .2Primary Dropout Effect - Percentage Points/100

59
Figure 13. Funnel plot of standard error of effect on reported secondary dropout effect size (all effects from all references)
Random EffectsAverage Effect Size
050
000
1000
0015
0000
2000
00S
ampl
e Si
ze
-.2 -.1 0 .1 .2Secondary Dropout Effect - Percentage Points/100

60
Appendix Table b. Characteristics of references in final analysis sample
Country Program name First author Year Publication type Source of data Sample sizea
Reports effects on Enrollment Attendance Dropout
Bangladesh Female Stipend Program Khandker, S. 2003 Working paper Household survey and school data
89,861 Yes No No
Brazil Bolsa Escola De Janvry, A. 2006 Working paper Administrative data
624,077 No No Yes
Brazil Bolsa Escola/Bolsa Familia Glewwe, P. 2008 Conference paper Census data 699,255 Yes No Yes Brazil PETI/Bolsa Escola/Renda
Minima Cardoso, E. 2004 Working paper Census data 428,740 No Yes No
Cambodia CESSP Filmer, D. 2009 Working paper Program survey 3,225 Yes Yes No Cambodia CESSP Filmer, D. 2009 Working paper Program survey 95,493 No Yes No Cambodia JFPR Scholarship Program Filmer, D. 2008 Journal article Program survey 5,138 Yes Yes No Colombia Familias en Acción Attanasio, O. 2010 Journal article Program survey 3,648 Yes No No Colombia Familias en Acción Attanasio, O. 2004 Technical Report Program survey 2,691 No Yes No Colombia Familias en Acción Attanasio, O. 2004 Government report Program survey 3,935 Yes No No Colombia Familias en Acción National
Planning Department
2006 Government report Program survey 3,935 No Yes No
Colombia Subsidios Condicionados a la Asistencia Escolar en Bogotá
Barrera, F. 2009 Working paper Program survey 8,980 Yes Yes No
Costa Rica Superémonos Duryea, S. 2004 Working paper Program survey 1,109 No Yes No Ecuador Bono de Desarrollo
Humano Oosterbeek, H.
2008 Working paper Program survey 3,004 Yes No No
Ecuador Bono de Desarrollo Humano
Ponce, J. 2006 Working paper Program survey 2,384 Yes No Yes
Ecuador Bono de Desarrollo Humano
Schady, N. 2008 Journal article Program survey 2,875 Yes No No
Honduras PRAF II De Souza 2005 Doctoral dissertation Program survey 12,741 Yes Yes Yes Indonesia JPS Cameron, L. 2009 Journal article National
household survey 5,358 No No Yes
Indonesia JPS Sparrow, R. 2007 Journal article National household survey
120,022 Yes Yes No
Jamaica PATH Levy, D. 2007 Technical report Program survey 7,751 No Yes No
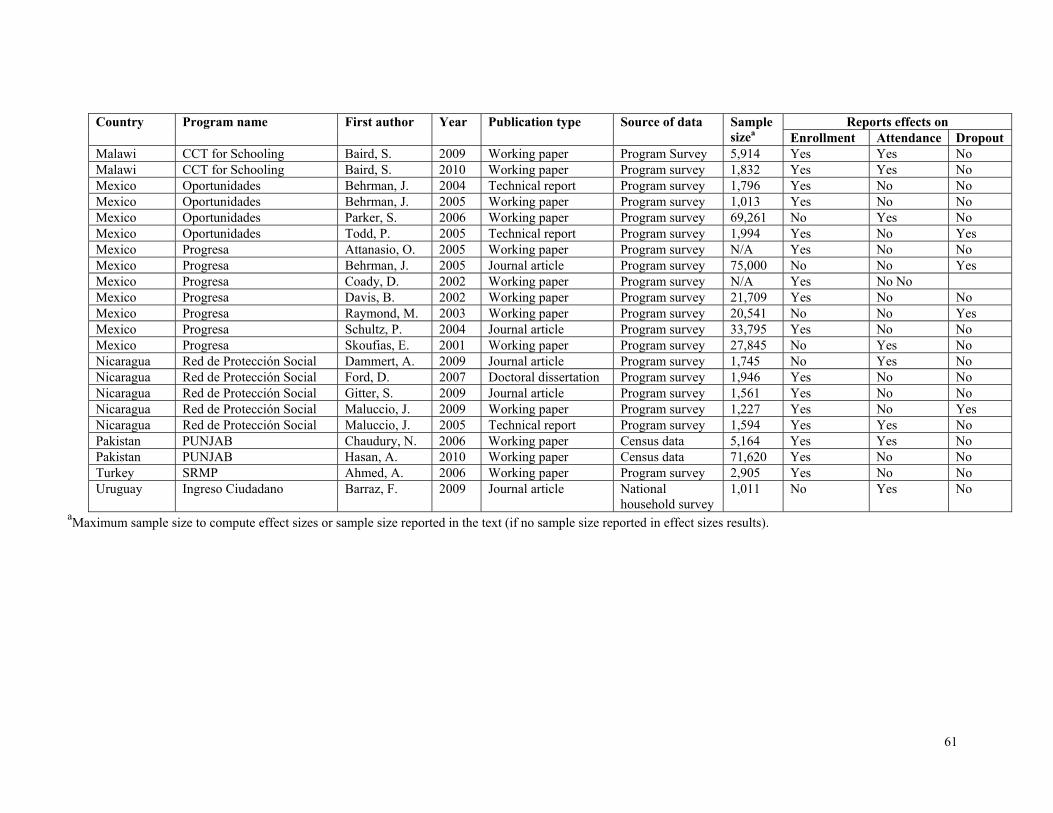
61
Country Program name First author Year Publication type Source of data Sample sizea
Reports effects on Enrollment Attendance Dropout
Malawi CCT for Schooling Baird, S. 2009 Working paper Program Survey 5,914 Yes Yes No Malawi CCT for Schooling Baird, S. 2010 Working paper Program survey 1,832 Yes Yes No Mexico Oportunidades Behrman, J. 2004 Technical report Program survey 1,796 Yes No No Mexico Oportunidades Behrman, J. 2005 Working paper Program survey 1,013 Yes No No Mexico Oportunidades Parker, S. 2006 Working paper Program survey 69,261 No Yes No Mexico Oportunidades Todd, P. 2005 Technical report Program survey 1,994 Yes No Yes Mexico Progresa Attanasio, O. 2005 Working paper Program survey N/A Yes No No Mexico Progresa Behrman, J. 2005 Journal article Program survey 75,000 No No Yes Mexico Progresa Coady, D. 2002 Working paper Program survey N/A Yes No No Mexico Progresa Davis, B. 2002 Working paper Program survey 21,709 Yes No No Mexico Progresa Raymond, M. 2003 Working paper Program survey 20,541 No No Yes Mexico Progresa Schultz, P. 2004 Journal article Program survey 33,795 Yes No No Mexico Progresa Skoufias, E. 2001 Working paper Program survey 27,845 No Yes No Nicaragua Red de Protección Social Dammert, A. 2009 Journal article Program survey 1,745 No Yes No Nicaragua Red de Protección Social Ford, D. 2007 Doctoral dissertation Program survey 1,946 Yes No No Nicaragua Red de Protección Social Gitter, S. 2009 Journal article Program survey 1,561 Yes No No Nicaragua Red de Protección Social Maluccio, J. 2009 Working paper Program survey 1,227 Yes No Yes Nicaragua Red de Protección Social Maluccio, J. 2005 Technical report Program survey 1,594 Yes Yes No Pakistan PUNJAB Chaudury, N. 2006 Working paper Census data 5,164 Yes Yes No Pakistan PUNJAB Hasan, A. 2010 Working paper Census data 71,620 Yes No No Turkey SRMP Ahmed, A. 2006 Working paper Program survey 2,905 Yes No No Uruguay Ingreso Ciudadano Barraz, F. 2009 Journal article National
household survey 1,011 No Yes No
aMaximum sample size to compute effect sizes or sample size reported in the text (if no sample size reported in effect sizes results).
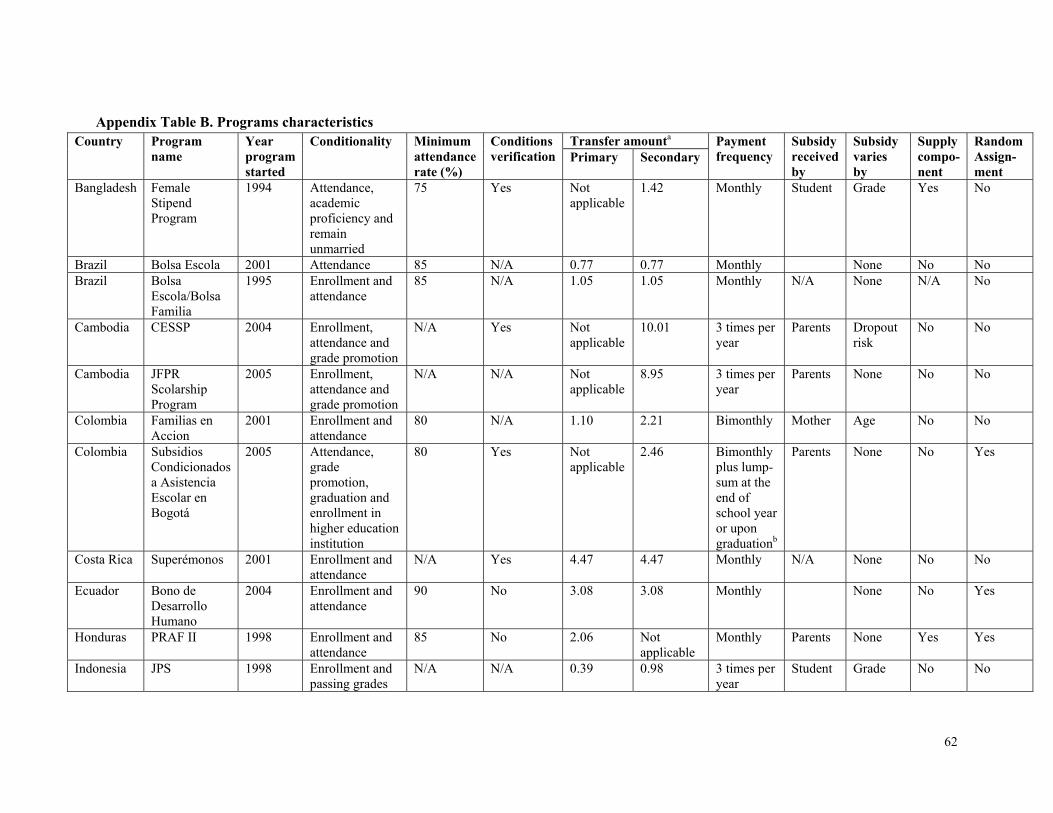
62
Appendix Table B. Programs characteristics Country Program
name Year program started
Conditionality Minimum attendance rate (%)
Conditions verification
Transfer amounta Payment frequency
Subsidy received by
Subsidy varies by
Supply compo-nent
Random Assign-ment
Primary Secondary
Bangladesh Female Stipend Program
1994 Attendance, academic proficiency and remain unmarried
75 Yes Not applicable
1.42 Monthly Student Grade Yes No
Brazil Bolsa Escola 2001 Attendance 85 N/A 0.77 0.77 Monthly None No No Brazil Bolsa
Escola/Bolsa Familia
1995 Enrollment and attendance
85 N/A 1.05 1.05 Monthly N/A None N/A No
Cambodia CESSP 2004 Enrollment, attendance and grade promotion
N/A Yes Not applicable
10.01 3 times per year
Parents Dropout risk
No No
Cambodia JFPR Scolarship Program
2005 Enrollment, attendance and grade promotion
N/A N/A Not applicable
8.95 3 times per year
Parents None No No
Colombia Familias en Accion
2001 Enrollment and attendance
80 N/A 1.10 2.21 Bimonthly Mother Age No No
Colombia Subsidios Condicionados a Asistencia Escolar en Bogotá
2005 Attendance, grade promotion, graduation and enrollment in higher education institution
80 Yes Not applicable
2.46 Bimonthly plus lump-sum at the end of school year or upon graduationb
Parents None No Yes
Costa Rica Superémonos 2001 Enrollment and attendance
N/A Yes 4.47 4.47 Monthly N/A None No No
Ecuador Bono de Desarrollo Humano
2004 Enrollment and attendance
90 No 3.08 3.08 Monthly None No Yes
Honduras PRAF II 1998 Enrollment and attendance
85 No 2.06 Not applicable
Monthly Parents None Yes Yes
Indonesia JPS 1998 Enrollment and passing grades
N/A N/A 0.39 0.98 3 times per year
Student Grade No No

63
Country Program name
Year program started
Conditionality Minimum attendance rate (%)
Conditions verification
Transfer amounta Payment frequency
Subsidy received by
Subsidy varies by
Supply compo-nent
Random Assign-ment
Primary Secondary
Jamaica PATH 2001 Attendance 85 Yes 1.11 1.11 N/A Parents None No No Malawi CCT for
schooling 2007 Enrollment and
attendance 75 Yes Not
applicable 17.3 Monthly Parent
or guardian and studentc
Randomly
No Yes
Mexico Oportunidades 2002 Attendance 85 N/A 1.21 3.92 Bimonthly Mother Gender and grade
No No
Mexico Progresa 1997 Attendance 85 N/A 1.05 2.49 Monthly Mother Gender and grade
Yes Yes
Nicaragua Red de Protección Social
2000 Enrollment and attendance
85 Yes 5.23 Not applicable
Bimonthly N/A None Yes Yes
Punjab Pakistan 2004 Attendance 80 N/A Not applicable
2.28 Monthly Student None No No
Turkey SRMP 2004 Attendance and not repeating a grade more than once
80 Yes 1.56 2.62 Bimonthly N/A Gender and grade
No No
Uruguay Ingreso Ciudadano
2005 Enrollment and attendance
N/A Yes 6.94 6.94 Monthly N/A None No No
a As percentage of PPP-adjusted GDP/capita. b This program was part of an experiment that included 3 different treatments that varied in the timing of subsidy delivery: (1) a subsidy with bimonthly payments conditioned on attendance, (2) subsidy with bimonthly payments conditioned on attendance and a lump sum at the end of the school year conditioned on school enrollment the following year, and (3) a subsidy with bimonthly payments conditioned on attendance and a lump sum upon graduation and enrollment in a higher education institution. c The program included two transfers: one to the household and another one to the student (girl).