Embed Size (px)
Citation preview

ComparativestudyofHVACsystemsinanofficebuildinginGreecebasedonenergysimulations
IliaLamproemail:[email protected]
D.Koubogiannis
EinB2017- 6th InternationalConference“ENERGYinBUILDINGS2017”
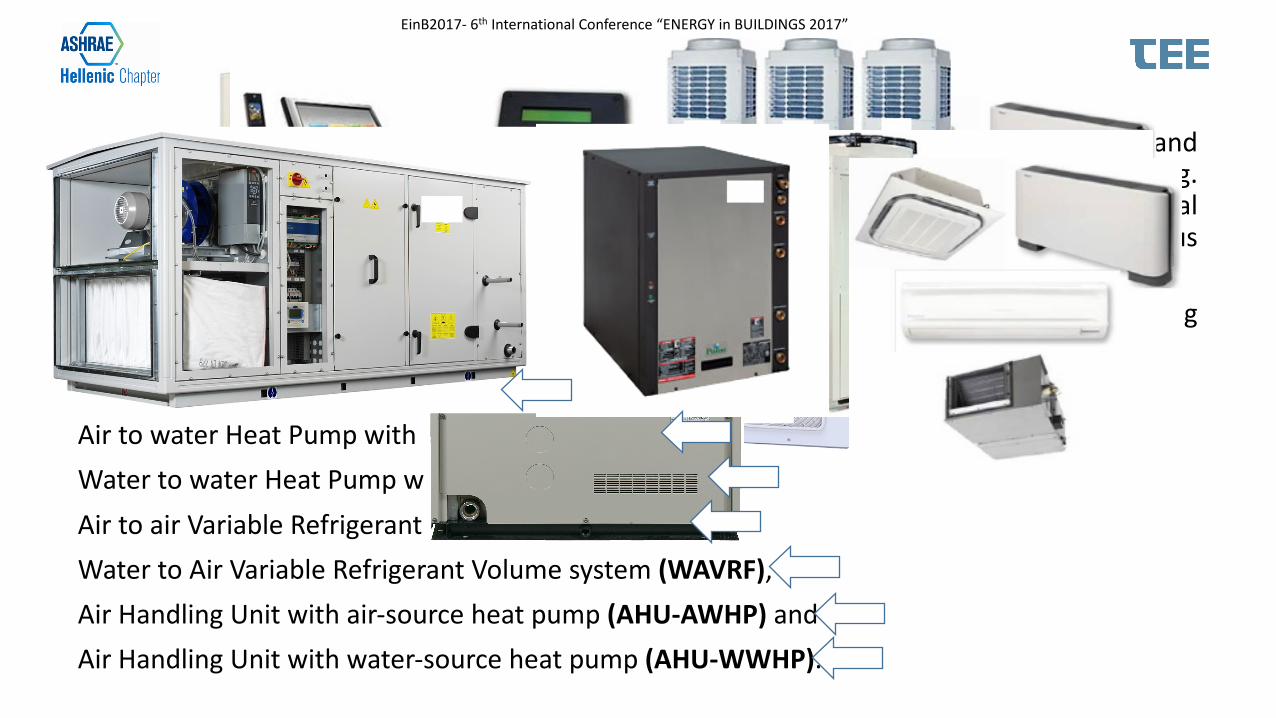
• The building sector is responsible for the greatest part of energy consumption in Europe andUSA. The greatest percentage of energy consumption in buildings is due to air conditioning.Hence, the air conditioning system selection and performance are crucial for the operationalenergy of the building. The selection of an air conditioning system depends on variousparameters (e.g. weather conditions, the building applications, etc).
• In this study various air conditioning systems are compared on the same reference buildingfor the different climatic zones in Greece. The systems are:
Split Unit Air Conditioners (SPLIUs),Air to water Heat Pump with FCUs (AWHP-FCUs),Water to water Heat Pump with FCUs (WWHP-FCUs),Air to air Variable Refrigerant Flow system (AAVRF),Water to Air Variable Refrigerant Volume system (WAVRF),Air Handling Unit with air-source heat pump (AHU-AWHP) andAir Handling Unit with water-source heat pump (AHU-WWHP).
MotivationEinB2017- 6th InternationalConference“ENERGYinBUILDINGS2017”
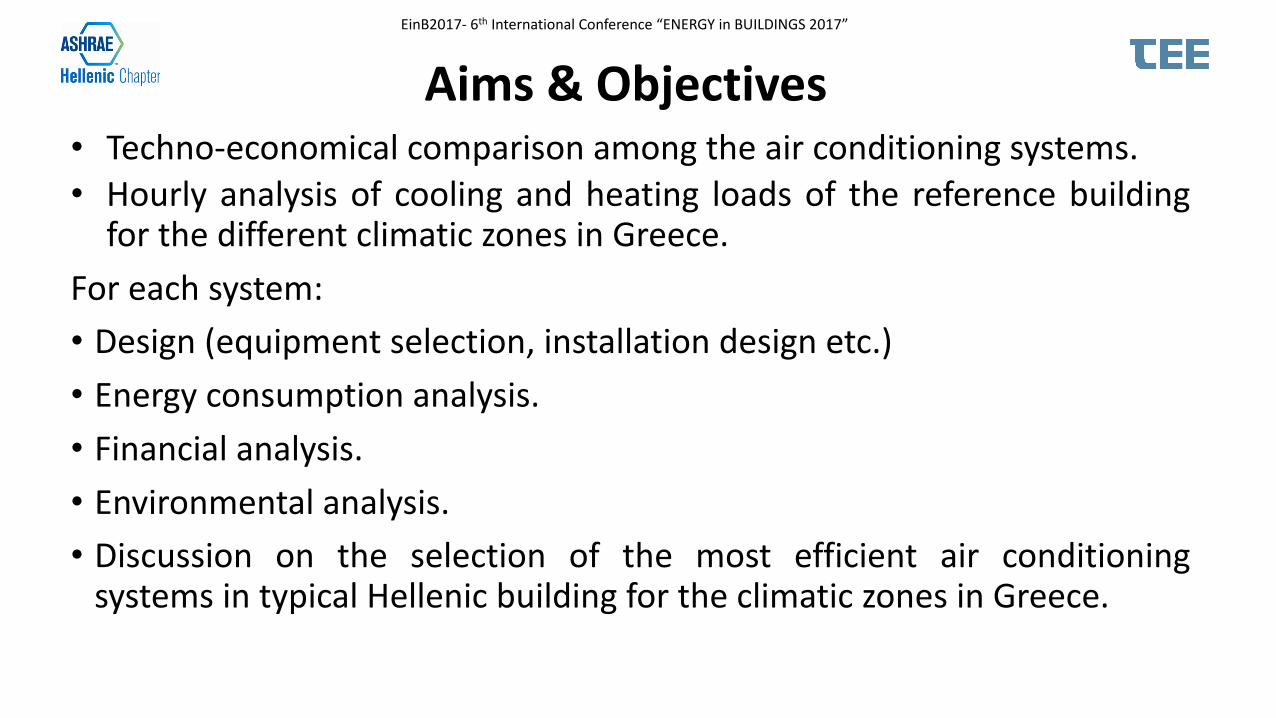
• Techno-economical comparison among the air conditioning systems.• Hourly analysis of cooling and heating loads of the reference buildingfor the different climatic zones in Greece.
For each system:• Design (equipment selection, installation design etc.)• Energy consumption analysis.• Financial analysis.• Environmental analysis.• Discussion on the selection of the most efficient air conditioningsystems in typical Hellenic building for the climatic zones in Greece.
Aims&ObjectivesEinB2017- 6th InternationalConference“ENERGYinBUILDINGS2017”

MethodologyBuildingselection
(casestudy)
Locationselection
Loadsanalyzing
• ClimatezoneA– Irakleio Crete• ClimatezoneB– Athens• ClimatezoneC– Thessaloniki• ClimatezoneD– Florina
• Worstcasescenario• Hourlyanalysis
Conclusions
Systemselection
Systemscomparison
• Splittypeunits (SPLIIUs)• A/WheatpumpwithFCUs(AWHP-FCUs)• W/WheatpumpwithFCUs(WWHP-FCUs)• A/AVRVsystem(AAVRF)• W/AVRVsystem(WAVRV)• AirHandlingunitwithA/Wheatpump(AHU-AWHP)• AirHandlingunitwithW/Wheatpump(AHU-WAHP)
Systemdesign
Drawingscreation
Energyconsumpti
onsimulation
Economicanalysis
Environmental
analysis
100% 80% 60% 40% 20%
0.00
1.00
2.00
3.00
4.00
5.00
6.00
7.00
20 15 10 7 5 2 0 -5 -7 -10 -15 Load
(%)
COP(W
/W)
TOA(oC)
DiagramA3.4:COP(W/W)- TOA(oC)- Load(%)diagramofRAS-13N3AV2-E 6.00-
7.00 5.00-6.00 4.00-5.00 3.00-4.00 2.00-3.00
Coolingloadsandenergysimulation
Heatingloadsandenergysimulation
• Costofenergy(hourly,monthly,annual)
• Costofinstallation• Cashflow(20years)• Paybackperiod
• Economic• Technical• Environmental
• Carbondioxideemissions
• Refrigerantcontent
• Sizeselection
EinB2017- 6th InternationalConference“ENERGYinBUILDINGS2017”

Results– Thermalloads(heating,cooling,annual)
0.00
20.00
40.00
60.00
80.00
A.Irakleio B.Athens C.Thessaloniki D.Florina
Thermalload
inM
Wh
Annualthermalload(MWh)ineachclimatezoneofGreece
Energyloadincooling(MWh)Energyloadinheating(MWh)Totalenergyload(MWh)
EinB2017- 6th InternationalConference“ENERGYinBUILDINGS2017”
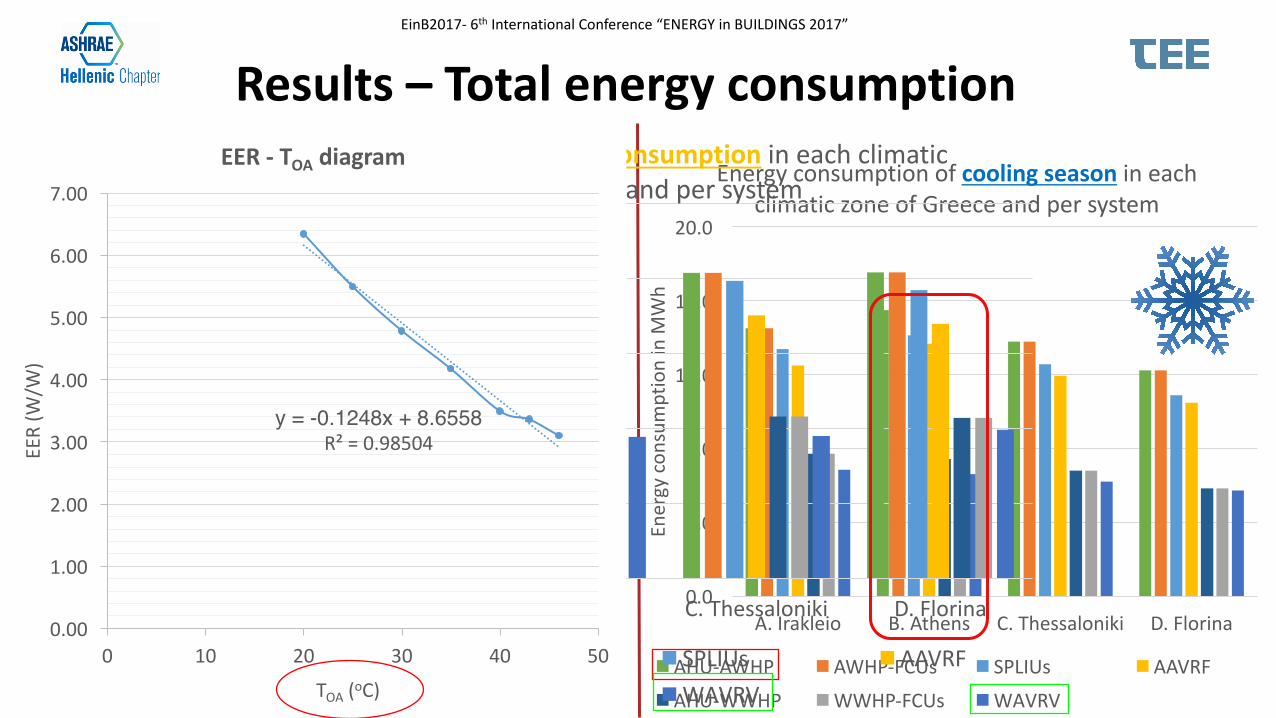
Results– Totalenergyconsumption
0.0
4.0
8.0
12.0
16.0
20.0
A.Irakleio B.Athens C.Thessaloniki D.Florina
Energycon
sumptioninM
Wh
Energyconsumptionofcoolingseason ineachclimaticzoneofGreeceandpersystem
AHU-AWHP AWHP-FCUs SPLIUs AAVRF
AHU-WWHP WWHP-FCUs WΑVRV
0.0
4.0
8.0
12.0
16.0
20.0
A.Irakleio B.Athens C.Thessaloniki D.Florina
Energycon
sumptioninM
Wh
Thetotal(annual)energyconsumption ineachclimaticzoneofGreeceandpersystem
AHU-AWHP AWHP-FCUs SPLIUs AAVRFAHU-WWHP WWHP-FCUs WΑVRV
0.0
1.0
2.0
3.0
4.0
5.0
A.Irakleio B.Athens C.Thessaloniki D.Florina
Energycon
sumptioninM
Wh
Energyconsumptionofheatingseason ineachclimaticzoneofGreeceandpersystem
SPLIUs AHU-AWHP AWHP-FCUs AAVRF
AHU-WWHP WWHP-FCUs WΑVRV
EinB2017- 6th InternationalConference“ENERGYinBUILDINGS2017”
y = -0.1248x + 8.6558R²=0.98504
0.00
1.00
2.00
3.00
4.00
5.00
6.00
7.00
0 10 20 30 40 50
EER(W
/W)
TOA (oC)
EER - ΤΟΑ diagram
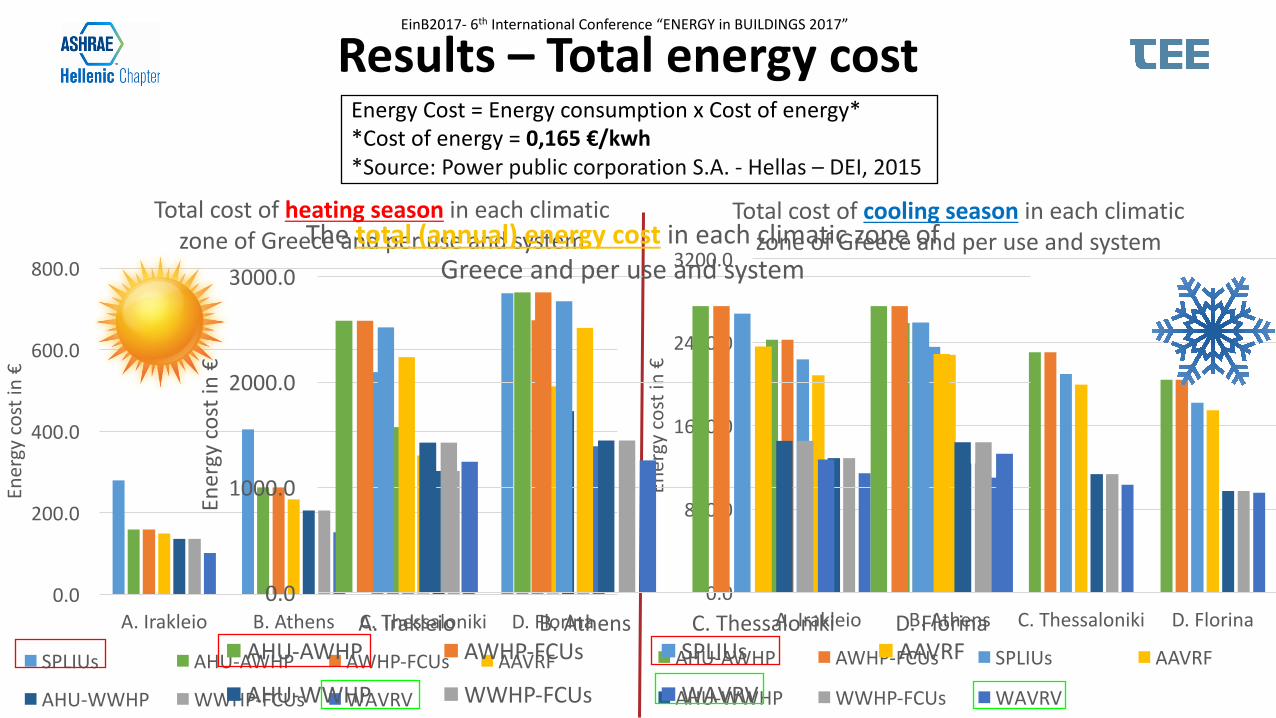
Results– Totalenergycost
0.0
800.0
1600.0
2400.0
3200.0
A.Irakleio B.Athens C.Thessaloniki D.Florina
Energycostin€
Totalcostofcoolingseason ineachclimaticzoneofGreeceandperuseandsystem
AHU-AWHP AWHP-FCUs SPLIUs AAVRF
AHU-WWHP WWHP-FCUs WΑVRV
0.0
200.0
400.0
600.0
800.0
A.Irakleio B.Athens C.Thessaloniki D.Florina
Energycostin€
Totalcostofheatingseason ineachclimaticzoneofGreeceandperuseandsystem
SPLIUs AHU-AWHP AWHP-FCUs AAVRF
AHU-WWHP WWHP-FCUs WΑVRV
0.0
1000.0
2000.0
3000.0
A.Irakleio B.Athens C.Thessaloniki D.Florina
Energycostin€
Thetotal(annual)energycost ineachclimaticzoneofGreeceandperuseandsystem
AHU-AWHP AWHP-FCUs SPLIUs AAVRF
AHU-WWHP WWHP-FCUs WΑVRV
EinB2017- 6th InternationalConference“ENERGYinBUILDINGS2017”
EnergyCost=EnergyconsumptionxCostofenergy**Costofenergy=0,165€/kwh*Source:PowerpubliccorporationS.A.- Hellas– DEI,2015

Results– EnvironmentalimpactsFuel CO2 emissions(kgCO2/kWh)
Oil 0,298
Natural gas 0,212
Biomass- Pellet 0,027
Electricity* 1,120
ELECTRICITYPRODUCTIONFROM* PARTICIPATION (%)
COAL 47,69
OIL 8,20
NATURALGAS 23,93
R.E.S 10,55
LARGEHYDRO 6,21
INTERCONNECTIONS 3,42
*Source:PowerpubliccorporationS.A.- Hellas– DEI,2015
WAVRV AAVRF SPLIUs AHU-AWHP
AWHP-FCUs
AHU-WWHP
WWHP-FCUs
kgofR410A 21.2 15.0 10.5 9.9 8.8 7.9 6.8
0.0
5.0
10.0
15.0
20.0
25.0
Refrigeran
tR41
0Ain(k
g)
Contentofrefrigerantfluid(R410A)persystem
EinB2017- 6th InternationalConference“ENERGYinBUILDINGS2017”
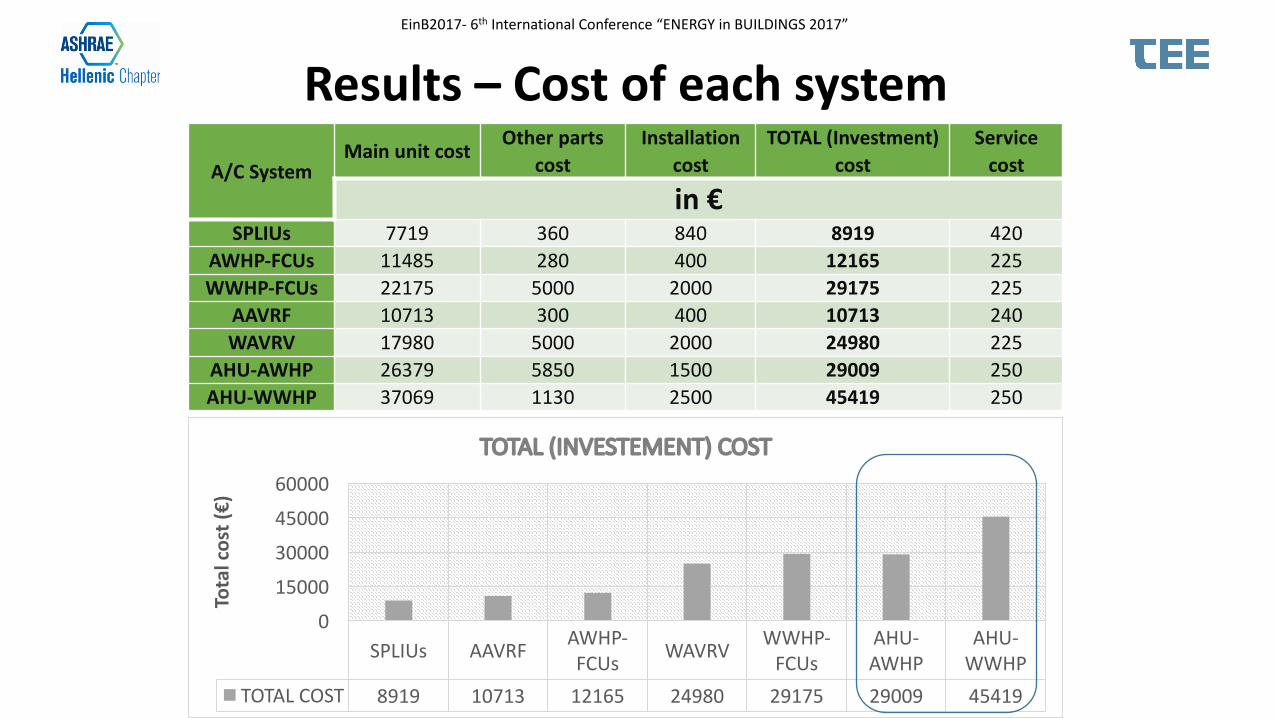
Results– CostofeachsystemA/CSystem
MainunitcostOtherparts
costInstallation
costTOTAL(Investment)
costServicecost
in€SPLIUs 7719 360 840 8919 420
AWHP-FCUs 11485 280 400 12165 225WWHP-FCUs 22175 5000 2000 29175 225
AAVRF 10713 300 400 10713 240WAVRV 17980 5000 2000 24980 225
AHU-AWHP 26379 5850 1500 29009 250AHU-WWHP 37069 1130 2500 45419 250
SPLIUs AAVRF AWHP-FCUs WAVRV WWHP-
FCUsAHU-AWHP
AHU-WWHP
TOTALCOST 8919 10713 12165 24980 29175 29009 45419
0
15000
30000
45000
60000
Totalcost(€)
TOTAL(INVESTEMENT)COST
EinB2017- 6th InternationalConference“ENERGYinBUILDINGS2017”
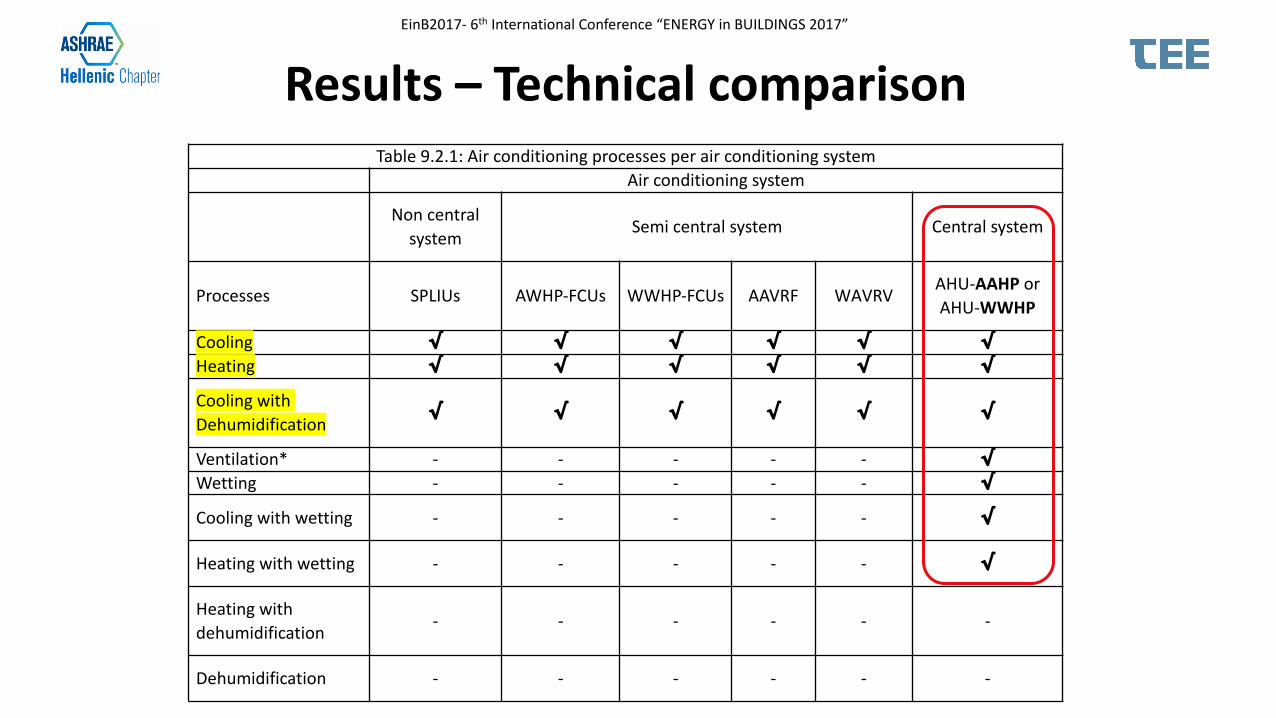
Results– TechnicalcomparisonTable9.2.1:Airconditioningprocessesperairconditioningsystem
Airconditioningsystem
Noncentralsystem
Semicentralsystem Centralsystem
Processes SPLIUs AWHP-FCUs WWHP-FCUs AAVRF WΑVRVAHU-AAHPorAHU-WWHP
Cooling √ √ √ √ √ √Heating √ √ √ √ √ √
CoolingwithDehumidification
√ √ √ √ √ √
Ventilation* - - - - - √Wetting - - - - - √
Coolingwithwetting - - - - - √
Heatingwithwetting - - - - - √
Heatingwithdehumidification
- - - - - -
Dehumidification - - - - - -
EinB2017- 6th InternationalConference“ENERGYinBUILDINGS2017”
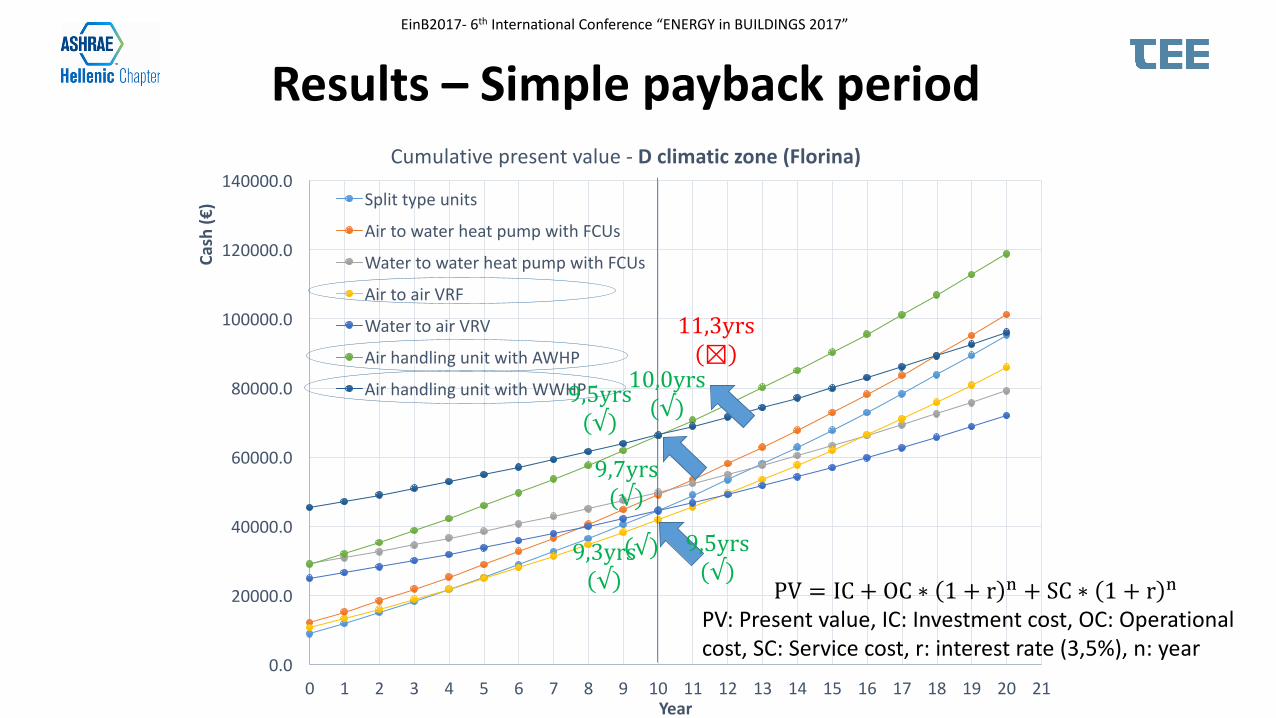
Results– Simplepaybackperiod
0.0
20000.0
40000.0
60000.0
80000.0
100000.0
120000.0
0 1 2 3 4 5 6 7 8 9 10 11 12 13 14 15 16 17 18 19 20 21
Cash(€
)
Year
Cumulativepresentvalue- Αclimaticzone(Irakleio)
SplittypeairconditionersAirtowaterheatpumpWatertowaterheatpumpAirtoairVRFsystemWatertoairVRFsystemAHUwithairtowaterheatpumpAHUwithwatertowaterheatpump
0.0
20000.0
40000.0
60000.0
80000.0
100000.0
120000.0
140000.0
0 1 2 3 4 5 6 7 8 9 10 11 12 13 14 15 16 17 18 19 20 21
Cash(€
)
Year
Cumulativepresentvalue- Bclimaticzone(Athens)
SPLIUsAirtowaterheatpumpWatertowaterheatpumpAirtoairVRFsystemWatertoairVRFsystemAHUwithairtowaterheatpumpAHUwithwatertowaterheatpump
0.0
20000.0
40000.0
60000.0
80000.0
100000.0
120000.0
140000.0
0 1 2 3 4 5 6 7 8 9 10 11 12 13 14 15 16 17 18 19 20 21
Cash(€
)
Year
Cumulativepresentvalue- Cclimaticzone(Thessaloniki)
SplittypeairconditionersAirtowaterheatpumpWatertowaterheatpumpAirtoairVRFsystemWatertoairVRFsystemAHUwithairtowaterheatpumpAHUwithwatertowaterheatpump
0.0
20000.0
40000.0
60000.0
80000.0
100000.0
120000.0
140000.0
0 1 2 3 4 5 6 7 8 9 10 11 12 13 14 15 16 17 18 19 20 21
Cash(€
)
Year
Cumulativepresentvalue- Dclimaticzone(Florina)
Splittypeunits
AirtowaterheatpumpwithFCUs
WatertowaterheatpumpwithFCUs
AirtoairVRF
WatertoairVRV
AirhandlingunitwithAWHP
AirhandlingunitwithWWHP
PV = IC + OC ∗ 1 + r , + SC ∗ 1 + r ,
PV:Presentvalue,IC:Investmentcost,OC:Operationalcost,SC:Servicecost,r:interestrate(3,5%),n:year
11,3yrs(⊠)
9,3yrs(√)
9,5yrs(√)
9,5yrs(√)
9,7yrs(√)
10,0yrs(√)
(√)
EinB2017- 6th InternationalConference“ENERGYinBUILDINGS2017”
Conclusions• A parametric comparative study of seven types of air conditioning systemsimplemented in a reference floor of an office building in the four climaticzones of Greece was carried out.• Annual thermal building loads are about the same independent the climaticzone.• Simulation of system operation is necessary since the results aren’tpredictable. The climatic zone with the highest thermal loads doesn’tinvolve the highest energy consumption. While maximum cooling loadsoccur in zone Α, for air source systems maximum energy consumption incooling occurs in zone B.• Climatic zone B has the highest annual (cooling & heating) energyconsumptions and this is pronounced in the case of systems consuming moreenergy. Climatic zone C is second, zone D is third and the zone with the leastenergy consumption is A (B<C<D<A).
EinB2017- 6th InternationalConference“ENERGYinBUILDINGS2017”
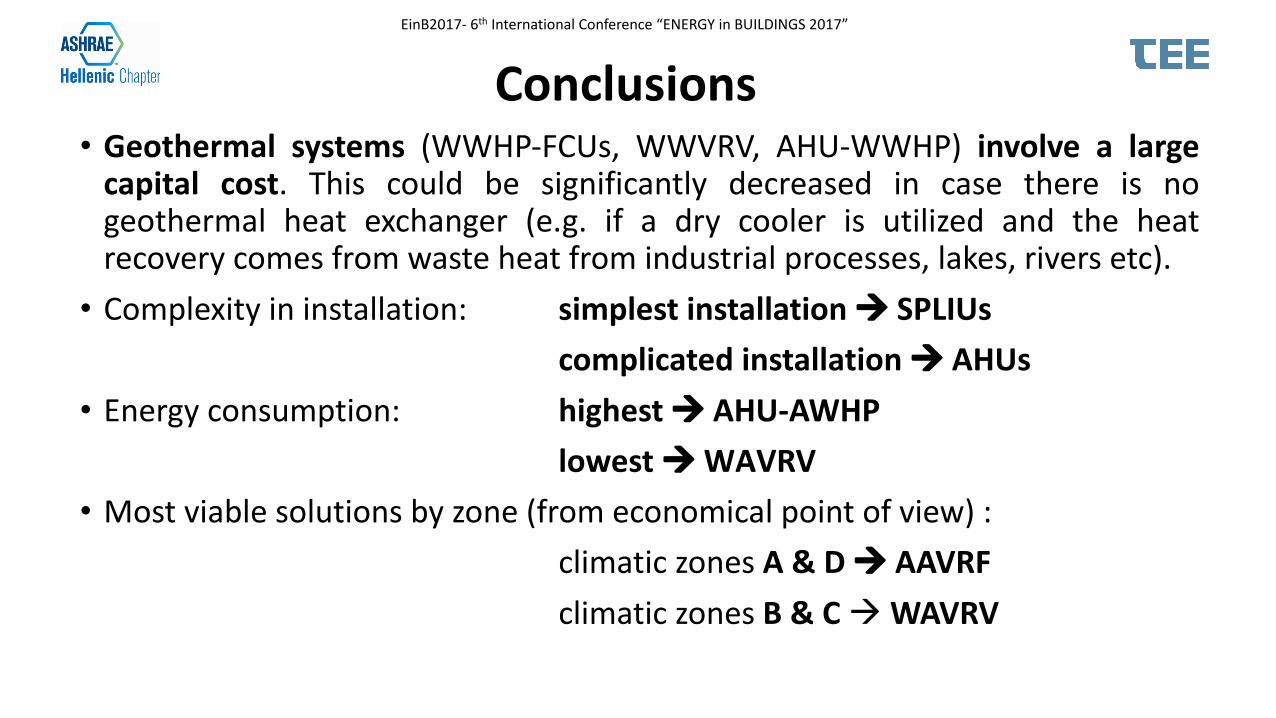
Conclusions• Geothermal systems (WWHP-FCUs, WWVRV, AHU-WWHP) involve a largecapital cost. This could be significantly decreased in case there is nogeothermal heat exchanger (e.g. if a dry cooler is utilized and the heatrecovery comes from waste heat from industrial processes, lakes, rivers etc).• Complexity in installation: simplest installationà SPLIUs
complicated installationà AHUs• Energy consumption: highestà AHU-AWHP
lowestàWΑVRV• Most viable solutions by zone (from economical point of view) :
climatic zones A & Dà AAVRFclimatic zones B & CàWAVRV
EinB2017- 6th InternationalConference“ENERGYinBUILDINGS2017”
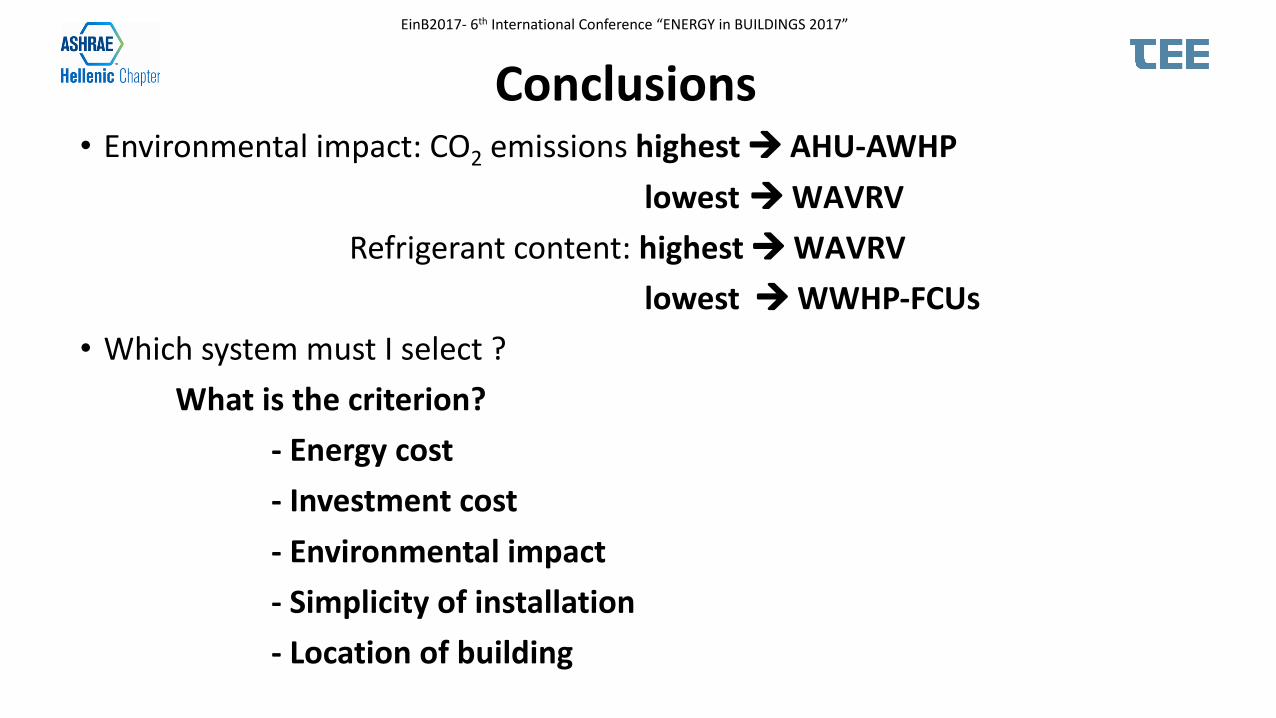
Conclusions• Environmental impact: CO2 emissions highestà AHU-AWHP
lowest àWΑVRVRefrigerant content: highestàWΑVRV
lowest àWWHP-FCUs• Which system must I select ?
What is the criterion?- Energy cost- Investment cost- Environmental impact- Simplicity of installation- Location of building
EinB2017- 6th InternationalConference“ENERGYinBUILDINGS2017”
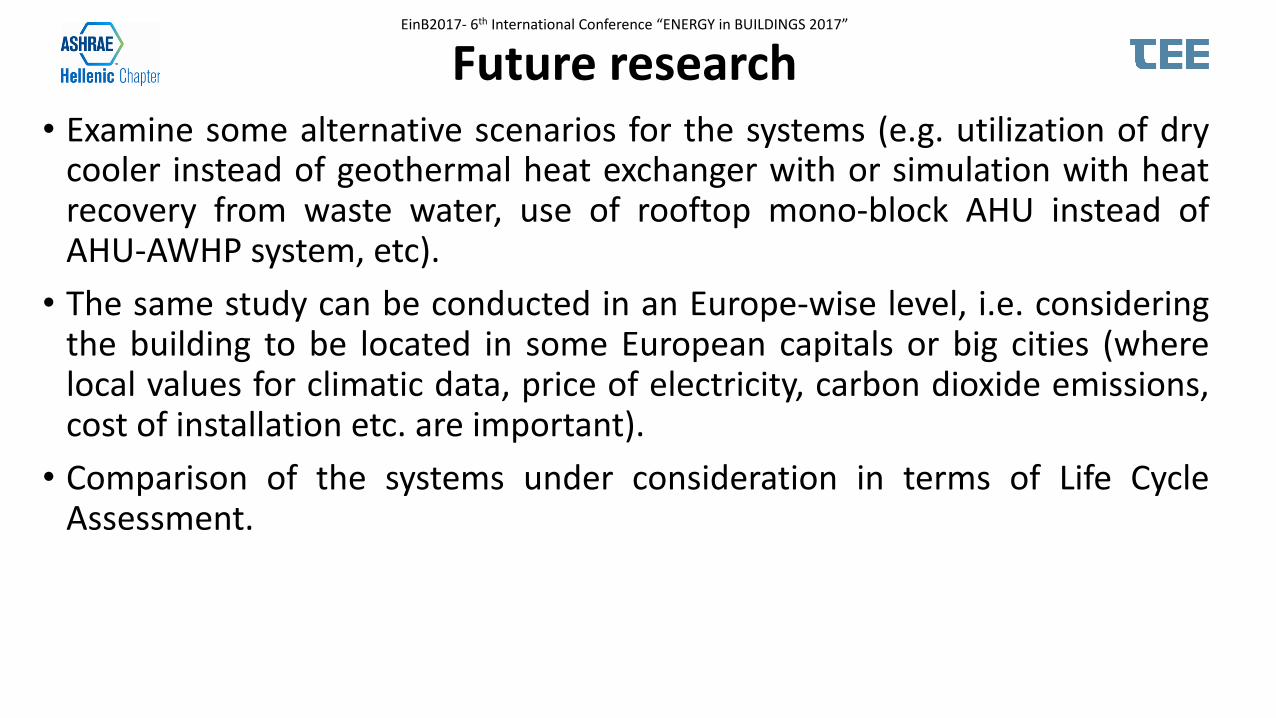
Futureresearch• Examine some alternative scenarios for the systems (e.g. utilization of drycooler instead of geothermal heat exchanger with or simulation with heatrecovery from waste water, use of rooftop mono-block AHU instead ofAHU-AWHP system, etc).• The same study can be conducted in an Europe-wise level, i.e. consideringthe building to be located in some European capitals or big cities (wherelocal values for climatic data, price of electricity, carbon dioxide emissions,cost of installation etc. are important).• Comparison of the systems under consideration in terms of Life CycleAssessment.
EinB2017- 6th InternationalConference“ENERGYinBUILDINGS2017”


![[O] cOmpaniessavarinocompanies.com/content/documents/bids... · hvac general notes hvac abbreviations hvac ductwork symbols hvac control symbols chaintreuil jensen stark architectural](https://img.dokumen.tips/doc/110x75/5ae5a13f7f8b9a29048c7dfa/o-compan-general-notes-hvac-abbreviations-hvac-ductwork-symbols-hvac-control-symbols.jpg)