Embed Size (px)
Citation preview

Comparative quantitative evaluation of the XIAP, survivin & Ki67 transcript levels in urine & tissue
samples of bladder cancer patients

Introduction
• Bladder cancer (BCa)- 5th commonest cancer in
European men & 6th leading cause of death
• Cystoscopy & urine cytology - current gold
standards for diagnosis & surveillance of BCa
• Ideal tumour marker for non-invasive diagnosis &
surveillance does not yet exist

Introduction
• Survivin
inhibitor of apoptosis protein (IAP) that is selectively over-
expressed in most human malignancies
• Objectives
– determine suitability of survivin as diagnostic,
surveillance (and prognostic) marker of BCa
– compare the utility of survivin to other potential tumour
markers e.g. Ki67 and XIAP

Materials & Methods
• Prospective study
• Single, tertiary level referral centre
• January - June 2006
• Inclusion criteria– patients undergoing transurethral resection (TUR) for
newly diagnosed BCa, recurrent BCa & cystoscopically
suspicious bladder lesions

Materials & Methods
• Exclusion criteria
– Patients with PCa, IDC, UTI
• Controls
– BPH patients
– Cystitis patients
– Healthy volunteers

Materials & Methods
• BCa patients
– Pre-operative urine sample
– Intra-operative tumour tissue & “normal appearing”
bladder mucosa
– Post-operative urine sample (1 POD)
– Above repeated for every session of TUR
• Controls
– 1 urine sample from each
Materials & Methods
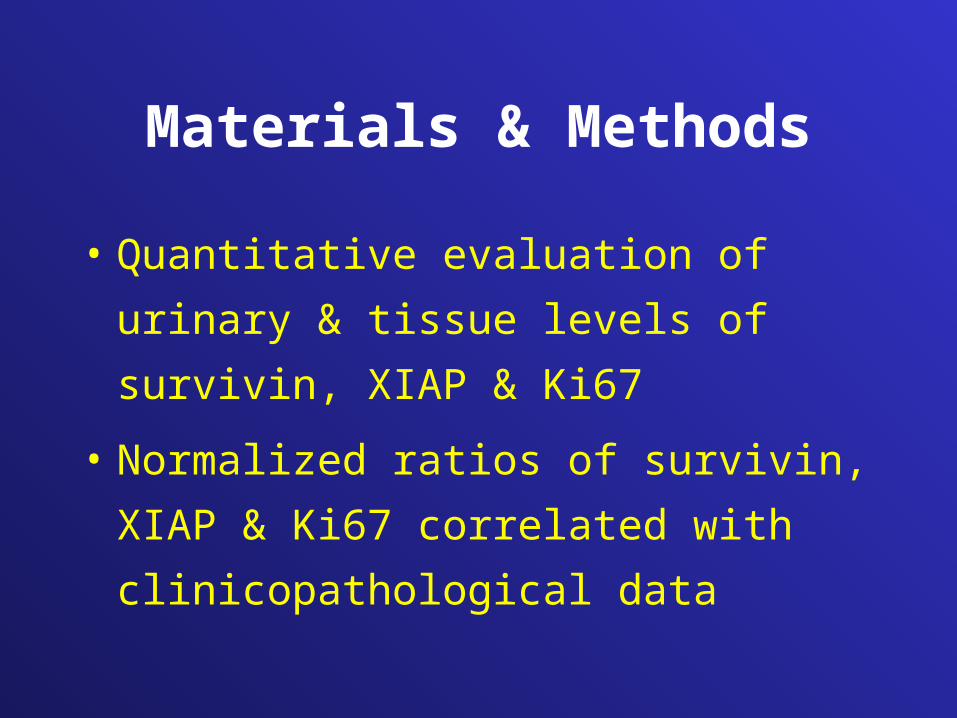
• Quantitative evaluation of urinary & tissue
levels of survivin, XIAP & Ki67
• Normalized ratios of survivin, XIAP &
Ki67 correlated with clinicopathological
data

Results
• Reference genes used – HPRT & TBP
• Negative correlation between reference gene
expression & urinary contamination by RBCs &
WBCs

BCa patients 65 recruited
6 pts with both BCa & Pca, excluded from analysis
> 59 pts analysed
Age (median)= 69yrs (34 – 89)
M:F= 39: 20 (66.1% : 33.9%)
Newly dx: BCa recurr= 54: 5 (91.5% : 8.5%)
PSA (median; 36 pts)= 0.90 (0.16 – 12.54)

BCa patients
Stage @ diagnosis (59)• No tumour (11) 18.6% • Superficial (38) = Ta+T1 64.5%• Invasive (10) = T2 16.9%
Grade @ diagnosis (59) • No tumour (11) 18.6%• Low (14) = G1 23.8%• High (34) = G2+G3 57.6%

BCa patients
• cis– Pos: neg= 5: 54 (8.5% : 91.5%)– All with cis harbour high grade (G2/ G3) disease as well
• Cytology
– Sensitivity= 65.2%; Specificity= 80.0%– PPV= 83.3%; NPV= 60.0%
benign atypia low high NA
9 (15.3%) 2 (3.3%) 9 (15.3%) 18 (30.5%) 21 (35.6%)

BCa patients
• 59 primary TURBT
42 second op (33 sec TUR, 9 cystec)
8 third op (6 tertiary TUR, 2 cystec)

Controls
BPH Cystitis Healthy
53 13 27
68 yrs (52-85) 64 yrs (19-85) 31 yrs (18-59)
PSA median 2.9 (0.3 – 33.9)
M : F3 (23.1%) :10 (76.9%)
M : F7 (25.9 %) :20 (74.1 %)

Tumor markers between BCa patients & controls
Clinical diagnosis
Ki67/
HPRT
Ki67/
TBP
XIAP/
HPRT
XIAP/
TBP
SVV/
HPRT
SVV/
TBP
Bca (48)(positive histo)
0.82 1.96 28.33 47.25 1.50 2.59
No tumor (11)(negative histo)
0.52 1.73 14.74 37.65 1.11 1.23
BPH (53) 0.40 1.02 19.29 45.65 1.08 2.29
Cystitis (13) 0.79 0.31 73.98 42.44 1.35 0.56
Healthy (27) 0.00 0.00 39.81 17.32 2.71 3.14
Median values presented

Ki67
Verarbeitete Fälle
34 70,8% 14 29,2% 48 100,0%
11 100,0% 0 ,0% 11 100,0%
41 77,4% 12 22,6% 53 100,0%
12 92,3% 1 7,7% 13 100,0%
12 44,4% 15 55,6% 27 100,0%
UrineBT
NT
BPH
Cystitis
Healthy
Ki67/HPRT
N Prozent N Prozent N Prozent
Gültig Fehlend Gesamt
Fälle
BT NT BPH Cystitis Healthy
Urine
0
1
2
3
4
5
6
Ki6
7/H
PR
T
52
98
66
67
29
53
100
81
76
103
125
146
Verarbeitete Fälle
36 75,0% 12 25,0% 48 100,0%
11 100,0% 0 ,0% 11 100,0%
44 83,0% 9 17,0% 53 100,0%
13 100,0% 0 ,0% 13 100,0%
16 59,3% 11 40,7% 27 100,0%
UrineBT
NT
BPH
Cystitis
Healthy
Ki67/TBP
N Prozent N Prozent N Prozent
Gültig Fehlend Gesamt
Fälle
BT NT BPH Cystitis Healthy
Urine
0
2
4
6
8
10
Ki6
7/T
BP
20
40
53
100
43
10
118
93
103
81
98
125
76
67
60

XIAP
Verarbeitete Fälle
34 70,8% 14 29,2% 48 100,0%
11 100,0% 0 ,0% 11 100,0%
41 77,4% 12 22,6% 53 100,0%
12 92,3% 1 7,7% 13 100,0%
9 33,3% 18 66,7% 27 100,0%
UrineBT
NT
BPH
Cystitis
Healthy
XIAP/HPRT
N Prozent N Prozent N Prozent
Gültig Fehlend Gesamt
Fälle
BT NT BPH Cystitis Healthy
Urine
0
25
50
75
100
125
XIA
P/H
PR
T
39
17 53
99
23
41
46
57
125
79
74
92
86
69
63
Verarbeitete Fälle
36 75,0% 12 25,0% 48 100,0%
11 100,0% 0 ,0% 11 100,0%
44 83,0% 9 17,0% 53 100,0%
13 100,0% 0 ,0% 13 100,0%
10 37,0% 17 63,0% 27 100,0%
UrineBT
NT
BPH
Cystitis
Healthy
XIAP/TBP
N Prozent N Prozent N Prozent
Gültig Fehlend Gesamt
Fälle
BT NT BPH Cystitis Healthy
Urine
0
100
200
300
XIA
P/T
BP
23
17
121
7
25
41
57
99
74
125
79
92
104
86
94
62
63
69

Survivin
Verarbeitete Fälle
26 54,2% 22 45,8% 48 100,0%
8 72,7% 3 27,3% 11 100,0%
27 50,9% 26 49,1% 53 100,0%
5 38,5% 8 61,5% 13 100,0%
10 37,0% 17 63,0% 27 100,0%
UrineBT
NT
BPH
Cystitis
Healthy
SVV/HPRT
N Prozent N Prozent N Prozent
Gültig Fehlend Gesamt
Fälle
BT NT BPH Cystitis Healthy
Urine
0
2
4
6
8
10
12
SV
V/H
PR
T
103
130
29
46
74
125
Verarbeitete Fälle
27 56,3% 21 43,8% 48 100,0%
8 72,7% 3 27,3% 11 100,0%
26 49,1% 27 50,9% 53 100,0%
5 38,5% 8 61,5% 13 100,0%
14 51,9% 13 48,1% 27 100,0%
UrineBT
NT
BPH
Cystitis
Healthy
SVV/TBP
N Prozent N Prozent N Prozent
Gültig Fehlend Gesamt
Fälle
BT NT BPH Cystitis Healthy
Urine
0
2
4
6
8
10
12
SV
V/T
BP
29
25
93
74
125
133

Tumor markers vs BCa stage
BT stage @ pri TUR (59)
Ki67/
HPRT
Ki67/
TBP
XIAP/
HPRT
XIAP/
TBP
SVV/
HPRT
SVV/
TBP
No tumor (11)
0.52 1.73 14.74 37.65 1.11 1.23
Superficial (38)
0.82 2.05 22.02 50.21 1.48 2.65
Invasive (10)
1.79 2.84 48.9 63.35 1.51 1.64
Median values presented

Ki67
Verarbeitete Fälle
11 100,0% 0 ,0% 11 100,0%
25 65,8% 13 34,2% 38 100,0%
9 90,0% 1 10,0% 10 100,0%
BT stageNT
superficial
invasive
Ki67/HPRT
N Prozent N Prozent N Prozent
Gültig Fehlend Gesamt
Fälle
NT superficial invasive
Bt stage
0
1
2
3
4
5
6
Ki6
7 /
HP
RT
4
5
34
Verarbeitete Fälle
11 100,0% 0 ,0% 11 100,0%
27 71,1% 11 28,9% 38 100,0%
9 90,0% 1 10,0% 10 100,0%
BT stageNT
superficial
invasive
Ki67/TBPN Prozent N Prozent N Prozent
Gültig Fehlend Gesamt
Fälle
NT superficial invasive
Bt stage
0
3
6
9
12
15
Ki6
7 /
TB
P
5
43
46
34 52

XIAP
Verarbeitete Fälle
11 100,0% 0 ,0% 11 100,0%
25 65,8% 13 34,2% 38 100,0%
9 90,0% 1 10,0% 10 100,0%
BT stageNT
superficial
invasive
XIAP/HPRT
N Prozent N Prozent N Prozent
Gültig Fehlend Gesamt
Fälle
NT superficial invasive
Bt stage
0
50
100
150
200
XIA
P /
HP
RT
5
42
9
23
44
58
Verarbeitete Fälle
11 100,0% 0 ,0% 11 100,0%
27 71,1% 11 28,9% 38 100,0%
9 90,0% 1 10,0% 10 100,0%
BT stageNT
superficial
invasive
XIAP/TBP
N Prozent N Prozent N Prozent
Gültig Fehlend Gesamt
Fälle
NT superficial invasive
BT stage
0
100
200
300
400
XIA
P /
TB
P
9
23
16
30
44

Survivin
Verarbeitete Fälle
8 72,7% 3 27,3% 11 100,0%
19 50,0% 19 50,0% 38 100,0%
7 70,0% 3 30,0% 10 100,0%
BT stageNT
superficial
invasive
SVV/HPRT
N Prozent N Prozent N Prozent
Gültig Fehlend Gesamt
Fälle
NT superficial invasive
BT stage
0
1
2
3
4
SV
V /
HP
RT
34
58
Verarbeitete Fälle
8 72,7% 3 27,3% 11 100,0%
20 52,6% 18 47,4% 38 100,0%
7 70,0% 3 30,0% 10 100,0%
BT stageNT
superficial
invasive
SVV/TBPN Prozent N Prozent N Prozent
Gültig Fehlend Gesamt
Fälle
NT superficial invasive
BT stage
0
2
4
6
8
10
12
SV
V /
TB
P
9 43
46
34
30

Tumor markers vs BCa grade
BT grade @ pri TUR (59)
Ki67/
HPRT
Ki67/
TBP
XIAP/
HPRT
XIAP/
TBP
SVV/
HPRT
SVV/
TBP
No tumor (11)
0.52 1.73 14.74 37.65 1.11 1.23
Low grade (14)
0.60 0.73 33.60 38.19 1.61 2.70
High grade (34)
0.91 2.18 23.35 81.29 1.20 2.34
Median values presented

Ki67
Verarbeitete Fälle
11 100,0% 0 ,0% 11 100,0%
11 73,3% 4 26,7% 15 100,0%
23 69,7% 10 30,3% 33 100,0%
BT gradeNT
low
high
Ki67/HPRT
N Prozent N Prozent N Prozent
Gültig Fehlend Gesamt
Fälle
NT low high
BT grade
0
1
2
3
4
5
6
Ki6
7 /
HP
RT
4
48
5
40
Verarbeitete Fälle
11 100,0% 0 ,0% 11 100,0%
11 73,3% 4 26,7% 15 100,0%
25 75,8% 8 24,2% 33 100,0%
BT gradeNT
low
high
Ki67/TBPN Prozent N Prozent N Prozent
Gültig Fehlend Gesamt
Fälle
NT low high
BT grade
0
5
10
15
Ki6
7 /
TB
P
5
23
48
53

XIAP
Verarbeitete Fälle
11 100,0% 0 ,0% 11 100,0%
11 73,3% 4 26,7% 15 100,0%
23 69,7% 10 30,3% 33 100,0%
BT gradeNT
low
high
XIAP /HPRT
N Prozent N Prozent N Prozent
Gültig Fehlend Gesamt
Fälle
NT low high
Bt grade
0
25
50
75
100
125
XIA
P /
HP
RT
5 32
56
9
24
26
Verarbeitete Fälle
11 100,0% 0 ,0% 11 100,0%
11 73,3% 4 26,7% 15 100,0%
25 75,8% 8 24,2% 33 100,0%
BT gradeNT
low
high
XIAP/TBP
N Prozent N Prozent N Prozent
Gültig Fehlend Gesamt
Fälle
NT low high
BT grade
0
100
200
300
400
500
XIA
P /
TB
P
9
24
28
37

Survivin
Verarbeitete Fälle
8 72,7% 3 27,3% 11 100,0%
6 40,0% 9 60,0% 15 100,0%
20 60,6% 13 39,4% 33 100,0%
BT gradeNT
low
high
SVV/HPRT
N Prozent N Prozent N Prozent
Gültig Fehlend Gesamt
Fälle
NT low high
BT grade
0
1
2
3
4
SV
V /
HP
RT
26
40
Verarbeitete Fälle
8 72,7% 3 27,3% 11 100,0%
5 33,3% 10 66,7% 15 100,0%
22 66,7% 11 33,3% 33 100,0%
BT gradeNT
low
high
SVV/TBPN Prozent N Prozent N Prozent
Gültig Fehlend Gesamt
Fälle
NT low high
BT grade
0
5
10
15
20
SV
V /
TB
P
9
14
12
40
37

Tumor markers between first & second TURBT
BT paired urine samples (33)
Ki67/
HPRT
Ki67/
TBP
XIAP/
HPRT
XIAP/
TBP
SVV/
HPRT
SVV/
TBP
Op1 0.69 1.81 21.63 55.95 1.34 2.57
Op2 0 0 25.19 83.45 0.95 2.25
Median values presented

Ki67
Verarbeitete Fälle
23 69,7% 10 30,3% 33 100,0%
22 66,7% 11 33,3% 33 100,0%
Urineprimäre TURBT
sekundäreTURBT
Ki67/HPRTN Prozent N Prozent N Prozent
Gültig Fehlend Gesamt
Fälle
primäre TURBT sekundäre TURBT
Urine
0,0
0,5
1,0
1,5
2,0
2,5
Ki6
7 /
HP
RT
28
31
21
43
60
39
Verarbeitete Fälle
25 75,8% 8 24,2% 33 100,0%
23 69,7% 10 30,3% 33 100,0%
Urineprimäre TURBT
sekudäre TURBT
Ki67/TBPN Prozent N Prozent N Prozent
Gültig Fehlend Gesamt
Fälle
primäre TURBT sekundäre TURBT
Urine
0
1
2
3
4
Ki6
7 /
TB
P
27
28
31
21
43
60
39

XIAP
Verarbeitete Fälle
23 69,7% 10 30,3% 33 100,0%
22 66,7% 11 33,3% 33 100,0%
Urineprimäre TURBT
sekundäreTURBT
XIAP/HPRTN Prozent N Prozent N Prozent
Gültig Fehlend Gesamt
Fälle
primäre TURBT sekundäre TURBT
Urine
0
50
100
150
200
250
300
XIA
P /
HP
RT
11
55
46
30
61
41
Verarbeitete Fälle
25 75,8% 8 24,2% 33 100,0%
23 69,7% 10 30,3% 33 100,0%
Urineprimäre TURBT
sekundäreTURBT
XIAP/TBPN Prozent N Prozent N Prozent
Gültig Fehlend Gesamt
Fälle
primäre TURBT sekundäre TURBT
Urine
0
100
200
300
400
XIA
P /
TB
P
11
6
17
30
41
61
40

Survivin
Verarbeitete Fälle
19 57,6% 14 42,4% 33 100,0%
14 42,4% 19 57,6% 33 100,0%
Urineprimäre TURBT
sekundäreTURBT
SVV/HPRTN Prozent N Prozent N Prozent
Gültig Fehlend Gesamt
Fälle
primäre TURBT sekundäre TURBT
Urine
0,0
0,5
1,0
1,5
2,0
2,5
SV
V /
HP
RT
11
31
46
21
50
61
Verarbeitete Fälle
20 60,6% 13 39,4% 33 100,0%
14 42,4% 19 57,6% 33 100,0%
Urineprimäre TURBT
sekundäre TURBT
SVV/TBP
N Prozent N Prozent N Prozent
Gültig Fehlend Gesamt
Fälle
primäre TURBT sekundäre TURBT
Urine
0
2
4
6
8
SV
V /
TB
P
11
46
50
31
21
17
61

Tumor markers for unpaired tissue samples
tissue samples
Ki67/
HPRT
Ki67/
TBP
XIAP/
HPRT
XIAP/
TBP
SVV/
HPRT
SVV/
TBP
Tumor tissue (26)
1.55 5.08 6.13 13.98 0.41 1.03
Tumor free (27)
1.24 1.23 8.25 11.92 0.26 0.35
Median values presented

Ki67
Verarbeitete Fälle
26 100,0% 0 ,0% 26 100,0%
27 100,0% 0 ,0% 27 100,0%
HistologieTu
Tf
Ki67/HPRT
N Prozent N Prozent N Prozent
Gültig Fehlend Gesamt
Fälle
Tf Tu
Histologie
0
1
2
3
4
5
6
Ki6
7 /
HP
RT
20
26
17
21
35
52
Verarbeitete Fälle
26 100,0% 0 ,0% 26 100,0%
27 100,0% 0 ,0% 27 100,0%
HistologieTu
Tf
Ki67/TBP
N Prozent N Prozent N Prozent
Gültig Fehlend Gesamt
Fälle
Tf Tu
Histologie
0
3
6
9
12
15
Ki6
7 /
TB
P
26
17
5235

XIAP
Verarbeitete Fälle
26 100,0% 0 ,0% 26 100,0%
27 100,0% 0 ,0% 27 100,0%
HistologieTu
Tf
XIAP/HPRT
N Prozent N Prozent N Prozent
Gültig Fehlend Gesamt
Fälle
Tf Tu
Histologie
0
5
10
15
20
XIA
P /
HP
RT
52
Verarbeitete Fälle
26 100,0% 0 ,0% 26 100,0%
27 100,0% 0 ,0% 27 100,0%
HistologieTu
Tf
XIAP/TBP
N Prozent N Prozent N Prozent
Gültig Fehlend Gesamt
Fälle
Tf Tu
Histologie
0
5
10
15
20
25
30
XIA
P /
TB
P
14
2
32
17
52

Survivin
Verarbeitete Fälle
26 100,0% 0 ,0% 26 100,0%
27 100,0% 0 ,0% 27 100,0%
HistologieTu
Tf
SVV/HPRT
N Prozent N Prozent N Prozent
Gültig Fehlend Gesamt
Fälle
Tf Tu
Histologie
0
0
1
2
2
SV
V /
HP
RT
53
21
17
45
52
35
Verarbeitete Fälle
26 100,0% 0 ,0% 26 100,0%
27 100,0% 0 ,0% 27 100,0%
HistologieTu
Tf
SVV/TBP
N Prozent N Prozent N Prozent
Gültig Fehlend Gesamt
Fälle
Tf Tu
Histologie
0
1
2
3
4
5
SV
V /
TB
P
45
17
52
35

Tumor markers for paired tissue samples
Paired tissue samples (13)
Ki67/
HPRT
Ki67/
TBP
XIAP/
HPRT
XIAP/
TBP
SVV/
HPRT
SVV/
TBP
Tumor tissue
1,73 5,99 6,42 13,61 0,53 1,11
Tumor free
1,52 2,01 8,22 14,26 0,35 0,41
Median values presented

Ki67
Verarbeitete Fälle
13 100,0% 0 ,0% 13 100,0%
13 100,0% 0 ,0% 13 100,0%
TissueTf
Tu
Ki67/HPRT
N Prozent N Prozent N Prozent
Gültig Fehlend Gesamt
Fälle
Tf Tu
Tissue
0
2
4
6
8
Ki6
7 /
HP
RT
10
16
Verarbeitete Fälle
13 100,0% 0 ,0% 13 100,0%
13 100,0% 0 ,0% 13 100,0%
TissueTf
Tu
Ki67/TBPN Prozent N Prozent N Prozent
Gültig Fehlend Gesamt
Fälle
Tf Tu
Tissue
0
2
4
6
8
10
12
Ki6
7 /
TB
P
4
16

XIAP
Verarbeitete Fälle
13 100,0% 0 ,0% 13 100,0%
13 100,0% 0 ,0% 13 100,0%
TissueTf
Tu
XIAP/HPRT
N Prozent N Prozent N Prozent
Gültig Fehlend Gesamt
Fälle
Tf Tf
Tissue
2
4
6
8
10
12
14
XIA
P /
HP
RT
15
Verarbeitete Fälle
13 100,0% 0 ,0% 13 100,0%
13 100,0% 0 ,0% 13 100,0%
TissueTf
Tu
XIAP/TBPN Prozent N Prozent N Prozent
Gültig Fehlend Gesamt
Fälle
Tf Tu
Tissue
0
5
10
15
20
XIA
P /
TB
P
19
12

Survivin
Verarbeitete Fälle
13 100,0% 0 ,0% 13 100,0%
13 100,0% 0 ,0% 13 100,0%
TissueTf
Tu
SVV/HPRT
N Prozent N Prozent N Prozent
Gültig Fehlend Gesamt
Fälle
Tf Tu
Tissue
0,0
0,5
1,0
1,5
2,0
SV
V /
HP
RT
21
16
10
Verarbeitete Fälle
13 100,0% 0 ,0% 13 100,0%
13 100,0% 0 ,0% 13 100,0%
TissueTf
Tu
SVV/TBPN Prozent N Prozent N Prozent
Gültig Fehlend Gesamt
Fälle
Tf Tu
Tissue
0
1
2
3
4
5
SV
V /
TB
P
21
16

Ratio Tu / Tf
Paired tissue samples (13)
Ki67/
HPRT
Ki67/
TBP
XIAP/
HPRT
XIAP/
TBP
SVV/
HPRT
SVV/
TBP
Median 3.32 3.39 0.72 0.71 1.67 2.66
>1 8 (61.5%)
10 (76.9%)
3 (23.1%)
6 (46.2%)
8 (61.5%)
8 (61.5%)
<1 5 (38.5%)
3 (23.1%)
10 (76.6%)
7 (53.8%)
5 (38.5%)
5 (38.5%)


![Hämophagozytische Lymphohistio zytose (HLH) · XLP-1 SH2D1A SAP HLH, assoziiert mit, ... XIAP/ BIRC4 XIAP HLH, Hypogammaglobulinämie, chronische hämorrhagische Kolitis [14] Interleukin-2](https://img.dokumen.tips/doc/110x75/5c82f6c509d3f2a1038cd4e1/haemophagozytische-lymphohistio-zytose-hlh-xlp-1-sh2d1a-sap-hlh-assoziiert.jpg)