Embed Size (px)
Citation preview

Comparative Proteome Analysis
Gagne et al. Proteome Sci. 2007

Main Goal:
Compare proteomics for two human epithelial ovarian cell lines in search for cancer biomarkers

Morphology of the two human epithelial ovarian cell lines
TOV-81D cells (low malignant) show a flat morphology similar to normal human ovarian epithelium (A)
TOV-112D cells (extremely aggressive) show a highly rounded morphology characteristic of highly transformed cell lines (B)

Traditional 2D-GE Proteomics Technique
• Obtain cell lysates
• Run 2D-GE for each sample (in triplicates)
• Compare the gels and spot over-expressed and/or under-expressed proteins
• Identify those proteins (for each spot):– Cut the spot and trypsinaze the protein– Run LS-MS– Identify at least two unique peptides

Advantages:
Disadvantages:
• Laborious and time consuming
• MW cut-off (6 – 250 kDa)
• Well established technique
• Visualization of the protein spots
• Detection of modified proteins

Detection of carbonylated (oxidized) proteins
A – 2D gel of total proteins from wild-type Arabidopsis seeds B – The indicated portion of the gel C, D, E – Revelation of carbonylated proteins with the anti-DNP immunoassay:
C, Dry mature seeds; D, Seeds incubated in water; E, Seeds incubated with salicylic acid (Job et al., 2005; Rajjou et al., 2006)

“Full digest” Proteomics Technique with iTRAQ Labeling
• Obtain cell lysates
• Trypsinaze each lysate
• Label each lysate with one iTRAQ reagent
• Combine samples (up to 4 lysates)
• Perform pre-fractionation (IEF, IEC)
• Run LC-MS (10-20 fractions)
• Identify and simultaneously quantify peptides and parent proteins
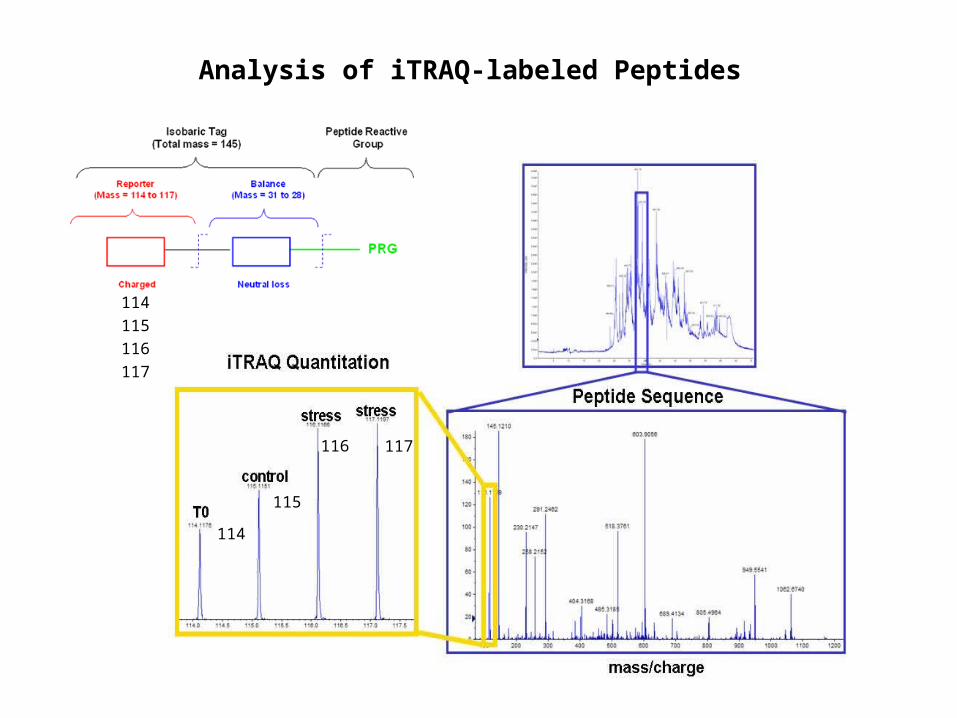
Analysis of iTRAQ-labeled Peptides
114
115
116
117
114
115
116 117

Advantages:
Disadvantages:
• Complex peptide mixtures
• Additional in vitro labeling step
• Additional pre-fractionation step
• No 2D gels, no MW cut-off
• Combine up to 4 digested samples
• Reliable quantitation

Representative 2D gel images for the two ovarian cell lines

Final Score:
2D GE/LC-MS – 65 (51) proteins
iTRAQ LC-MS – 37 (32) proteins
Crossover – 10 proteins

Conclusions:
Both approaches were successful in the biomarker search
Each approach has specific advantages and limitations
There is no easy way for proteomics studies…