Embed Size (px)
Citation preview

Duke et al Comparison of filters 1
Comparative Analysis of the Filtron and Biosand Water Filters
William F. Duke, MD,1* Rick Nordin2 and Asit Mazumder2 * Corresponding author; 1University of Victoria, Restoration of Natural Systems Program , Victoria, British Columbia, V8W 3N5 2University of Victoria, Department of Biology, P.O. Box 3020 STN CSC, Victoria, British Columbia, V8W 3N5 email addresses for authors: BSDuke ([email protected]), RNordin ([email protected]), AMazumder ([email protected]) Running Title: Comparison of filters

Duke et al Comparison of filters 2
Abstract
For many of the 1.1 billion people who now lack access to safe water, affordable water filters
designed for use in individual households provide a practical alternative to municipal water
treatment systems. Two of the most commonly promoted filters in developing countries are the
Filtron ceramic filter and the BioSand intermittent slow sand filter. To compare the performance
of these two filters, pond water was put through each filter for 30 consecutive days. Turbidity,
TOC, DOC, E. coli and total coliform counts were recorded daily for the source water and for the
filtered water from each filter. Flow rates and frequency of cleaning were also recorded for each
filter. Both filters lowered the turbidity, TOC, DOC, and bacterial counts significantly.The
Filtron filter was more effective in removing bacteria, but it was limited by flow rates of only 1-2
liters per hour as well as the need for frequent cleaning. The biosand filter produced flow rates of
about 20 liters per hour and did not require cleaning during the study period, but it was less
effective in removing bacteria.
Duke et al Comparison of filters 3
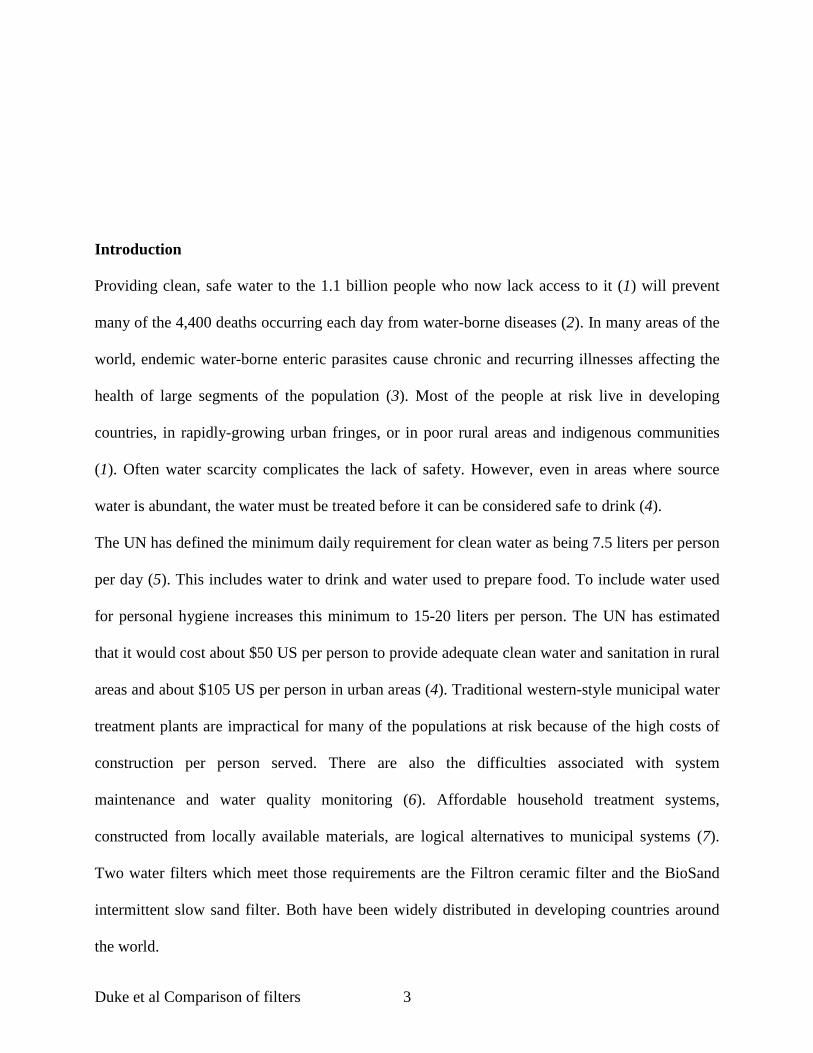
Introduction
Providing clean, safe water to the 1.1 billion people who now lack access to it (1) will prevent
many of the 4,400 deaths occurring each day from water-borne diseases (2). In many areas of the
world, endemic water-borne enteric parasites cause chronic and recurring illnesses affecting the
health of large segments of the population (3). Most of the people at risk live in developing
countries, in rapidly-growing urban fringes, or in poor rural areas and indigenous communities
(1). Often water scarcity complicates the lack of safety. However, even in areas where source
water is abundant, the water must be treated before it can be considered safe to drink (4).
The UN has defined the minimum daily requirement for clean water as being 7.5 liters per person
per day (5). This includes water to drink and water used to prepare food. To include water used
for personal hygiene increases this minimum to 15-20 liters per person. The UN has estimated
that it would cost about $50 US per person to provide adequate clean water and sanitation in rural
areas and about $105 US per person in urban areas (4). Traditional western-style municipal water
treatment plants are impractical for many of the populations at risk because of the high costs of
construction per person served. There are also the difficulties associated with system
maintenance and water quality monitoring (6). Affordable household treatment systems,
constructed from locally available materials, are logical alternatives to municipal systems (7).
Two water filters which meet those requirements are the Filtron ceramic filter and the BioSand
intermittent slow sand filter. Both have been widely distributed in developing countries around
the world.

Duke et al Comparison of filters 4
The Filtron was developed in 1981 by the Potters for Peace, a non-profit organization based in
the U.S. The final design was worked out by Ron Rivera, a ceramic artist in Nicaragua, during
the 1990's. The Filtron has been distributed in many countries in Central America and Southeast
Asia. It is illustrated in fig.1.
Figure 1: Filtron filter
The inner vessel is a ceramic pot formed in a mold which assures a standard size and shape. The
pot is made from a proscribed mix of clay and graded sawdust. During the firing process, the
sawdust burns creating a system of pores within the ceramic, allowing water to flow slowly
through the vessel wall. After the pot has been fired, its inner and outer walls are painted with a
colloidal silver solution. The silver anion in this solution acts as a bacteriostatic agent, enhancing
the filter's ability to remove bacteria (8). The pot holds seven liters and has a large lip so that it
can be suspended within a commonly-available 20 liter plastic bucket as shown in Figure 1. A
plastic tap is placed in the bucket near the bottom. The pots can be constructed in small factories,

Duke et al Comparison of filters 5
using locally available skills and materials. Quality control is performed by checking flow rates.
Pots producing more than two liters per hour or less than one are to be rejected (8).
The BioSand filter, illustrated in fig. 2 (9), is the design worked out by Dr David Manz at the
University of Calgary, also during the 1990's (10, 11).
Figure 2: Manz Biosand filter
The container is constructed from concrete formed in a mold. Gravel, followed by coarse sand
and then fine graded quartz sand, are layered in the container as shown. Source water is poured
through a diffuser plate to prevent flow disruption of the sand. The water level remains at 5 cm
above the sand and is determined by the level of the out flow spout. This assures that the sand
remains wet, even with intermittent filling of the reservoir. The capacity of the vessel from the
baseline water level to the lip of the container in the Manz design is about 20 liters, and the filter

Duke et al Comparison of filters 6
produces a flow rate of about 30-40 liters per hour. The biosand filter used in this study was also
designed by Dr. Manz, and is commercially available from Davnor. It functions according to the
same principles as the concrete design but is made for the commercial market. The model used is
the smallest and least expensive of those available from Davnor. The container is made of
durable plastic. The PVC plumbing is mounted to the outside of the container. The model used
has about 1/3 the capacity of the concrete design of Dr. Manz. Filtration occurs as a result of
mechanical trapping in the interstices created by the surface interfaces of the sand granules.
Adsorption of suspended substances to the surface of the sand granules also plays a significant
role. But the ability of the filter to remove bacteria, protozoa and parasites is enhanced by a
biologically active layer which develops in a micro-environment created near the interface of the
sand and the standing water (12). The standing water obtains oxygen by diffusion from the air at
its surface and is rich with nutrients trapped in the upper layers of the sand. This layer, known as
the schmutzdecke, (German, meaning "dirty blanket") is populated by an array of microbes which
apparently act as predators, consuming or inactivating pathogens introduced in the source water.
It takes from one to three weeks for the schmutzdecke to mature and function properly (13).
Both of these filters have been shown in multiple studies to be effective in removing, or
significantly lowering, the number of bacteria and parasites (8, 11, 14). There is also anecdotal
evidence that they have been effective in lowering the incidence of disease in families and in
communities where they are used (14, 15, 16). This study is designed to compare the overall
function of these two filters when exposed to identical source water for thirty consecutive days.
Materials and Methods
The Filtron filter used in the study was made in a factory in Nicaragua, which makes the filters
for local use and for export. The ceramic filter pot was shipped along with the outer plastic

Duke et al Comparison of filters 7
bucket, tap and lid. The biosand filter used was provided by Prostar Industries in Victoria, B.C.
which is the distributor for the commercially available line of plastic biosand filters made by
Davnor Water Treatment Technologies Ltd.
The source water samples were collected from seven different ponds in the greater Victoria area.
The source water samples were collected daily in 24 liter plastic containers. All water samples
were collected and processed by one examiner and handled in a similar manner. Each day a
single seven liter aliquot of source water was added to each filter. The total output from each was
recorded one hour later. Samples were then collected from the source water and from the filtered
water produced by each of the filters. Turbidity readings were obtained daily using a HACH
turbidimeter. TOC (total organic carbon) and DOC (dissolved organic carbon) data were obtained
using the Shimadzu TOC-V Total Carbon Analyzer at the University of Victoria Fresh Water
Research Laboratory. Data quality was checked with regular standard and blank samples. The E.
coli and total coliform bacterial analyses were performed at the Capitol Region District Water
Department laboratory using the membrane filtration method of bacteria counting.
At one week intervals, maximum flow rates were recorded for each filter. This was accomplished
by filling the reservoirs of the filters and then adding source water at 5 minute intervals so that
the reservoirs remained nearly full during the one hour sampling period. Total output of each
filter for that hour was then recorded as the maximum hourly flow rate. The filters were cleaned
when the hourly flow rate reached 1/2 of the initial flow rate. The amount of water used to clean
the filter was also recorded.
Results

Duke et al Comparison of filters 8
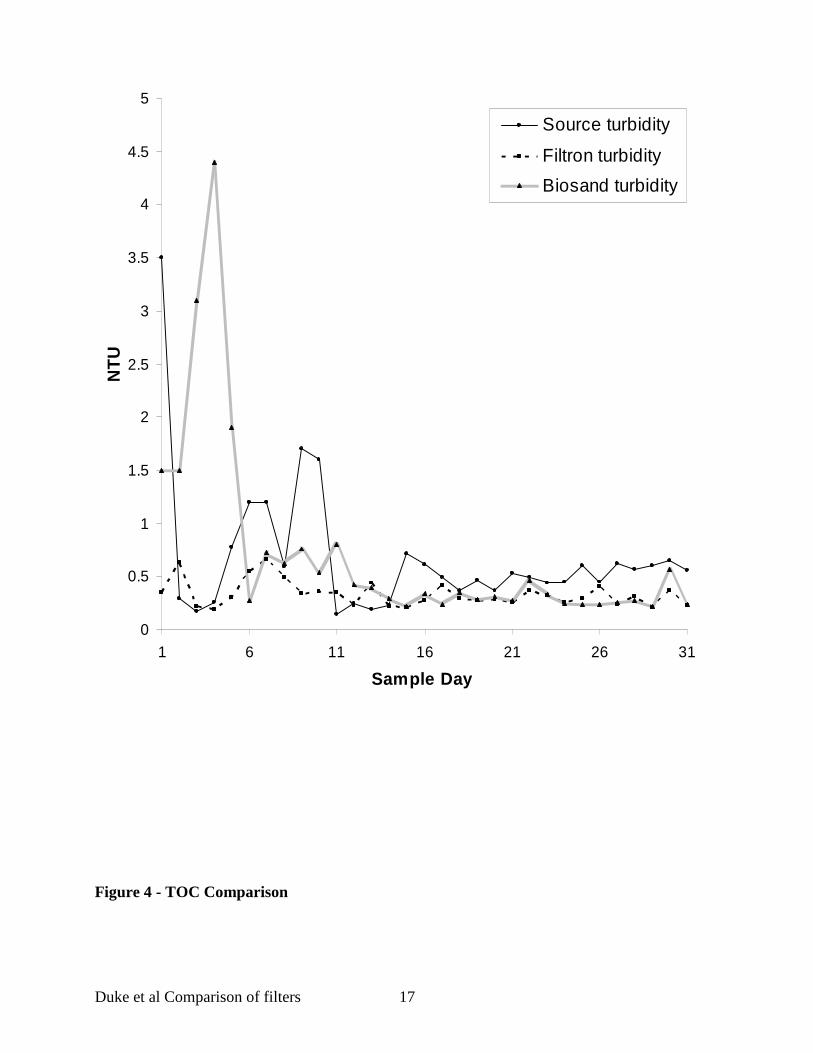
The turbidity and bacterial growth from the source water ponds are summarized in Figure 1. The
Filtron data is summarized in Figure 2. The Filtron was effective from the first day, removing
99% or 100% of the bacteria in 73% of the samples, and removing 90% or more of the bacteria in
97% of the samples. The level of contamination in the source water was not reflected in the
filtered water. The flow rates for the Filtron decreased rapidly with turbid source water, and the
pot required scrubbing more frequently as days passed. By the end of the study, the filter was
being scrubbed every other day (see Appendix 3). Each time the filter was cleaned, five liters of
filtered water was needed to properly rinse the pot inside and out during the scrubbing process.
The biosand filter removed 90% or more of the bacteria in only 31% of the samples. However,
the filter was functioning more consistently near the end of the study, perhaps indicating that the
biosand filter’s schmutzdecke was maturing by that time.
The flow rate of the biosand filter remained about the same, averaging around 18 liters per hour.
As a result, it was not cleaned during the study period. It is of note that the biosand samples
which were collected immediately following the weekly maximum flow rate process tended to
show less improvement than on other days, suggesting that at maximum flow rate, the
schmutzdecke's capacity to remove bacteria may have been exceeded.
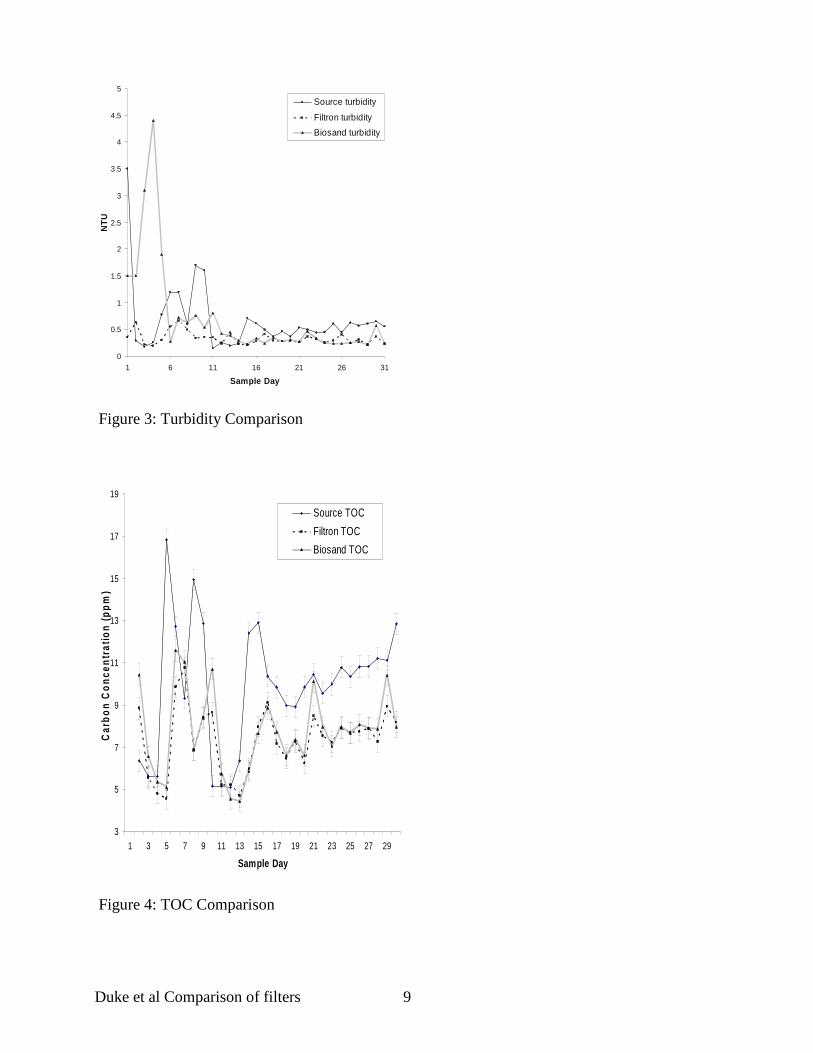
By the second half of the study, both filters were about equally effective in lowering turbidity,
TOC, and DOC levels (Fig. 3, 4 & 5).
Duke et al Comparison of filters 9
0
0.5
1
1.5
2
2.5
3
3.5
4
4.5
5
1 6 11 16 21 26 31
Sample Day
NT
USource turbidity
Filtron turbidity
Biosand turbidity
Figure 3: Turbidity Comparison
3
5
7
9
11
13
15
17
19
1 3 5 7 9 11 13 15 17 19 21 23 25 27 29
Sample Day
Car
bo
n C
on
cen
trat
ion
(p
pm
)
Source TOC
Filtron TOC
Biosand TOC
Figure 4: TOC Comparison

Duke et al Comparison of filters 10
3
5
7
9
11
13
15
17
1 3 5 7 9 11 13 15 17 19 21 23 25 27 29
Sample Day
Car
bo
n C
on
cen
trat
ion
(p
pm
)Source DOC
Filtron DOC
Biosand DOC
Figure 5: DOC Comparison
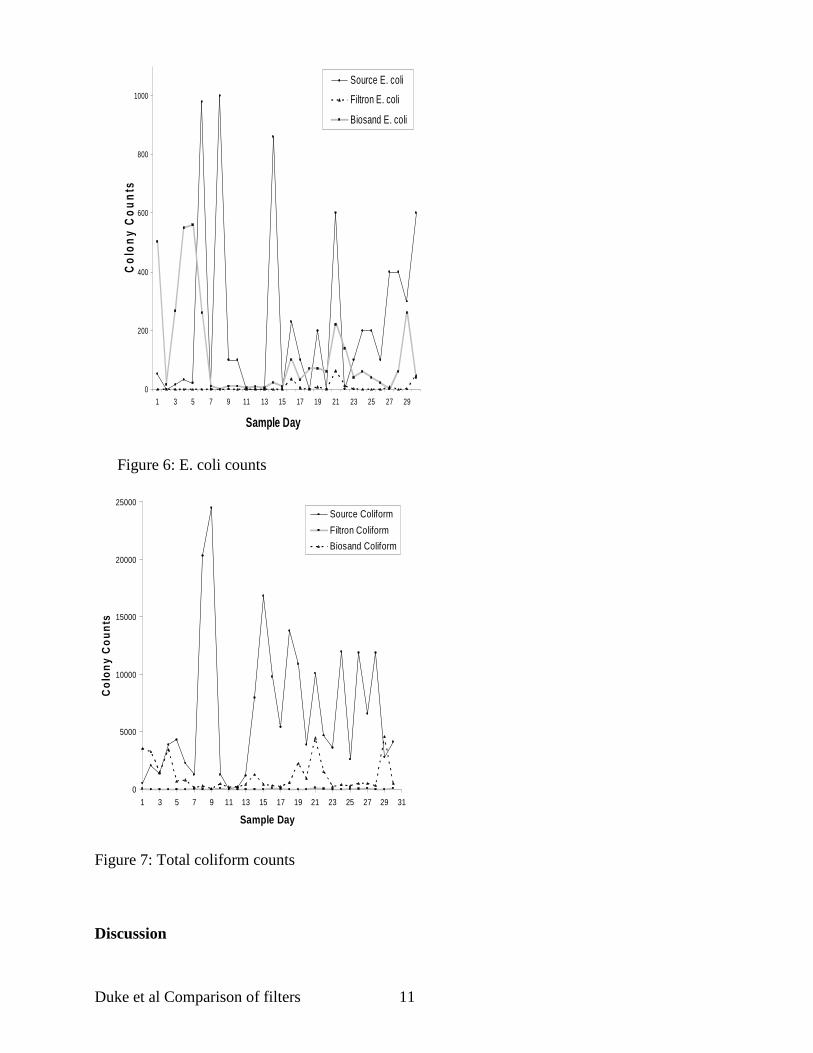
The percent removal of bacteria from the source water by each filter is summarized in Figs. 6 & 7
below. Subjectively, the quality of water produced by each of the filters was high and
indistinguishable one from the other.
Duke et al Comparison of filters 11
0
200
400
600
800
1000
1 3 5 7 9 11 13 15 17 19 21 23 25 27 29
Sample Day
Co
lon
y C
ou
nts
Source E. coli
Filtron E. coli
Biosand E. coli
Figure 6: E. coli counts
0
5000
10000
15000
20000
25000
1 3 5 7 9 11 13 15 17 19 21 23 25 27 29 31
Sample Day
Co
lon
y C
ou
nts
Source Coliform
Filtron Coliform
Biosand Coliform
Figure 7: Total coliform counts
Discussion
Duke et al Comparison of filters 12
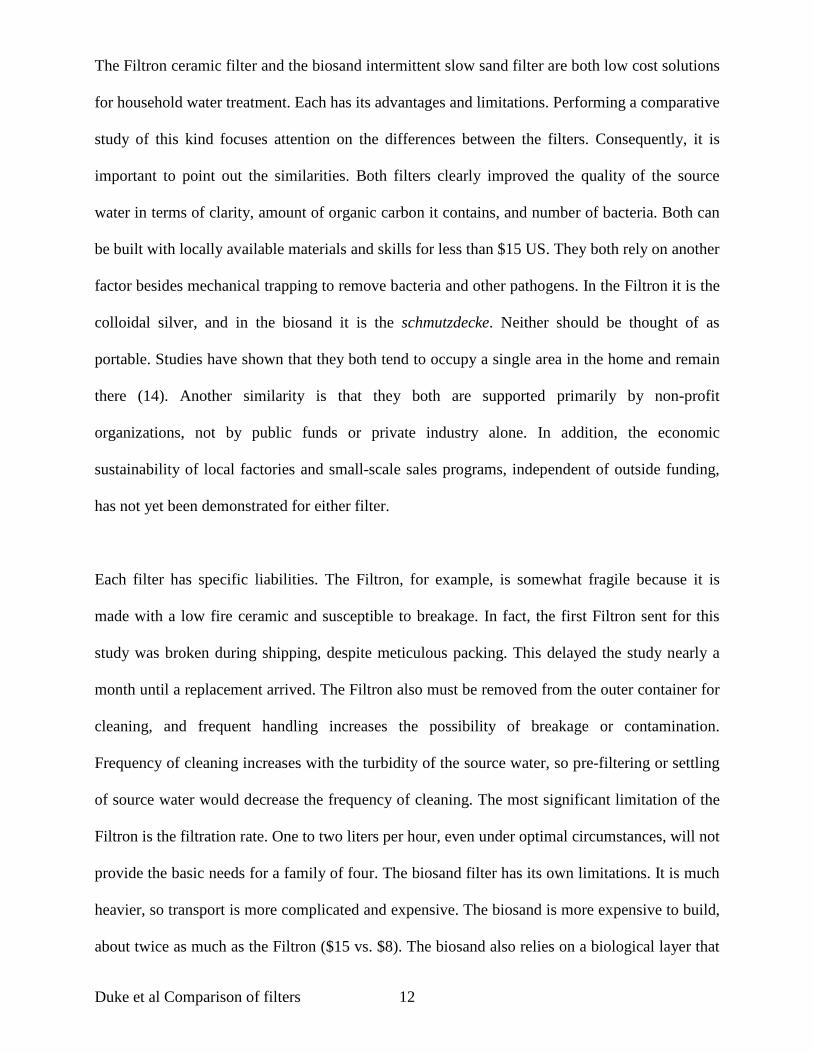
The Filtron ceramic filter and the biosand intermittent slow sand filter are both low cost solutions
for household water treatment. Each has its advantages and limitations. Performing a comparative
study of this kind focuses attention on the differences between the filters. Consequently, it is
important to point out the similarities. Both filters clearly improved the quality of the source
water in terms of clarity, amount of organic carbon it contains, and number of bacteria. Both can
be built with locally available materials and skills for less than $15 US. They both rely on another
factor besides mechanical trapping to remove bacteria and other pathogens. In the Filtron it is the
colloidal silver, and in the biosand it is the schmutzdecke. Neither should be thought of as
portable. Studies have shown that they both tend to occupy a single area in the home and remain
there (14). Another similarity is that they both are supported primarily by non-profit
organizations, not by public funds or private industry alone. In addition, the economic
sustainability of local factories and small-scale sales programs, independent of outside funding,
has not yet been demonstrated for either filter.
Each filter has specific liabilities. The Filtron, for example, is somewhat fragile because it is
made with a low fire ceramic and susceptible to breakage. In fact, the first Filtron sent for this
study was broken during shipping, despite meticulous packing. This delayed the study nearly a
month until a replacement arrived. The Filtron also must be removed from the outer container for
cleaning, and frequent handling increases the possibility of breakage or contamination.
Frequency of cleaning increases with the turbidity of the source water, so pre-filtering or settling
of source water would decrease the frequency of cleaning. The most significant limitation of the
Filtron is the filtration rate. One to two liters per hour, even under optimal circumstances, will not
provide the basic needs for a family of four. The biosand filter has its own limitations. It is much
heavier, so transport is more complicated and expensive. The biosand is more expensive to build,
about twice as much as the Filtron ($15 vs. $8). The biosand also relies on a biological layer that
Duke et al Comparison of filters 13
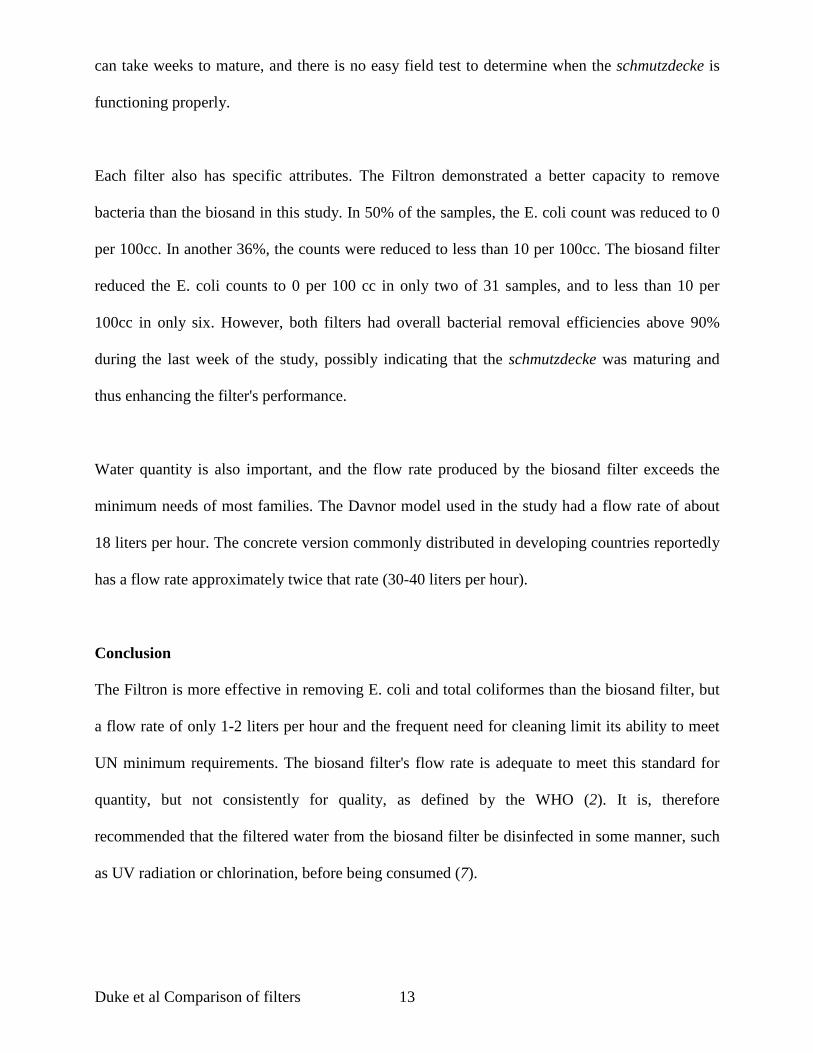
can take weeks to mature, and there is no easy field test to determine when the schmutzdecke is
functioning properly.
Each filter also has specific attributes. The Filtron demonstrated a better capacity to remove
bacteria than the biosand in this study. In 50% of the samples, the E. coli count was reduced to 0
per 100cc. In another 36%, the counts were reduced to less than 10 per 100cc. The biosand filter
reduced the E. coli counts to 0 per 100 cc in only two of 31 samples, and to less than 10 per
100cc in only six. However, both filters had overall bacterial removal efficiencies above 90%
during the last week of the study, possibly indicating that the schmutzdecke was maturing and
thus enhancing the filter's performance.
Water quantity is also important, and the flow rate produced by the biosand filter exceeds the
minimum needs of most families. The Davnor model used in the study had a flow rate of about
18 liters per hour. The concrete version commonly distributed in developing countries reportedly
has a flow rate approximately twice that rate (30-40 liters per hour).
Conclusion
The Filtron is more effective in removing E. coli and total coliformes than the biosand filter, but
a flow rate of only 1-2 liters per hour and the frequent need for cleaning limit its ability to meet
UN minimum requirements. The biosand filter's flow rate is adequate to meet this standard for
quantity, but not consistently for quality, as defined by the WHO (2). It is, therefore
recommended that the filtered water from the biosand filter be disinfected in some manner, such
as UV radiation or chlorination, before being consumed (7).

Duke et al Comparison of filters 14
Perhaps the best solution is to combine the two filters, first pouring the source water through the
biosand filter, then running a portion of that water through the Filtron prior to drinking.
"Improved water" from the biosand filter could be used for bathing and food preparation, and
another 4-8 liters of "improved water" filtered with the Filtron to be used for drinking.
Acknowledgements
This study was made possible by the assistance of Shapna Mazumder, Rob Newell, Yuri Yoon,
and others at the Water and Watershed Research Program at the University of Victoria; and by
the generosity of Wilf and Adam Scheuer at Prostar Industries in Victoria, B.C., who provided
the Davnor filter used in this study. The authors are also especially grateful for the editorial
assistance of Yvonne Sharpe.
References
1. Bartram J, Lewis K, Lenton R, Wright A. 2005. Focusing on improved water and sanitation for health. The Lancet 365:810-812.
2. World Health Organization. 2004. WHO Guidelines for drinking-water quality, third edition. Chapter 7, p. 143. 3. Faulkner CT, Garcia BB, Logan MH, New JC, Patton S. 2003. Prevalence of endoparasitic infection in children and its relation with colera prevention efforts in Mexico. Rev. Panam. Salud Publica 14(1):31-41. 4. United Nations Bulletin. 1999. Water Crisis: Everyone Lives Downstream, UN World Day for Water. New York, NY. 5. United Nations General Assembly. 2004. United Nations Millennium Declaration. Resolution 55/2. New York, NY. 6. Zerah M-H. 2000. Household strategies for coping with unreliable water supplies: the case of Dehli, Habitat International. 24: 295-307. 7. Thompson T, Sobsey M, Bartram J. 2003 Providing clean water, keeping water clean: an integrated approach. Int. J. Environmental Health Res. 13(s 1):89-94.
Duke et al Comparison of filters 15
8. Lantagne DS. 2001. Investigation of the Potters for Peace colloidal silver-impregnated ceramic filter: intrinsic effectiveness and field performance in rural Nicaragua, Alethia Environmental, 29 Seattle St., Allston, MA 02134, USA. 9. Center for Affordable Water and Sanitation Treatment. 2004. Biosand Filter Workshop, 2916 Fifth Ave., # 12. Calgary, AB, T2A 6K4, Canada. 10. Bruzunis, BJ. 1993. Laboratory report: confirmational testing of an intermittently operated slow sand filter. Department of Civil Engineering, University of Calgary, Calgary, AB, Canada. 11. Manz DH, Buzunis BJ, Morales C. 1993. Final report on the Nicaragua household water supply and testing project, Division of International Development, University of Calgary, Calgary, AB, Canada. 12. Manz DH, Buzunis BJ. 1995. Nicaragua community scale household water project. University of Calgary, Department of Civil Engineering, Calgary, AB, Canada. 13. Palmateer G, Manz D, Jurkovic A, McInnis R, Unger S, Kwan K, Dutka B. 1999. Toxicant and parasite challenge of the Manz intermittent slow sand filter. Environ. Tox. 14:217-225. 14. Lantagne DS. 2001. Investigation of the Potters for Peace colloidal silver impregnated ceramic filter, Report 1: Intrinsic effectiveness, Alethia Environmental, 29 Seattle St., Allston, MA 02134, USA. 15. Lee T. 2001. Biosand household water filter project in Nepal, Masters of Engineering Thesis, Massachusetts Institute of Technology. Boston, MA. 16. Liang K, et al. 2002. BSF Evaluation Report. Samaritan's Purse-Canada. BOX 20100 Calgary Place, Calgary, AB, T2P 4J2, Canada.

Duke et al Comparison of filters 16
Figure 3 - Turbidity Comparison
Duke et al Comparison of filters 17
0
0.5
1
1.5
2
2.5
3
3.5
4
4.5
5
1 6 11 16 21 26 31
Sample Day
NT
USource turbidity
Filtron turbidity
Biosand turbidity
Figure 4 - TOC Comparison

Duke et al Comparison of filters 18
3
5
7
9
11
13
15
17
19
1 3 5 7 9 11 13 15 17 19 21 23 25 27 29
Sample Day
Car
bo
n C
on
cen
trat
ion
(p
pm
)Source TOC
Filtron TOC
Biosand TOC
Figure 5 - DOC Comparison
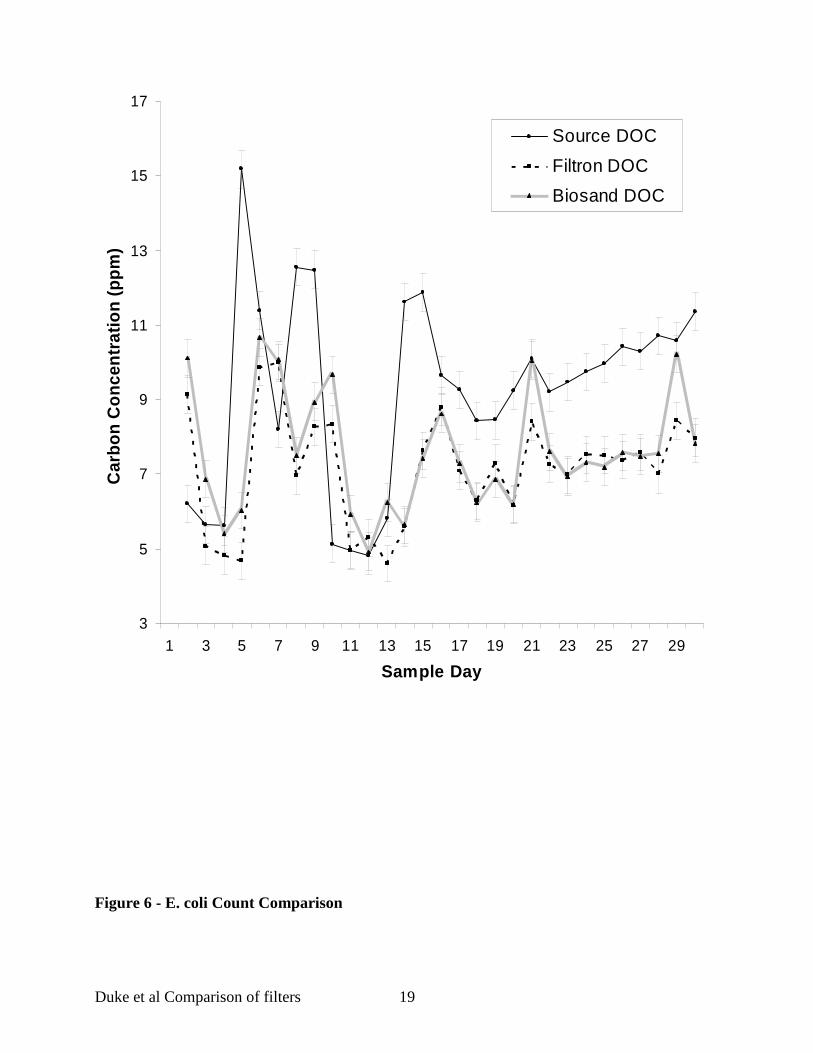
Duke et al Comparison of filters 19
3
5
7
9
11
13
15
17
1 3 5 7 9 11 13 15 17 19 21 23 25 27 29
Sample Day
Car
bo
n C
on
cen
trat
ion
(p
pm
)Source DOC
Filtron DOC
Biosand DOC
Figure 6 - E. coli Count Comparison

Duke et al Comparison of filters 20
0
200
400
600
800
1000
1 3 5 7 9 11 13 15 17 19 21 23 25 27 29
Sample Day
Co
lon
y C
ou
nts
Source E. coli
Filtron E. coli
Biosand E. coli
Figure 7 - Total Coliform Count Comparison
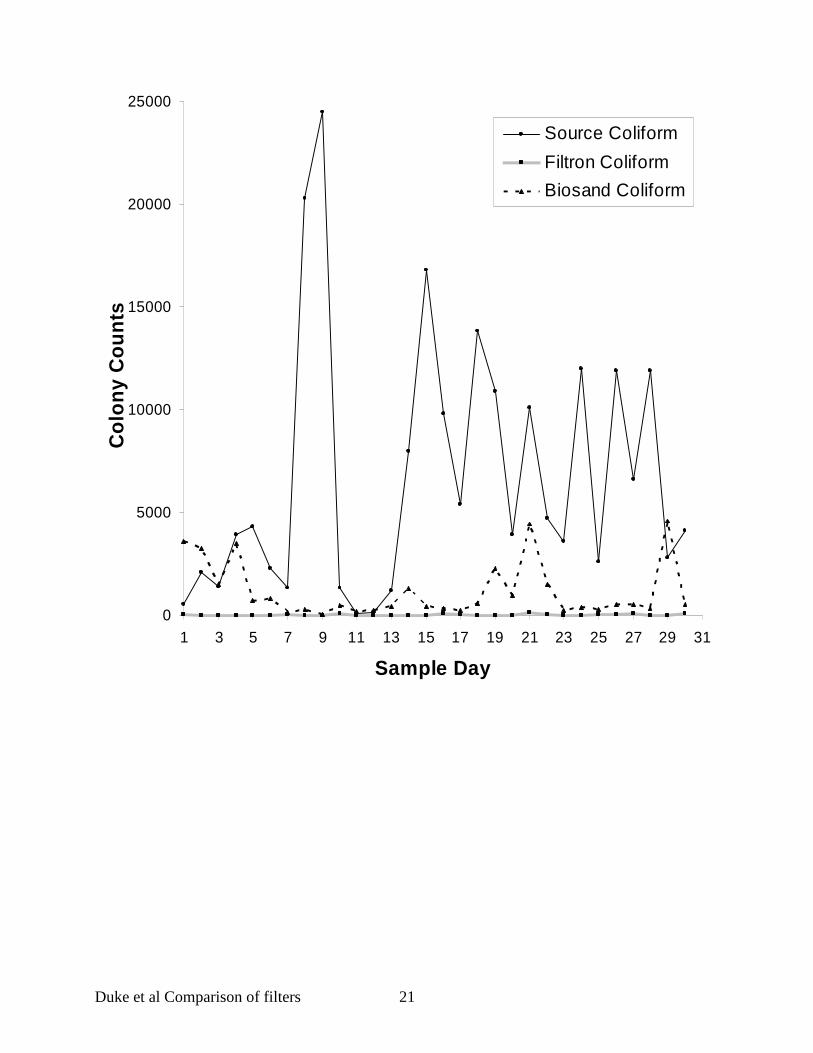
Duke et al Comparison of filters 21
0
5000
10000
15000
20000
25000
1 3 5 7 9 11 13 15 17 19 21 23 25 27 29 31
Sample Day
Co
lon
y C
ou
nts
Source Coliform
Filtron Coliform
Biosand Coliform