Embed Size (px)
Citation preview

8/14/2019 Compaq Article
http://slidepdf.com/reader/full/compaq-article 1/61
Communications of AIS Volume 1, Article 8 A Balanced Scorecard Analysis of Compaq Computer Corporation by W.F. Wright et al. 1
Volume 1, Article 8January 1999
INFORMATION TECHNOLOGY, PROCESS
REENGINEERING AND PERFORMANCE
MEASUREMENT:
A BALANCED SCORECARD ANALYSIS OF COMPAQCOMPUTER CORPORATION
William F. Wright, Rodney Smith,Ryan Jesser, Mark Stupeck
Center for Research on Information Technology and OrganizationsGraduate School of Management
University of California, Irvine
Irvine, [email protected]
CASE STUDY

8/14/2019 Compaq Article
http://slidepdf.com/reader/full/compaq-article 2/61
Communications of AIS Volume 1, Article 8 A Balanced Scorecard Analysis of Compaq Computer Corporation by W.F. Wright et al. 2
INFORMATION TECHNOLOGY, PROCESS
REENGINEERING AND PERFORMANCE
MEASUREMENT:
A BALANCED SCORECARD ANALYSIS OF COMPAQCOMPUTER CORPORATION
William F. Wright, Rodney Smith,Ryan Jesser, Mark Stupeck
Center for Research on Information Technology and OrganizationsGraduate School of Management
University of California, IrvineIrvine, CA
ABSTRACT
The personal computer industry is characterized by fierce competition for
market share. The pace of technological change results in ever-shorter product
lives and a continuous search for enhanced efficiency. To achieve these goals,
firms must use information technology insightfully to redesign business
processes, improve supply chain management and increase the value provided
to the customer.
This competitive environment in the personal computer (PC) industry
provides an exceptional laboratory for evaluating how companies use information
technology to create business value. Compaq Computer Corporation is one of
the most successful PC manufacturers. This case study, based on publicly
8/14/2019 Compaq Article
http://slidepdf.com/reader/full/compaq-article 3/61
Communications of AIS Volume 1, Article 8 A Balanced Scorecard Analysis of Compaq Computer Corporation by W.F. Wright et al. 3
available data, provides a comprehensive analysis of how strategic business use
of information technology in concert with business process redesign improved
the economic performance of this large-scale manufacturing company. Compaq
has relied on strategic use of enterprise-wide IT to enhance its competitive
position as the number one supplier of personal computers in the world.
This analysis begins with a review of the economics and competitiveness
of the PC industry, and the role of information technology. To place Compaq’s
performance in perspective, we compare it to Dell Computer Company and
Gateway Computer Company. We then profile the changes in Compaq’s
business strategy and its use of process reengineering and enterprise-wide
information technology to implement strategic changes.
To understand Compaq’s financial success better, we use the BalancedScorecard [Kaplan and Norton, 1992 and 1996] to develop a causal model of firm
performance that highlights the contribution of information technology to four
different dimensions of that performance. We conclude that 1) information
technology, along with 2) process reengineering, when properly aligned with 3)
Compaq’s business strategy contributed substantially to Compaq’s overall
success and market leadership.
Keywords: Balanced Scorecard, Enterprise Resource Planning, Information
Technology, Reengineering, Business Strategy, Compaq Computer Corporation.
I. INTRODUCTION
Intensifying global competition and increasingly sophisticated consumer
preferences require companies to respond quickly and effectively to market
opportunities. In this economic climate, effective implementation of a business
strategy depends upon insightful use of information technology to redesign
business processes, improve supply chain management, and increase the value
provided to the customer. To accomplish these goals, managers need timely and

8/14/2019 Compaq Article
http://slidepdf.com/reader/full/compaq-article 4/61
Communications of AIS Volume 1, Article 8 A Balanced Scorecard Analysis of Compaq Computer Corporation by W.F. Wright et al. 4
comprehensive information to make good marketing, production, and distribution
decisions. As Porter and Millar [1985] noted, “The information revolution is
changing the nature of business and can [emphasis added] create competitive
advantages for those managers who understand its effects.” Questions remain,
however, about how firms should use IT to gain this value.
Michael Hammer [1990] advocated the use of IT to make radical changes
in business processes: “We should ‘reengineer’ our businesses: use the power
of modern information technology to radically redesign our business processes in
order to achieve dramatic improvements in their performance.” Many firms
followed his advice; however, Hammer himself admits that the results of these
efforts were mixed [Hammer and Champy, 1993]; Davenport [1997] stresses the
importance of IT to achieve “information integration,” but he also points out that“true information integration won’t happen without major changes in management
approaches and organizational structure.”
Firms use IT to deliver value to their customers, to keep their current
customers and gain new ones. Porter [1996] explains: “[A company] must deliver
greater value to its customers or create comparable value at a lower cost, or do
both.” Any differences in cost, price, or quality of products derive from the
execution of business activities that make up the firm’s business processes.
While these objectives are clearly desirable, implementing them can be a
challenge. How should management combine reengineering or business process
redesign with use of IT in a specific organizational culture? What are the cause
and effect relationships? What actions must the firm’s management take to
derive value from their IT and business process redesign efforts? And, how can
they measure the results?
This study provides a comprehensive, detailed analysis of how strategic
business use of information technology, in concert with business process
redesign, can improve the economic performance of a large-scale manufacturing
company, Compaq Computer Corporation. Compaq has relied on strategic use of
enterprise-wide IT to enhance its competitive position. The company experienced
rapid growth in the 1980s, gaining a well-deserved reputation for producing high

8/14/2019 Compaq Article
http://slidepdf.com/reader/full/compaq-article 5/61
Communications of AIS Volume 1, Article 8 A Balanced Scorecard Analysis of Compaq Computer Corporation by W.F. Wright et al. 5
quality (and high cost) computers. In the 1990s, however, Compaq felt the effects
of increasingly intense competition: it lost sales and market share. In 1992, its
annual revenues dipped by more than $300 million to $1.5 billion while its
operating costs continued to rise. Earnings per share dropped by over 70%.
Compaq’s management needed to respond—by developing a new business
strategy that would allow the company to compete successfully while remaining
financially strong. The success of any change in strategy would depend directly
heavily on how wisely Compaq used information technology across, and into, the
entire organization. These issues constitute the theme of this analysis. We focus
on Compaq’s use of IT along with the redesign of their business processes
during the period 1992 to 1998.
USE OF PUBLICLY AVAILABLE DATA
Because this study is based only on publicly available data, the depth of
what we can achieve is somewhat limited. Also, many of the press articles
concerning Compaq are heavily influenced by Compaq’s press releases and
statements by Compaq executives An advantage, however, is that we can be
totally objective since we are neither constrained nor influenced by having
obtained access to internal data and information.
THE COMPAQ TIMELINE
Figure 1 shows the highlights at Compaq Corporation during the 1990’s. It
is presented here for reference to allow readers to put the events discussed in
this case in perspective.
ORGANIZATION OF PAPER
This analysis is organized as follows. The economics and competitiveness
of the PC industry, and the role of information technology, are evaluated in
Section II. In Section III, we concentrate on changes in Compaq’s business
strategy and its use of process reengineering and enterprise-wide information
technology to implement strategic changes. Next, the impact of the strategy
changes and use of IT on the economic performance of Compaq are evaluated

8/14/2019 Compaq Article
http://slidepdf.com/reader/full/compaq-article 6/61
Communications of AIS Volume 1, Article 8 A Balanced Scorecard Analysis of Compaq Computer Corporation by W.F. Wright et al. 6
using a Balanced Scorecard causal and performance analysis [Kaplan and
Norton, 1992 and 1996]. The final section summarizes our insights and
conclusions.
Figure 1: Compaq Computer Corporation Highlights In The 1990s
1 9 9 8
1 9 9 7
1 9 9 6
1 9 9 5
1 9 9 4
1 9 9 3
1 9 9 2
1 9 9 1
1 9 9 0 Compaq facing f i rs t f inancial losses af ter rapid growth in the 1980s; market share s l ips .
Eckhard Pfeiffer replaces Compaq founder RodCanion as CEO;Compaq restructures laying-off 25% of workforce.
Compaq introduces low-cost PCs;returns to prof i tabi l i ty; lays plans for aggressiveentry into al l computing markets .
Enterpr ise-wide reengineer ing effor t with new strategies:1) multi-channel distribution, 2) plan to build-to-order,3) pr ic ing, promotion, customer service; revenues jump 75% to $7.2 B
SAP project underway with chal lenge to run al l mission cr i t icalapp l i ca t ions on Compaq se rve r s by mid -1997 ; Compaq becomeslargest global suppl ier of PCs; ini t ia tes program of customer supportover the internet .
Ac qu i re s 2 ne tw or ki ng pr od uc t fi rm s ;Contracts with DEC for major customer servi ce and support ;SAP development projects switches successful l y to Compaq servers ;SAP rol lout begins in sales off ices in Mexico in December.
Enters professional workstat ion market ;SAP rol lout a t manufactur ing plants in Texas;establ ishes global extranet for on-l ine order ing.
Reaches $25 bi l l ion in revenue s; named Forbes ' Company of theannounces Optimized Distr ibut ion Model with bui ld- to-order ;configure- to-order, and channel configurat ion program ini t ia t ives;acqu i r e s MICROCOM and TANDEM; ga ins ove r 17% of PC marke t .
Inventory problems resul t in lower revenue and income;acquires Digi ta l Equipment Corp for $9.6 Bn;poised for major push into enterpr ise computing market .

8/14/2019 Compaq Article
http://slidepdf.com/reader/full/compaq-article 7/61
Communications of AIS Volume 1, Article 8 A Balanced Scorecard Analysis of Compaq Computer Corporation by W.F. Wright et al. 7
II. THE PERSONAL COMPUTER INDUSTRY: COMPETITION AND
STRATEGIC USE OF IT
OVERVIEW
It is not an exaggeration to assert that rapid and relentless economic
Darwinism has prevailed, and continues to prevail, in the PC industry. “Compaq
participates in a highly volatile industry that is characterized by fierce industry-
wide competition for market share. Industry participants confront aggressive
pricing practices, continually changing customer demand patterns, growing
competition from well-capitalized high technology and consumer electronics
companies, and rapid technological development carried out in the midst of legal
battles over intellectual property rights.” This statement from Compaq’s June 30,1997 SEC 10Q report accurately describes the highly competitive conditions in
the industry [Compaq, 1997b].
These competitive conditions and demands have taken their toll on a
number of firms. Companies such as Apple Computer, AST Research and
Packard Bell are fighting for survival. Others are leaving the market (e.g., Unisys
Corporation) or have been acquired (e.g., Digital Equipment and Tandem
Computer, both acquired by Compaq). And some have suffered substantial
losses: Dell Computer lost $36 million in 1994, IBM lost over $8 billion in 1993,
and both Gateway and Micron Electronics reported disappointing financial results
in 1997.
Survival in the PC industry requires that firms continuously re-evaluate
and improve their business processes, especially their value chains. ERP
software, such as SAP AG’s R/3, is used to implement changes in business
processes. Leveraging this technology enables companies to restructure
resources, gain efficiencies, improve market reach, and implement corporate
strategies more effectively.
STRATEGIC INITIATIVES BY THE PC MANUFACTURERS
While Hewlett-Packard and IBM are formidable competitors for Compaq,
they are large, highly diversified companies; therefore, they are not readily

8/14/2019 Compaq Article
http://slidepdf.com/reader/full/compaq-article 8/61
Communications of AIS Volume 1, Article 8 A Balanced Scorecard Analysis of Compaq Computer Corporation by W.F. Wright et al. 8
comparable with Compaq. We will, therefore, contrast Compaq’s operations and
use of enterprise IT with Dell and Gateway. We note, however, that third quarter
1997 PC industry results indicate that Hewlett-Packard made substantial gains in
the PC market, and IBM’s inability to compete on price caused it to restructure its
PC operations in late 1997.
The continued growth and success of PC manufacturers depends on their
ability to implement their strategic objectives in a changing market. In the last
quarter of 1997, the overall market for PCs increased 15% over the same quarter
in 1996. Compaq enjoyed a clear lead in PC market share in both the reseller
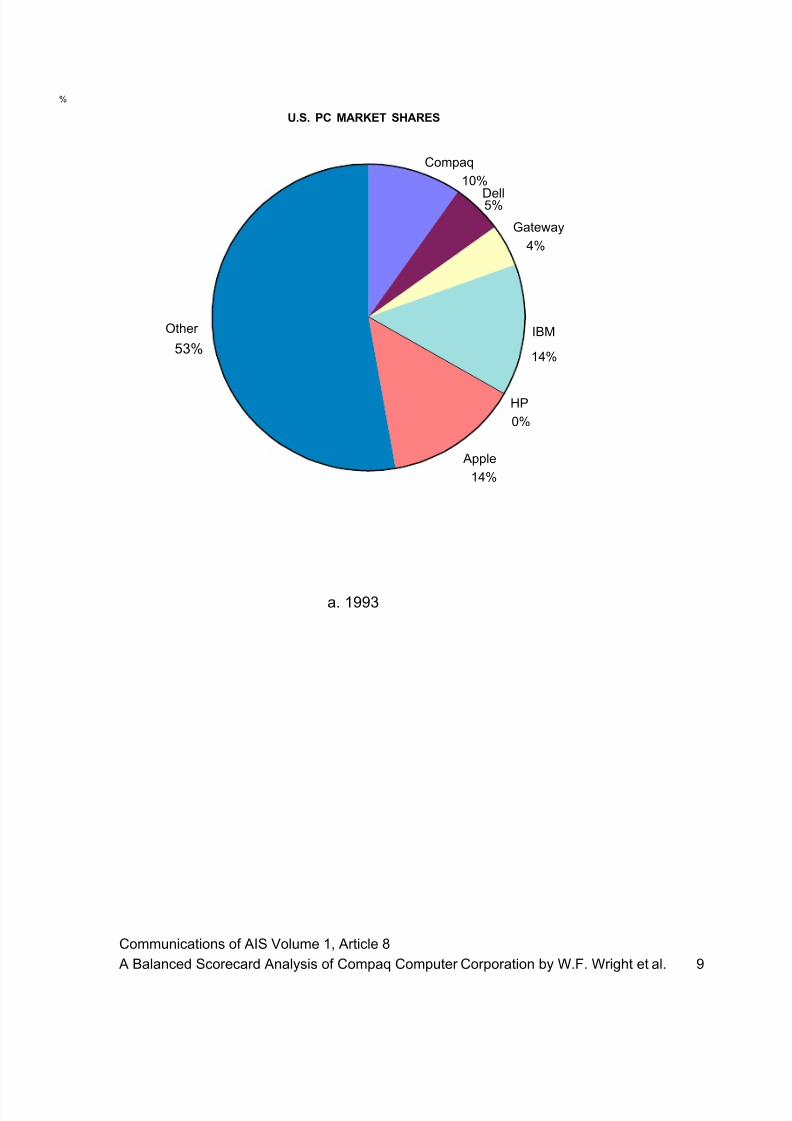
(commercial) and the retail (consumer) channels. Figure 2 shows the distribution
of U.S. market shares for the major PC manufacturers as of the end of 1993 and
for the fourth quarter of 1997. Compaq had an 18% market share; Dell was
number two with more than 10% of the market, and Gateway was number five
with 8% of the market. All three recorded substantial increases in the number of
units shipped during 1997. The data are based on various public sources that
report findings obtained by International Data Corporation (IDC)
In Tables 1 and 2, we compare the performance during 1997 of Compaq,
Dell, and Gateway. At the end of that year, Compaq was two to four times as
large as the other two in annual revenues (and prior to its acquisition of Digital
Equipment Corporation). From a return on equity (ROE) standpoint, however,
Dell had a big lead. Although Dell carried no long-term debt to lever the common
equity, it still produced a 76% ROE whereas Compaq’s ROE was 23.6% and
Gateway’s 12.6%; Dell’s management has created a formidable competitor.
What aspects of the corporate strategies are driving company
performance? The direct marketing and build-to-order strategies employed by
Dell and Gateway give them clear advantages in terms of reduced inventories.
See Sidebar.
8/14/2019 Compaq Article
http://slidepdf.com/reader/full/compaq-article 9/61
Communications of AIS Volume 1, Article 8 A Balanced Scorecard Analysis of Compaq Computer Corporation by W.F. Wright et al. 9
a. 1993
%
U.S. PC MARKET SHARES
Compaq10%
Dell5%
Gateway4%
IBM
14%
HP 0%
Apple14%
Other 53%

8/14/2019 Compaq Article
http://slidepdf.com/reader/full/compaq-article 10/61
Communications of AIS Volume 1, Article 8 A Balanced Scorecard Analysis of Compaq Computer Corporation by W.F. Wright et al. 10
PC Market Share -
Compaq
18%
Dell
10%
Gateway
8%
IBM
10% 7%
Apple3%
Other
44%
b. 1997
Figure 2. Relative Shares of the PC Market in 1993 and 1997

8/14/2019 Compaq Article
http://slidepdf.com/reader/full/compaq-article 11/61
Communications of AIS Volume 1, Article 8 A Balanced Scorecard Analysis of Compaq Computer Corporation by W.F. Wright et al. 11
Table 1 Selected Financial Measures - Major PC Manufacturers
CATEGORY COMPAQ DELL GATEWAY
Effectiveness
• Market Share (U.S.) 16.6% 9.5% 7%
• Revenue $24.6B $12.3B $6.3B
• Units Sold (worldwide) 10.2 M 4.6 M 2.2 M
• Gross Margin 27.5% 22.1% 17.12%
• Net Margin 7.5% 7.7% 1.8%
• Net Income $1855M $944M $109.8M
• ROA 13.76% 26.03% 5.92%
• ROE 22.2% 90.0% 12.6%
• Market to book value 454% 2468% 551%
• % Revenue -International 45% 31% 16%
Efficiency
• Operating Cycle Time 77 Days 44 Days 46 Days
• Current Ratio 2.31 1.45 1.54
• Inventory Turnover - annual 12.6 X 39.7 X 19.8 X
B=billion, M=millionBased on annual financial results for year ending 12/31/97 for Compaq and Gateway; 2/1/98 for Dell Computer [Source: Hoovers, 1998; Compaq 1998a and 1998b; Dell, 1998; Gateway, 1998].

8/14/2019 Compaq Article
http://slidepdf.com/reader/full/compaq-article 12/61
Communications of AIS Volume 1, Article 8 A Balanced Scorecard Analysis of Compaq Computer Corporation by W.F. Wright et al. 12
Table 2. Comparative Enterprise PerformanceCompaq Dell Gateway
(1997 vs 1996 4th qtr) (1998 vs 1997 4th qtr) (1997 vs 1996 4th qtr)
1. Effectiveness Sales increased 23%. Sales increased 55%. Sales increased 27%.
4th quarter U.S. unit sales jumped 51%. 4 th quarter U.S. unit sales up 67%. 4 th quarter U.S. unit sales up 23%.
Gross margin increased 85 basis points
to 27.5%.
Gross margins held steady at 22% Gross margins dropped to 3% from 18.9%.
Net income increased 37%. Net income increased 51%. Net income increased 5%.
Build to order strategy better matched
market demands
Build to order strategy better matched
market demands
Build up of high-end PC inventory in 3 rd qtr
reflects inability to match market demands.
ROE increased to 29.6%. ROE increased 76%. ROE rebounded to 42% after loss in 3 rd qtr.
1.1 Reach Gained new customers - with under $1000
computers, new business products,
servers, notebook line.
New server and network products aimed
at increasing corporate and government
customers.
Announced new server products to reach
corporate customers; opening retail stores.
Still leads with 16.6% of U.S. PC market. Improved market share to 9.5% of U.S.
PC market.
Improved market share slightly to 7% of U.S. PC
market.
Uses 7000 partners in channel to reach
customers around the world (extranet
better integrates supply chain).
Sells direct w/o retail and reseller
channel.
Sells direct but uses some resellers and has own
stores at a few locations.
Introduced Compaq On Line to expand
market reach.
Web sales exceeding $3 m per day. Web sales at $2 m per day; using channel to
reach new business customers.
Passed Toshiba to become number 1 in
notebook sales.
Passed Compaq to be number 1 in sales
to medium and small business.
Named number 1 in customer service by major
journal.
1.2 Strategic Structure Acquisitions of Microcom and Tandem
enabled new capabilities.
Committed to direct sales model and
“Dell-ocity” - short cycle times.
Acquisition of ALR enabled new server products.
Outsourcing to improve asset utilization. ( Close relationship with small group of responsive suppliers.
Announced reorganization to streamlineprocesses.
2. Efficiency Improved inventory turnover to 12.6 times
from 8.8.
Improved inventory turnover to over 39
times from 18.
Rebounded after caught w/obsolescent inventory,
turnover increased from 15 to 19.8 times.
Reduced days sales in inventory from 60
to 30 days.
Only 8 days sales in inventory. Now, only 15 days sales in inventory.
Build to order strategy lowered costs. Leader in build to order strategy.
Gross margin increased to 27.5% from
26.4%.
Gross margin increased to 22% from
21.7%.
Price pressures drove gross margin from 18.5% to
3%.
Operating expenses declined to 12% of
sales.
Operating expenses increased 2% to
9.9% of sales.
Operating expenses increased 1% to 10.9%; but
down 25% from 3 rd qtr .
Better utilization of manufacturing capacity
by allocating 25% more run time to sub
$1,000 machines.
Build up in high end PC inventory with revenue
growth below expectations reflect misallocation of
manufacturing resources
Smaller unit size allowed more units to be
shipped per truck.
[Sources: various - company financial statements, news articles, and press releases].

8/14/2019 Compaq Article
http://slidepdf.com/reader/full/compaq-article 13/61
Communications of AIS Volume 1, Article 8 A Balanced Scorecard Analysis of Compaq Computer Corporation by W.F. Wright et al. 13
Compaq
Compaq controls almost 12.5% of the global PC market by designing,manufacturing, and marketing a wide range of computer products, including
desktop and portable computers, and network servers. From 1994 to 1997,
Compaq averaged 33% growth in annual revenue and 51% growth in annual net
income. This growth was accomplished by leveraging its strategic use of
information technology. Also, Compaq increased its reach (product offerings) by
SIDEBAR: THE EFFECTS OF BUILD-TO-ORDER
Under a build-to-order (BTO) process model, the manufacturer begins to
assemble computers only after an order has been placed. Using BTO, Dell
averages less than 10 days to sell its inventory; its inventory turnover was
over 39 times for its fiscal year ending February 1, 1998. Gateway averages
18 days to sell its inventory, and its inventory turnover was 19.8 times.
Because Compaq uses the reseller channel to sell its products, it took over 30
days to sell its inventory with an inventory turnover of just over 12.6 times for
the year ending December 31, 1997.
Dell’s efficient BTO model gave Compaq a target for its manufacturing anddistribution processes. Compaq had relied on “build-to-forecast,” an inherently
more efficient manufacturing process characterized by large production runs
and low unit costs. In the PC industry, however, any unsold product has a very
short shelf life. New products are introduced constantly and product lines often
have only a life of a few months. Like others in the industry, Compaq had to
deal with obsolete products in both its inventory and the inventory held by its
retail dealers and resellers. Obsolescent inventory--with lowered prices--
competed with new products. In addition, Compaq was faced with substantial
product returns each time a new product was introduced. The extra handling
and disposition was wasteful and costly.

8/14/2019 Compaq Article
http://slidepdf.com/reader/full/compaq-article 14/61
Communications of AIS Volume 1, Article 8 A Balanced Scorecard Analysis of Compaq Computer Corporation by W.F. Wright et al. 14
acquiring both Microcom Corporation and Tandem Computer in 1997. These
acquisitions allowed Compaq to compete more aggressively with Dell Computer
and Gateway. Its acquisition of Digital Equipment Corporation in 1998 should
allow it to confront HP and IBM in the market for large-scale enterprise networks
and service.
Compaq is the leader in the reseller channel with over 35% of unit sales.
While Dell and Gateway enjoy significant sales to businesses, they were not
major players in the reseller market in 1997 for two primary reasons:
• Dell and Gateway are direct retailers and, therefore, they do
not typically use the reseller channel;
• Until 1995, Dell and Gateway focused on selling
workstations and individual computers, rather than servers
and completely bundled network hardware.
Compaq has also done well in the retail channel. Compaq leads there as
well with over 25% of the market [Infobeads, 1998]. Intense price competition
and other factors have caused several PC manufacturers to lose market share
and then regain it in late 1997 as they brought out competitive models that sell
for less than $1000. For example, Packard Bell’s share dropped from 29% of the
retail market to 20% and then rebounded to over 25% with substantial gains in
the under $1000 segment. But both Acer’s and Apple’s share declined
significantly because of their small share of the fast growing sub-$1000 market
[Computer Intelligence, 1997]. Dell and Gateway avoid the retail channel with
their direct marketing strategy; they did not join the competition for desktops
priced under $1000. (However, Gateway began offering a limited selection of
computers for under $1000 in 1998). Their ability to price their products without aretailer markup, however, allowed them to market high performance (Pentium
II™) systems for well under $2000, and this contributed to their strength in the
consumer marketplace.

8/14/2019 Compaq Article
http://slidepdf.com/reader/full/compaq-article 15/61
Communications of AIS Volume 1, Article 8 A Balanced Scorecard Analysis of Compaq Computer Corporation by W.F. Wright et al. 15
Dell Computer
Dell continued its success in the commercial (business) marketplace in
1997, actually passing Compaq in sales in the second quarter of 1997. The
world’s leading direct marketer of computer systems, Dell’s 1997 sales growth
rate is double that of Compaq and Gateway (Table 2). Dell’s ability to leverage
information technology fueled its growth in an industry characterized by declining
prices. Dell maintains lower costs by bypassing distributors and other resellers.
Dell was the first to use a build-to-order (BTO) methodology to manufacture and
distribute computers according to specific customer orders. They have focused
their organization and their use of IT to implement their business strategy: to
minimize inventories and more effectively manage their supply chain. In fact,
Dell’s newest factory converts customer orders into desktop PCs ready for
delivery in an average of 8 hours [Goldstein, 1997].
Gateway
Gateway, the second largest direct marketer of computer systems, is also
responding to competitiveness in the industry. In 1997, it acquired Advanced
Logic Research (ALR) and announced its entry into the corporate network server
market. At the same time, Gateway modified its distribution model to increase the
use of channel resellers. It continues to sell most of products directly, but uses
VARs when large corporate clients need specific services [Bliss and Rosa, 1997].
Gateway also announced expansion of its own chain of retail stores, Gateway
Country, building on the success of its store in Great Britain [Ferguson, 1997].
BUSINESS STRATEGIES AND USE OF INFORMATION TECHNOLOGY
In the PC business, sagacious use of enterprise-level IT is essential to
implement business strategies and be fully competitive. Moreover, Mata, Fuerst,and Barney [1995] suggest that managerial IT skills are likely to be the only
source of sustained competitive advantage using information technology. They
define managerial IT skills to “include management’s ability to conceive of,

8/14/2019 Compaq Article
http://slidepdf.com/reader/full/compaq-article 16/61
Communications of AIS Volume 1, Article 8 A Balanced Scorecard Analysis of Compaq Computer Corporation by W.F. Wright et al. 16
develop, and exploit IT applications to support and enhance other business
functions” [Mata, Fuerst, and Barney, 1995, p. 499].
The following excerpt from Dell’s 1997 SEC 10K report, although
addressing only the customer awareness aspect, highlights the importance of IT
in implementing business strategies. Great emphasis is placed on customer
service and understanding of market trends--and use of the enterprise software
that provides the necessary information.
“Dell’s information systems enable the company to track each unit soldfrom the initial sales contacts, through the manufacturing process topost-sales service and support. Dell is able to track key informationabout many of its customers and target marketing activities specificallyto particular types of customers by using its database to assesspurchasing trends, advertising effectiveness and customer and productgroupings. This database, unique to Dell’s direct model, allows theCompany to gauge customer satisfaction issues and also provides theopportunity to test new propositions in the marketplace prior to productor service introductions” [Dell, 1997].
Gateway’s annual reports indicate a similar emphasis on tracking customer
satisfaction and sales [Gateway, 1997]. Since Compaq has used, and continues
to use, resellers as intermediaries, Compaq obtains customer-oriented
information that is both less complete and less timely.
More generally, their uses of direct marketing and build-to-order strategiespermit Dell and Gateway to enjoy strategic advantages over Compaq. The two
companies are able to reduce the relative size of their inventories, obtain more
direct and timely feedback from their customers, and, with comprehensive sales
tracking systems, are able to obtain immediate information regarding changes in
customer preferences. The continued growth and success of these PC
manufacturers depends on their ability to improve and implement their strategic
objectives in a changing market. Wise use of enterprise software is an essential
tool. Compaq is now deploying enterprise software to obtain the information and
logistical advantages enjoyed by its competitors.

8/14/2019 Compaq Article
http://slidepdf.com/reader/full/compaq-article 17/61
Communications of AIS Volume 1, Article 8 A Balanced Scorecard Analysis of Compaq Computer Corporation by W.F. Wright et al. 17
III. COMPAQ: BUSINESS STRATEGY AND USE OF
INFORMATION TECHNOLOGY
In Section II, we profiled the intense competition that prevails in the PC
industry--and why effective use of IT is a competitive necessity. In this Sectionwe investigate how Compaq’s use of IT permitted the firm to change its corporate
strategy, transform several critical business processes and compete more
successfully.
COMPAQ IN 1997
In 1997, headlines in the business press extolled Compaq’s
accomplishments: “Compaq Announces Record Third Quarter Sales, Earnings,
and EVA,” “Compaq Scores with Cheaper PCs,” “Dataquest, IDC Q3 figures put
Compaq atop of PC sales heap,” “Domination – Compaq and Dell surge”
[NewsEdge, 1997; Wong, 1997; Kane, 1997]. At the same time, some of
Compaq’s competitors were not faring as well. For example, Micron Electronics,
Inc. announced on November 24, 1997 that its quarterly earnings would be
lower, Gateway reported a third quarter 1997 net loss of $107 million, and Apple
Computer was just returning to profitability. These different results are surprising
since there appears to be little to distinguish one PC from another--each usesalmost the same components often from the same vendors. The prices are
similar; so is the performance of the products. Why, then, was Compaq doing
well when many others were not?
COMPAQ’S HISTORY
Before we address that question, some understanding of Compaq’s
history may be helpful. Founded in 1983, Compaq presents a model for a growth
company. In 1983, it reported first year sales of $111 million. By 1984, Compaq
had subsidiaries in Germany, France, and the United Kingdom. By 1985, its
stock was trading on the New York Stock Exchange. Compaq reached $1 billion
annual sales by 1987. Compaq introduced the first business-class laptop
computer in 1988 and a PC-based multiprocessor server in 1989. By 1990,

8/14/2019 Compaq Article
http://slidepdf.com/reader/full/compaq-article 18/61
Communications of AIS Volume 1, Article 8 A Balanced Scorecard Analysis of Compaq Computer Corporation by W.F. Wright et al. 18
international sales exceeded North American sales. The Compaq Presario line of
personal computers for the home was launched in 1993. Compaq became the
largest global supplier of PCs in 1994 and the fifth largest computer company in
the world in 1995 [Compaq, 1997a].
Growth in the 1980s, however, caught up with Compaq in the early 1990s.
Compaq experienced its first quarterly loss in 1991; essentially, the company had
outgrown its ability to manage its growth. In addition, responding to competitive
pressures had become more difficult. More specifically, Compaq’s information
system lacked the process integration necessary to provide management with
timely information. Its organizational structure was no longer applicable or
efficient.
1993: COMPAQ CHANGES ITS BUSINESS STRATEGY
Compaq seemed to manifest the common problem that: “processes have
not kept pace with the changes in technology, demographics, and business
objectives” [Hammer, 1990]. When CEO (and Compaq founder) Rod Canion
failed to develop a comprehensive plan to reengineer the corporation, the board
of directors replaced Canion with Eckhard Pfeiffer. In 1993, based on Pfeiffer’s
new business strategy, Compaq began an enterprise-wide reengineering effort
that encompassed changed business processes, a more effective organizational
structure, and a comprehensive, integrated enterprise information system. The
before and after process flows are shown in Figures 3 and 4.
Three major strategic objectives were emphasized:
• Build-to-order manufacturing . Before this objective could be fully
implemented, however, Compaq needed to reengineer its
processes to reduce cycle time (the time from receipt of an order until the products fulfilling that order are shipped) from two weeks
to 5 days.
• Multi-channel distribution . Compaq planned to add additional sales
channels, such as mass-market retailers, but the success of this

8/14/2019 Compaq Article
http://slidepdf.com/reader/full/compaq-article 19/61
Communications of AIS Volume 1, Article 8 A Balanced Scorecard Analysis of Compaq Computer Corporation by W.F. Wright et al. 19
strategy hinged on not alienating the computer retailers and
resellers with whom Compaq already had highly productive
relationships.
• Pricing, promotion, and customer service . Compaq beganimplementing this initiative immediately by cutting prices an
average of 30%, increasing advertising by 60%, offering on-site
installation, extending warrantees, and building remote diagnostic
capability into its PCs [Planning Review, 1994].
1993-1997: COMPAQ’S REDESIGNED BUSINESS PROCESSES
Compaq’s management identified three major business processes that
were critical to its strategy implementation:
1) product design and development,
2) manufacturing and distribution, and
3) pricing.
These processes not only had to be improved; they had to be completely
redesigned.
Product Design and Development Process
Compaq already excelled in product design and development. In 1993 it
began to design products to specific price points--price targets that would
position the company’s products favorably in the market. In addition, its goal was
to be, if not the first, among the first to market with products based on the latest
technology.
Good business practice demanded a cross-functional process. Designers
and engineers needed market information on both market requirements (e.g.,
interoperability of systems components, reducing cost of ownership, typical uses,and configuration preferences), and on competitors’ innovations. Also needed
were data from suppliers and manufacturing information to design-for-
manufacturability. A “best practice” team approach dictated that the marketing

8/14/2019 Compaq Article
http://slidepdf.com/reader/full/compaq-article 20/61
Communications of AIS Volume 1, Article 8 A Balanced Scorecard Analysis of Compaq Computer Corporation by W.F. Wright et al. 20
Figure 3: Compaq’s Build to Forecast System
Legacy Systems
ProductionPlanning
FinishedG oodsMgmt.
RawMaterials
Mgmt.
C ustomer C ommunications
PCs andParts
C ompaq Internal C ommunications
External Communications
OutsourcedW arranty Repair
OutsourcedW arranty Repair
Suppliers
Distribution Accounti ng
Forecasting
Cust
Cust
VA R
Order InfoProcesssing
R etailer
Production
PRODUCT
Repairs
Orders/Quotes/Products
Repairs
Orders/Quotes/Products
Supplies
PRODUCT
BUILD TO FORECAST
Orders Entry (phone, fax,mail, web)VAR provides customer servicePurchasingGreater Parts InventoryDemandsProduction PlanningEasier to managecommunications
ProductionLarger batch sizes increase economiesConfiguration VAR configures PCMore inventory requiredGreater chance of obsolescent inventoryDistributionFewer, less frequent larger shipmentsRequires Finished Goods Inventory-4 Weeks Price Protection

8/14/2019 Compaq Article
http://slidepdf.com/reader/full/compaq-article 21/61
Communications of AIS Volume 1, Article 8 A Balanced Scorecard Analysis of Compaq Computer Corporation by W.F. Wright et al. 21
Figure 4. Compaq’s Build to Order System
BUILD TO ORDER
Orders (phone, fax, mail, web)Compaq receives order Direct+ or WWWCompaq provides customer servicesVAR recieves order - Provides servicePurchasing - Goal: No InventoryRequires vertical integration of communicationsProduction PlanningRequires extremely efficient supplier linkagesRequires extremely efficient productionprocesses
Enterprise System
OrderProcessing
PRODUCT
PRODUCT
G lobal Extranet(~7000 Resellersand Partners)
g
Accounting
R etailers
VA R C ompaqDirect Sales
Cust
Cust
P roduction
FedexDistribution
PRODUCT
ORDERS/QUOTES
ORDERS/QUOTES
P roductionP lanning
Suppliers
SUPPLIES
OutsourcedW arranty R epair
Repairs
OutsourcedW arranty
RepairRepairs
PRODUCT
ORDERS/QUOTES
Repairs
Cust
C ompaq Network Communications
VAR Network Communications
PCs and Parts
C ustomer C ommunications
Production/ Configuration - Goal no InventorySmaller batch sizes diminish economies of scaleCompaq or VAR configures PC for customerGoal no InventoryFar more demanding logistics and turnaroundDistributionExtremely frequent small/ single item shipments

8/14/2019 Compaq Article
http://slidepdf.com/reader/full/compaq-article 22/61
Communications of AIS Volume 1, Article 8 A Balanced Scorecard Analysis of Compaq Computer Corporation by W.F. Wright et al. 22
members of the team specify the product requirements and the manufacturing
members set the production constraints.
Manufacturing and Distribution Processes
To compete with Dell, Compaq needed to improve its inventorymanagement. Build-to-order should eliminate these problems by reducing
inventory levels. Build-to-order, however, requires a much higher level of supply
chain integration and management: Physical inventory must be replaced with
information. Suppliers must know their delivery requirements almost as soon as
Compaq does. If the flow of products were to be delayed, Compaq would not
have the parts and subassemblies necessary to assemble complete PCs, and
the build-to-order process would break down. Also, Compaq works with multiple
suppliers and operates assembly plants around the world, placing further
demands on management to balance supplier capabilities while keeping the
manufacturing facilities operating smoothly and efficiently. In 1994 Compaq
began developing a SAP-based total order planning system (TOPS) that could
meet its global information requirements and allow it to convert to build-to-order
(see Figures 3 and 4).
Pricing Process
Compaq’s pricing objectives are ambitious: It wants to set the prices for
the market. At the same time, it also wants to create value for its customers in
ways that will differentiate its products. In this highly competitive industry,
achieving these pricing goals requires detailed and timely sales information. The
agile company that can adjust to changes in the volatile marketplace is the one
that succeeds. In the retail channel, Compaq wanted sales information on a daily
basis to price its products correctly without compromising its profit margins. In the
reseller channel, Compaq needed more timely information about its endcustomers’ requirements so that it could develop solutions that would add more
value than competitors’ products at a lower total cost of ownership.
One aspect of pricing is product quality, i.e., does the product meet all of
the customer’s requirements. Compaq’s success in the major corporate market

8/14/2019 Compaq Article
http://slidepdf.com/reader/full/compaq-article 23/61
Communications of AIS Volume 1, Article 8 A Balanced Scorecard Analysis of Compaq Computer Corporation by W.F. Wright et al. 23
hinges on its ability to deliver complete enterprise-wide solutions. Its customers
typically seek to avoid dealing with multiple vendors, and they do not want to
struggle to integrate potentially incompatible products. They want Compaq to
provide complete solutions and then price the products appropriately. Consistent
with these objectives, to add the necessary expertise and product lines, Compaq
acquired both Microcom Corporation and Tandem Corporation in 1997 (and
Digital Equipment Corporation in 1998). Also, Compaq formed alliances with
major software vendors such as SAP AG, BAAN, PeopleSoft, and Microsoft.
1994-1996: COMPAQ RESTRUCTURES
Ultimately, the performance of any business process depends on the both
the abilities and knowledge of the people that perform that process, their incentives and management’s practices. Reengineering efforts align decision-
making with operation of business processes. Consequently, management
becomes both cross-functional and cross-process in scope, with decision making
assigned to “put the decision point where the work is performed and build control
into the process” [Hammer, 1990].
The success of any organizational change depends on the culture at the
process level, the degree of centralization of common processes, and the nature
of information sharing. Unless the organization is committed to operational
excellence, there is little hope of achieving best in class performance [Porter,
1996]. Hammer’s 1990 article advised companies to “organize around
outcomes,” and Compaq sought just that. In July 1996, Compaq announced a
new organization consisting of three groups: [Frank, 1996]• PC Products Group - desktop and mobile computing businesses, a
new communications business, and products for the small to medium
business market;• Consumer Products Group - personal consumer market;• Enterprise Computing Group - enterprise software solutions, especially
customer use of SAP AG’s R/3 software.

8/14/2019 Compaq Article
http://slidepdf.com/reader/full/compaq-article 24/61
Communications of AIS Volume 1, Article 8 A Balanced Scorecard Analysis of Compaq Computer Corporation by W.F. Wright et al. 24
This new structure was designed to align the organization along its value
chains and give Compaq’s managers an integrated view of the company’s critical
business processes. At the same time, Compaq’s alliances and acquisitions
allowed it to increase the scope of its services, broaden its markets, and expand
its level of expertise in the enterprise computing business. However, these
structural changes also created greater demands for information sharing.
Compaq’s managers more than ever needed to communicate, collaborate, and
coordinate their activities around the world.
1994-1997: COMPAQ’S NEW ENTERPRISE INFORMATION SYSTEM
Restructuring an organization around new business processes requires an
enterprise information system that can capture and integrate information across
the entire value chain. As an organization seeks to assign decision rights at the
process level, the timeliness and accuracy of the decisions becomes dependent
on access to necessary information. Therefore, successful implementation of
Pfeiffer’s strategy depended critically on the ability to deliver information in a
timely, reliable, and usable manner. One recurrent theme among Compaq’s
process improvements was the role of information, integrated enterprise-wide, to
support and measure process performance.To obtain the required technology, Compaq tapped both its own resources
and those of its major partners. Compaq became its own customer. The solutions
that it was developing for its largest corporate customers were also applied within
Compaq itself. First, Compaq committed early to use of its own servers and the
Windows NT™ operating system software. Second, it further developed
relationships with the major vendors of enterprise-wide information systems. To
some degree Compaq’s success in the business market depended on whether its servers running Windows NT™ could support enterprise-wide implementation
of SAP R/3 and other systems; this was its opportunity to demonstrate that its
products could provide a complete solution for its largest customers.
8/14/2019 Compaq Article
http://slidepdf.com/reader/full/compaq-article 25/61
Communications of AIS Volume 1, Article 8 A Balanced Scorecard Analysis of Compaq Computer Corporation by W.F. Wright et al. 25
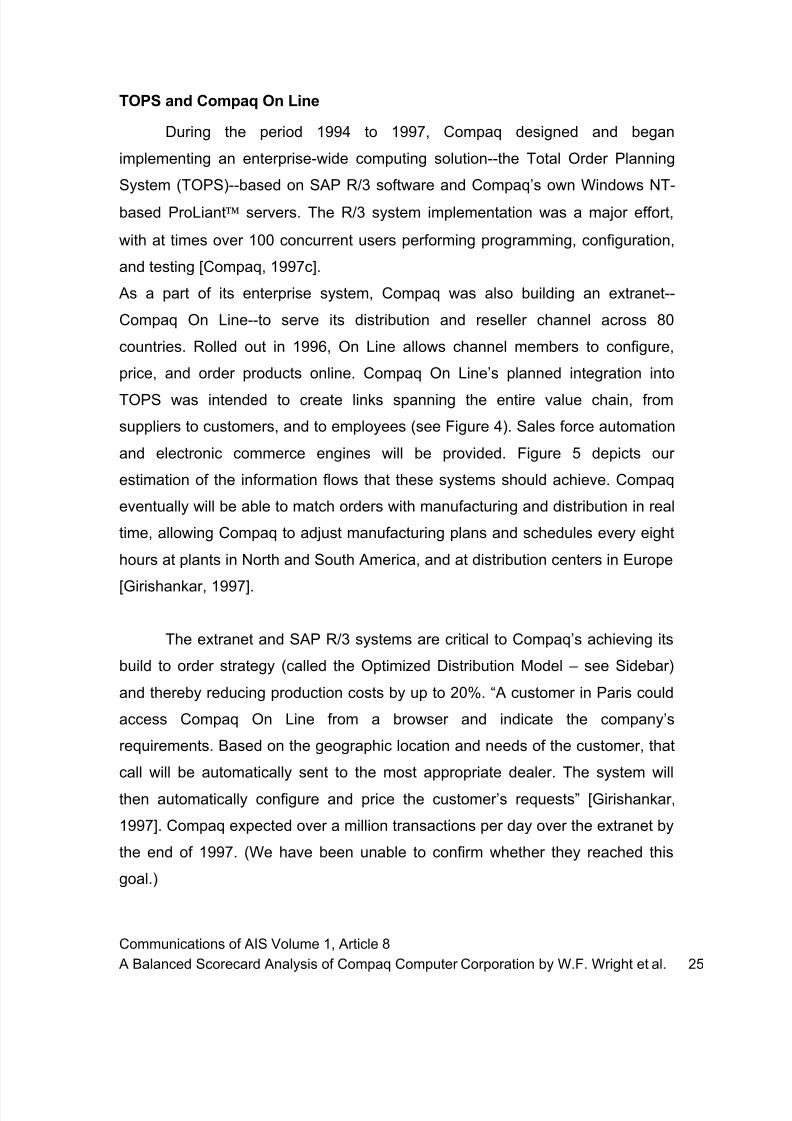
TOPS and Compaq On Line
During the period 1994 to 1997, Compaq designed and began
implementing an enterprise-wide computing solution--the Total Order Planning
System (TOPS)--based on SAP R/3 software and Compaq’s own Windows NT-
based ProLiant ™ servers. The R/3 system implementation was a major effort,
with at times over 100 concurrent users performing programming, configuration,
and testing [Compaq, 1997c].
As a part of its enterprise system, Compaq was also building an extranet--
Compaq On Line--to serve its distribution and reseller channel across 80
countries. Rolled out in 1996, On Line allows channel members to configure,
price, and order products online. Compaq On Line’s planned integration into
TOPS was intended to create links spanning the entire value chain, from
suppliers to customers, and to employees (see Figure 4). Sales force automation
and electronic commerce engines will be provided. Figure 5 depicts our
estimation of the information flows that these systems should achieve. Compaq
eventually will be able to match orders with manufacturing and distribution in real
time, allowing Compaq to adjust manufacturing plans and schedules every eight
hours at plants in North and South America, and at distribution centers in Europe
[Girishankar, 1997].
The extranet and SAP R/3 systems are critical to Compaq’s achieving its
build to order strategy (called the Optimized Distribution Model – see Sidebar)
and thereby reducing production costs by up to 20%. “A customer in Paris could
access Compaq On Line from a browser and indicate the company’s
requirements. Based on the geographic location and needs of the customer, that
call will be automatically sent to the most appropriate dealer. The system will
then automatically configure and price the customer’s requests” [Girishankar,
1997]. Compaq expected over a million transactions per day over the extranet by
the end of 1997. (We have been unable to confirm whether they reached this
goal.)

8/14/2019 Compaq Article
http://slidepdf.com/reader/full/compaq-article 26/61
Communications of AIS Volume 1, Article 8 A Balanced Scorecard Analysis of Compaq Computer Corporation by W.F. Wright et al. 26
Figure 5: IT Impact on the Value Chain Role of the Extranet
SIDEBAR: COMPAQ’S OPTIMIZED DISTRIBUTION MODEL
Compaq announced its Optimized Distribution Model (ODM) in 1997 to be
implemented in three phases. The initial phase of ODM is build-to-order (see
sidebar 1), already implemented for its Deskpro line. The second phase is
configure-to-order (CTO) where Compaq will configure products to customer
specification and deliver to resellers (e.g., Radio Shack, CompUSA) to fulfill
the order. The third phase is the Channel Configuration Program (CCP)
where Compaq delivers configurable (partially assembled products) to
resellers who will then customize those products to meet specific customer
requirements.
Compaq also announced that it would certify resellers before those resellers
would be authorized to participate in the CCP. With the ODM, Compaq
plans to integrate business processes spanning the supply chain from
suppliers to final customers [Cunningham and Scannell, 1997].
P R O D U C T I O N
P L A N N I N G
DESIGN& DEVELOPMENT
PRODUCTPLANNING
S A L E
S /
MA RK E T I NF
O
SUPPLIERS INVENTORY MANUFACT-URING
DISTRIBU-TION
RESELLER/DEALER CUSTOMER
INFORMATION TECHNOLOGY

8/14/2019 Compaq Article
http://slidepdf.com/reader/full/compaq-article 27/61
Communications of AIS Volume 1, Article 8 A Balanced Scorecard Analysis of Compaq Computer Corporation by W.F. Wright et al. 27
Expected Enterprise Wide Capabilities
Compaq’s IT architecture is designed to gather information on worldwide
demand and customer preferences, and respond accordingly (see Figure 6). This
enterprise-wide system will allow it to:
1. Monitor supply and demand factors around the world on a daily basis,
and better understand customer requirements. Compaq’s senior
management sees--in real time--a global representation of the market
and can respond promptly to market changes.
2. Implement the Optimized Distribution Model to reduce inventory levels
and improve productivity: “We can shift resources rapidly to respond to
changes anywhere in the world, making our planning process much
more agile” [Compaq, 1997c].
3. Automatically make necessary foreign currency translations and
provide the necessary currency information to reduce risk.
4. Make Compaq employees more aware of their roles and
responsibilities--and how their actions affect others. For example, the
marketing people can share information with members of the designand manufacturing team, resulting in products that are more consistent
with customer preferences. Compaq will then be able to respond
rapidly to any competitive pressures [Compaq, 1997c].
5. Share information across its supply chain. A leaner, more focused
organization is created given the electronic commerce capabilities,
improved inventory management, and automated processes such as
the “configurator” applications that allow customers to configure, price,and order systems (see Figure 6). By sharing information electronically
with suppliers, Compaq can effectively outsource many of its
component assembly processes. These changes have already
resulted in a steady increase in Compaq’s sales per employee
[Girishankar, 1997].

8/14/2019 Compaq Article
http://slidepdf.com/reader/full/compaq-article 28/61
Communications of AIS Volume 1, Article 8 A Balanced Scorecard Analysis of Compaq Computer Corporation by W.F. Wright et al. 28
Compaq began implementing its SAP R/3 system in 1995. The R/3 rollout
began with sales offices in Mexico, then Europe, and finally the U.S. The
manufacturing modules of R/3 were scheduled for implementation in an
opposite sequence. The implementation began at plants in Texas in 1996,
and full implementation was scheduled to occur in 1998 [Girishankar, 1997].
(We have been unable to confirm that implementation has been completed
as scheduled.)
Figure 6 Compaq’s Information System Relationships
COMPAQ MGMT
EXECUTIVE INFO
PRODUCTIONDATABASES
CRYSTAL REPORTS
DATA WAREHOUSE
S U
P P L I E R S
SAP R/3
SIEBELSALES TRACKING "CONFIGURATOR"
COMPAQ ON-LINEEXTRANET
RESELLERS
CUSTOMERS
S T O C KH OL DE R S
S UP P L I E R S

8/14/2019 Compaq Article
http://slidepdf.com/reader/full/compaq-article 29/61
Communications of AIS Volume 1, Article 8 A Balanced Scorecard Analysis of Compaq Computer Corporation by W.F. Wright et al. 29
1997: IT Initiatives
In October 1997, Compaq announced new IT initiatives aimed at its goal of
being first in customer satisfaction. The firm enhanced its Compaq On Line
system to form a new Internet-based system called COLinqPlus (Compaq On
Line Linq). This tool allows resellers and retailers to order and track parts
movement electronically in real-time. It eliminates paperwork requirements for
processes like warranty labor reimbursements and saves time. At the same time,
Compaq announced an automated “My Voice” on-line customer satisfaction
tracking systems. This system collects customer responses after service calls to
measure satisfaction and evaluate the level of service provided [Compaq,
1997d].
IV. A BALANCED SCORECARD ANALYSIS OF COMPAQ’S
PERFORMANCE AND USE OF IT
OVERVIEW
In Section III we described Compaq’s new business strategy and the
technology-enabled changes Compaq made, and is continuing to make, to its
business processes. But how do we measure the payoff from its investment in
information technology? The literature suggests that the payoff from IT should
be evaluated in terms of the business objectives that it supports. For example,
Mooney, Gurbaxani, and Kraemer [1995] recommend measuring IT value against
its support for intermediate process goals that form a firm’s overall strategy;
Brynjolfsson and Hitt [1997] indicate that “[t]echnology must be aligned with the
core competencies of the company to deliver true value.” We adopt this
perspective. We address the impact of improvements in both the efficiency and
effectiveness of the affected business processes. Most important, we consider
not only past results but also implied future benefits.
FINANCIAL ACCOUNTING MEASURES OF ENTERPRISE PERFORMANCE
Executive management needs performance measurements that indicate
the extent to which the company is achieving its strategic objectives. While they
8/14/2019 Compaq Article
http://slidepdf.com/reader/full/compaq-article 30/61
Communications of AIS Volume 1, Article 8 A Balanced Scorecard Analysis of Compaq Computer Corporation by W.F. Wright et al. 30
are used extensively, traditional financial accounting measurements do not
reveal adequately the benefits of investing in information technologies. Financial
accounting measurements do inform management of historical outcomes but do
not indicate why those results were achieved or what management must do to
improve future results. Excessive reliance on financial accounting performance
measurements is inadequate at best, and can be very misleading, due to the
following limitations:
1. Financial accounting provides very little indication of why results
were (or were not) achieved or how to improve the firm’s
strategy;
2. Only ill-defined linkages are revealed between the effectiveness
and/or efficiency of business processes and financial results;
3. Long-term assets are reported at historical cost, which may be
unrelated to current value;
4. Management treats economic events subjectively by selecting
among feasible accounting methods.
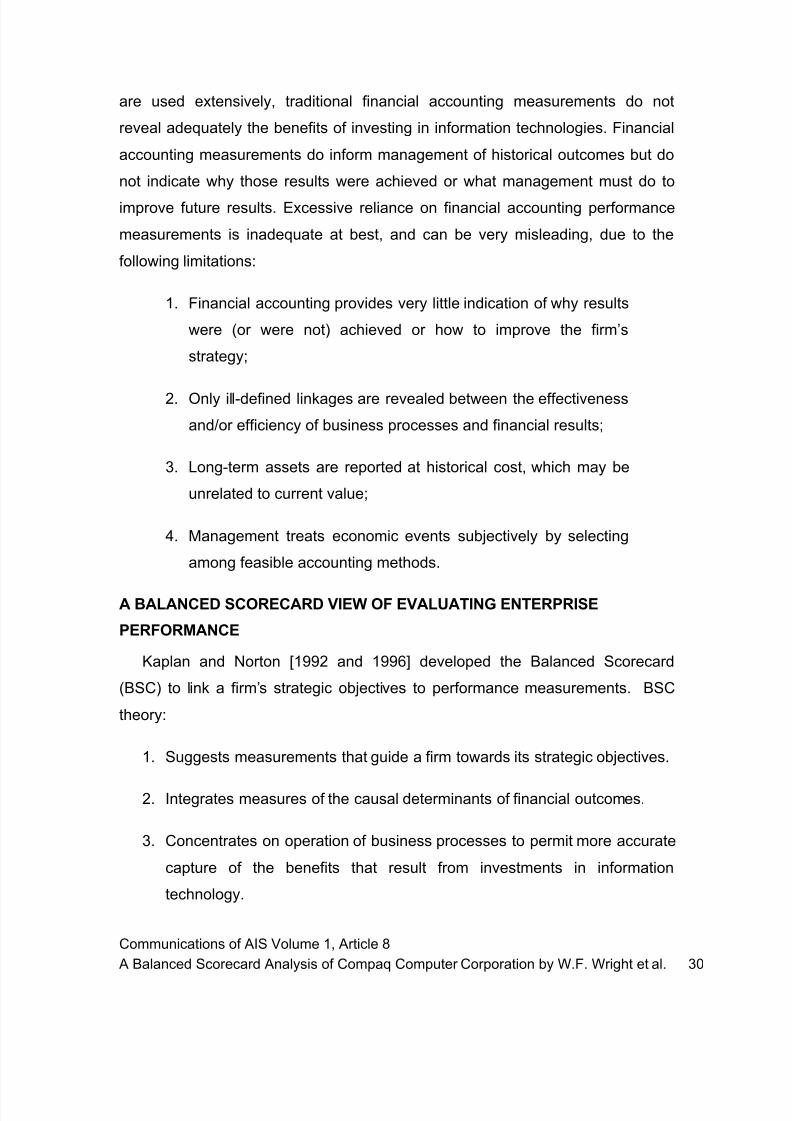
A BALANCED SCORECARD VIEW OF EVALUATING ENTERPRISE
PERFORMANCE
Kaplan and Norton [1992 and 1996] developed the Balanced Scorecard
(BSC) to link a firm’s strategic objectives to performance measurements. BSC
theory:
1. Suggests measurements that guide a firm towards its strategic objectives.
2. Integrates measures of the causal determinants of financial outcomes.
3. Concentrates on operation of business processes to permit more accurate
capture of the benefits that result from investments in information
technology.

8/14/2019 Compaq Article
http://slidepdf.com/reader/full/compaq-article 31/61
Communications of AIS Volume 1, Article 8 A Balanced Scorecard Analysis of Compaq Computer Corporation by W.F. Wright et al. 31
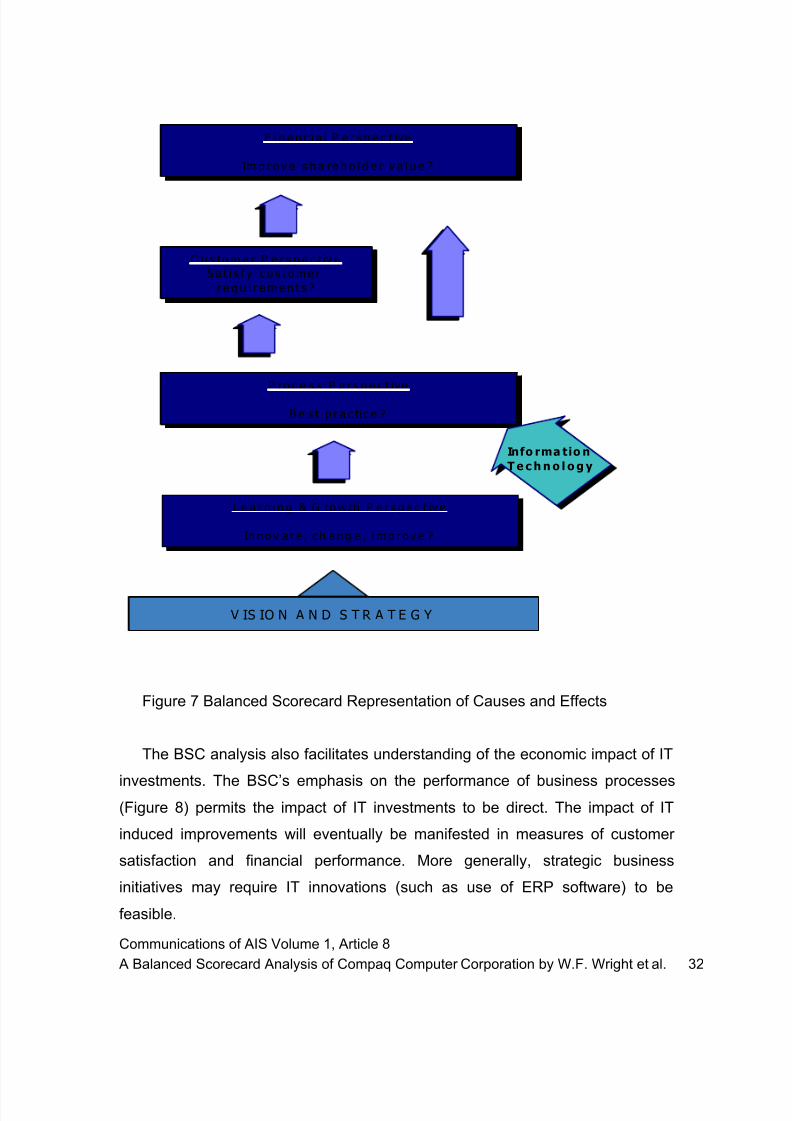
The BSC aligns business process measurements with a firm’s strategic
objectives. Cause and effect linkages are identified from the execution of daily
activities to eventual results. Consistent with this theme, performance
measurements are considered from four perspectives (Figure 7):
1. Learning and growth for the organization and its members . The focus
is on the firm’s employees, their skills, satisfaction, motivation, innovation
and productivity. These attributes precondition process improvements,
customer satisfaction, and ultimately financial success;
2. Operation of internal business processes . The focus is on optimizing
costs, quality, throughput, and time attributes of each process;
3. Satisfaction of customers . The focus is on customer satisfaction and
the resulting changes in market share, new customer acquisition,
customer retention, and customer profitability;
4. Financial results. Based on the above three perspectives, the focus is on
outcome measures of revenue growth, cost reduction, and asset utilization.
Clearly, innovative new products that are accepted enthusiastically by the market
and are produced efficiently will result in superior financial performance.
The first three perspectives yield sets of performance measurements that
are directly implied by the firm’s strategic objectives. However, corporate
stakeholders ultimately want to see results in a language they understand--
financial results.
Both financial and non-financial performance measurements are essential
in a BSC analysis. Measurements are also identified as being either leading or
lagging indicators. Leading measurements motivate future action to improve the
firm’s business processes. The leading indicators are linked to future results; in
contrast, the lagging measurements represent the firm’s effectiveness in
achieving its objectives. Since the lagging measurements document past results,
they may also be studied to achieve more efficient use of the firm’s resources.
8/14/2019 Compaq Article
http://slidepdf.com/reader/full/compaq-article 32/61
Communications of AIS Volume 1, Article 8 A Balanced Scorecard Analysis of Compaq Computer Corporation by W.F. Wright et al. 32
Figure 7 Balanced Scorecard Representation of Causes and Effects
The BSC analysis also facilitates understanding of the economic impact of IT
investments. The BSC’s emphasis on the performance of business processes(Figure 8) permits the impact of IT investments to be direct. The impact of IT
induced improvements will eventually be manifested in measures of customer
satisfaction and financial performance. More generally, strategic business
initiatives may require IT innovations (such as use of ERP software) to be
feasible.
V IS IO N A N D S T R A T E G Y
L e a r n i n g & G ro w th P e r s p e c t iv e
In n o v a t e , c h a n g e , i m p r o v e ?
P ro c e s s P e r s p e c t ive
B e s t p r a c tic e ?
C u s to m e r P e r s p e c t iv eS a t i s f y c u s t o m e r
r e q u i r e m e n t s ?
F i n a n c i a l P e r s p e c t ive
Im p r o v e s h a re h o l d e r v a l u e ?
Info rma t io nTe c h n o l o g y

8/14/2019 Compaq Article
http://slidepdf.com/reader/full/compaq-article 33/61
Communications of AIS Volume 1, Article 8 A Balanced Scorecard Analysis of Compaq Computer Corporation by W.F. Wright et al. 33
Innovation Cycle Under $1000 PCs;
Products pre-configured w/SAPand other business software;
Pricing innovations; Design to market requirements -
workstations, laptops,high perf desktops
Operations Cycle Optomized DistributionModel;
JIT Manufacturing; Outsourcing;
Build-to-Order; Reduced cycle times; Order process linked to production, suppliers;
Global production optimization
Learning&Growth Alliances;
Partnerships; Acquisit ions;
Incentives; SAP and global extranet
systems; Use of internet
Customer Objectives Aggressive pricing - 10-15%
reductions per qtr in 1997; Expand markets - households
w/o PCs, large business; Establish image/brand name;
Improve relationships w/VARsvia extranet access;
Increase market share to 19%
of U.S;
Financial Objectives Earnings growth > 50%; Revenue growth > 30%;
Sales volume growth > 50%; EVA > $440 MM;
Inventory turns > 10; Long term debt < $80 MM;
ROE > 21%; ROA > 12%
Improved customer requirement info;New capabilities
Quality improvements; Improved coordination; Integrated information
Design to lower prices; New product capabilities; Better service programs
Lower costs; Improved service; Improved access Lower operating costs;
Improved use of resources; Reduced waste/obsolete inventory
Market expansion; New market segments; Customer satisfaction
Business Processes
Figure 8 Compaq’s Balanced Scorecard Objectives

8/14/2019 Compaq Article
http://slidepdf.com/reader/full/compaq-article 34/61
Communications of AIS Volume 1, Article 8 A Balanced Scorecard Analysis of Compaq Computer Corporation by W.F. Wright et al. 34
1997 Performance Results: Financial Outcome Measures
Tables 1 and 2 in Section II measured Compaq’s performance compared
to that of Dell and Gateway. The results depict the success of Compaq’s
changed business strategy and the benefits achieved from its use of enterprise-
wide IT.
From 1992 to 1997, Compaq’s net sales rose from $4 billion to over $24 billion.
The firm sustained a revenue growth rate of over 31% over 60 months [Hoovers,
1998]. Annual net income increased from $213 million to over $1.8 billion over
the same period, while inventory turnover almost doubled (Figures 9, 10, and
11).
Figure 9 Compaq Financial Indicators 1992-1998; Market Value, S&P, and PC industry Indexes (Source: CSI Inc., via Microsoft Investor)
0
10,000
20,000
30,000
40,000
50,000
60,000
6-92 12-92 6-93 12-93 6-94 12-94 6-95 12-95 6-96 12-96 6-97 12-97 6-98 Quarter and Year
$MM
Compaq Mkt ValueS&P IndexPC Industry Index

8/14/2019 Compaq Article
http://slidepdf.com/reader/full/compaq-article 35/61
Communications of AIS Volume 1, Article 8 A Balanced Scorecard Analysis of Compaq Computer Corporation by W.F. Wright et al. 35
Figure 10. Compaq Financial Highlights 1992-1998
Com a Financial Performance and
not includin 1998 2nd tr
0
5
10
15
20
25
30
35
40
Jun-92
Sep-92
Dec-92
Mar-93
Jun-93
Sep-93
Dec-93
Mar-94
Jun-94
Sep-94
Dec-94
Mar-95
Jun-95
Sep-95
Dec-95
Mar-96
Jun-96
Sep-96
Dec-96
Mar-97
Jun-97
Sep-97
Dec-97
Mar-98
Jun-98
Quarter Year
$StockPrice
/
%NetPr ofit
0.00
0.10
0.20
0.30
0.40
0.50
0.60
0.70
0.80
0.90
1.00
$EPS
Stock Price
Net Profit MgnEPS

8/14/2019 Compaq Article
http://slidepdf.com/reader/full/compaq-article 36/61
Communications of AIS Volume 1, Article 8 A Balanced Scorecard Analysis of Compaq Computer Corporation by W.F. Wright et al. 36
Figure 11. Compaq Inventory Turnover 1992-1998
During the fourth quarter of fiscal 1997, Compaq’s unit sales jumped 52%
versus fourth quarter 1996 [Waurzyniak,1998]. Over the same time period,
Compaq’s gross profit margin edged up to 27.6%, and inventory turnover
increased from 7.1 to 12.6 times. Compaq’s cash balance improved to $6.8
billion (up $3.8 billion in the nine months since the end of fiscal 1996), and the
Economic Value Added (EVA) grew by over 150%. The $300 million long-term
COMPAQ COMPUTER COMPANYFinancial Performance Indicators
0
2
4
6
8
10
12
14
Jun-92 Dec-92 Jun-93 Dec-93 Jun-94 Dec-94 Jun-95 Dec-95 Jun-96 Dec-96 Jun-97 Dec-97 Jun-98
T u r n o v e r
t i m e s p e r y e a r
0.0
5.0
10.0
15.0
20.0
25.0
30.0
35.0
40.0
P r o
f i t m a r g
i n s
( % )
Inv Turnover
GP Margin

8/14/2019 Compaq Article
http://slidepdf.com/reader/full/compaq-article 37/61
Communications of AIS Volume 1, Article 8 A Balanced Scorecard Analysis of Compaq Computer Corporation by W.F. Wright et al. 37
debt balance at the end of fiscal 1996 was eliminated early in 1997; Compaq was
essentially free of long-term debt [Compaq, 1998a].
All of these results occurred in a competitive environment where prices for
PC products were decreasing as fast as 15% per quarter. Consistent with one of its strategic objectives, Compaq itself drove some of the price reductions, yet it
was able to maintain one of the highest gross profit margins in the industry.
Compaq’s use of IT to improve its processes and implement its strategic
objectives contributed to its economic success in a very competitive market.
Kaplan and Norton [1996] argue for a comprehensive approach to business
strategy. Firms should choose the market and customer segments the business
unit intends to serve, identify critical business processes that must deliver value
to those customers, and select the individual and organizational capabilities that
are required to meet these objectives. Using this approach, we examine the
cause and effect relationships that drive Compaq’s performance, as presented in
Figure 8.
Customer Objectives
Ultimately, a company must deliver value to its customers. Kaplan and
Norton describe value as a function of product attributes (e.g., functionality,quality, price, and timeliness), company image, and customer relationships.
Compaq tries to deliver value through its pricing, promotion, and customer
service initiatives to increase market share. As was shown in Figure 1, Compaq
steadily improved its market share from 9.3% of the U.S. market in 1993 to
18.1% in the fourth quarter of 1997 [Waurzyniak, 1998].
Market share provides one important measure of customer satisfaction; it
reflects marketplace acceptance of the price and performance of Compaq’s
products. It also clearly indicates the effect of the effort that Compaq made to
create a positive image and develop relationships with its customers. Hanspeter
Eiselt, Compaq senior business manager for desktop PCs, described the
company’s high ranking in the 1996 annual VARBusiness Magazine Report
Card: “In the past year, Compaq made a conscious effort to work and

8/14/2019 Compaq Article
http://slidepdf.com/reader/full/compaq-article 38/61
Communications of AIS Volume 1, Article 8 A Balanced Scorecard Analysis of Compaq Computer Corporation by W.F. Wright et al. 38
communicate with its reseller community - an effort that paid off in first-place
scores for both support and partnership” [Jordan, 1996]. While the firm continues
to excel at product quality and functionality, Compaq slipped in the 1997
VARBusiness Magazine Report Card, in terms of product availability and profit
potential for value added resellers (VARs) [Melymuka, 1997].
Compaq competes in a dynamic marketplace. Customers’ requirements
change. Relationships can be short-lived. Therefore, retaining a customer can be
difficult. Compaq is betting that it can create and sustain value by expanding its
product lines and increasing its service capabilities, combining the resources of
Compaq, Tandem, and Digital to “deliver the best computing solutions and
innovative products and technologies, all backed by global services and support”
[Compaq, 1998c].
Business Process Objectives
As shown in Figure 8, Kaplan and Norton describe two process cycles that
span the gap between identifying and satisfying customer needs. First, during the
first innovation cycle, products are designed and developed. Then, during the
operations cycle, products are made, marketed, and serviced. The performance
of these two cycles creates value for the customer and for the business itself.
Suitable use of information technology can profoundly improve these cycles.
Innovation Cycle
The causal links between the innovation cycle and customer value are
shown in Figure 8. According to Kaplan and Norton [1996], “[t]he innovation
process, the long wave, of value creation, is for many companies a more
powerful driver of future financial performance than the short-term operating
cycle.” For Compaq, the innovation cycle is focused on speed. “Compaq thrives
on speed--speedy revenue growth, speedy market share gains, speed in enteringnew business, speed in manufacturing” [Kirkpatrick and Curry, 1996]. John Rose
of Compaq summed it up: “The environment is changing, and you’d better be
innovative--not just in your products but in every part of your business”
[Kirkpatrick and Curry, 1996].

8/14/2019 Compaq Article
http://slidepdf.com/reader/full/compaq-article 39/61
Communications of AIS Volume 1, Article 8 A Balanced Scorecard Analysis of Compaq Computer Corporation by W.F. Wright et al. 39
Compaq’s product innovation focuses on specific market objectives and
price points, reducing time to market, and designing products to match customer
requirements while considering component availability. A recent example is the
under-$1000 PC. Compaq was first to offer significant PC performance at that
price. Compaq’s PCs quickly captured almost 40% of the under-$1000 retail
market in 1997, attracting buyers that had previously been unable to afford PCs
[Zlotnikov, 1997]. Most importantly, Compaq was able to design and develop this
product at a price point that allowed them to maintain their gross profit margin.
Compaq’s reengineering efforts reduced the time-to-market of its new
products. These new products emphasize enhanced functionality, or price
advantages, which in turn improve customer satisfaction and product image
[Jordan, 1996].
Operations Cycle
For Compaq, the operations cycle encompasses sourcing parts and
components, manufacturing, configuring, marketing, distributing, and servicing
products after the sale. The operations cycle has been a major focus of
Compaq’s reengineering efforts since 1994, when CEO Pfeiffer stated,
“Reengineering of the business process is our No. 1 priority. The reorganization
brings us a higher level of customer focus” [Damore and Gillooly, 1994]. The
reengineering projects included expansion of the company’s distribution center,
the implementation of a new inventory tracking system and an overhaul of the
company’s information management system.
Compaq’s ongoing reengineering efforts continue to emphasize process
efficiency. At the end of 1995, Vice President of Compaq’s North American
Operations Ross Cooley said, “I’ve been asked what worries me at night; one
thing is our ability to reengineer Compaq for the size it is today and will betomorrow. And the reengineering effort is a long effort. It requires changing our
business processes first and then our information systems to support the new
business process” [Farre, 1996]. In 1997, CEO Pfeiffer announced the Optimized
Distribution Model (ODM) (see Sidebar). He also described the objectives for

8/14/2019 Compaq Article
http://slidepdf.com/reader/full/compaq-article 40/61
Communications of AIS Volume 1, Article 8 A Balanced Scorecard Analysis of Compaq Computer Corporation by W.F. Wright et al. 40
any cost savings that would result: “All those cost savings will not end up on the
bottom line. They will flow back into our prices being more competitive, pushing
our market share...to get the inefficiency out and refunnel the money into those
things that really create success and customer satisfaction” [Farre, 1997].
Compaq relied heavily on enterprise-level information technology to
achieve reengineering gains. It pushed the envelope on emerging technologies.
Its own IT system includes 15,000 nodes with 2,000 servers in more than 30
countries. Originally running UNIX-based systems, Compaq committed to the use
of Windows NT before it was fully proven in such an environment [Gillooly and
Thyfault, 1994].
By 1997, Compaq was using SAP R/3 software to integrate its business
processes and sales information while it completed its systems implementationschedule. It was building a global extranet (Compaq On Line) to provide
customers with “configurator” applications to automatically configure and order
PCs and servers [Girishankar, 1997]. In mid-1997, Compaq opened its Internet
shopping service, allowing customers to order Compaq products directly from
Compaq’s At Home website [Kanellos, 1997]. These innovations allow Compaq
to achieve process efficiencies, including the following:
∗ Linking orders electronically with production and suppliers,
improving cycle time; facilitating just-in-time manufacturing, and
making production status information available so that customers
can track their own orders;
∗ Sharing information with suppliers allows them to anticipate
changes in Compaq’s demand and improve their efficiency,
thereby reducing costs of supplies and improving on-time delivery;
∗ Exchanging information on parts and component availability with
suppliers allows products to be configured with the most
economical and readily available components, reducing costs and
improving cycle time;

8/14/2019 Compaq Article
http://slidepdf.com/reader/full/compaq-article 41/61
Communications of AIS Volume 1, Article 8 A Balanced Scorecard Analysis of Compaq Computer Corporation by W.F. Wright et al. 41
∗ Integrating orders with SAP’s financial management and
production planning modules, reducing time and cost of orders
processing for both Compaq, its resellers, and its other customers;
∗ Capturing customer information after a sale to provideindividualized service as well as additional marketing based on
information about the specific products and configurations ordered
by each customer.
These process efficiencies would not have been possible without
the large investment in information technology made by Compaq. In
addition to creating the systems, Compaq’s employees must take on the
daunting task of learning the new systems and continually improving them
over time.
Learning and Growth Objectives
A company cannot innovate or operate well without creating long-term
learning and growth. Organizational learning and growth come from three
principal sources: people, systems, and organizational procedures. We have
already outlined how Compaq’s systems and procedures provide information
about business processes, customers, and the competitive environment.
Compaq’s people must then have the requisite skills and incentives to
accomplish its business strategy.
Compaq always relied on its “virtual organization” for the capabilities that it
lacked to develop innovative products and deliver superior customer service.
Compaq has a “partnership-integrated model” of business [Kirpatrick and Curry
1996]. Because its research and development budget is relatively limited, it uses
partnerships and alliances with other industry leaders for mutual benefit.Compaq’s Bob Stearns expressed the importance of these relationships: “Our
partnerships are part of our research and development budget” [Kirkpatrick and
Curry 1996].

8/14/2019 Compaq Article
http://slidepdf.com/reader/full/compaq-article 42/61
Communications of AIS Volume 1, Article 8 A Balanced Scorecard Analysis of Compaq Computer Corporation by W.F. Wright et al. 42
Compaq, for example, uses alliances with value-added resellers to extend
its own capabilities to meet customer requirements and obtain information on
customer needs and preferences. For example, large business customers are
accustomed to the kind of handholding for which IBM is famous. The VARs
provide this capability for Compaq, so “Compaq gets to play in the big-iron
business without incurring the costs of running its own services and software
business” [McWilliams, 1996].
Partnerships allow Compaq to focus on its core competencies. For
example, Compaq management determined that product warranty repairs and
service is not a core competency, so it contracted with Digital Equipment as its
worldwide service provider [Farre, 1996]. Partnerships also open new markets
and create synergistic demand for both partners’ products: for example, thepartnership with Siebel Corporation, where Siebel promotes Compaq products
and vice versa. 1 Compaq’s extranet and electronic commerce systems are
designed to achieve efficient exchange of information to and from its partners.
Well before the extranet, Compaq was an early user of Lotus Notes™, placing
Notes servers in large customer sites to exchange business and technical
information [Gillooley and Thyfault, 1994].
Where capabilities are particularly important to its strategic objectives,
making partnerships less desirable, Compaq used its financial strength to acquire
them. These acquisitions gave Compaq the expertise in networking and
transaction-intensive systems needed for the large business market.
A PERFORMANCE MODEL OF COMPAQ
We described Compaq’s performance prior to 1998 based on the four
BSC perspectives and their linkage with Compaq’s strategic goals. In this
section, we show how performance along one dimension drives performancealong other dimensions.
1 The Siebel/Compaq partnership includes testing of Siebal software to ensure that it operatesproperly on Compaq hardware; Siebel then recommends that its customers use Compaqproducts to ensure proper operation of the software; in return, Compaq preloads the software onmachines and promotes Siebel to its customers.

8/14/2019 Compaq Article
http://slidepdf.com/reader/full/compaq-article 43/61
Communications of AIS Volume 1, Article 8 A Balanced Scorecard Analysis of Compaq Computer Corporation by W.F. Wright et al. 43
In Section III, we described Compaq’s growth strategy, which emphasizes
build-to-order manufacturing, multi-channel distribution, and pricing, promotion,
and customer service. To achieve growth, any company needs to keep current
customers and acquire new ones--it must create customer satisfaction. Compaq
focused on the drivers of customer satisfaction:
• price,
• brand image, and
• service.
Price
Compaq determined that the most important driver of customer
satisfaction was price. Reductions in prices should be accompanied by
reductions in costs. Compaq reduced its costs by achieving process efficiency.
As described above, Compaq has been engaged in a series of process
reengineering efforts since 1993 that reduced cycle times, increased inventory
turnover, and reduced the cost of raw materials. These efficiencies allowed
Compaq to reduce prices as much as 15% per quarter during 1997, thereby
driving customer satisfaction.
Brand Image
In addition to its aggressive advertising and promotional programs,
Compaq reinforced its brand image by improving the functionality of its products
and scope of its product line. This is where the innovation cycle and the speed
with which Compaq innovates are most important. By reengineering its product
innovation processes, Compaq was able to reduce time to market and enhance
product functionality while designing products that were less costly tomanufacture. Product innovation allowed them to meet changing customer
requirements and drives customer satisfaction.

8/14/2019 Compaq Article
http://slidepdf.com/reader/full/compaq-article 44/61
Communications of AIS Volume 1, Article 8 A Balanced Scorecard Analysis of Compaq Computer Corporation by W.F. Wright et al. 44
Service
Compaq uses its multi-channel distribution model to increase customer
service. Its VAR network allows it to provide the specialized level of customer
service that major business customers expect. But, its VARs are also its
customers. Therefore, it implemented information systems that make it easier for
them to do business with Compaq, for example on line ordering via the extranet
(Compaq CoLing). Compaq serves its resellers so they can provide a higher level
of customer service and again drive customer satisfaction.
Achieving these process level improvements to enhance customer
satisfaction requires organizational learning and growth. Compaq’s management
had to become even more knowledgeable about customer requirements. It
constantly monitored and improved its processes to keep costs down. Its
enterprise-wide systems feed Compaq’s management with information that
should allow them to make better decisions and improve process performance,
which in turn drive customer satisfaction.
To meet its growth objective, used process improvements (which are in
turn driven by enhanced learning) to achieve more revenue dollars, higher net
income, and a greater return on investment for its stockholders. Figure 12
provides an example of how initiatives along one balanced scorecard perspectivedrive performance at the next, ultimately creating increased customer satisfaction
and increased market growth.
COMPAQ FALTERS IN 1998
In 1997, Compaq’s financial performance was the best in its history. Their
strategy was highly successful, as indicated by their results along all the
Balanced Scorecard perspectives. In 1998, however, Compaq’s financial
performance suffered. During the first six months of 1998, they lost over $3billion. Excluding the $3.6 billion charges attributable to the merger with Digital
Equipment Corporation, their net income was barely positive. Revenues grew
less than 5% over the same period in 1997. Industry analysts blamed Compaq’s
problems on its return to the old practice of “channel stuffing” (selling inventory to

8/14/2019 Compaq Article
http://slidepdf.com/reader/full/compaq-article 45/61
Communications of AIS Volume 1, Article 8 A Balanced Scorecard Analysis of Compaq Computer Corporation by W.F. Wright et al. 45
New Product Innovation CycleDesigned version of PC whichcould be profi tably marketed
at under $1000;Pricing innovations;
Process innovations;Component innovations
Changed Operations CycleO utsourcing assem bly of under $1000 PCs
limits inventory levels;Efficient manufacturing & distribution cuts
operating cost per unit;Improved sourcing to keep f low of low cost
components ;Over 100,000 units in the channel at product
announcem ent - faster response to market
Learning&GrowthRecognit ion of demand for
under $1000 PC; Al l ian ce wi th Ko rean f irm to
assem ble under $1000 PC;Partnerships with RadioShack and retai l chains
Customer Results Ag gr essive pricing - PC un der
$1000 now under $800;Expand m arkets - households
w/o PCs;Establish image/brand name;
Increase market share to 40%of consum er marke t
Ann ua l Finan cialResults - 1997
Revenue up 36%;Sales volume up 51%;
Gross margin improved to27 .5%;
Net income up 41%
Improved customer requirem ent info;Improved manufacturing capability;Drives innovations
Improved coordination;Integrated informa tion;Drives efficient operations
Design to lower price w/adequate functionality;
Drives custom er satisfaction
Lower costs allow lower prices;Drives custom er satisfaction
Lower operating costs;Improved use of resources;Drives higher net income
Customer satisfaction creates newor expanded m arkets , dr ivesincreased volum es, revenues
Business Processes
Figure 12. Compaq’s 1997 Performance Based on the Balanced Scorecard

8/14/2019 Compaq Article
http://slidepdf.com/reader/full/compaq-article 46/61
Communications of AIS Volume 1, Article 8 A Balanced Scorecard Analysis of Compaq Computer Corporation by W.F. Wright et al. 46
channel partners in excess of anticipated end user sales), while intense
competition in the industry was driving prices down and sales were slowing.
Just as the Balanced Scorecard presented a performance model for Compaq in
1997, it also provides insights into Compaq’s misfortunes during 1998. The four
Balanced Scorecard perspectives provide a causal model that allows us to
understand some of the complex reasons for Compaq’s rapid performance
decline in 1998.
Just as the Balanced Scorecard presented a performance model for
Compaq in 1997, it also provides insights into Compaq’s misfortunes during
1998. The four Balanced Scorecard perspectives provide a causal model that
allows us to understand some of the complex reasons for Compaq’s rapid
performance decline in 1998.Compaq’s performance began to suffer as Compaq pursued the
acquisition of Digital Equipment Corporation. The DEC acquisition was much
larger and more complicated than Compaq’s earlier acquisitions of Tandem and
Microcom. Compaq’s and DEC’s product lines overlapped significantly. There
were legal and regulatory issues. There were financial and organizational
issues. Addressing these myriad issues competed for management attention at
all levels in Compaq.
Although the DEC acquisition gave Compaq the service infrastructure that
it needed to compete in the enterprise computing market, overall learning and
growth suffered as Compaq’s workforce contemplated the impact of the merger.
As many as 20,000 workers might be laid-off [Wilcox, 1998]. Some of those
layoffs would be within Compaq. Reorganization and planning for the combined
company took precedence over improving the old company. Information systems
had to be redesigned. Coordination at all levels became more complicated.
Formal networks to support the operation of the company were in some measure
supplanted by informal networks addressing merger issues.
The consolidation of facilities and business processes was more important
than process innovation in the short run. Compaq could not focus on faster cycle
times and lower inventory levels until it decided which products it would keep,

8/14/2019 Compaq Article
http://slidepdf.com/reader/full/compaq-article 47/61
Communications of AIS Volume 1, Article 8 A Balanced Scorecard Analysis of Compaq Computer Corporation by W.F. Wright et al. 47
which facilities would remain, and how separate workforces would be combined.
Compaq failed to follow its own plans for implementing the Optimized Distribution
Model. Full conversion to build-to-order was delayed. At the same time,
Compaq’s growth objectives pushed it to overestimate sales volumes and deliver
excess levels of inventory to its channel partners in late 1997. The competition
for management attention may have limited its ability to monitor sales and
balance inventory levels. Or, the desire to meet growth objectives unduly
influenced its actions. In either case, the result was disastrous. Instead of the
targeted level of two weeks inventory in the channel, there was five to six weeks
inventory in the channel in early 1998.
Compaq was forced to take drastic action to eliminate excess inventory
before the products became obsolete. They cut prices and began aggressivemarketing campaigns. They shut down assembly lines for two weeks. While
these efforts were successful in reducing inventory, they disrupted internal
business processes, delaying new product introductions, and actually causing
some shortages. Compaq couldn’t bring out the latest Pentium II machines
without adversely affecting the value of their products in inventory, so Compaq
lost ground to companies using build-to-order production. In 1997, Compaq said
its goal was to increase inventory turnover to 30 times by the end of 1998, but
after the first six months of 1998, inventory turnover dropped to 10 times per
year.
Compaq’s customers began to worry. They worried that the merger would
reduce competition and lead to higher prices. The DEC customers wondered
whether their products would be supported or phased out. DEC had been known
for innovation in the industry, and there was substantial question whether
Compaq would continue that level of research and development. The VARs were
upset about high inventory levels, slow implementation of channel assembly
programs, and potential competition from Compaq’s new service organization
[Wilcox, 1998]. In general, customers were concerned about the effect that the
merger and its attendant changes would have on them. Compaq’s market share
dropped to 14.4% of the U.S. market, while Dell’s jumped 72% to also record

8/14/2019 Compaq Article
http://slidepdf.com/reader/full/compaq-article 48/61
Communications of AIS Volume 1, Article 8 A Balanced Scorecard Analysis of Compaq Computer Corporation by W.F. Wright et al. 48
14.4% of the market in the 2 nd quarter. Worldwide, however, Compaq remained
the clear leader [Kane, 1998].
In March 1998, Compaq announced that it would accelerate
implementation of the ODM and aggressively reduce inventories. By April 1998,
those levels were down over $300 million from 4 th quarter of 1997. By July,
channel inventory levels had dropped to 3.5 weeks [Compaq, 1998d]. The cost of
that success, however, was significant. The price reductions and production
cutbacks drove gross profit margins below 20%, down over 8% from 1997.
Compaq barely broke even in the 1 st quarter, earning only $16 million versus net
income of $414 million in the 1 st quarter of 1997. By the end of the 2 nd quarter,
Compaq’s management claimed that this setback was now behind them. Earl
Mason, Compaq’s Chief Financial Officer stated that “we are now movingaggressively to achieve targeted levels of performance and growth” [Compaq,
1998d]. Wall Street is not convinced. Analysts predicted that 3 rd quarter results
will not show much improvement, although earnings were expected to jump up to
$0.36 per share in the 4 th quarter. That would bring 1998 earnings per share to
about $.045 (excluding special charges), a far cry from the $1.17 achieved in
1997 [Jubak, 1998]. Table 3 compares Compaq’s 1998 financial results for the
first six months with those of Dell and Gateway.
Compaq’s performance model in 1998 looks much different than the
model for 1997. Figure 13 presents a Balanced Scorecard view of Compaq’s
performance in 1998. Competition for management attention and the problems
of merging two large companies seemed to disrupt performance along every
dimension. To return to the performance of 1997, the scorecard indicates that
Compaq must rebuild its infrastructure, reestablish high levels of learning and
growth, refocus its processes and make new innovations, and win back
customers.

8/14/2019 Compaq Article
http://slidepdf.com/reader/full/compaq-article 49/61
Communications of AIS Volume 1, Article 8 A Balanced Scorecard Analysis of Compaq Computer Corporation by W.F. Wright et al. 49
Table 3 Selected 1998 (6 months) Financial Measures- Major PC Manufacturers
Category COMPAQ DELL GATEWAY
Effectiveness
• Market Share (U.S.) 14.4% 14.4% 7.7%• Revenue $11.519B $8.251B $6.294B
• Units Sold 5.2 M 3.2 M 1.4 M
• Gross Margin 18.5% 22.5% 20.01%
• Net Margin < 0% 7.9% 4.1%
• Net Income -$3616M $651M $136.6M
• ROA < 0% 23.4% 12.0%
• ROE < 0% 81% 24.7%• Market to book value 235% 1267% 322%
• % Revenue – International 45% 31% 16%
Efficiency
• Operating Cycle Time na na na
• Current Ratio 1.40 1.62 1.62
• Inventory Turnover (annual
rate)
9.6 X 44.4 X 34.6 X
B = billion; M = million; na = not available.
Based on annual financial results for 6 months ending 6/30/98 for Compaq and Gateway; 8/2/98
for Dell Computer [Hoovers, 1998; Lemos, 1998; Compaq, 1998e].
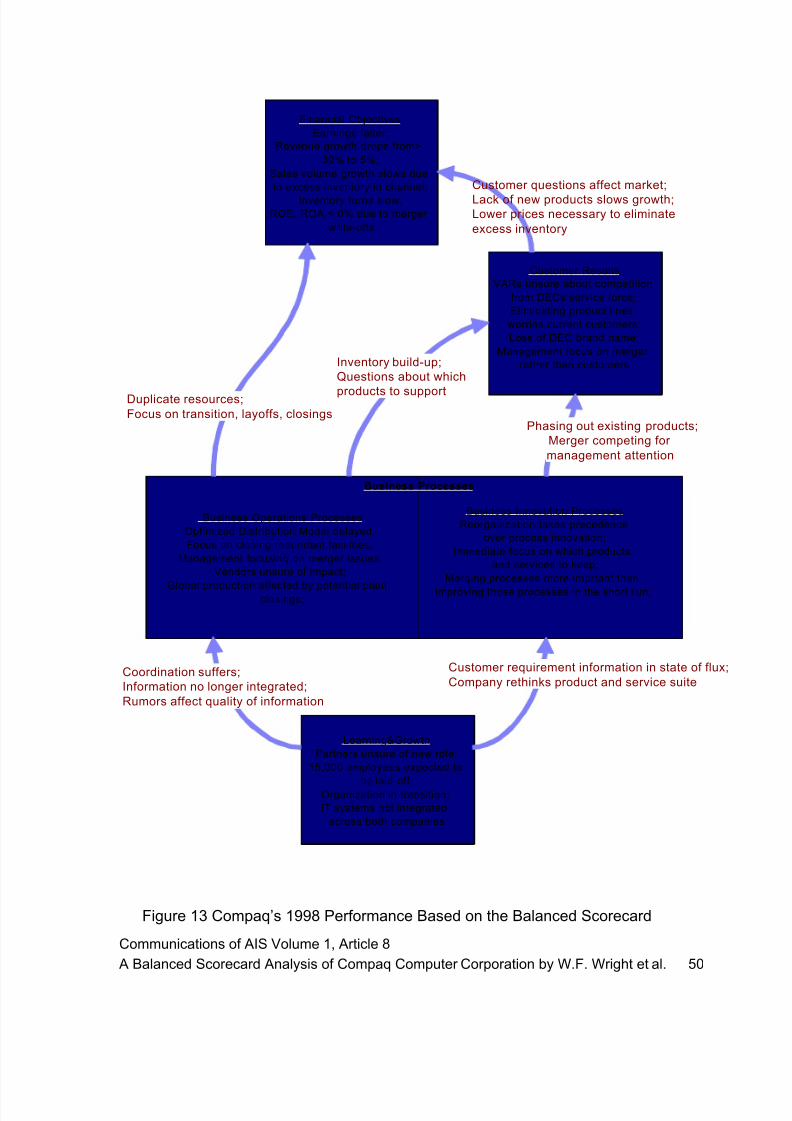
8/14/2019 Compaq Article
http://slidepdf.com/reader/full/compaq-article 50/61
Communications of AIS Volume 1, Article 8 A Balanced Scorecard Analysis of Compaq Computer Corporation by W.F. Wright et al. 50
Figure 13 Compaq’s 1998 Performance Based on the Balanced Scorecard
Business Innovation ProcessesReorganization takes precedence
over process innovation;Immediate focus on which products
and services to keep;Merging processes more imprtant than
improving those processes in the short r un;
Business Operations ProcessesOptimized Distribution Model delayed;Focus on closing redundant facilities;
Management focusing on merger issues;Vendors unsure of impact;
Global production affected by potential plantclosings;
Learning&GrowthPartners unsure of new role;
15,000 employees expected to
be laid-off;Organization in transition;IT systems not integrated
across both companies
Customer ResultsVARs unsure about competition
from DECs service force;Eliminating product lines
worries current customers;Loss of DEC brand name;
Management focus on merger rather than customers
Financial ObjectivesEarnings falter;
Revenue growth drops from>30% to 5%;
Sales volume growth slows dueto excess inventory in channel;
Inventory turns slow;ROE, ROA < 0% due to merger
write-offs
Customer requirement information in state of flux;Company rethinks product and service suite
Coordination suffers;Information no longer integrated;Rumors affect quality of information
Phasing out existing products;Merger competing for management attention
Inventory build-up;Questions about which
products to supportDuplicate resources;Focus on transition, layoffs, closings
Customer questions affect market;Lack of new products slows growth;Lower prices necessary to eliminateexcess inventory
Business Processes
8/14/2019 Compaq Article
http://slidepdf.com/reader/full/compaq-article 51/61
Communications of AIS Volume 1, Article 8 A Balanced Scorecard Analysis of Compaq Computer Corporation by W.F. Wright et al. 51
V. SUMMARY AND CONCLUSIONS
Better information drives learning and growth and enables more efficient
business processes. Better information is necessary if Compaq is to understand
and meet its customers constantly changing requirements. Compaq’s managersand employees, suppliers, and VARs need enterprise-wide access to that
information to coordinate their activities across the value chain and continuously
improve company business processes.
The causal linkage among the various Balanced Scorecard perspectives
drives the resulting financial measures and market share results. Compaq’s
improved sales volumes in 1997 resulted from delivering value, increasing
customer service, innovating new products, and reducing time-to-market. The
growing sales volume more than offset decreasing prices to generate higher
revenue. Improved cycle times and decreasing costs enabled Compaq to operate
more efficiently in 1997, which resulted in higher net income levels and higher
revenue per employee.
As Kaplan and Norton [1996, p. 24] noted, “Financial measures are
inadequate for guiding and evaluating organizations’ trajectories through
competitive environments. They are lagging indicators that fail to capture much of
the value that has been created or destroyed by managers’ actions”. Therefore,we have also emphasized leading indicators, such as pricing innovations,
strategic partnerships, and process reengineering efforts, to assess the
contribution of information technology to Compaq’s economic success.
It is not enough to excel at one aspect of business; successful companies,
like Compaq, use IT as an integral part of all aspects of their businesses to gain
and sustain a competitive advantage. Our Balanced Scorecard analysis of
Compaq indicates that, rather than a single factor, it is the well-managedcombination of factors, facilitated by access to--and prudent use--of information,
that leads to good performance. For example:
• Business strategy - a clearly defined and communicated business
strategy is important. There is a difference, however, between strategy

8/14/2019 Compaq Article
http://slidepdf.com/reader/full/compaq-article 52/61
Communications of AIS Volume 1, Article 8 A Balanced Scorecard Analysis of Compaq Computer Corporation by W.F. Wright et al. 52
formulation and strategy implementation. We noted how Compaq
formed its strategies, and how it immediately also identified the
processes that were necessary to achieve its strategic objectives. It also
used these strategies as a basis for prioritizing IT investments.
• Process efficiency - a number of firms succeeded with reengineering
or total quality management efforts. However, even Michael Hammer
admitted that less than one-third of reengineering efforts succeeds
[Slavin, 1994]. Compaq has reengineered several times in a successful
search for greater efficiency and/or effectiveness.
• Information technology - many firms implement ERP systems, as is
indicated by the impressive growth of ERP vendors such as SAP AG,
Peoplesoft, and Baan. Often firms use such comprehensive software
applications as a means to achieve reengineering, but the success of
the IT investment is then inextricably linked to the success of the
reengineering effort. If either the system implementation or the
reengineering fails--both of which are risky--firms face the large write-
offs such as Gateway reported in 1997.
• Alliances - alliances provide the leverage for firms to extend their own
resources to achieve growth and reduce costs. Compaq leveraged its
relationships with Intel and Microsoft to establish strong footholds in both the
consumer and corporate market. It worked with its resellers to leverage its
sales and support resources. In addition, as it grew, it used its size to obtain
favorable prices and to ensure availability of components. To manage these
important relationships along its value chain, Compaq used IT extensively –
the Compaq On Line Linq extranet and the Total Order Planning System aretwo prominent examples.
• Skilled and motivated workforce - it is obviously the workforce--from
the CEO down--which determines how well a firm innovates and

8/14/2019 Compaq Article
http://slidepdf.com/reader/full/compaq-article 53/61
Communications of AIS Volume 1, Article 8 A Balanced Scorecard Analysis of Compaq Computer Corporation by W.F. Wright et al. 53
operates. Compaq’s culture rewards both innovation and efficiency
[Kirkpatrick and Curry, 1996; Nee, 1998].
Thus, a synergistic combination of factors has driven Compaq’s success.
Processes create innovative products and address customer requirements.Process efficiencies allow lower product prices and improve the return on
resources applied. Of course, the better customer requirements are met, the
greater the customer satisfaction and the larger the market share. But, the
“bottom line” is a firm’s profitability. All the other actions must be taken with that
long-term financial result in mind. During the period 1992 to 1997, Compaq
focused on bottom line results, but it also understood the performance drivers of
those results. In 1998 Compaq was facing the challenge of merging two large
companies, combining their resources, and linking IT systems. The question
remains whether the new Compaq can achieve the same level of performance
along all the balanced scorecard perspectives.
During 1997, Compaq CEO Eckhard Pfeiffer announced an ambitious goal
of achieving annual revenues of $40 billion by the year 2000 from $18.1 billion in
1996 [McGarvey, 1997]. In September 1997, he revised the goal upward 25% to
$50 billion annual revenues by the year 2000 [Schwartz and Briody, 1997].
Compaq’s goal is to become one of the three largest, passing NEC and Hewlett-
Packard to challenge IBM and Fujitsu [Compaq, 1996]. To accomplish his goal,
Pfeiffer must turn Compaq into more than a PC manufacturer. The acquisition of
Digital Equipment Corporation is designed to make Compaq a full service
information technology company able to deliver complete solutions to the largest
companies [Zuckerman, 1997]. Compaq’s success, however, will be determined
by its use of information and information technology to improve its products and
processes to sustain a competitive advantage.Jim Manzi [1992], former CEO of Lotus Development, could have been
describing Compaq when he said, “the key to productivity lies not in the
computers themselves but in how they are used. "Use," in this instance, refers to
how information technology fits into the overall structure of the organization and
how it helps achieve organizational goals. The potential of information technology

8/14/2019 Compaq Article
http://slidepdf.com/reader/full/compaq-article 54/61
Communications of AIS Volume 1, Article 8 A Balanced Scorecard Analysis of Compaq Computer Corporation by W.F. Wright et al. 54
is realized only when that technology is integrated into the strategic vision of the
organization and when it is used to redefine job structures, processes and lines
of authority.”
ACKNOWLEDGEMENTS
This research was supported by grants from the U.S. National Science
Foundation, the Industry-University Cooperative Research Program, and IBM
Global Services. The authors also thank Professors Vijay Gurbaxani and Ken
Kraemer for the opportunity to conduct this research.
Editor’s Note: This paper was received on September 9, 1998 and accepted on November 4,1998. It was with the author approximately one month for revisions. The paper was publishedon February 27, 1999.
REFERENCES
NOTE: These references contain hyperlinks to World Wide Web pages. Readers who
have the ability to access the Web directly from their word processor or are reading thepaper on the Web, can gain direct access to these linked references. Readers arewarned, however, that1. these links existed as of the date of publication but are not guaranteed to be workingthereafter.2. the contents of Web pages may change over time. Where version information isprovided in the References, different versions may not contain the information or theconclusions referenced.3. the authors of the Web pages, not CAIS, are responsible for the accuracy of their content.4. the author(s) of this article, not CAIS, is (are) responsible for the accuracy of the URLand version information.
Bliss, Jeff and Jerry Rosa. (1997) “Waitt Weighs In On Channel and
Corporate Battle Plans”, Computer Reseller News , issue 757 October 6.
Brynjolfsson, Erik, and Lorin Hitt. (1997) “Information Technology and
Organizational Design: Some Evidence from Micro Data”, MIT working paper,
October
8/14/2019 Compaq Article
http://slidepdf.com/reader/full/compaq-article 55/61
Communications of AIS Volume 1, Article 8 A Balanced Scorecard Analysis of Compaq Computer Corporation by W.F. Wright et al. 55
Compaq Computer Corporation. (1996) 1995 Annual Report , Compaq
Computer Corporation, Houston, TX.
Compaq Computer Corporation. (1997a) 1996 Annual Report , Compaq
Computer Corporation, Houston, TX.
Compaq Computer Corporation. (1997b) SEC 10K Report , Compaq
Computer Corporation, Houston, TX.
Compaq Computer Corporation. (1997c) “Compaq/SAP Partnership”,
http://www.compaq.com/products/servers/partners/sap/ .
Compaq Computer Corporation. (1997d) “Compaq North American
Services Furthers Goal of Being No. 1 in Customer Satisfaction”, Compaq
Computer Corporation Press Release, June 10
Compaq Computer Corporation. (1998a) 1997 Annual Report , CompaqComputer Corporation, Houston, TX.
Compaq Computer Corporation. (1998b) SEC 10K Report , Compaq
Computer Corporation, Houston, TX.
Compaq Computer Corporation. (1998c) “Compaq CEO Pfeiffer Unveils
Company Strategy”. Compaq Computer Corporation Press Release, June 12.
Compaq Computer Corporation. (1998d) “Compaq Reports Second
Quarter Results”, Compaq Computer Corporation Press Release July 15.
Compaq Computer Corporation. (1998e) “Compaq Outpaces Industry
Growth”, Compaq Computer Corporation Press Release. July 27
Computer Intelligence. (1997) “Sales of Sub-$1000 PCs Help Compaq
Become No. 1 in Retail”, Computer Intelligence, http://www.compint.com/news/.
November 17.
Cunningham, Cara and Ed Scannell. (1997) “Compaq Executive Brass
Tout New, Three-Phase Distribution Model”, InfoWorld Electric ,July 10.
Damore, Kelley and Brian Gillooly. (1994) “Compaq Reorganizes U.S.
Operations”, Computer Reseller News , March 21.
Davenport, Thomas H. (1997) Information Ecology , Oxford University
Press, New York.

8/14/2019 Compaq Article
http://slidepdf.com/reader/full/compaq-article 56/61
Communications of AIS Volume 1, Article 8 A Balanced Scorecard Analysis of Compaq Computer Corporation by W.F. Wright et al. 56
Dell Computer Corporation. (1997) “SEC 10K Report”, Dell Computer
Corporation, Round Rock, TX.
Dell Computer Corporation. (1998) “SEC 10K Report”, Dell Computer
Corporation, Round Rock, TX.
Farre, Tom. (1996) “Compaq Pushes Beyond the PC ”, VARBusiness
Magazine , issue 1201, January 1
Farre, Tom. (1997) “Compaq Reengineers Again”, VARBusiness
Magazine , issue 1308, May 15
Frank, Diane. (1996) “Compaq Reorganizes, Senior VP Stimac Resigns”,
InfoWorld Electric, July 8. http://www.infoworld.com .
Ferguson, Kevin. (1997) “Gateway: Everything’s Not So Black And White”
Computer Retail Week , issue 183, September 22Gateway Computer Corporation. (1997) “SEC 10K Report”, Gateway
Computer Corporation, North Sioux City, SD.
Gateway Computer Corporation. (1998) “SEC 10K Report”, Gateway
Computer Corporation, North Sioux City, SD.
Gillooly, Caryn and Mary E. Thyfault. (1994) “Practicing What They
Preach”, InformationWeek, October 10. http://www.informationweek.com .
Girishankar, Saroja. (1997) “Compaq Builds Global Transaction System”,
CommunicationsWeek , August 1. http://www.communicationsweek.com .
Goldstein, Alan. (1997) “Dell Computer Founder Looks for Ways to Stay
Ahead of Pack”, Dallas Morning News, September 2.
Hammer, Michael. (1990) “Reengineering Work: Don’t Automate,
Obliterate. Harvard Business Review , Jul/Aug, 68(4), pp. 104-112.
Hammer, Michael and James Champy. (1993) “Explosive Thinking”,
Computerworld , May 3, v27, n18, pp. 123-125.
Hoovers. (1998) “Hoovers Online”, Hoovers, http://www.hoovers.com .
Infobeads. (1998) “The Sub $1000 PC Market Meets Its Match”. Computer
Intelligence, http://www.ci.infobeads.com/InfoBeads/.
Jordan, Peter. (1996) “Compaq Reengineers Itself Into Top Desktop
Vendor”, VARBusiness Magazine , issue 1217, October 15

8/14/2019 Compaq Article
http://slidepdf.com/reader/full/compaq-article 57/61
Communications of AIS Volume 1, Article 8 A Balanced Scorecard Analysis of Compaq Computer Corporation by W.F. Wright et al. 57
Jubak, Jim. (1998) “Dell vs. Compaq”, Jubak’s Journal , Microsoft
Investo r, August 25. http://investor.msn.com/prospect/articles/jubak .
Kane, Margaret. (1997) “Domination – Compaq and Dell Surge”, ZDNN
October 27. http://www.zdnet.comn/zdnn .
Kane, Margaret. (1998) “Inventory Woes Don’t Slow PC Growth”, PCWeek
Online , April 27. http://www.zdnet.com/pcweek .
Kanellos, Michael. (1997) “Compaq Tests Web Sales Waters, CNET ,
October 16. http://www.cnet.com .
Kirkpatrick, David and Sheree R. Curry. (1996) “Fast Times at Compaq”,
Fortune Magazine , April 1.
Kaplan, Robert S. and David P. Norton. (1992) “The Balanced Scorecard
– Measures That Drive Performance”, Harvard Business Review , Jan/Feb, pp.71-79.
Kaplan, Robert S., and David P. Norton. (1996) The Balanced Scorecard ,
Harvard Business School Press, Boston, MA.
Lemos, Bob. (1998) “Compaq Clear No.1 In Q2”, ZDNN , July 26.
http://www.zdnet.comn/zdnn .
Manzi, Jim. (1992) “Productivity: Faith Isn't Enough”, Computerworld May
4, v26, n18, p. 29.
Mata, F.J., W.L. Fuerst, and J.B. Barney. (1995) "Information Technology
and Sustained Competitive Advantage: A Resource-Based Analysis", MIS
Quarterly , 19, 4, December, pp. 487-505.
McGarvey, Joe. (1997) “Compaq Thinks Big”, ZDNN Interactive Week ,
July 9. http://www.zdnet.com/zdnn/content/inwk/.
McWilliams, Gary. (1996) “Compaq at the Crossroads”, Business Week ,
July 22.
Melymuka, Kathleen. (1997) “Hewlett-Packard Wins And Digital Falls To
Back Of The Pack”, VARBusiness Magazine , October 15.
Mooney, J.G., V. Gurbaxani, and K. Kraemer. (1995) “A Process Oriented
Framework for Assessing the Business Value of IT”. Proceedings of the 16 th
International Conference on Information Systems .

8/14/2019 Compaq Article
http://slidepdf.com/reader/full/compaq-article 58/61
Communications of AIS Volume 1, Article 8 A Balanced Scorecard Analysis of Compaq Computer Corporation by W.F. Wright et al. 58
Nee, Eric. (1998) “Compaq Computer Corp.”, Forbes Magazine, January
12.
NewsEdge Corporation. (1997) “Compaq Announces Record Third
Quarter Sales, Earnings, and EVA”, NewsEdge Corporation ,
http://www.newspage.com .
Planning Review. (1994) “Compaq Computer”, Bell PubliCom for the North
American Society for Corporate Planning , v22 (Jul).
Porter, Michael E. and Victor E. Millar. (1985) “How Information Gives You
Competitive Advantage”, Harvard Business Review , v63, n4 (Jul/Aug), pp. 149-
160.
Porter, Michael E. (1996) "What is Strategy?" Harvard Business Review ,
v74, n6 (Nov/Dec), pp. 61-78.Slavin, Roy H. (1994) “Re-engineering: A Productivity Paradox”, Quality
v33, n6 (Jun), p. 18.
Schwartz, Ephraim and Dan Briody. (1997) “Compaq CEO Sets Goal Of
$50 Billion In Sales, InfoWorld Electric , October 2. http://www.infoworld.com .
Waurzyniak, Patrick. (1998) “IDC Reports Healthy 14 Percent PC Growth”,
Electronic Buyer’s News , January 27.
Wilcox, Joe. (1998) “Compaq Cuts 5,000 in Facilities Consolidation”,
Computer Reseller News, June 26.
Wong, Wylie. (1997) “Dataquest, IDC Q3 Figures Put Compaq atop of PC
Sales Heap”, Computerworld Magazine Online , October 28.
http://www2/computerworld/com/home/ .
Zlotnikov, Vladim. (1997) “PC Sales Growth Remains Down”, Electronic
Buyers News , November 3.
Zuckerman, Laurence. (1997) “Compaq: We’re No. 1, but We Can
Change”, New York Times – CyberTimes, June 16, http://www.nytimes.com .
8/14/2019 Compaq Article
http://slidepdf.com/reader/full/compaq-article 59/61
Communications of AIS Volume 1, Article 8 A Balanced Scorecard Analysis of Compaq Computer Corporation by W.F. Wright et al. 59
LIST OF ACRONYMS
BSC Balanced Scorecard
BTO Build-to-order, a manufacturing strategy that builds productsonly after receipt of an order for those productsChannel Sales and distribution network, e.g., Compaq sells to
subsequently sells to end users.DEC Digital Equipment Corporation
ERP Enterprise Resource Management, describes large-scale,integrated software systems designed to manage all or alarge portion of a company’s operations and supportfunctions.
EVA Economic Value Added, a measure of profitability thatidentifies net income beyond that which provides a marketreturn to the shareholders.
IDC International Data Corporation
IT Information Technology
JIT Just-in-time, an inventory management technique whichattempts to time receipts of raw materials to make themavailable when needed for production but not earlier.
JIT –ODM Compaq’s Optimized Distribution Model program asdescribed in the Sidebar
PC Personal computer ROA Return on Assets (Net Income plus Interest Expense divided
by average total assets).ROE Return on Equity (Net Income divided by average
shareholders’ equity).SAP Systems Applications Programs, an ERP software product
of SAP AGS&P The Standard and Poor’s listing of 500 largest companies
VAR Value Added Reseller, a channel firm that takes productsfrom the original manufacturer and adds its own service or
integrates other products and then markets a morecomprehensive product to the end user.

8/14/2019 Compaq Article
http://slidepdf.com/reader/full/compaq-article 60/61
Communications of AIS Volume 1, Article 8 A Balanced Scorecard Analysis of Compaq Computer Corporation by W.F. Wright et al. 60
ABOUT THE AUTHORS
William Wright is Associate Professor in the Graduate School of Management at
the University of California at Irvine. His research is in the areas of behavioral
decision theory, financial judgments and decision making, and use of information
technology to support financial decision making. His work includes use of
knowledge-based “expert” systems, groupware (e.g., Lotus Notes) to support the
collaborative work of teams of professionals. He also studies the transforming
effects on the entire economic enterprise of implementing integrated, enterprise-
wide applications such as SAP. Professor Wright’s research has appeared in The
Accounting Review, Journal of Accounting Research, Auditing: A Journal of
Practice and Theory , and Organizational Behavior and Human DecisionProcesses.
Rodney Smith is a Ph.D. student in Accounting at the University of California,
Irvine. He is a Certified Public Accountant and a Certified Management
Accountant. He is a retired Captain in the U.S. Coast Guard with over 20 years
experience in systems analysis, design, and implementation.
Ryan Jesser and Mark Stupeck were MBA students at the Graduate School of Management, University of California, Irvine wo graduated in 1998 and are now
working in industry.
Copyright © 1999, by the Association for Information Systems . Permission to make digitalor hard copies of all or part of this work for personal or classroom use is granted without feeprovided that copies are not made or distributed for profit or commercial advantage and thatcopies bear this notice and full citation on the first page. Copyright for components of this workowned by others than the Association for Information Systems must be honored. Abstracting withcredit is permitted. To copy otherwise, to republish, to post on servers, or to redistribute to lists
requires prior specific permission and/or fee. Request permission to publish from: AIS Administrative Office, P.O. Box 2712 Atlanta, GA, 30301-2712 Attn: Reprints or via e-mail [email protected].

8/14/2019 Compaq Article
http://slidepdf.com/reader/full/compaq-article 61/61
EDITOR Paul Gray
Claremont Graduate UniversityAIS SENIOR EDITORIAL BOARDHenry C. Lucas, Jr.Editor-in-Chief New York University
Paul GrayEditor, CAISClaremont Graduate University
Phillip Ein-Dor Editor, JAISTel-Aviv University
Edward A. Stohr Editor-at-LargeNew York University
Blake IvesEditor, Electronic PublicationsLouisiana State University
Reagan Ramsower Editor, ISWorld NetBaylor University
CAIS ADVISORY BOARDGordon DavisUniversity of Minnesota
Richard MasonSouthern Methodist University
Jay Nunamaker University of Arizona
Henk SolDelft University
Ralph SpragueUniversityof Hawaii
CAIS EDITORIAL BOARDSteve Alter University of SanFrancisco
Barbara BasheinCalifornia StateUniversity
Tung BuiUniversity of Hawaii
Christer Carlsson Abo Academy, Finland
H. Michael ChungCalifornia StateUniversity
Omar El SawyUniversity of Southern California
Jane FedorowiczBentley College
Brent GallupeQueens University,Canada
Sy GoodmanUniversity of Arizona
Chris HollandManchester Business
School, UK
Jaak JurisonFordham University
George Kasper Virginia Commonwealth
UniversityJerry LuftmanStevens Institute of Technology
Munir MandviwallaTemple University
M.Lynne MarkusClaremont GraduateUniversity
Don McCubbreyUniversity of Denver
Michael MyersUniversity of Auckland,New Zealand
Seev NeumannTel Aviv University,Israel
Hung Kook ParkSangmyungUniversity, Korea
Dan Power University of NorthernIowa
Maung Sein Agder College, Norway
Margaret TanNational University of Singapore, Singapore
Doug VogelCity University of HongKong, China
Hugh WatsonUniversity of Georgia
Dick WelkeGeorgia StateUniversity
Rolf WigandSyracuse University
Phil YettonUniversity of NewSouth Wales, Australia
ADMINISTRATIVE PERSONNELEph McLeanAIS Executive Director
Colleen Bauder Subscriptions Manager
Reagan Ramsower Publisher CAIS